Embed Size (px)
Citation preview
A Network Approach to Analyzing Highly RecombinantMalaria Parasite GenesDaniel B. Larremore1,2*, Aaron Clauset3,4,5, Caroline O. Buckee1,2
1 Department of Epidemiology, Harvard School of Public Health, Boston, Massachusetts, United States of America, 2 Center for Communicable Disease Dynamics, Harvard
School of Public Health, Boston, Massachusetts, United States of America, 3 Department of Computer Science, University of Colorado, Boulder, Colorado, United States of
America, 4 BioFrontiers Institute, University of Colorado, Boulder, Colorado, United States of America, 5 Santa Fe Institute, Santa Fe, New Mexico, United States of America
Abstract
The var genes of the human malaria parasite Plasmodium falciparum present a challenge to population geneticists due totheir extreme diversity, which is generated by high rates of recombination. These genes encode a primary antigen proteincalled PfEMP1, which is expressed on the surface of infected red blood cells and elicits protective immune responses. Vargene sequences are characterized by pronounced mosaicism, precluding the use of traditional phylogenetic tools thatrequire bifurcating tree-like evolutionary relationships. We present a new method that identifies highly variable regions(HVRs), and then maps each HVR to a complex network in which each sequence is a node and two nodes are linked if theyshare an exact match of significant length. Here, networks of var genes that recombine freely are expected to have auniformly random structure, but constraints on recombination will produce network communities that we identify using astochastic block model. We validate this method on synthetic data, showing that it correctly recovers populations ofconstrained recombination, before applying it to the Duffy Binding Like-a (DBLa) domain of var genes. We find nine HVRswhose network communities map in distinctive ways to known DBLa classifications and clinical phenotypes. We show thatthe recombinational constraints of some HVRs are correlated, while others are independent. These findings suggest that thismicromodular structuring facilitates independent evolutionary trajectories of neighboring mosaic regions, allowing theparasite to retain protein function while generating enormous sequence diversity. Our approach therefore offers a rigorousmethod for analyzing evolutionary constraints in var genes, and is also flexible enough to be easily applied more generallyto any highly recombinant sequences.
Citation: Larremore DB, Clauset A, Buckee CO (2013) A Network Approach to Analyzing Highly Recombinant Malaria Parasite Genes. PLoS Comput Biol 9(10):e1003268. doi:10.1371/journal.pcbi.1003268
Editor: Rustom Antia, Emory University, United States of America
Received April 29, 2013; Accepted August 23, 2013; Published October 10, 2013
Copyright: � 2013 Larremore et al. This is an open-access article distributed under the terms of the Creative Commons Attribution License, which permitsunrestricted use, distribution, and reproduction in any medium, provided the original author and source are credited.
Funding: The project described was supported by Award Numbers R21GM100207 (DBL, AC, COB) and U54GM088558 (DBL, COB) from the National Institute OfGeneral Medical Sciences. The content is solely the responsibility of the authors and does not necessarily represent the official views of the National Institute OfGeneral Medical Sciences or the National Institutes of Health. The funder had no role in study design, data collection and analysis, decision to publish, orpreparation of the manuscript.
Competing Interests: The authors have declared that no competing interests exist.
* E-mail: [email protected]
Introduction
The human malaria parasite Plasmodium falciparum causes
approximately 1 million deaths each year, primarily in young
children in sub-Saharan Africa [1]. In endemic regions, individ-
uals develop clinical immunity to severe disease in childhood, but
continue to suffer malaria infections and mild illness throughout
their lifetimes. This epidemiological pattern is poorly understood,
but appears to be caused by the gradual acquisition of a large
repertoire of antibodies following sequential exposure to different
parasite proteins [2–5]. The main candidate for eliciting protective
antibodies is the parasite-derived antigen PfEMP1 (P. falciparum
erythrocyte membrane protein 1), encoded in each parasite
genome by a large var gene family and expressed during infection
on the surface of infected red blood cells in a process of antigenic
variation [2,6–9]. Extremely rapid recombination among var genes
generates enormous diversity and complex mosaic structures
among these sequences [10–14], and recent field studies have
uncovered seemingly limitless var gene diversity in Africa [15].
Superinfection with multiple clones is extremely common, and
recombination can occur during meiosis in the mosquito, as well as
between var genes on different chromosomes of a single parasite
during asexual reproduction [14]. However, these observations are
at odds with the rapid acquisition of antibodies to common
PfEMP1 variants that are associated with disease [16], as well as
the finding that parasites from different continents share identical
sequence blocks despite millions of years of evolutionary separa-
tion [17].
The highly recombinant structure of var genes precludes the use
of standard phylogenetic tools, and the processes generating this
paradoxical relationship between parasite genetic structure and
the epidemiology of infection and disease remain unclear
[13,18,19]. Statistically rigorous and scalable techniques to
analyze evolutionary relationships between sequences generated
through frequent recombination are lacking. Classical phyloge-
netic analyses are designed to accommodate branching tree-like
relationships between genes generated by mutation, and therefore
require that highly recombinant regions, where evolutionarily
distant sequences may share mosaics, are removed, ignored, or
assumed to be absent [20–22]. Bockhorst et al. introduced an
approach to understanding the most conserved group of var genes
based on a segmentation analysis which divides a set of sequences
PLOS Computational Biology | www.ploscompbiol.org 1 October 2013 | Volume 9 | Issue 10 | e1003268

into segments such that polymorphic sites in the same segment are
strongly correlated, while nearby polymorphic sites are either
weakly or not correlated [18,23]. While segmentation analysis is
useful to detect mutation-driven diversification following ancient
recombination or geographic separation, particularly for subsets of
more conserved var genes, it ultimately generates a tree-like
relationship between genes and does not accommodate recent and
ongoing recombination.
Networks provide a mathematical approach to representing and
studying complex relationships between genes [24], and network-
based techniques have produced valuable evolutionary insights for
many organisms ranging from viruses to eukaryotes [25]. Attempts
to introduce recombination within phylogenetic frameworks have
led to specialized techniques that produce phylogenetic (or
recombination) networks for small numbers of sequences when
recombination rates are relatively low, but these also focus on
conserved regions rather than providing insights into the
recombinant regions [26] (for a review see [27]). On the other
hand, ancestral recombination graphs have a strong theoretical
foundation but lack efficient approximations that are required for
rapid inference [28]. Networks have also been used to identify
large-scale clusters of global gene sharing and exchange [29] and
horizontal gene transfer of the plasmid resistome [30], as well as
differentiating horizontal and vertical flow of information in
[31,32]. In these approaches, all-to-all BLAST scores are
calculated and thresholded for a set of sequences, and the
resulting network is generally analyzed visually to assess large-scale
structure [22,25,29–32]. These analyses, however, rely on ad hoc
parameter choices, uncontrolled assumptions, or prior knowledge
of target clustering. And, while potentially useful for hypothesis
generation, a reliance on alignment scores contains an implicit
model for sequence mutation and substitution that is not justified
for highly recombinant var gene sequences. We have previously
taken a network approach to analyze clinical var gene domains
using short position-specific sequences [13]. Although this
approach uncovered distinctive structuring, with clustering that
reflected previous var gene classification schemes, it lacked a solid
theoretical basis and more importantly it was not generalizable to
other domains and genes.
Here we take a more sophisticated approach, applying rigorous
community detection methods that have primarily been developed
in the physics, statistics, and network science literature, to
construct and analyze recombinant gene networks in general,
and var gene networks in particular. We apply our technique to
previously published and annotated sequences of the var Duffy
Binding Like-a (DBLa) domain [18,33], which unlike other
domains is found in almost all var genes sequenced. We show that
networks constructed from different mosaic regions across the
domain vary widely in their community structure, uncovering a
new layer of micromodularity among var genes. Our results imply
a lack of coupled evolution within even a single domain. At the
same time, clear structures within networks correspond well, and
differentially, to previously published classifications that have been
linked to disease phenotypes. This structuring therefore provides a
mechanism to generate vast diversity while maintaining protein
structure and function, reconciling the paradoxical observations of
both common serological responses and almost limitless var
sequence diversity.
Methods
Plasmodium falciparum var gene dataWe analyze 307 amino acid sequences from the DBLa domain
of the var genes of seven P. falciparum isolates published in [18].
PfEMP1 antigens exhibit modular structures, characterized by
between two and nine DBL and CIDR (Cysteine-Rich Inter-
domain Region) domains [18,34–36]. While there are many
different classes of these domains, indexed by a, b, etc., the N-
terminal region of the protein almost always begins with a DBLaand CIDRa pair, each of which has been implicated in the
binding of infected red blood cells to various host receptors as well
as different disease pathologies. To highlight the diversity and
mosaicism of the DBLa domain we first apply standard
phylogenetic approaches to the 307 sequences. Sequence length
prior to alignment was widely distributed between 357 and 473
amino acids with median 420 and mode 398. Pair-wise alignments
using the standard tool MUSCLE [16,37] averaged 5.6% (or 23)
gaps. Due to the presence of highly variable regions, a multiple
alignment required an implausibly large number of gap insertions,
yielding an aligned length of 743. The remarkable diversity in
DBLa sequences is further illustrated in the unresolved nature of a
phylogenetic tree built from such an alignment (Figure S3).
General approachInstead of using alignments to identify evolutionary signals
contained in highly conserved regions, we use them to identify and
remove conserved regions in order to focus on recombinant
mosaic sequences. The method uses three steps, which we
motivate here, and define in detail in the next sections: (i) Identify
highly variable regions (HVRs) across all sequences. (ii) Compare
sequences pair-wise within each HVR, generating a distinct block-
sharing network for each region. (iii) Statistically identify
communities in each network, which will represent groups of var
genes that recombine more frequently with each other than with
genes from other communities. These general steps are illustrated
in Figure 1.
To identify HVRs, we use the basic premise of an alignment as
a starting point: highly variable regions will require gap insertions
in order to find an alignment. In contrast with other methods used
to identify regions of conservation by discarding poorly-aligned
stretches [38], our explicit goal is to find contiguous poorly-aligned
regions, since these are likely to be mosaics resulting from
recombination. After identifying HVRs, instead of constructing
trees, we generate a complex network for each HVR using an
alignment-free process, where each vertex is a sequences and two
Author Summary
The human malaria parasite kills nearly 1 million peopleeach year globally. Frequent genetic exchange betweenmalaria parasites creates enormous genetic diversity thatlargely explains the lack of an effective vaccine for thedisease. Traditional phylogenetic tools cannot accommo-date this type of diversity, however, and rigorous analyticaltools capable of making sense of gene sequences thatrecombine frequently are still lacking. Here, we usenetwork techniques that have been developed by thephysics and network science communities to analyzemalaria parasite gene sequences, allowing us to automat-ically identify highly variable mosaic regions in sequencedata and to derive the network of recombination events.We apply our method to seven fully-sequenced parasitegenomes, and show that our method provides newinsights into the complex evolutionary patterns of theparasite. Our results suggest that the structure of thesesequences allows the parasite to rapidly diversify to evadeimmune responses while maintaining antigen structureand function.
Network Approach for Recombinant Malaria Genes
PLOS Computational Biology | www.ploscompbiol.org 2 October 2013 | Volume 9 | Issue 10 | e1003268
sequences are connected if they exhibit a pattern of recombina-
tion. The structure of this network reflects the constraints and
extents of the recombination process. Since any two genes may
recombine in the absence of constraints on recombination,
deviations from a random network represent structured recombi-
nation, function, or evolution between var gene communities. To
analyze network structures, we use a community-detection
approach that can identify the patterns produced by constrained
recombination, by fitting a generative model called a degree-
corrected stochastic block model [39] to the network data. The
degree-corrected stochastic block model identifies communities by
picking out non-random patterns in the network connections
making it an appropriate choice among myriad community
detection methods. Each step is described in detail below.
Detailed approachIn the first of three steps, we take a set of amino acid sequences
and identify highly variable regions (HVRs). Starting from a
multiple alignment, each aligned position t is first assigned an
alignment score representing the fraction of input sequences that
are aligned at that position (i.e. not gap insertions). This score is
used to calculate an alignment indicator a(t) such that when all
sequences align with no gaps at position t, a(t) = 1; if there are any
gaps, a(t) = 0. We then identify regions where the sequences align
for G or more consecutive positions, that is, a(t) = 1 for G or more
consecutive t. These well aligned regions will serve as separators
between HVRs. We choose G sufficiently short, based on a simple
null model of sequences (SI1), that any highly conserved block of
significant length is removed from network construction since it
would obscure patterns of recombination. Thus, the HVRs will be
the regions in between the conserved regions that we have just
identified. However, very short HVRs will have so few amino
acids once gaps are removed in subsequent steps that they are
unlikely to reflect the mosaicism in which we are interested. So, we
define a minimum HVR size H, discarding those that are shorter.
These steps are illustrated in Figure 1A.
In the second step, we take each HVR and produce an
unweighted and undirected recombination network. Each node
represents a sequence, and each link represents a shared sequence
block, indicating a recombinant relationship between the two
sequences. Before comparing sequences, all gap insertions from
the alignment process are removed. First, we create a weighted
network in which the weight of each link is the length of the
longest substring shared between the sequences it connects
(Figure 1B). The result is an all-to-all undirected and weighted
network for each HVR. Thus, for sequences with multiple HVRs
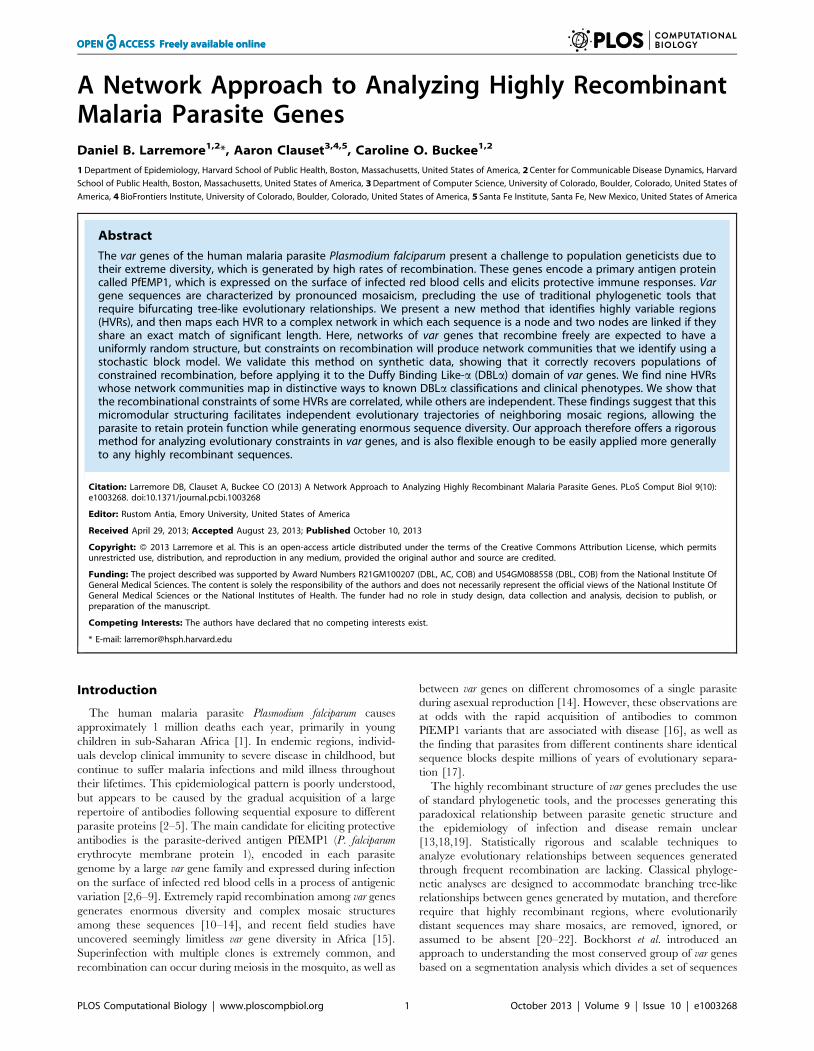
Figure 1. Pictorial overview of sequence analysis method. (A) Starting from a multiple alignment of the domain of interest, four steps aretaken to identify highly variable regions (HVRs), as described in the text. We show the HVR identification process for the 307 DBLa sequences from[18]. (B) For each HVR, a network is made in which each sequence is a node, and a link connecting two nodes corresponds to a shared sequenceblock. (C) The set of pairwise connections above the noise threshold defines a complex network representing recent recombination events. (D)Communities are inferred directly from this network using a probabilistic generative model. Steps B,C, and D are repeated for each of the HVRsidentified in step A.doi:10.1371/journal.pcbi.1003268.g001
Network Approach for Recombinant Malaria Genes
PLOS Computational Biology | www.ploscompbiol.org 3 October 2013 | Volume 9 | Issue 10 | e1003268

there will be multiple networks. Next, we convert each all-to-all
weighted network into a sparse and unweighted network by
discarding links with weight below a threshold, and removing
weights from the remaining links (Figure 1C). Here we choose the
threshold in a way that controls the number of false positive links
that may have arisen by chance, as shown in Figures 2A and 2B.
The method for computing a noise threshold is based on a null
model for randomly assembled sequences using the properties of
each HVR, and not derived from network properties. Thus,
depending on the confidence one wishes to have in the validity of
the network’s links, a threshold may be computed from a selected
tolerable error rate. Derivation of the function used for this
computation is included in Text S1.
In the third and final step, we detect recombination commu-
nities, by taking an unweighted and undirected HVR network and
applying a degree-corrected stochastic block model [39] to identify
community structures, illustrated by Figure 1D. This model takes
as its input an unweighted, undirected network and the number of
communities k for which it should find a maximum likelihood fit,
and provides as an output a list of which nodes belong to which of
the k communities, also referred to as a partition. (Derivation and
maximization of the likelihood function are discussed at length in
Ref. [39] and efficient code has been made publicly available by
Karrer and Newman.) Because previous classifications included
between three and six types, we inferred community structures for
k = 3 to k = 6. Each HVR network may have different community
structure, similar to how in a standard approach, different loci may
generate different phylogenetic trees. However, clades in trees
represent distinct branches in an evolutionary history, while HVR
network communities represent distinct clusters of ongoing
recombination. Multiple trees may be combined to produce a
consensus tree, but HVR networks show no clear consensus. We
compare our resulting network communities to previous analyses
of var gene sequence groups. Weights are removed from the
network prior to community detection for two reasons. First, it is
unclear by what principle differences in weights should be
interpreted when defining communities. Second, the problem of
correctly inferring degree-corrected stochastic block model com-
munity structure in sparse and weighted networks is currently
unsolved. For these reasons, we interpret each network link as
evidence of some recombinant or hereditary history and treat
them equally by unweighting networks prior to community
detection. We validate this approach carefully as follows.
In order to confirm that our method is able to correctly recover
recombinant communities, we validate it on synthetic data by
creating sequences with varying constraints on recombination
between predefined groups. We begin by creating amino acid
sequences at random from an empirical amino acid frequency
distribution and separating them arbitrarily into three groups.
Then, we simulate recombination events in which two parent
sequences recombine to produce a child sequence, inheriting the
group label of one of its parents. We first choose a parent
uniformly at random from the population. Then, with probability
p, the other parent is chosen from the same group and with
probability (1-p) the other parent is chosen uniformly at random.
As p is increased from zero to one, the rate of inter-group
recombination goes to zero; the communities within the networks
produced by applying our sequence analysis method to the
synthetically recombined sequences become more well defined,
and the method becomes increasingly accurate in correctly
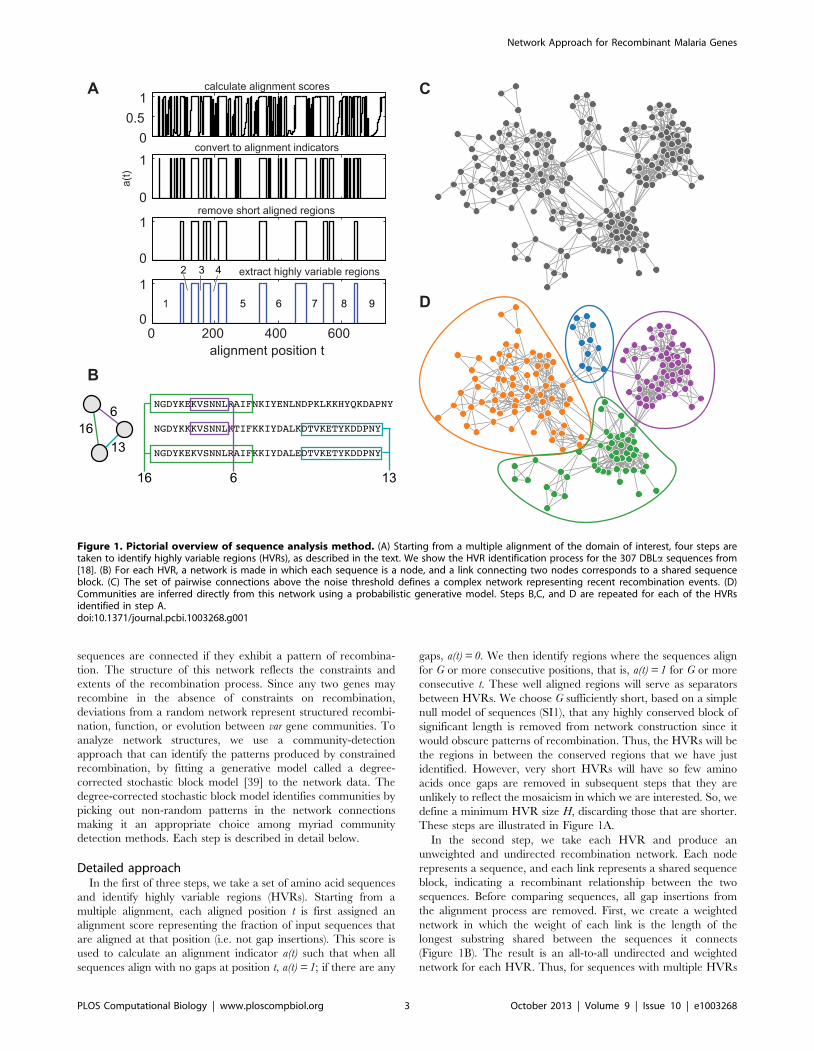
classifying nodes. As shown in Figure 3, our method is able to
recover recombinant communities perfectly in the presence of
strong constraints, and performs only slightly better than random
guessing when there are no constraints, as expected. Details of the
validation process are found in SI3.
Results/Discussion
Discordant patterns of recombination preclude aconsensus network
The characteristics and community structures of HVR networks
were diverse. Nine HVRs were found in the 307 DBLa sequences
Figure 2. Choice of link noise threshold. Choosing a noise threshold requires balance between two competing requirements for correctlyidentifying network communities: minimize the number of incorrectly placed links, yet retain as many correctly placed links as possible to satisfy thenetwork connectivity requirements of the community detection method. (A) The probability of two sequences sharing a block while not actuallybeing related decreases as block length increases, modeled in S1. Each HVR’s length and composition are taken into account separately (coloredlines). Choosing a tolerance for false positives (grey line) specifies a minimum retained block length; since blocks are of integer length, the nextlargest integer is the minimum retained block length (squares). Curves for HVRs 3 and 5 are plotted, for which we would select thresholds of five andseven, respectively. Curves for all nine HVRs are shown in Fig. S6A. (B) For a choice of threshold 6 for HVR 1, the histogram of HVR 1 block lengthsshows that a vast majority of the blocks are below the threshold (white bars) and that the retained blocks are widely distributed (green bars, inset).(C) Networks are fragmented as the block length threshold is increased and more links are discarded. The relationship between the size of the largestcomponent and block length threshold is shown for the least-connected (HVR3) and most-connected (HVR7) networks. Some thresholds allow toomany false positives, as described in panel A (grey lines), yet other thresholds fragment the network too much for reliable community detection(shaded region). Those points that are plotted in color above the shaded region are both sufficiently error-free and well connected that we mayreliably infer network communities. For HVRs 2–4, even the most permissive false positive threshold results in a network that is too fragmented forcommunity detection (red circle). Curves for all nine HVRs are shown in Figure S6B.doi:10.1371/journal.pcbi.1003268.g002
Network Approach for Recombinant Malaria Genes
PLOS Computational Biology | www.ploscompbiol.org 4 October 2013 | Volume 9 | Issue 10 | e1003268
[18], using HVR detection parameters of G = 8 and H = 6. These
parameters were chosen based on the previously described model
for false positive links (SI2), and HVR boundaries were not
dramatically affected by small changes to these parameters. The
nine HVRs found here corresponded partially to previously
identified variable regions over all DBL domains [33]. Since
HVRs are by definition highly variable, they consist of mostly gap
insertions—this diversity is highlighted by the fact that when gaps
were removed after HVRs were identified, sequences shrank by
57% on average. Noise thresholds were computed as shown in
Figure 2A such that, in expectation, 10 links (0.02%) or less are
false positives, yielding cutoff lengths of 5, 6, or 7 amino acids,
varying by HVR. Each HVR showed a wide range of sequence
lengths, and HVRs differed widely from each other in median
sequence length. HVR lengths, noise cutoffs, and the percentage
of links retained for community detection are found in Table 1.
The fraction of links above the length cutoffs varied by HVR,
shown in Figure 2B and Table 1. For HVRs 2–4, removal of links
below the cutoff fragmented the network and in such cases
community structure cannot be inferred. Figure 2C illustrates
graphically that there did not exist a threshold that both preserved
a large connected component and met our requirements for a low
false positive rate for HVRs 2–4.
Each remaining HVR network had identifiable communities,
examples of which are illustrated in Figures 4 and 5. This is
consistent with our previous network analysis [13], but provides
greater resolution and statistical certainty that these communities
represent genuine constraints on recombination. However, the
membership lists of communities derived from different HVRs
matched each other for only 38% of nodes on average. In addition
to having widely varying community structures, HVR networks
also differed from each other in component size and number of
components illustrated in Figure 4 and tabulated in Table 2.
Networks are visually illustrated in Figure 4 and the number and
size of components are given in Table 2. Regardless of the number
of communities detected, communities corresponded poorly to
each other across HVRs.
HVR networks lack consensus. Traditional phylogenetic
approaches often produce a consensus tree that reflects the most
likely evolutionary trajectory of a particular gene. However, if
patterns of recombination for two HVRs are relatively indepen-
dent of each other, we expect the communities of one HVR
network to match the communities of the other only to the extent
they match by chance. In contrast, HVR networks with similar
recombinational constraints will have common community
structures. In order to quantify the distance between community
assignments, we use the variation of information statistic [40],
which is a distance metric on partitions. A small value indicates
that two partitions are ‘‘close’’ to each other, such that the
composition of one is highly correlated with the composition of the
other. Figure 6A shows the pairwise distances between the inferred
communities for k = 3 and partitions defined by UPS and cys/
PoLV classifications, across HVRs. (Plots for all values of k are in
Figures S4 and S5B.)
In general, the communities of different HVRs were surprisingly
dissimilar, except HVRs 1 and 6, and, to a lesser extent, HVRs 1
and 5. We compared the observed distances to an estimated
distribution of pairwise distances for a null model in which we held
one partitioning constant and computed distances for 10,000
random permutations of the other, for each pair, shown as grey
symbols in Figure 6A and converted to z-scores in Figure S5B.
Two examples of the randomized distributions are shown in detail
in Figure 6B: the comparison of HVR 5 with HVR 9, and the
comparison of HVR 1 with HVR 6. While the distance between
HVRs 5 and 9 is smaller than the expected value of a random
permutation (top subplot) it is significantly closer to its expected
value than HVRs 1 and 6 (bottom subplot). We estimated
statistical uncertainty in these measurements and found that in all
cases, standard deviations were O(1022), much smaller than the
size of colored symbols plotted in Figure 6A. However, we note
that this estimate is one of many possible measures of statistical
uncertainty for network parameters, each of which is flawed in
some way, which we discuss fully in Text S4.
Although no pair of community assignments is farther apart
than expected at random, most other community assignments are
only very weakly similar to each other. The fact that individual
HVRs feature clear community structure implies that there are
evolutionary constraints on recombination; yet comparisons of
community structure between HVR networks reveal only slightly
more similarity than random, suggesting that recombinational
constraints at different positions are almost completely indepen-
dent of each other. Thus, variable selection pressures can be
accommodated even within a single DBLa domain (distances are
shown as a heatmap for all pair-wise comparisons in supplemental
Figure S4). These patterns suggest that mosaic sequences behave
as dynamic modules that can be shared among genes relatively
intact, with conserved inter-mosaic regions acting as alignment
guides in the recombination process. A key finding of this analysis,
therefore, is that the relative independence of different HVR
Figure 3. Performance on synthetic data. We validate ourmethod’s ability to detect constraints on recombination by testing iton synthetic data with known structure. Sequences were generated atrandom and divided into three communities, after which 1000recombination events were simulated, described fully in S2. For eachrecombination event, the two sequences were forced to be chosenfrom the same community with probability p or were selecteduniformly at random with probability (1-p). As the probability thatrecombination is constrained to within-community is varied from noconstraint (p = 0) to strict constraint (p = 1), the ability of our method tocorrectly classify sequences into one of three communities increasesfrom very poor to perfect. The connected line shows the mean of 25replicates, with whiskers indicating 6 one standard deviation. Twoexample networks are shown for p = 0.1 and p = 0.9. The dashed lineindicates the accuracy of guessing communities uniformly at random,which is slightly larger than 1/3 as explained in S2. Networks aredisplayed using a force-directed algorithm that allows a system ofrepelling point-charges (nodes) and linear springs (links) to relax to alow-energy two dimensional configuration, allowing for visualization ofnetwork communities.doi:10.1371/journal.pcbi.1003268.g003
Network Approach for Recombinant Malaria Genes
PLOS Computational Biology | www.ploscompbiol.org 5 October 2013 | Volume 9 | Issue 10 | e1003268

networks precludes the use of ‘‘consensus’’ approaches sometimes
used to combine trees; HVR networks were sufficiently different
that they must be analyzed independently.
Relationship between HVR communities and previousclassification systems
In the absence of tools capable of handling extremely high rates
of recombination, var genes have been variously classified by their
domain structure and gene length, sequence characteristics,
upstream promoter regions (UPS), position within the chromo-
some, and direction of transcription [25,29–32,40,41]. However,
the correspondence of these groups, which only partially overlap,
remains ambiguous. As increasing volumes of var gene sequence
data are produced from studies in the field, understanding how
best to resolve and refine these approaches will be key to
interpreting study outcomes. We compared previous classification
systems, as well as each parasite genotype, to communities within
each HVR network.
Individual parasite var repertoires reflect population-level
diversity. Examining the sequences of individual parasites, we
found that each of the seven parasites’ var sequences are evenly
spread through the clusters of the network, rather than forming
genome-specific communities (Figure S1), consistent with previous
studies [10]. Regardless of how many communities k we choose,
each parasite had at least one sequence in each recovered
community, showing that a single parasite is not confined to an
identifiable genotypic community but instead has samples of all
major communities that we identified. This corroborates previous
research showing that var genotypic diversity within a single
parasite is as high as the diversity of the parasite population [20].
This pattern is also consistent with theoretical work has shown that
selective pressure on the var genes should create parasites with as
wide a variety of genotypes as possible for immune evasion, while
still preserving enough structure for adhesion and sequestration
[42]. Thus, each P. falciparum genome contains an antigenic
repertoire that is effectively sampled from the diversity of the
global pool of var genes.
While HVR networks tend to differ from each other, their
communities correspond to known upstream promoter sequence
(UPS) groupings and var gene length. Upstream promoter
sequences were previously categorized as UPS A to UPS E or
Not Determined (ND) [18]. DBLa with UPS D were not present
in the 307 sequences examined. The inferred communities in
HVRs 1 and 6–8 place nearly all UPS A sequences together,
plotted in Figure 7A. The remaining communities comprise a mix
of UPS B, C, and ND sequences. This implies that recombinant
mixing of UPS A with B or C is comparatively rare, leading to the
hypothesis that three ND sequences could be classified as UPSA:
IT4var24, PF07_0048, and IT4var51. Furthermore, we found no
evidence for a strong separation of var genes into distinct groups
for UPS B and C. Although UPS C genes are all found proximate
to the centromeres of P. falciparum genomes, recombination
appears to occur frequently between centromeric and subtelomeric
UPS B genes, consistent with studies of chromosomal positioning
during ectopic recombination [14,43], but not yet observed in vitro
[44].
Using the variation of information distance measure [40],
Figure 6A shows that the community structures of HVR 1 and
UPS communities are particularly close. This is reinforced by a
measurement of assortative mixing by label [45], shown in
Figure 6C, a measure of correlation among node labels that takes
into account the connections of the network and may be computed
without any community assignments. In particular, this reflects the
fact that in HVR 1, many UPS A nodes tend to link almost
exclusively to other UPS A nodes. Plots of all HVR networks
colored by UPS group are found in Figure S2. We also found
positive assortative mixing by var gene length (including all NTS,
DBL, CIDR, and ATS domains) implying that genes of the similar
length tend to link to each other, consistent with dynamical models
of var gene evolution [42] (Figure 6C). Thus, both UPS group and
gene length may play roles in constraining recombination,
suggesting that future models of evolution and recombination
must reproduce these results.
We confirmed and extended the Cys2/Cys4 and PoLV
classification schemes which previously identified and analyzed
patterns within the DBLa domain [10,46,47]. In an alignment-free
study of short tagged sequences corresponding to HVRs 5 and 6
from Kilifi, Kenya, it was found that sequences may be classified
based on the number of cysteine residues present in HVR 6, and
that more severe disease phenotypes were correlated with the
presence of only two cysteines [10,46]. These sequences are
referred to as ‘‘cys2’’ sequences, and others, most of which have
four cysteines, are referred to as ‘‘cysX.’’ The cys2/cysX
classifications can be further classified according to a set of
mutually exclusive sequences motifs called positions of limited
variability (PoLV), splitting cys2/cysX categories into six cys/
PoLV groups [10,47]. Since the HVR network approach creates
links based on shared block structure, it captures cys2/cysX and
cys/PoLV categorizations. Unsurprisingly, this is reflected most
strongly in HVR6 (Figures 6A and 6C), but is also present in
HVR1 whose nodes are strongly assortatively mixed by cys/PoLV
group (Figure 6C), corroborating the result that HVRs 1 and 6 are
structurally similar. There exists one community in HVRs 1, 6,
and 5 that contains most of the cys2 sequences (Figure 7B). The
correspondence of network structures with previous phenotype-
associated sequences also suggests that the HVR network
approach may be extended to map genotypic patterns to clinical
phenotypes when applied to an appropriate data set that includes
expression data and clinical information.
The DBLa domains we use here were previously analyzed and
categorized extensively using tree-based methods, revealing many
new subclassifications of the previously identified DBLa0 and
DBLa1 [41,43] as well as a new classification, DBLa2 [18]. We
examined HVR networks for evidence of strong associations
Table 1. Summary statistics for DBLa HVRs.
HVR 1 2 3 4 5 6 7 8 9
Med. length (min-max) 28 (22–48) 11 (8–17) 6 (4–9) 12 (6–15) 42 (30–57) 29 (25–47) 37 (16–40) 35 (21–49) 39 (8–76)
Length incl. gaps 88 27 17 28 106 91 54 68 92
Noise cutoff 6 6 5 5 7 6 6 7 6
% significant links 6.0 3.1 1.5 2.6 5.8 6.9 24.9 8.4 16.1
doi:10.1371/journal.pcbi.1003268.t001
Network Approach for Recombinant Malaria Genes
PLOS Computational Biology | www.ploscompbiol.org 6 October 2013 | Volume 9 | Issue 10 | e1003268

between network community structure and subclassifications, but
found that only DBLa1.3 sequences had a strong tendency to link
to other sequences from the same subclassification, particularly in
HVRs 7, 8, and 9, where they formed cliques on the periphery of
the networks. While the sequence differences of the DBLa1.3
subclass have already been noted [18], we also find that the DBLa0.3
subclass tended to link to each other in HVRs 1 and 8, though not in
a clique. No strong correlations were found between network
structures and the broader classes of DBLa0, DBLa1, and DBLa2,
and networks were not strongly assortative by DBLa class, as shown
in Figure 6C. This is perhaps unsurprising, given the different focus
of our method, but it highlights the fact that any classification of
recombinant genes that is based on a tree-like phylogeny may not be
informative about the process of recombination.
Var gene micromodularity facilitates diversity generationwithout loss of function
Our approach highlights and analyzes the within-domain
modularity of DBLa. Var genes are by definition modular, with
Figure 4. Nine HVR networks colored by inferred communities. DBLa HVR networks show a wide range of characteristics, includingcommunity size, number of components, and number of links. Nodes in each HVR are colored according to the best three-community partitionidentified by the inference algorithm (see text). (Identical networks colored by upstream promotor are found in Figure S2.) HVRs 2–4 are sufficientlyfragmented that block model inference cannot be trusted. An interactive version of this figure with varying communities and node labels may befound at http://danlarremore.com/var. Networks are displayed using a force-directed algorithm that allows a system of repelling point-charges(nodes) and linear springs (links) to relax to a low-energy two dimensional configuration, allowing for visualization of network communities.doi:10.1371/journal.pcbi.1003268.g004
Network Approach for Recombinant Malaria Genes
PLOS Computational Biology | www.ploscompbiol.org 7 October 2013 | Volume 9 | Issue 10 | e1003268
variable numbers and types of DBL and CIDR domains clustered
into larger groups that primarily correspond to UPS A and UPS B
or C. We have shown that in addition to modular domains that
can be shuffled between loci, there are also relatively regularly
spaced modular mosaics within the DBLa domain that are
shuffled, under constraints, between var genes. Previous studies
have suggested that the conserved blocks in DBL domains may
provide structural support for the protein while the variable
regions in between are loops in the protein designed specifically for
antigenic variation under diversifying selection [17,33]. Here we
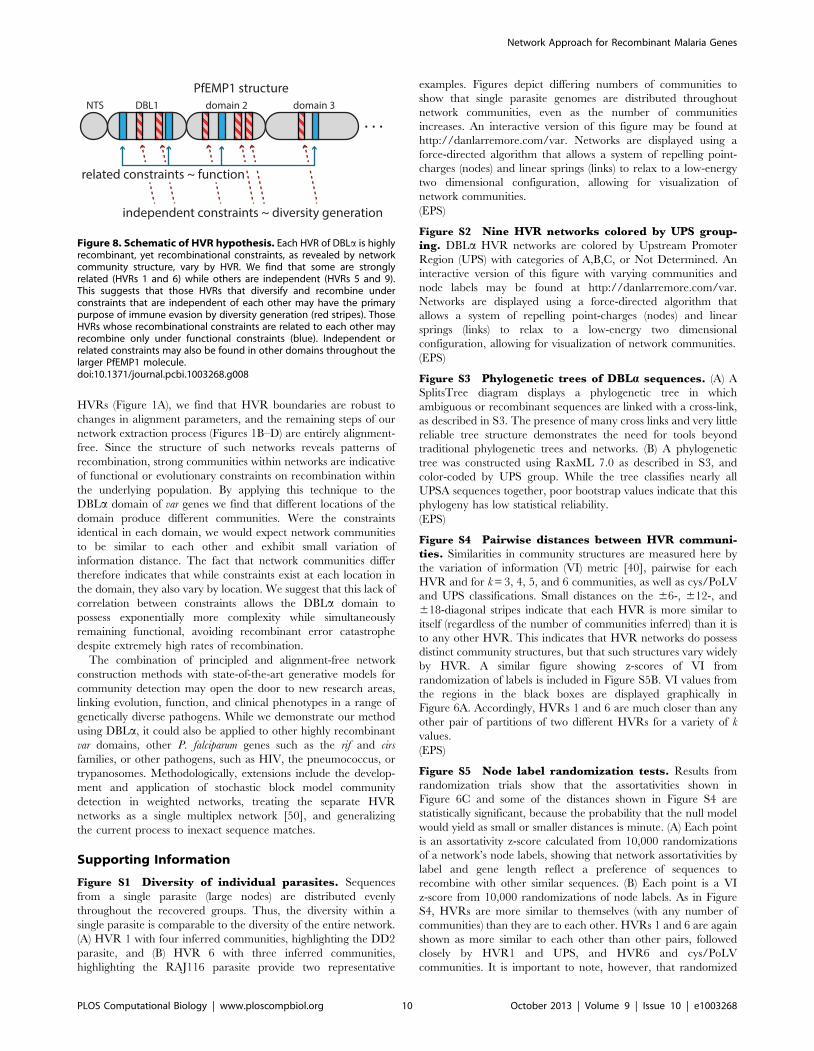
offer a more nuanced hypothesis, shown schematically in Figure 8:
HVRs under related recombinational constraints may have
important functional roles in the PfEMP1 molecule, while other
HVRs may exist primarily for purposes of antigenic variation.
We find that HVRs 1, 6, and to a lesser extent 5, have similar
non-random network community structure that corresponds
strongly with structural amino acid residues and classification
systems with known associations with severe disease [47]. These
regions of the domain may therefore be functionally constrained
and play a specific role in binding. Interestingly, HVRs 5 and 6
correspond to the short tag sequences that have previously been
amplified from field isolates. If our hypothesis is correct, it would
explain why the clustering of these sequence tags exhibit
meaningful associations with disease outcome [46,48]. The
remaining HVRs 7–9, have highly heterogeneous community
structures that bear almost no relation to each other, suggesting
that their primary role is in the generation of diversity for the
purpose of immune evasion.
Having both correlated and uncorrelated recombinational
constraints across multiple HVRs thus provides at least two
important evolutionary benefits to the parasite: i) individual
mosaics that are functionally important can retain their function
without compromising the generation of diversity across the rest of
the domain, and ii) recombination could produce variants through
different combinations of modules more rapidly than mutation or
random recombination, and without risking the recombinational
equivalent of error catastrophe that occurs in systems with very
high mutation rates [49]. In other words, the parasite population
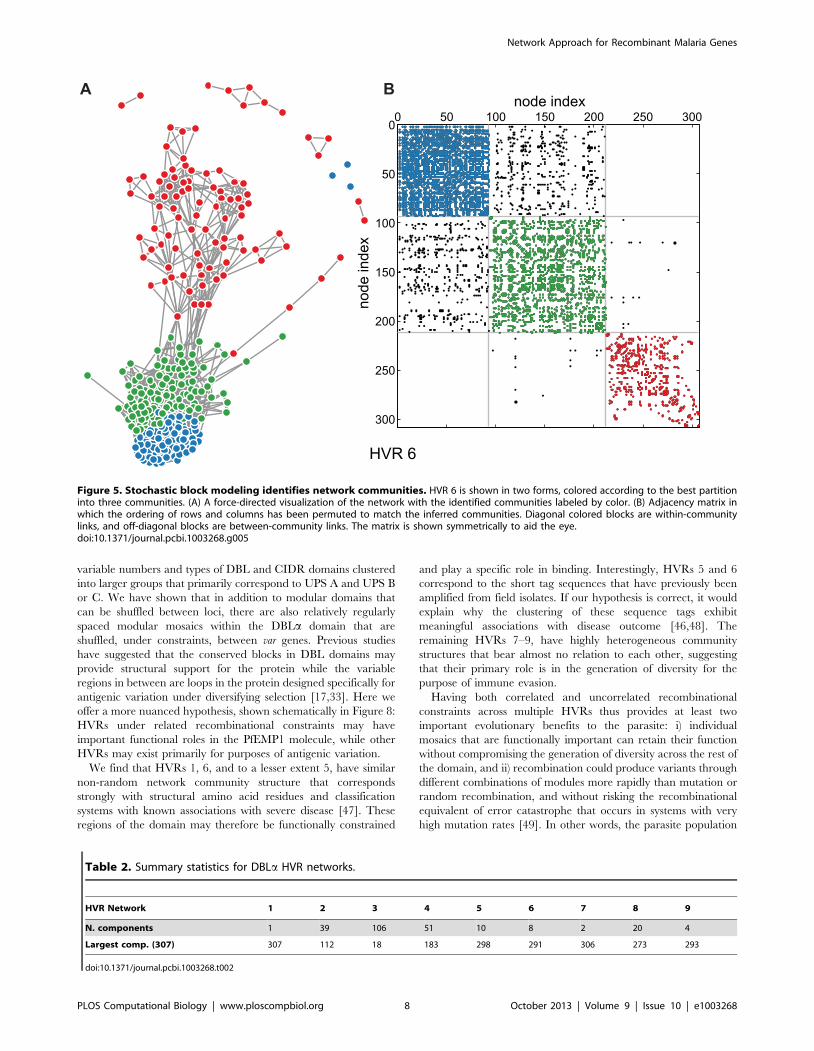
Figure 5. Stochastic block modeling identifies network communities. HVR 6 is shown in two forms, colored according to the best partitioninto three communities. (A) A force-directed visualization of the network with the identified communities labeled by color. (B) Adjacency matrix inwhich the ordering of rows and columns has been permuted to match the inferred communities. Diagonal colored blocks are within-communitylinks, and off-diagonal blocks are between-community links. The matrix is shown symmetrically to aid the eye.doi:10.1371/journal.pcbi.1003268.g005
Table 2. Summary statistics for DBLa HVR networks.
HVR Network 1 2 3 4 5 6 7 8 9
N. components 1 39 106 51 10 8 2 20 4
Largest comp. (307) 307 112 18 183 298 291 306 273 293
doi:10.1371/journal.pcbi.1003268.t002
Network Approach for Recombinant Malaria Genes
PLOS Computational Biology | www.ploscompbiol.org 8 October 2013 | Volume 9 | Issue 10 | e1003268

may be rapidly shuffling ancient sequence mosaics into new
combinations across some HVRs, while also preventing the
degeneration of structurally important regions of the protein that
are involved in binding. The population of genes may thereby
balance a need for new diversity with functional requirements.
The varying correspondence of HVR communities with
previously defined var gene groupings implies that the different
classification schemes complement each other, providing insights
into different aspects of var gene evolution, likely representing
nested or hierarchical recombinant clusters. We measure the
extent to which previously defined groupings are reflected in the
links of our networks using assortativity, shown in Figure 6C.
Importantly, the DBLa group assortativity is much lower than all
the others, demonstrating further that while there are clear
structures in HVR networks, they are not the same as the
classifications based on trees. Such tree-based classifications
explain the development of large-scale structure over the relatively
longer timescales of mutation, whereas communities detected
within recombination networks here shed light on functional or
even mechanistic constraints on recombination occurring more
recently.
ConclusionsThe method presented here can accurately extract block-
sharing networks from the most highly recombinant regions of
protein sequences. While a multiple-alignment is used to identify
Figure 6. Community structures vary across HVRs. (A) Variation of information (VI) measures the distance between two different partitions onthe same set of nodes (two different sets of community assignments). For a given HVR we compute pairwise VI distances to recovered communitiesof other HVRs (colored symbols), cys/PoLV (+), UPS classifications (x), and to those in a null model (grey open symbols). Uncertainty in VImeasurements is discussed in detail in Text S4. (B) HVRs 1 and 6 are close to each other, indicating that their communities strongly match each other.Histograms show the distributions of VI distances for one partition and 10,000 randomizations of the other. Top, the measured distance betweenHVRs 5 and 9 falls within the distribution of randomizations, indicated by the arrow. Bottom, the measured distance between HVRs 1 and 6 falls welloutside the distribution of randomizations, indicated by the left arrow. For contrast, the silhouette of the top histogram is reproduced. (C) Most HVRsshow moderate but positive levels of assortativity [45], the tendency for nodes with similar labels or values to be connected. Assortativity varies byHVR and by label (symbols). For all cases except DBLa classification (DBLa0, DBLa1, DBLa2), assortativity was significantly higher than expected bychance. Solid lines with whiskers show mean assortativity 6 one standard deviation for 10,000 randomizations of labels. Z-scores may be found inFigure S5A.doi:10.1371/journal.pcbi.1003268.g006
1 5 6 7 8 90
20
40
60
80
100
120
140
160
180
Figure 7. Correspondence of network communities to existing classifications. Bars show the UPS group (A) and cys/PoLV group (B)composition of each of the three recovered communities. HVRs 1 and 6–8 show one community each in which a vast majority of UPS A sequences arefound. HVR 6 shows one community in which a vast majority of group 1, 2, and 3 sequences are found, which are all characterized by having only twocysteines in HVRs 5 and 6.doi:10.1371/journal.pcbi.1003268.g007
Network Approach for Recombinant Malaria Genes
PLOS Computational Biology | www.ploscompbiol.org 9 October 2013 | Volume 9 | Issue 10 | e1003268
HVRs (Figure 1A), we find that HVR boundaries are robust to
changes in alignment parameters, and the remaining steps of our
network extraction process (Figures 1B–D) are entirely alignment-
free. Since the structure of such networks reveals patterns of
recombination, strong communities within networks are indicative
of functional or evolutionary constraints on recombination within
the underlying population. By applying this technique to the
DBLa domain of var genes we find that different locations of the
domain produce different communities. Were the constraints
identical in each domain, we would expect network communities
to be similar to each other and exhibit small variation of
information distance. The fact that network communities differ
therefore indicates that while constraints exist at each location in
the domain, they also vary by location. We suggest that this lack of
correlation between constraints allows the DBLa domain to
possess exponentially more complexity while simultaneously
remaining functional, avoiding recombinant error catastrophe
despite extremely high rates of recombination.
The combination of principled and alignment-free network
construction methods with state-of-the-art generative models for
community detection may open the door to new research areas,
linking evolution, function, and clinical phenotypes in a range of
genetically diverse pathogens. While we demonstrate our method
using DBLa, it could also be applied to other highly recombinant
var domains, other P. falciparum genes such as the rif and cirs
families, or other pathogens, such as HIV, the pneumococcus, or
trypanosomes. Methodologically, extensions include the develop-
ment and application of stochastic block model community
detection in weighted networks, treating the separate HVR
networks as a single multiplex network [50], and generalizing
the current process to inexact sequence matches.
Supporting Information
Figure S1 Diversity of individual parasites. Sequences
from a single parasite (large nodes) are distributed evenly
throughout the recovered groups. Thus, the diversity within a
single parasite is comparable to the diversity of the entire network.
(A) HVR 1 with four inferred communities, highlighting the DD2
parasite, and (B) HVR 6 with three inferred communities,
highlighting the RAJ116 parasite provide two representative
examples. Figures depict differing numbers of communities to
show that single parasite genomes are distributed throughout
network communities, even as the number of communities
increases. An interactive version of this figure may be found at
http://danlarremore.com/var. Networks are displayed using a
force-directed algorithm that allows a system of repelling point-
charges (nodes) and linear springs (links) to relax to a low-energy
two dimensional configuration, allowing for visualization of
network communities.
(EPS)
Figure S2 Nine HVR networks colored by UPS group-ing. DBLa HVR networks are colored by Upstream Promoter
Region (UPS) with categories of A,B,C, or Not Determined. An
interactive version of this figure with varying communities and
node labels may be found at http://danlarremore.com/var.
Networks are displayed using a force-directed algorithm that
allows a system of repelling point-charges (nodes) and linear
springs (links) to relax to a low-energy two dimensional
configuration, allowing for visualization of network communities.
(EPS)
Figure S3 Phylogenetic trees of DBLa sequences. (A) A
SplitsTree diagram displays a phylogenetic tree in which
ambiguous or recombinant sequences are linked with a cross-link,
as described in S3. The presence of many cross links and very little
reliable tree structure demonstrates the need for tools beyond
traditional phylogenetic trees and networks. (B) A phylogenetic
tree was constructed using RaxML 7.0 as described in S3, and
color-coded by UPS group. While the tree classifies nearly all
UPSA sequences together, poor bootstrap values indicate that this
phylogeny has low statistical reliability.
(EPS)
Figure S4 Pairwise distances between HVR communi-ties. Similarities in community structures are measured here by
the variation of information (VI) metric [40], pairwise for each
HVR and for k = 3, 4, 5, and 6 communities, as well as cys/PoLV
and UPS classifications. Small distances on the 66-, 612-, and
618-diagonal stripes indicate that each HVR is more similar to
itself (regardless of the number of communities inferred) than it is
to any other HVR. This indicates that HVR networks do possess
distinct community structures, but that such structures vary widely
by HVR. A similar figure showing z-scores of VI from
randomization of labels is included in Figure S5B. VI values from
the regions in the black boxes are displayed graphically in
Figure 6A. Accordingly, HVRs 1 and 6 are much closer than any
other pair of partitions of two different HVRs for a variety of k
values.
(EPS)
Figure S5 Node label randomization tests. Results from
randomization trials show that the assortativities shown in
Figure 6C and some of the distances shown in Figure S4 are
statistically significant, because the probability that the null model
would yield as small or smaller distances is minute. (A) Each point
is an assortativity z-score calculated from 10,000 randomizations
of a network’s node labels, showing that network assortativities by
label and gene length reflect a preference of sequences to
recombine with other similar sequences. (B) Each point is a VI
z-score from 10,000 randomizations of node labels. As in Figure
S4, HVRs are more similar to themselves (with any number of
communities) than they are to each other. HVRs 1 and 6 are again
shown as more similar to each other than other pairs, followed
closely by HVR1 and UPS, and HVR6 and cys/PoLV
communities. It is important to note, however, that randomized
Figure 8. Schematic of HVR hypothesis. Each HVR of DBLa is highlyrecombinant, yet recombinational constraints, as revealed by networkcommunity structure, vary by HVR. We find that some are stronglyrelated (HVRs 1 and 6) while others are independent (HVRs 5 and 9).This suggests that those HVRs that diversify and recombine underconstraints that are independent of each other may have the primarypurpose of immune evasion by diversity generation (red stripes). ThoseHVRs whose recombinational constraints are related to each other mayrecombine only under functional constraints (blue). Independent orrelated constraints may also be found in other domains throughout thelarger PfEMP1 molecule.doi:10.1371/journal.pcbi.1003268.g008
Network Approach for Recombinant Malaria Genes
PLOS Computational Biology | www.ploscompbiol.org 10 October 2013 | Volume 9 | Issue 10 | e1003268

variation of information distances are not normally distributed,
and so these z-scores should not be interpreted as such.
(EPS)
Figure S6 Choice of link noise threshold (Figure 2 withall HVRs shown). While Figures 2A and 2C illustrate the
method by which link noise threshold is selected, we excluded
other HVRs to provide a more legible and understandable figure.
Here we show all nine HVRs. (A) The probability of two sequences
sharing a block while not actually being related decreases rapidly
for all HVRs. We exclude all block lengths falling above a noise
threshold (grey region) and choose the next largest block length as
the appropriate minimum block length (squares). (B) HVR
networks fragment as block length threshold is increased and more
links are discarded. Grey points indicate cases that are prohibited
due to the cutoff shown in Figure S6A, while colored points are
permissible. However, points in the grey shaded region are
prohibited due to fragmentation of the network. This precludes
analysis of HVRs 2–4, for which no suitable threshold exists that is
both low-noise and unfragmented, indicated by red circles.
(EPS)
Text S1 Null model for sharing of protein sequencesubstrings. A detailed description of the approximation of the
rates at which sequences share substrings of varying lengths purely
by chance.
(PDF)
Text S2 Validation on synthetic data. A detailed descrip-
tion of the procedures used to generate and analyze synthetic data
for the purposes of validation.
(PDF)
Text S3 Detailed description of phylogenetic analysesand software.
(PDF)
Text S4 Uncertainty in measurements of variation ofinformation from inferred partitions. A detailed discussion
of the current state of the literature in assessing the uncertainty in
community detection methods, variation of information, and other
network statistics.
(DOCX)
Acknowledgments
We thank Nicholas J. Croucher for assistance in making phylogenetic trees,
and Peter C. Bull and Mario Recker for helpful discussions.
Author Contributions
Conceived and designed the experiments: DBL AC COB. Performed the
experiments: DBL. Analyzed the data: DBL COB. Wrote the paper: DBL
AC COB. Designed the software used in analysis: DBL.
References
1. World Malaria Report (2012) World Malaria Report. World Health Organi-
zation: 1–33.
2. Bull PC, Lowe BS, Kortok M, Molyneux CS, Newbold CI, et al. (1998) Parasite
antigens on the infected red cell surface are targets for naturally acquired
immunity to malaria. Nature medicine 4: 358–360.
3. Bull PC, Marsh K (2002) The role of antibodies to Plasmodium falciparum-
infected-erythrocyte surface antigens in naturally acquired immunity to malaria.
Trends in Microbiology 10: 55–58.
4. Dodoo D, Staalsoe T, Giha H, Kurtzhals JA, Akanmori BD, et al. (2001)
Antibodies to variant antigens on the surfaces of infected erythrocytes are
associated with protection from malaria in Ghanaian children. Infection and
Immunity 69: 3713–3718. doi:10.1128/IAI.69.6.3713–3718.2001.
5. Giha HA, Staalsoe T, Dodoo D, Roper C, Satti GM, et al. (2000) Antibodies to
variable Plasmodium falciparum-infected erythrocyte surface antigens are
associated with protection from novel malaria infections. Immunology letters
71: 117–126.
6. Newbold CI, Pinches R, Roberts DJ, Marsh K (1992) Plasmodium falciparum:
The human agglutinating antibody response to the infected red cell surface is
predominantly variant specific. Experimental parasitology 75: 281–292.
7. Chan J-A, Howell KB, Reiling L, Ataide R, Mackintosh CL, et al. (2012)
Targets of antibodies against Plasmodium falciparum–infected erythrocytes
in malaria immunity. J Clin Invest 122: 3227–3238. doi:10.1172/
JCI62182DS1.
8. Bull PC, Lowe BS, Kortok M, Marsh K (1999) Antibody recognition of
Plasmodium falciparum erythrocyte surface antigens in Kenya: evidence for rare
and prevalent variants. Infection and Immunity 67: 733–739.
9. Kyes S, Horrocks P, Newbold C (2001) Antigenic variation at the infected red
cell surface in malaria. Annual Reviews in Microbiology 55: 673–707.
10. Bull PC, Berriman M, Kyes S, Quail MA, Hall N, et al. (2005) Plasmodium
falciparum Variant Surface Antigen Expression Patterns during Malaria. PLoS
Pathog 1: e26. doi:10.1371/journal.ppat.0010026.st003.
11. Frank M, Kirkman L, Costantini D, Sanyal S, Lavazec C, et al. (2008) Frequent
recombination events generate diversity within the multi-copy variant antigen
gene families of Plasmodium falciparum. International Journal for Parasitology
38: 1099–1109. doi:10.1016/j.ijpara.2008.01.010.
12. Atkinson HJ, Morris JH, Ferrin TE, Babbitt PC (2009) Using Sequence
Similarity Networks for Visualization of Relationships Across Diverse Protein
Superfamilies. PLoS ONE 4: e4345. doi:10.1371/journal.pone.0004345.t002.
13. Bull PC, Buckee CO, Kyes S, Kortok MM, Thathy V, et al. (2008) Plasmodium
falciparumantigenic variation. Mapping mosaic vargene sequences onto a
network of shared, highly polymorphic sequence blocks. Molecular Microbiol-
ogy 68: 1519–1534. doi:10.1111/j.1365-2958.2008.06248.x.
14. Freitas-Junior LH, Bottius E, Pirrit LA, Deitsch KW, Scheidig C, et al. (2000)
Frequent ectopic recombination of virulence factor genes in telomeric
chromosome clusters of P. falciparum. Nature 407: 1018–1022. doi:10.1038/
35039531.
15. Barry AE, Leliwa-Sytek A, Tavul L, Imrie H, Migot-Nabias F, et al. (2007)Population Genomics of the Immune Evasion (var) Genes of Plasmodium
falciparum. PLoS Pathog 3: e34. doi:10.1371/journal.ppat.0030034.st002.
16. Gupta S, Snow RW, Donnelly CA, Marsh K, Newbold C (1999) Immunity to
non-cerebral severe malaria is acquired after one or two infections. Naturemedicine 5: 340–343.
17. Bockhorst J, Lu F, Janes JH, Keebler J, Gamain B, et al. (2007) Structural
polymorphism and diversifying selection on the pregnancy malaria vaccine
candidate VAR2CSA. Molecular and Biochemical Parasitology 155: 103–112.doi:10.1016/j.molbiopara.2007.06.007.
18. Rask TS, Hansen DA, Theander TG, Gorm Pedersen A, Lavstsen T (2010)Plasmodium falciparum Erythrocyte Membrane Protein 1 Diversity in Seven
Genomes – Divide and Conquer. PLoS Comput Biol 6: e1000933. Available:http://dx.plos.org/10.1371/journal.pcbi.1000933.
19. Kraemer SM, Smith JD (2006) A family affair: var genes, PfEMP1 binding, andmalaria disease. Current Opinion in Microbiology 9: 374–380. doi:10.1016/
j.mib.2006.06.006.
20. Trimnell AR, Kraemer SM, Mukherjee S, Phippard DJ, Janes JH, et al. (2006)
Global genetic diversity and evolution of var genes associated with placental andsevere childhood malariaq. Molecular and Biochemical Parasitology 148: 169–
180. doi:10.1016/j.molbiopara.2006.03.012.
21. Awadalla P (2003) The evolutionary genomics of pathogen recombination. Nat
Rev Genet 4: 50–60. doi:10.1038/nrg964.
22. Apeltsin L, Morris JH, Babbitt P.C., Ferrin TE (2011) Improving the quality of
protein similarity network clustering algorithms using the network edge weightdistribution. Bioinformatics 27: 326–333.
23. Bockhorst J, Jojic N (2007) Discovering Patterns in Biological Sequences by
Optimal Segmentation. In: Proceedings of the 23rd International Conference on
Uncertainty in Artificial Intelligence; July 19–22, 2007; Vancouver, Canada.Available: http://uai.sis.pitt.edu/displayArticleDetails.jsp?mmnu = 2&smnu
= 2&article_id = 1669&author_id = 1517.
24. Newman M (2010) Networks: an introduction. New York: Oxford University
Press.
25. Alvarez-Ponce D, Lopez P, Bapteste E, McInerney JO (2013) Gene similarity
networks provide tools for understanding eukaryote origins and evolution.Proceedings of the National Academy of Sciences 110 (17): E1594–E1603.
26. Kosakovsky Pond SL (2006) Automated Phylogenetic Detection of Recombi-
nation Using a Genetic Algorithm. Molecular Biology and Evolution 23: 1891–
1901. doi:10.1093/molbev/msl051.
27. Huson DH, Scornavacca C (2011) A Survey of Combinatorial Methods for
Phylogenetic Networks. Genome Biology and Evolution 3: 23–35. doi:10.1093/gbe/evq077.
28. Song YS, Hein J (2005) Constructing minimal ancestral recombination graphs.
Journal of Computational Biology 12: 147–169.
29. Halary S, Leigh JW, Cheaib B, Lopez P, Bapteste E (2010) Network analyses
structure genetic diversity in independent genetic worlds. Proceedings of theNational Academy of Sciences 107: 127–132. doi:10.1073/pnas.0908978107.
Network Approach for Recombinant Malaria Genes
PLOS Computational Biology | www.ploscompbiol.org 11 October 2013 | Volume 9 | Issue 10 | e1003268

30. Fondi M, Fani R (2010) The horizontal flow of the plasmid resistome: clues from
inter-generic similarity networks. Environmental Microbiology 12: 3228–3242.doi:10.1111/j.1462-2920.2010.02295.x.
31. Dagan T, Artzy-Randrup Y, Martin W (2008) Modular networks and
cumulative impact of lateral transfer in prokaryote genome evolution.Proceedings of the National Academy of Sciences 105: 10039–10044.
32. Bapteste E, Lopez P, Bouchard F, Baquero F, McInerney JO, et al. (2012)Evolutionary analyses of non-genealogical bonds produced by introgressive
descent. Proceedings of the National Academy of Sciences 109: 18266–18272.
doi:10.1073/pnas.1206541109/-/DCSupplemental/pnas.201206541SI.pdf.33. Smith JD, Subramanian G, Gamain B, Baruch DI, Miller LH (2000)
Classification of adhesive domains in the Plasmodium falciparum erythrocytemembrane protein 1 family. Molecular and Biochemical Parasitology 110: 293–
310.34. Su X-Z, Heatwole VM, Wertheimer SP, Guinet F, Herrfeldt JA, et al. (1995)
The large diverse gene family var encodes proteins involved in cytoadherence
and antigenic variation of plasmodium falciparum-infected erythrocytes. Cell 82:89–100.
35. Gardner MJ, Hall N, Fung E, White O, Berriman M, et al. (2002) Genomesequence of the human malaria parasite Plasmodium falciparum. Nature 419:
498–511.
36. Kraemer SM, Kyes SA, Aggarwal G, Springer AL, Nelson SO, et al. (2007)Patterns of gene recombination shape var gene repertoires in Plasmodium
falciparum: comparisons of geographically diverse isolates. BMC Genomics 8:45.
37. Edgar RC (2004) MUSCLE: multiple sequence alignment with high accuracyand high throughput. Nucleic Acids Research 32: 1792–1797. doi:10.1093/nar/
gkh340.
38. Castresana J (2000) Selection of conserved blocks from multiple alignments fortheir use in phylogenetic analysis. Mol Biol Evol 17: 540–52.
39. Karrer B, Newman M (2011) Stochastic blockmodels and community structurein networks. Phys Rev E 83: 016107. doi:10.1103/PhysRevE.83.016107.
40. Meila M (2005) Comparing clusterings: an axiomatic view: Proceeding ICML
’05 Proceedings of the 22nd international conference on Machine learning: 577–584.
41. Lavstsen T, Salanti A, Jensen ATR, Arnot DE, Theander TG (2003) Sub-
grouping of Plasmodium falciparum 3D7 var genes based on sequence analysisof coding and non-coding regions. Malar J 2: 27.
42. Buckee CO, Recker M (2012) Evolution of the Multi-Domain Structures of
Virulence Genes in the Human Malaria Parasite, Plasmodium falciparum. PLoSComput Biol 8: e1002451. doi:10.1371/journal.pcbi.1002451.g006.
43. Kraemer SM, Smith JD (2003) Evidence for the importance of geneticstructuring to the structural and functional specialization of the Plasmodium
falciparum var gene family. Molecular Microbiology 50: 1527–1538.
doi:10.1046/j.1365-2958.2003.03814.x.44. Bopp SER, Manary MJ, Bright AT, Johnston GL, Dharia NV, et al. (2013)
Mitotic Evolution of Plasmodium falciparum Shows a Stable Core Genome butRecombination in Antigen Families. PLoS Genet 9: e1003293. doi:10.1371/
journal.pgen.1003293.s008.45. Newman M (2002) Assortative Mixing in Networks. Phys Rev Lett 89: 208701.
doi:10.1103/PhysRevLett.89.208701.
46. Warimwe GM, Keane TM, Fegan G, Musyoki JN, Newton CRJC, et al. (2009)Plasmodium falciparum var gene expression is modified by host immunity.
Proceedings of the National Academy of Sciences 106: 21801–21806. Available:http://www.pnas.org/content/106/51/21801.full.pdf+html.
47. Bull PC, Kyes S, Buckee CO, Montgomery J, Kortok MM, et al. (2007) An
approach to classifying sequence tags sampled from Plasmodium falciparum vargenes. Molecular and Biochemical Parasitology 154: 98–102. doi:10.1016/
j.molbiopara.2007.03.011.48. Warimwe GM, Fegan G, Musyoki JN, Newton CRJC, Opiyo M, et al. (2012)
Prognostic Indicators of Life-Threatening Malaria Are Associated with DistinctParasite Variant Antigen Profiles. Science Translational Medicine 4: 129ra45–
129ra45. Available: http://www.translationalmedicine.org/content/4/129/
129ra45.short.49. ORGEL LE (1963) The maintenance of the accuracy of protein synthesis and its
relevance to ageing. Proceedings of the National Academy of Sciences 49: 517–521.
50. Mucha PJ, Richardson T, Macon K, Porter MA, Onnela JP (2010) Community
Structure in Time-Dependent, Multiscale, and Multiplex Networks. Science328: 876–878. doi:10.1126/science.1184819.
Network Approach for Recombinant Malaria Genes
PLOS Computational Biology | www.ploscompbiol.org 12 October 2013 | Volume 9 | Issue 10 | e1003268


![Mesure et instruments de mesure (1960) [Dunod].pdf](https://img.pdfslide.net/doc/110x75/577cd1601a28ab9e789449c9/mesure-et-instruments-de-mesure-1960-dunodpdf.jpg)