Embed Size (px)
Citation preview
CORROSION OF STEEL-H PILES AT NUCLEAR GENERATING STATIONS
Report RSP-665.1 prepared for:
Richard Goulet, Environmental Risk Assessment Officer
Canadian Nuclear Safety Commission
280 Slater Street, Ottawa, ON K1P 5S9
by
P.R. Roberge, Ph.D., P.Eng. FNACE
Professor Department of Chemistry and Chemical Engineering
Royal Military College of Canada, Kingston, Ontario, K7K 7B4, Canada
5 December 2016
2
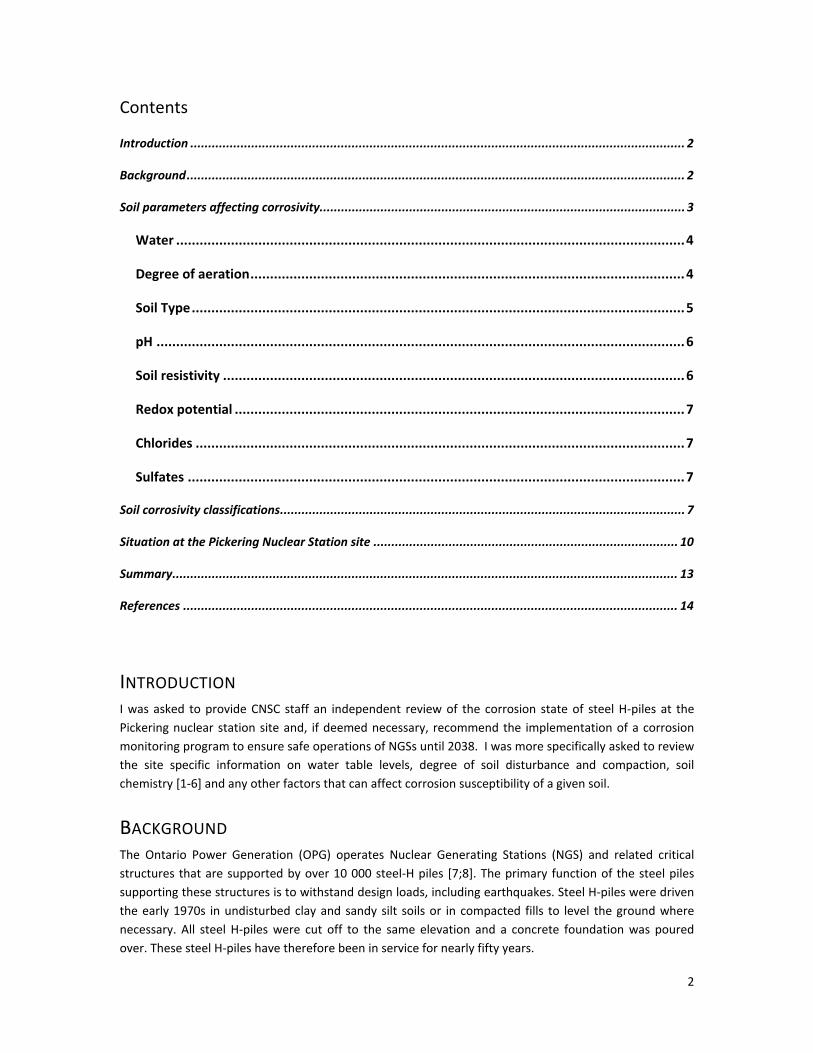
Contents
Introduction .......................................................................................................................................... 2
Background ........................................................................................................................................... 2
Soil parameters affecting corrosivity...................................................................................................... 3
Water .................................................................................................................................. 4
Degree of aeration ............................................................................................................... 4
Soil Type .............................................................................................................................. 5
pH ....................................................................................................................................... 6
Soil resistivity ...................................................................................................................... 6
Redox potential ................................................................................................................... 7
Chlorides ............................................................................................................................. 7
Sulfates ............................................................................................................................... 7
Soil corrosivity classifications ................................................................................................................. 7
Situation at the Pickering Nuclear Station site ..................................................................................... 10
Summary ............................................................................................................................................. 13
References .......................................................................................................................................... 14
INTRODUCTION I was asked to provide CNSC staff an independent review of the corrosion state of steel H-piles at the Pickering nuclear station site and, if deemed necessary, recommend the implementation of a corrosion monitoring program to ensure safe operations of NGSs until 2038. I was more specifically asked to review the site specific information on water table levels, degree of soil disturbance and compaction, soil chemistry [1-6] and any other factors that can affect corrosion susceptibility of a given soil.
BACKGROUND The Ontario Power Generation (OPG) operates Nuclear Generating Stations (NGS) and related critical structures that are supported by over 10 000 steel-H piles [7;8]. The primary function of the steel piles supporting these structures is to withstand design loads, including earthquakes. Steel H-piles were driven the early 1970s in undisturbed clay and sandy silt soils or in compacted fills to level the ground where necessary. All steel H-piles were cut off to the same elevation and a concrete foundation was poured over. These steel H-piles have therefore been in service for nearly fifty years.
3
It is well established that corrosion will, over time, degrade the steel H-piles resistance to design loads. In many circumstances, steel corrosion rates are low and steel piling may be used for permanent works in an unprotected condition. The degree of corrosion and whether protection is required depend upon the working environment which can be variable, even within a single installation [9].
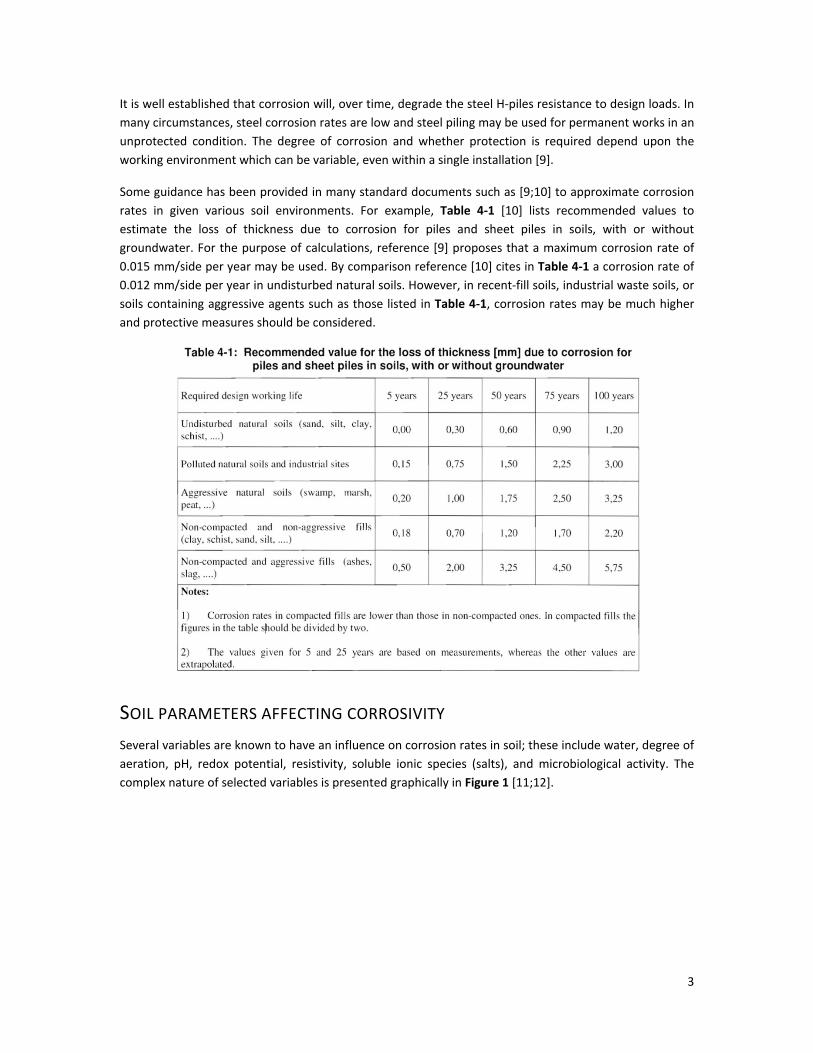
Some guidance has been provided in many standard documents such as [9;10] to approximate corrosion rates in given various soil environments. For example, Table 4-1 [10] lists recommended values to estimate the loss of thickness due to corrosion for piles and sheet piles in soils, with or without groundwater. For the purpose of calculations, reference [9] proposes that a maximum corrosion rate of 0.015 mm/side per year may be used. By comparison reference [10] cites in Table 4-1 a corrosion rate of 0.012 mm/side per year in undisturbed natural soils. However, in recent-fill soils, industrial waste soils, or soils containing aggressive agents such as those listed in Table 4-1, corrosion rates may be much higher and protective measures should be considered.
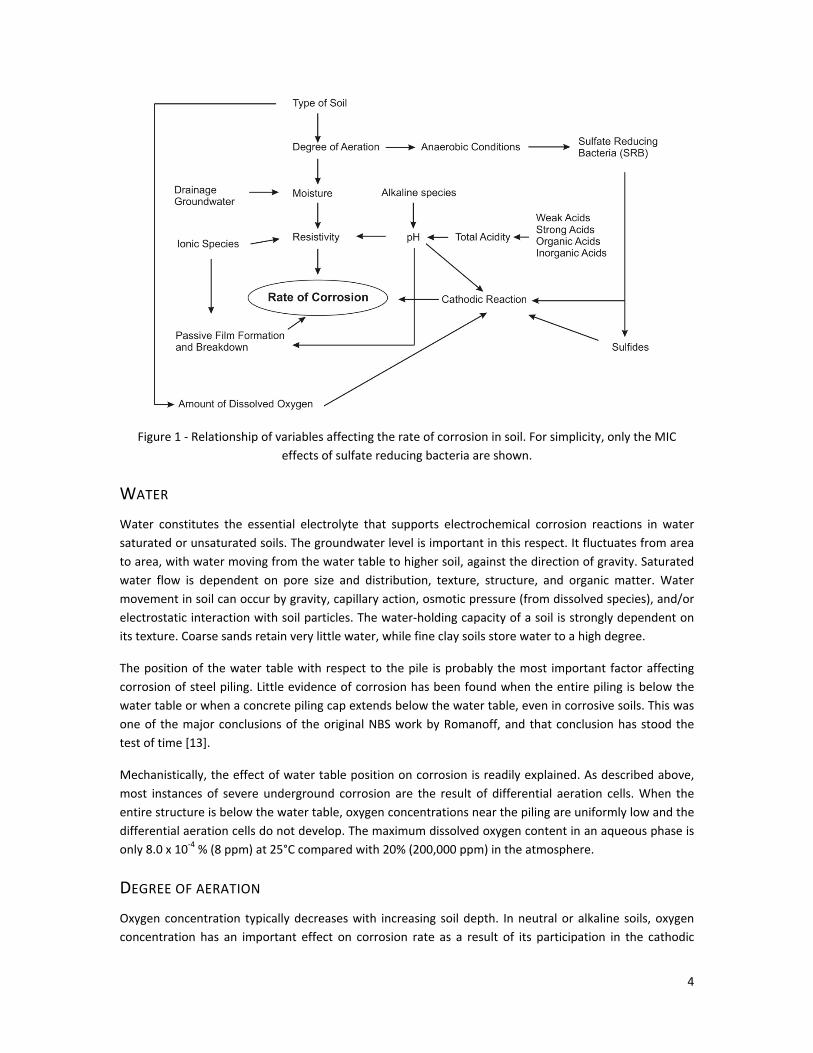
SOIL PARAMETERS AFFECTING CORROSIVITY Several variables are known to have an influence on corrosion rates in soil; these include water, degree of aeration, pH, redox potential, resistivity, soluble ionic species (salts), and microbiological activity. The complex nature of selected variables is presented graphically in Figure 1 [11;12].
4
Figure 1 - Relationship of variables affecting the rate of corrosion in soil. For simplicity, only the MIC effects of sulfate reducing bacteria are shown.
WATER Water constitutes the essential electrolyte that supports electrochemical corrosion reactions in water saturated or unsaturated soils. The groundwater level is important in this respect. It fluctuates from area to area, with water moving from the water table to higher soil, against the direction of gravity. Saturated water flow is dependent on pore size and distribution, texture, structure, and organic matter. Water movement in soil can occur by gravity, capillary action, osmotic pressure (from dissolved species), and/or electrostatic interaction with soil particles. The water-holding capacity of a soil is strongly dependent on its texture. Coarse sands retain very little water, while fine clay soils store water to a high degree.
The position of the water table with respect to the pile is probably the most important factor affecting corrosion of steel piling. Little evidence of corrosion has been found when the entire piling is below the water table or when a concrete piling cap extends below the water table, even in corrosive soils. This was one of the major conclusions of the original NBS work by Romanoff, and that conclusion has stood the test of time [13].
Mechanistically, the effect of water table position on corrosion is readily explained. As described above, most instances of severe underground corrosion are the result of differential aeration cells. When the entire structure is below the water table, oxygen concentrations near the piling are uniformly low and the differential aeration cells do not develop. The maximum dissolved oxygen content in an aqueous phase is only 8.0 x 10⁻⁴ % (8 ppm) at 25°C compared with 20% (200,000 ppm) in the atmosphere.
DEGREE OF AERATION Oxygen concentration typically decreases with increasing soil depth. In neutral or alkaline soils, oxygen concentration has an important effect on corrosion rate as a result of its participation in the cathodic
5
reaction. However, in the presence of certain microbes (such as sulfate-reducing bacteria), corrosion rates can be very high, even under anaerobic conditions. Oxygen transport is more rapid in coarse-textured, dry soils than in fine, waterlogged textures. Excavation can obviously increase the degree of aeration in soils. It is generally accepted that corrosion rates in disturbed soil with greater oxygen availability are significantly higher than in undisturbed soil.
Oxygen not only enables a corrosion reaction by maintaining a cathodic reaction, but it can promote one. This occurs where there is a difference in the concentration of dissolved oxygen (DO) between two points of the same metal surface. Since the direction of the reaction is towards equilibrium, the only way that equilibrium can be approached by corrosion will be to reduce the concentration of oxygen where it is highest.
The end result is that whenever there is a difference in the DO concentration between two points on a metal surface, the surfaces in contact with the solution containing the higher DO concentration will become cathodic to surfaces in contact with a lower DO concentration causing theses surfaces to suffer accelerated corrosion as anodes in an oxygen concentration cell.
Such differential aeration cells are also very common on buried pipes. For example, a pipe usually rests on undisturbed soil at the bottom of a ditch. Around the sides and on top of the pipe is relatively loose backfill that has been replaced in the ditch. A corrosion cell is formed because the backfill is more permeable to oxygen diffusing down from the surface,. In this case, the anode is the bottom surface of the pipe and the cathode is the rest of the surface. The electrolyte is the soil, and the connecting circuit is the metallic pipe itself.
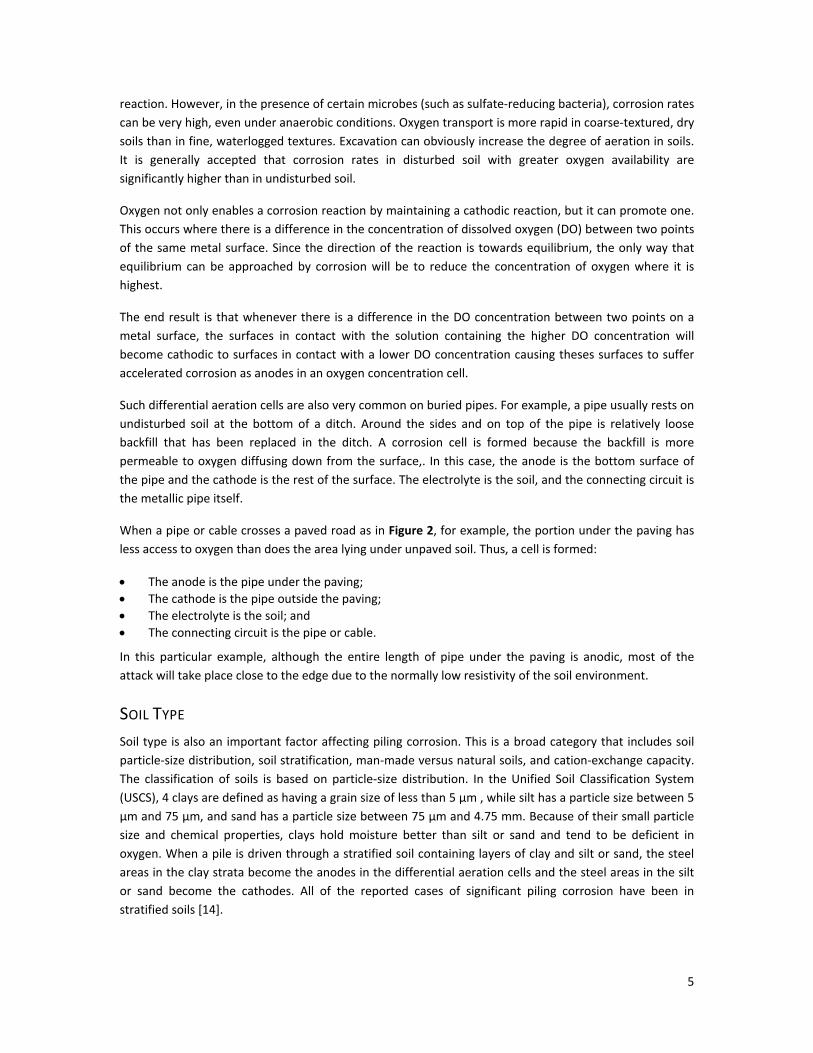
When a pipe or cable crosses a paved road as in Figure 2, for example, the portion under the paving has less access to oxygen than does the area lying under unpaved soil. Thus, a cell is formed:
• The anode is the pipe under the paving; • The cathode is the pipe outside the paving; • The electrolyte is the soil; and • The connecting circuit is the pipe or cable.
In this particular example, although the entire length of pipe under the paving is anodic, most of the attack will take place close to the edge due to the normally low resistivity of the soil environment.
SOIL TYPE Soil type is also an important factor affecting piling corrosion. This is a broad category that includes soil particle-size distribution, soil stratification, man-made versus natural soils, and cation-exchange capacity. The classification of soils is based on particle-size distribution. In the Unified Soil Classification System (USCS), 4 clays are defined as having a grain size of less than 5 µm , while silt has a particle size between 5 µm and 75 µm, and sand has a particle size between 75 µm and 4.75 mm. Because of their small particle size and chemical properties, clays hold moisture better than silt or sand and tend to be deficient in oxygen. When a pile is driven through a stratified soil containing layers of clay and silt or sand, the steel areas in the clay strata become the anodes in the differential aeration cells and the steel areas in the silt or sand become the cathodes. All of the reported cases of significant piling corrosion have been in stratified soils [14].
6
Figure 2 - Oxygen differential cell resulting from burial under paving producing an oxygen concentration cell.
Man-made products such as slag and cinders also were present in the majority of cases of significant piling corrosion Romanoff [13]. In those cases, the soils were stratified, with layers of man-made products and clays. The man-made products are corrosive for a number of reasons: they are porous, allowing oxygen access to the pile, contain high concentrations of soluble salts, have low resistivities, and frequently have a low pH.
Disturbed natural soil is relatively less aggressive than man-made products, but can be porous, allowing oxygen to reach the pile. On the other hand, undisturbed natural soils are relatively noncorrosive, even above the water table, regardless of the properties. Undisturbed soils are noncorrosive for the same reasons that corrosion is negligible below the water table. Under these conditions, the soils are deficient in oxygen. Few pilings are installed in completely undisturbed soil. Usually, the upper portion of a piling is exposed to some type of fill soil [14].
PH Soil pH typically varies between 5 and 8. In this range, pH is generally not considered to be the dominant variable affecting corrosion rates. More acidic soils produced by mineral leaching, decomposition of acidic plants (for example, coniferous tree needles), industrial wastes, acid rain, and certain forms of microbiological activity represent a serious corrosion risk to common construction materials such as steel, cast iron, and zinc coatings [11]. On the other hand, alkaline soils tend to have high sodium, potassium, magnesium, and calcium contents, with the latter two elements forming possibly protective calcareous deposits on buried structures.
SOIL RESISTIVITY Resistivity has historically been used as an indicator of soil corrosivity. Since ionic current flow is associated with soil corrosion reactions, high soil resistivity will usually slow down corrosion reactions. Soil resistivity generally decreases with increasing water content and the concentration of ionic species. Soil resistivity is by no means the only parameter affecting the risk of corrosion damage and a high soil
7
resistivity alone will not guarantee the absence of corrosion [11]. Soil resistivity variations along the length of a buried structure, for example, may lead to the formation of macro corrosion cells. Therefore, for such structures, the merit of a corrosion risk classification based on an absolute value of soil resistivity is limited. Soil resistivity can be measured by a few traditional techniques such as the Wenner four-pin method or, more recently, by electromagnetic measurements. The latter allows measurements in a convenient manner and at different soil depths. Another option for soil resistivity measurements is the soil box method whereby a sample is taken during excavation, preferably in the immediate vicinity of the buried structure being investigated.
REDOX POTENTIAL The redox potential is essentially a measure of the degree of aeration in a soil. A high redox potential indicates a high oxygen level. Low redox values may provide an indication that conditions are conducive to anaerobic microbiological activity. Sampling of soil will obviously lead to oxygen exposure, and unstable redox potentials are thus likely to be measured in disturbed soil.
CHLORIDES Chloride ions generally participate to the dissolution reactions of many metals. Furthermore, their presence tends to decrease the soil resistivity. Chlorides may be found naturally in soils as a result of brackish groundwater and historical geological seabeds or come from external sources such as deicing salts applied to roadways.
SULFATES Sulfate ions are generally considered to be more benign in their direct corrosive action toward metallic materials than chlorides. However, concrete may be attacked as a result of high sulfate levels. The presence of sulfates also poses a major risk for metallic materials since these ions are nutrients to SRB’s that convert these benign ions into highly corrosive sulfides.
SOIL CORROSIVITY CLASSIFICATIONS For design and corrosion risk assessment purposes, it is desirable to estimate the corrosivity of soils without necessarily conducting exhaustive corrosion testing. Corrosion testing in soils may be complicated by the need of long exposure periods since buried structures are usually expected to last for several decades during which many soil conditions may be encountered. Considering the complexity of the parameters affecting soil corrosion, it is obvious that the use of relatively simple soil corrosivity models is bound to be inaccurate. One of the simplest classifications is based on a single parameter, soil resistivity [11].
Table 1 shows the generally adopted corrosion severity ratings. Sandy soils are high on the resistivity scale and therefore are considered to be the least corrosive. Clay soils, especially those contaminated with saline water, are on the opposite end of the corrosivity scale. The soil resistivity parameter is very widely used in practice and is generally considered to be the dominant variable in absence of microbial activity.
8
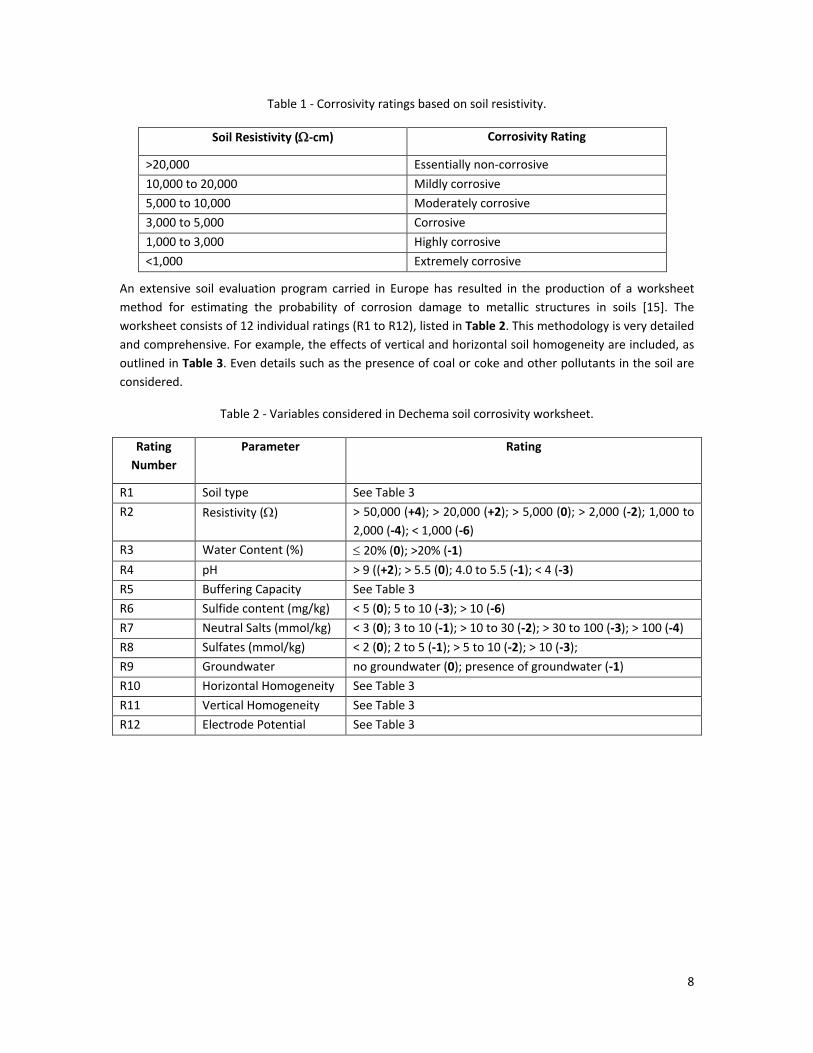
Table 1 - Corrosivity ratings based on soil resistivity.
Soil Resistivity (Ω-cm) Corrosivity Rating
>20,000 Essentially non-corrosive 10,000 to 20,000 Mildly corrosive 5,000 to 10,000 Moderately corrosive 3,000 to 5,000 Corrosive 1,000 to 3,000 Highly corrosive <1,000 Extremely corrosive
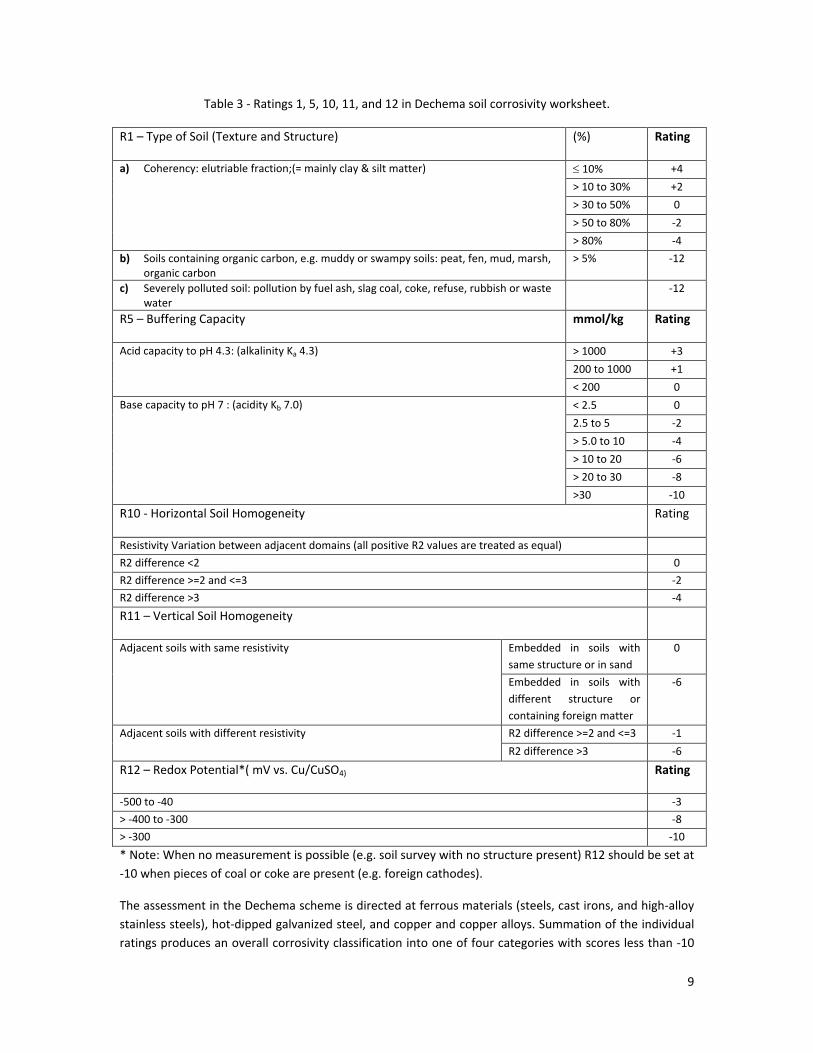
An extensive soil evaluation program carried in Europe has resulted in the production of a worksheet method for estimating the probability of corrosion damage to metallic structures in soils [15]. The worksheet consists of 12 individual ratings (R1 to R12), listed in Table 2. This methodology is very detailed and comprehensive. For example, the effects of vertical and horizontal soil homogeneity are included, as outlined in Table 3. Even details such as the presence of coal or coke and other pollutants in the soil are considered.
Table 2 - Variables considered in Dechema soil corrosivity worksheet.
Rating Number
Parameter Rating
R1 Soil type See Table 3 R2 Resistivity (Ω) > 50,000 (+4); > 20,000 (+2); > 5,000 (0); > 2,000 (-2); 1,000 to
2,000 (-4); < 1,000 (-6) R3 Water Content (%) ≤ 20% (0); >20% (-1) R4 pH > 9 ((+2); > 5.5 (0); 4.0 to 5.5 (-1); < 4 (-3) R5 Buffering Capacity See Table 3 R6 Sulfide content (mg/kg) < 5 (0); 5 to 10 (-3); > 10 (-6) R7 Neutral Salts (mmol/kg) < 3 (0); 3 to 10 (-1); > 10 to 30 (-2); > 30 to 100 (-3); > 100 (-4) R8 Sulfates (mmol/kg) < 2 (0); 2 to 5 (-1); > 5 to 10 (-2); > 10 (-3); R9 Groundwater no groundwater (0); presence of groundwater (-1) R10 Horizontal Homogeneity See Table 3 R11 Vertical Homogeneity See Table 3 R12 Electrode Potential See Table 3
9
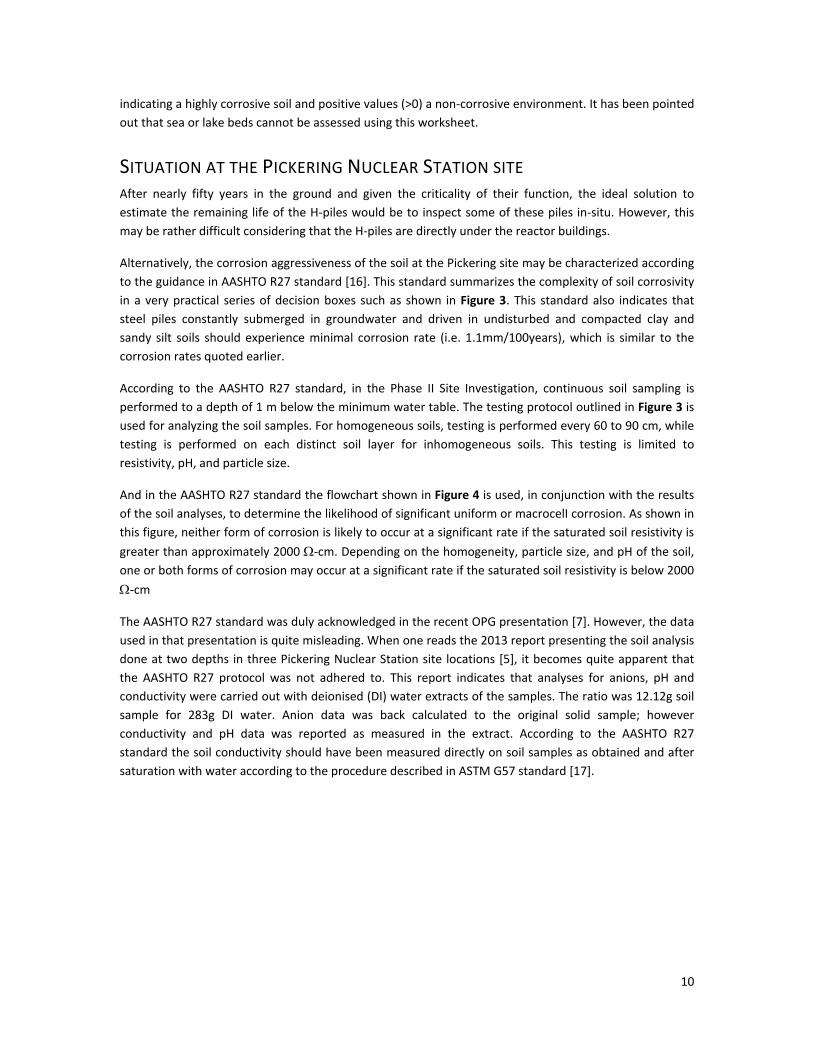
Table 3 - Ratings 1, 5, 10, 11, and 12 in Dechema soil corrosivity worksheet.
R1 – Type of Soil (Texture and Structure) (%) Rating
a) Coherency: elutriable fraction;(= mainly clay & silt matter) ≤ 10% +4 > 10 to 30% +2 > 30 to 50% 0 > 50 to 80% -2 > 80% -4
b) Soils containing organic carbon, e.g. muddy or swampy soils: peat, fen, mud, marsh, organic carbon
> 5% -12
c) Severely polluted soil: pollution by fuel ash, slag coal, coke, refuse, rubbish or waste water
-12
R5 – Buffering Capacity mmol/kg Rating
Acid capacity to pH 4.3: (alkalinity Ka 4.3) > 1000 +3 200 to 1000 +1 < 200 0
Base capacity to pH 7 : (acidity Kb 7.0) < 2.5 0 2.5 to 5 -2 > 5.0 to 10 -4 > 10 to 20 -6 > 20 to 30 -8 >30 -10
R10 - Horizontal Soil Homogeneity Rating
Resistivity Variation between adjacent domains (all positive R2 values are treated as equal) R2 difference <2 0 R2 difference >=2 and <=3 -2 R2 difference >3 -4 R11 – Vertical Soil Homogeneity
Adjacent soils with same resistivity Embedded in soils with same structure or in sand
0
Embedded in soils with different structure or containing foreign matter
-6
Adjacent soils with different resistivity R2 difference >=2 and <=3 -1 R2 difference >3 -6
R12 – Redox Potential*( mV vs. Cu/CuSO4) Rating
-500 to -40 -3 > -400 to -300 -8 > -300 -10 * Note: When no measurement is possible (e.g. soil survey with no structure present) R12 should be set at -10 when pieces of coal or coke are present (e.g. foreign cathodes).
The assessment in the Dechema scheme is directed at ferrous materials (steels, cast irons, and high-alloy stainless steels), hot-dipped galvanized steel, and copper and copper alloys. Summation of the individual ratings produces an overall corrosivity classification into one of four categories with scores less than -10
10
indicating a highly corrosive soil and positive values (>0) a non-corrosive environment. It has been pointed out that sea or lake beds cannot be assessed using this worksheet.
SITUATION AT THE PICKERING NUCLEAR STATION SITE After nearly fifty years in the ground and given the criticality of their function, the ideal solution to estimate the remaining life of the H-piles would be to inspect some of these piles in-situ. However, this may be rather difficult considering that the H-piles are directly under the reactor buildings.
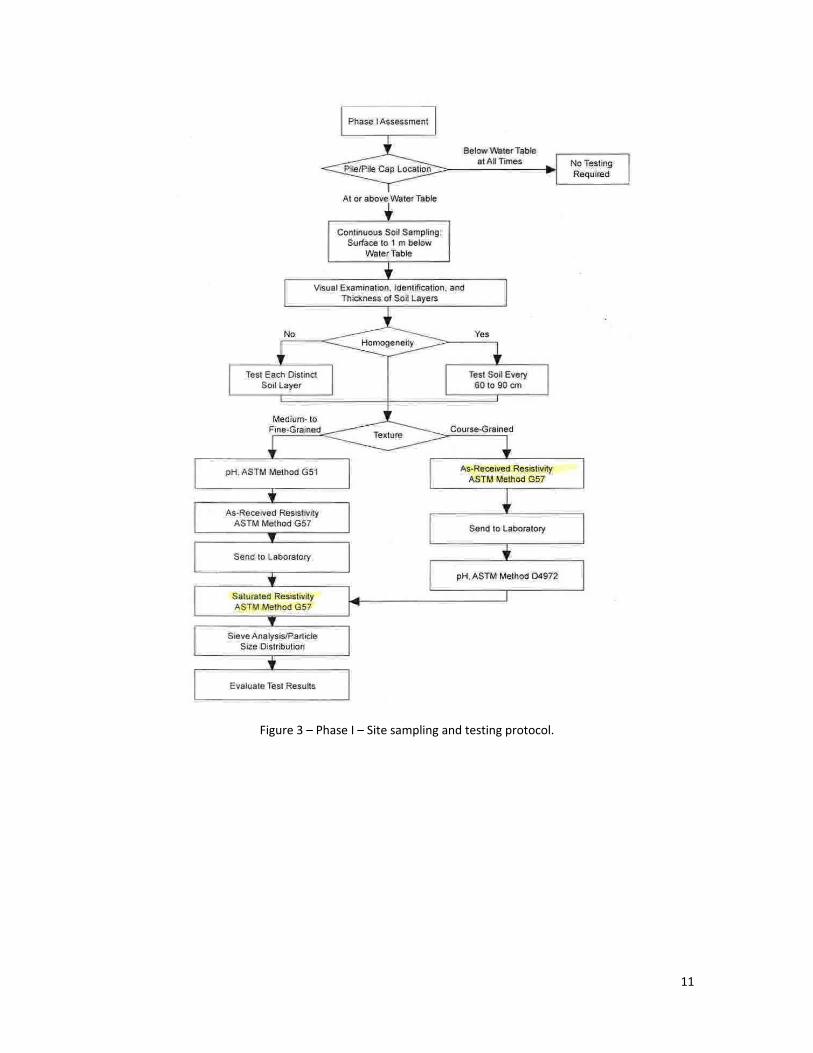
Alternatively, the corrosion aggressiveness of the soil at the Pickering site may be characterized according to the guidance in AASHTO R27 standard [16]. This standard summarizes the complexity of soil corrosivity in a very practical series of decision boxes such as shown in Figure 3. This standard also indicates that steel piles constantly submerged in groundwater and driven in undisturbed and compacted clay and sandy silt soils should experience minimal corrosion rate (i.e. 1.1mm/100years), which is similar to the corrosion rates quoted earlier.
According to the AASHTO R27 standard, in the Phase II Site Investigation, continuous soil sampling is performed to a depth of 1 m below the minimum water table. The testing protocol outlined in Figure 3 is used for analyzing the soil samples. For homogeneous soils, testing is performed every 60 to 90 cm, while testing is performed on each distinct soil layer for inhomogeneous soils. This testing is limited to resistivity, pH, and particle size.
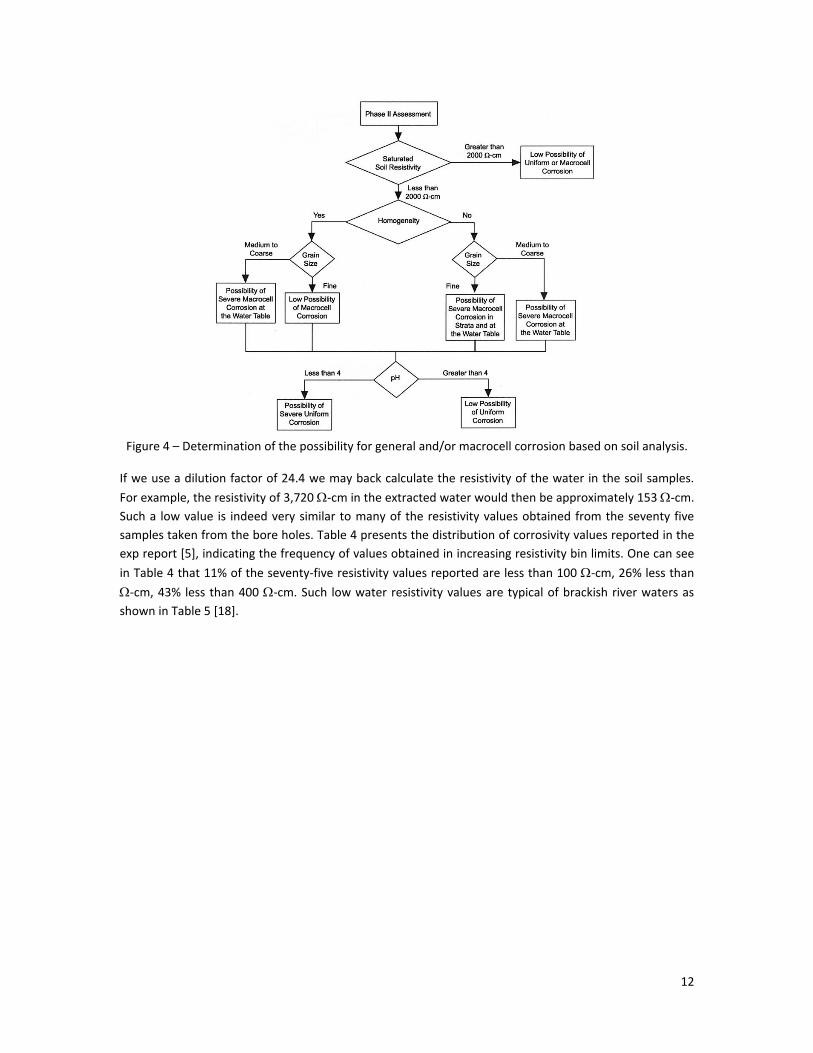
And in the AASHTO R27 standard the flowchart shown in Figure 4 is used, in conjunction with the results of the soil analyses, to determine the likelihood of significant uniform or macrocelI corrosion. As shown in this figure, neither form of corrosion is likely to occur at a significant rate if the saturated soil resistivity is greater than approximately 2000 Ω-cm. Depending on the homogeneity, particle size, and pH of the soil, one or both forms of corrosion may occur at a significant rate if the saturated soil resistivity is below 2000 Ω-cm
The AASHTO R27 standard was duly acknowledged in the recent OPG presentation [7]. However, the data used in that presentation is quite misleading. When one reads the 2013 report presenting the soil analysis done at two depths in three Pickering Nuclear Station site locations [5], it becomes quite apparent that the AASHTO R27 protocol was not adhered to. This report indicates that analyses for anions, pH and conductivity were carried out with deionised (DI) water extracts of the samples. The ratio was 12.12g soil sample for 283g DI water. Anion data was back calculated to the original solid sample; however conductivity and pH data was reported as measured in the extract. According to the AASHTO R27 standard the soil conductivity should have been measured directly on soil samples as obtained and after saturation with water according to the procedure described in ASTM G57 standard [17].
11
Figure 3 – Phase I – Site sampling and testing protocol.
12
Figure 4 – Determination of the possibility for general and/or macrocell corrosion based on soil analysis.
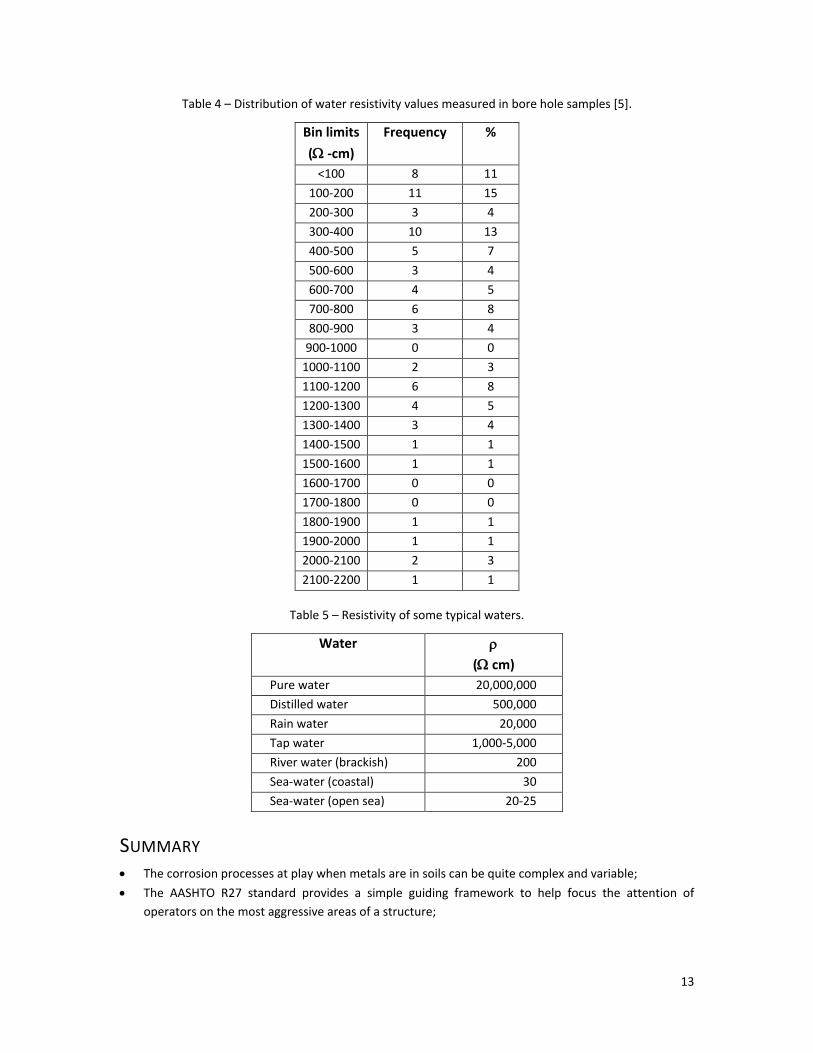
If we use a dilution factor of 24.4 we may back calculate the resistivity of the water in the soil samples. For example, the resistivity of 3,720 Ω-cm in the extracted water would then be approximately 153 Ω-cm. Such a low value is indeed very similar to many of the resistivity values obtained from the seventy five samples taken from the bore holes. Table 4 presents the distribution of corrosivity values reported in the exp report [5], indicating the frequency of values obtained in increasing resistivity bin limits. One can see in Table 4 that 11% of the seventy-five resistivity values reported are less than 100 Ω-cm, 26% less than Ω-cm, 43% less than 400 Ω-cm. Such low water resistivity values are typical of brackish river waters as shown in Table 5 [18].
13
Table 4 – Distribution of water resistivity values measured in bore hole samples [5].
Bin limits (Ω -cm)
Frequency %
<100 8 11 100-200 11 15 200-300 3 4 300-400 10 13 400-500 5 7 500-600 3 4 600-700 4 5 700-800 6 8 800-900 3 4
900-1000 0 0 1000-1100 2 3 1100-1200 6 8 1200-1300 4 5 1300-1400 3 4 1400-1500 1 1 1500-1600 1 1 1600-1700 0 0 1700-1800 0 0 1800-1900 1 1 1900-2000 1 1 2000-2100 2 3 2100-2200 1 1
Table 5 – Resistivity of some typical waters.
Water ρ (Ω cm)
Pure water 20,000,000 Distilled water 500,000 Rain water 20,000 Tap water 1,000-5,000 River water (brackish) 200 Sea-water (coastal) 30 Sea-water (open sea) 20-25
SUMMARY • The corrosion processes at play when metals are in soils can be quite complex and variable; • The AASHTO R27 standard provides a simple guiding framework to help focus the attention of
operators on the most aggressive areas of a structure;
14
• The AASHTO R27 standard proposes to use soil resistivity as a primary screening criterion to decide on a course of action to be taken when estimating the useful life of buried steel material;
• We presently do not seem to have proper soil resistivity measurements for the Pickering Nuclear Station site;
• It would be important to carry out a systematic analysis of soil resistivity at the Pickering Nuclear Station site before speculating on the remaining life of the H-piles supporting the nuclear station buildings;
• Given the critical nature and size of the installations considered here, soil samples should be collected from at least twelve representative locations at a few depths following the guidelines offered by AASHTO R27;
• A subsequent analysis of these soil resistivity results should provide a sound and proven method for assessing the H-piles corrosion situation.
REFERENCES 1. Phase I Winter unpurged water well. Interim report no 1. NK-REP-10120-10043. 2013. Black &
McDonald. 2. Phase I Winter purged water well. Interim report no 2. NK-REP-10120-10044. 2013. Black &
McDonald. 3. Phase I Spring purged water well. Interim report no 3. NK-REP-10120-10045. 2013. Black &
McDonald. 4. Phase I Summer purged water well. Interim report no 4. NK-REP-10120-00043. 2013. Black &
McDonald. 5. Phase I Fall water well. Report no 5. NK-REP-10120-10046. 2013. Black & McDonald. 6. Phase II Soil sampling and analysis report. NK-REP-10120-10047. 2013. Black & McDonald. 7. Reactor Building and High Pressure Emergency Coolant Injection foundation piles. e-
docs#5100842. 2016. Ontario Power Generation. 8. Pickering B- assessment of safety factor of RB foundation H-pile. e-docs#5100844. 2016. Ontario
Power Generation. 9. British standard 8002: Code of practice for Earth retaining structures. BS 8002. 1994. British
Standards Institution (BSI). 10. Eurocode 3 - Design of steel structures - Part 5: Piling General rules and rules for buildings . EN
1993-5 (2007). 2007. European Committee for Standardization. 11. Roberge PR. Handbook of Corrosion Engineering. 2nd edn. New York, NY: McGraw-Hill, 2012. 12. Robinson WC. Testing Soil for Corrosiveness. Materials Performance 1993; 32: 56-8. 13. Romanoff M. Underground Corrosion. Houston, TX: NACE International, 1989. 14. State-of-the-Art Survey on Corrosion of Steel Piling in Soils. John Beavers. 05101. 2001. Houston,
TX, NACE International. 15. Heim M, Schwenk W. Corrosion in Aqueous Solutions and Soil. In: von Baeckmann W, Schwenk
W, Prinz W, eds. Handbook of Cathodic Protection. 1997; 139-52. 16. Standard Practice for assessment of corrosion of steel piling for non-marine applications.
AASHTO Designation: R 27-01. 2001. American Association of State Highway and Transportation Officials.
17. ASTM G57 Standard Test Method for Field Measurement of Soil Resistivity Using the Wenner Four-Electrode Method . G57 - 06 (Reapproved 2012). 2012. West Conshohocken, PA, American Society for Testing of Materials.
15
18. Roberge PR. Corrosion Engineering: Principles and Practice. New York, NY: McGraw-Hill, 2008.