Embed Size (px)
Citation preview

How to communicate effective management?
Richard LeonadJamie AllanJohn LaFeminaGina Taberski
Facility Performance Metrics
Objective• Begin a discussion about a set of common metrics that could
be used across the NSF’s large facilities• Review some unique perspectives NSF Program Office (Jamie Allan, IODP)
DOE National Laboratory Operator (John LaFemina, PNNL)
NSF Large Facility Operation (Gina Taberski, UCAR/NCAR)
2

Common Story• Supports NSF in messaging collective facility’s progress and
control• Challenges: Range of Science objectives leads to a wide range of current metrics
Varying maturity of operations
Outcomes vs Outputs
Not a competition
• Socio-Economic Impact Metrics Tomorrow
3

Path Forward
• Group/table discussion of metrics (10 Minutes)• Review top metric(s) from each group• Collect Notes from Today• Follow up with poll for additional inputs and rankings• Consolidate into report to NSF Review with Facility Operators first
4
Group Inputs
Group Review
Report to NSF
Potential MetricsTitle Description Measure
5

JOIDES Resolution (JR) facility performance evaluation for operations within the International Ocean Discovery Program (IODP)

IODP: International Partnerships as the basis for a cooperative and complex multi-platform program
Chikyu (Japan)JOIDES Resolution (USA)
Common 10-year Program Plan26+ Member nations3 platforms, each with a governing Facility BoardIODP platforms are financially independent
Mission-Specific Platforms (Europe)
Tahiti reef drilling

JOIDES Resolution Facility Board (JRFB)
• 6 scientists (Chair is a scientist), NSF, Funding Agencies contributing unrestricted funds to NSF for operation, and JOIDES Resolution Science Operator (JRSO; Texas A&M University as Awardee)
• Oversees IODP Science Evaluation and Environmental Protection and Safety Panels (SEP and EPSP)
• Approves Annual Program Plan and budget, including future ship’s track
• Approves Policies and Procedures; works with other IODP Facility Boards to ensure Program common practices

JOIDES Resolution Facility Details
• Is converted from oilfield drilling vessel, with addition of science lab and specialized coring and borehole equipment
• International science parties of 30 scientists, with about 20 support personnel and 60-65 drill ship personnel
• Is leased from Overseas Drilling, Ltd, wholly-owned subsidiary of Siem Offshore, under contract to JRSO
• 8-10.5 months per year of planned operations

JOIDES Resolution Operational Review
• Annual 3-day NSF Panel, held at JRSO, reviews broad range of performance indicators and provides confidential report to NSF
• Annual Co-Chief Scientist Review meeting report• Science party post-Expedition reviews• Expedition Preliminary Report, Site Summaries, Weekly Reports, Daily
Reports• Lab Working Group activities• Facility Operational Performance Rating• Facility Budget Performance• Other reports, such as Panel member site visit• Implementation of previous Panel recommendations
• JRFB provides oversight of facility performance, approves implementation of facility upgrades
• JRFB members get copies of Panel Report• NSF provide response to Panel Report, with endorsements to JRFB

JR Facility Performance Rating
• Contract specifies 4 distinct day rates: Operating, Standby, Transit, and Breakdown.
• Standby refers to when ship is idle (as at port call)• Breakdown includes Standby and Transit times due to
breakdown (“inability to do work due to breakdown of contractor’s equipment”)
• Standby rates during tie-up or dry dock not included in calculation
• Day rates are calculated in 15 minute increments; sensitive indicator
• Annual performance rating defined as:• (Actual Operating + Standby + Transit time) / (Planned
Operating + Standby + Transit time) • Expressed as percentage

JR Facility Rating and Budget Performance
Fiscal Year Facility Rating Breakdowns• 2015 99.6%• 2016 94.7% Rig draw works brake• 2017 95.4% Rig draw works clutch
and brakes
Fiscal Year Award Budget Actual Budget OperationsComplexity
• 2015 $64.4M (8 mos) $62.9M 8 months average• 2016 $65.6M (8 mos) $61.8M 8 months high• 2017 $67.4M (8 mos) $62.3M 10.5 months very high• 2018 $68.1M (8 mos) $66.8M 10 months very high

air • planet • peopleNational Center for Atmospheric Research – Sample Metrics
Research, Observing, Computer Facilities

air • planet • peopleNCAR – Hosted Community Events
The metrics featured offer qualitative and quantitative measurements and assessments of the productivity, quality, and impacts that NCAR staff, programs and activities have on our research community, sponsors, and society in general for data reported in various UCAR systems.
NCAR-Hosted Community Events
I
In FY17, a total of 129 events were hosted: 26workshops, 11 tutorials, three symposia, five conferences, and 84 colloquia with an average audience of 58 colleagues per event and estimated total audience of 7,538. Event co-sponsors groups included the German Climate Computing Center, EUropean Facility for Airborne Research, the U.S. Department of Energy and universities including the University of Chicago, and Michigan State University.
air • planet • peopleNCAR – Facility Tours/Field Trips
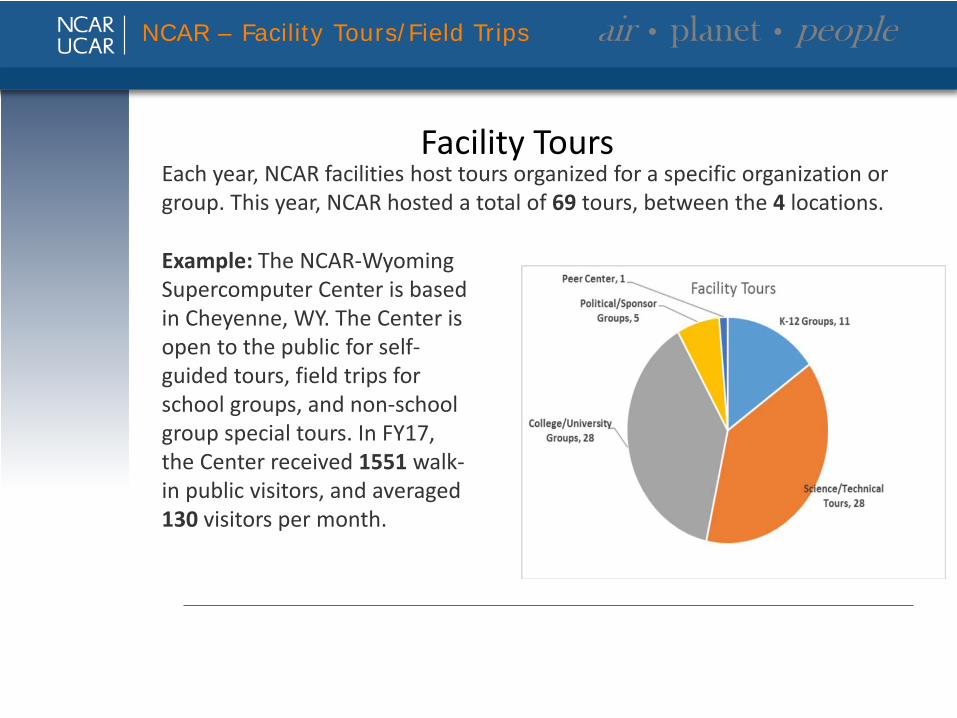
Each year, NCAR facilities host tours organized for a specific organization or group. This year, NCAR hosted a total of 69 tours, between the 4 locations.
Facility Tours
Example: The NCAR-Wyoming Supercomputer Center is based in Cheyenne, WY. The Center is open to the public for self-guided tours, field trips for school groups, and non-school group special tours. In FY17, the Center received 1551 walk-in public visitors, and averaged 130 visitors per month.

air • planet • peopleNational Center for Atmospheric Research – Teaching or Training
Date Range
UCAR Staff Members
Workshops/ Tutorials/ Colloquia
Classes Countries U.S. States
FY17 76 90 562 6 15
Teaching and Training Metrics
NCAR staff teach classes and offer training in workshops, tutorials, and colloquia to colleagues and students ranging from model users, to scholars, to fellow researchers.

SUMMARY OF FACILITY USAGE RESEARCH AVIATION FACILITY(Includes Only Observing Facilities Assessment Panel Approved Projects)
315.8 52TOTAL (1)
Notes:
Project TitlePrincipal
Investigator Institution User (2) Aircraft Locale Dates Hours FlightsRAFHAIS
O2/N2 Ratio and CO2 Airborne Southern Ocean
(ORCAS) Study
B. Stephens;M. Long;
R. Keeling;
C. Sweeney;E. Kort;
M. Gierach;E. Atlas
NCAR/EOL;
NCAR/CGD;
Scripps; U. Colorado; U.
Michigan;JPL;
U. Miami
J GVPunta
Arenas, Chile
1/15/16 -2/28/16
101.0 19AWAS, TOGA,QCLS, VCSEL
SOCRATES-Test J. Stith NCAR/EOL N GV Broomfield, CO 9/19/16 -10/4/16
8.5 4
Monitoring the Intensification and Track of
Tropical Storms (MITTS)
J. McFadden NOAA O GV Broomfield, CO 8/29/16 -9/9/16
32.7 5
Airborne ResearchInstrumentation
Testing Opportunity
2016(ARISTO 2016)
J. Stith NCAR/EOL N C-130 Broomfield, CO8/1/16 -8/19/16
21.5 6
NASA Operation ICEBRIDGE 2015
C. Hansen,N. Kurtz
NASA O GV PuntaArenas, Chile
9/18/15 -11/4/15
148.3 17
Airborne Research
InstrumentationTesting
Opportunity2015
(ARISTO 2015)
J. Stith NCAR/EOL J C-130 Broomfield, CO 9/14/15 -10/2/15
3.8 1GT-CIMS SID-2H

air • planet • peopleNCAR Publications – 2007 thru 2016
• Nearly 5,900 peer reviewed publications over past decade
• Nearly 180,000citations
~ 31 per paper
• More than 10,300unique authors
• Nearly 2,400 unique institutions
Most Common Topics
Some Facts about NCAR Publications

air • planet • peopleUCAR Facility/Maintenance Metrics
Metric Tracked By
Outcome
Track Uptime
Track Operations & Maintenance
Costs
Support Budget Requests for Facility Sustainment &
Improvement
On-Demand Maintenance: Time to Respond
Facilities ✅ ✅
Emergency Work Order Volumes Facilities ✅ ✅ ✅
Preventative Work Order Volumes Facilities ✅ ✅
Facility Projects, by Status Facilities ✅ ✅
Volume of Tradesperson work, by Trade Facilities ✅ ✅
Labor costs by Trade Facilities ✅ ✅
Materials Cost Facilities ✅ ✅
Labor distribution by square foot Facilities ✅ ✅
UCAR Facility/Maintenance Metrics

UCAR Procurement System Metrics
20
Pre-UProcure Baseline (2/1-4/24)
Post-UProcure(6/14 - 12/31)
Post-UProcure December Only(12/1-12/31)
4.4 avg.
2.6 avg.
1.4 avg.
4.4 avg calendar days to complete165 observations
2.6 avg calendar days to complete4375 observations
1.4 avg calendar days to complete746 observations

air • planet • peopleQuestions
Questions ?