Embed Size (px)
DESCRIPTION
RIL-RPL MERGER
Citation preview
Electronic copy available at: http://ssrn.com/abstract=1316258
RIL–RPL Merger 2002:
Fooling Some of the People All of the Time December 11 2008
Authors:
Shuaib M Fakih
Harshal Pandya
Kaustubh Chopade
Rahul Kwatra
Electronic copy available at: http://ssrn.com/abstract=1316258
1
RIL–RPL Merger 2002: Fooling Some of the People All of the Time
THE MERGER - HOW IT ALL STARTED
Every weekday afternoon, Mukesh and Anil Ambani dropped everything and walked across from their fourth floor offices to a big rectangular room that serves as Chairman Dhirubhai Ambani's sanctum during the three hours that the Ambani patriarch spent each day at Maker Chambers 4, Reliance's headquarters in Mumbai's Nariman Point. The two sons had lunch with ''Papa'' (Dad)-a practice that had become a ritual. This is when the two brothers got to listen to India's foremost entrepreneur, a man who had achieved in his lifetime what few were bold enough to dream. It was at one of those lunches, sometime in winter of 2001, that the 69-year-old senior Ambani first talked to his sons about his latest dream, one that he later saw come true. It was a proposal to merge Reliance Petroleum Ltd (RPL), the biggest grassroots oil refinery company that the Ambanis had built, with parent Reliance Industries Ltd (RIL). The merger would have catapulted RIL, already the largest company in India's private sector, into the Fortune 500 list, a dream that Dhirubhai had cherished for years.
In minutes, the atmosphere of the usually low-key lunch meeting was electrified. Within days, a core team was formed. Swiftly the numbers were crunched, the details thrashed out and the final proposal drafted in a secret operation code-named Project Aden, an allusion to the African port where Dhirubhai, then in his teens, cut his teeth as a petrol station attendant.
THE MERGER SCHEME
From the Chairman’s Speech to the equity shareholders of RIL – 8th April 2002
Quote:
The Boards of Directors of RIL and RPL have unanimously approved the merger of RPL with RIL, subject to necessary approvals. They have recommended an exchange ratio of one share of RIL for every 11 shares of RPL. The exchange ratio has been determined on the basis of a Valuation Report by Valuation Advisors, Price Waterhouse and SB Billimoria & Co. (member of Deloitte Touche Tohmatsu International), jointly appointed by RPL and RIL.
For determining the exchange ratio, the value per equity share of RIL and RPL have been determined using three different methods:
This case was prepared by Kaustubh Chopade, Harshal Pandya, Rahul Kwatra (JBIMS, Batch of 2009) under the guidance of Prof. Shuaib M Fakih. This case has been prepared as the basis for class discussion rather than to illustrate either effective or ineffective handling of an administrative situation.
2
1. Net Asset Value (NAV) method,
2. Earnings Value (EV) method, and
3. Market Value (MV) method
The Net Asset Value (NAV) of a share is based on the historical cost of the company’s assets, and usually represents the minimum value or support value of a share of a going concern. The Earnings Value (EV) per share is obtained by capitalizing the company’s maintainable earnings at an appropriate rate reflecting the company’s risk reward profile. The Market Value (MV) of a share is determined on the basis of the weighted average price of the share for a period of six months.
Leading Indian and global experts have advised RIL and RPL on the various aspects of the merger. JM Morgan Stanley has acted as Financial Advisor to the transaction. Amarchand & Mangaldas & Suresh A. Shroff & Co. are the Legal Advisors. Mr. Arun Gandhi of N.M.Raiji & Co., Mr. Bansi Mehta of Bansi Mehta & Co., and Mr. N.V.Iyer of CC Chokshi & Co. are the Advisors for the Merger.
The appointed date of merger of RPL with RIL is 1.4.2002, representing the first full year of commercial operations of RPL. Under the proposed terms of the merger, shares of RPL held by RIL, representing 28% of RPL’s equity share capital, will be cancelled. RIL shares, against the holding of RPL shares by Reliance Industrial Investments and Holdings Ltd. (RIIHL), a 100% subsidiary of RIL, valued at over Rs. 3,300 crores (US$ 0.68 billion) at current market prices, will be directly issued and allotted to a Trustee. These shares, representing 7.5% of RIL’s equity, will be held for the benefit of RIIHL, and to realize substantial economic value.
RPL shares held by other RIL associates, representing 14% of RPL’s equity share capital, will be exchanged into RIL shares, and will constitute 4.7% of the fully diluted equity share capital of RIL, with a value of over Rs. 2,100 crores (US$ 0.43 billion) at current market prices.
The aggregate shareholding by RIIHL and other RIL associates may be leveraged to pursue significant acquisition and other growth opportunities in domestic and international markets, including by way of monetization of this equity stake. All economic benefits will flow to RIL’s shareholders, thereby maximizing shareholder value.
All these investments will be guided by the Reliance group’s overall financial discipline, and its consistent objective of maintaining top end credit ratings.
Unquote
THE MERGER APPROVED
Later the Shareholders of Reliance Petroleum Ltd. (RPL) approved the merger of RPL with Reliance Industries Ltd. (RIL), at the shareholders' meeting convened under the orders of the High Court of Gujarat. The resolution was passed with an overwhelming majority representing
3
99.99% in value of members present and voting. The resolution was supported by all categories of shareholders, including international and domestic institutional investors, and retail investors.
The shareholders of RIL had already approved the merger of RPL with RIL, on 8th April, 2002, with an overwhelming majority representing 99.95% in value of members present and voting. With the passing of resolution by the shareholders of RPL the merger of RPL with RIL stood approved by shareholders of both RIL and RPL.
THE IMPACT FELT 1
What happened surely became a landmark in corporate India's history: the birth of a behemoth. The merged company had a turnover of Rs 58,000-crore (US$ 13.84 bn), equivalent to the turnover of 23 Infosyses or two A.V. Birla groups at that time. The merged company's annualized net profits were to be Rs 4,000-crore (US$ 954 mn) (nearly 30 per cent of the total profits of all private sector companies in India), while their total sales were to be a tidy 3 per cent of India's GDP. Its tax contribution was to be to the extent of 10 per cent of total indirect tax revenues of the Central government, its exports were to form 5 per cent of India's total exports and its stock was to command a 15 per cent weightage in the benchmark BSE Sensex.
THE SYNERGIES TALKED ABOUT
From a business angle, the merger offered immense synergies.
(a) Sales Tax Benefit:
Reliance Petroleum's Jamnagar refinery supplied some critical raw materials to the Hazira and Jamnagar complex of Reliance Industries Limited
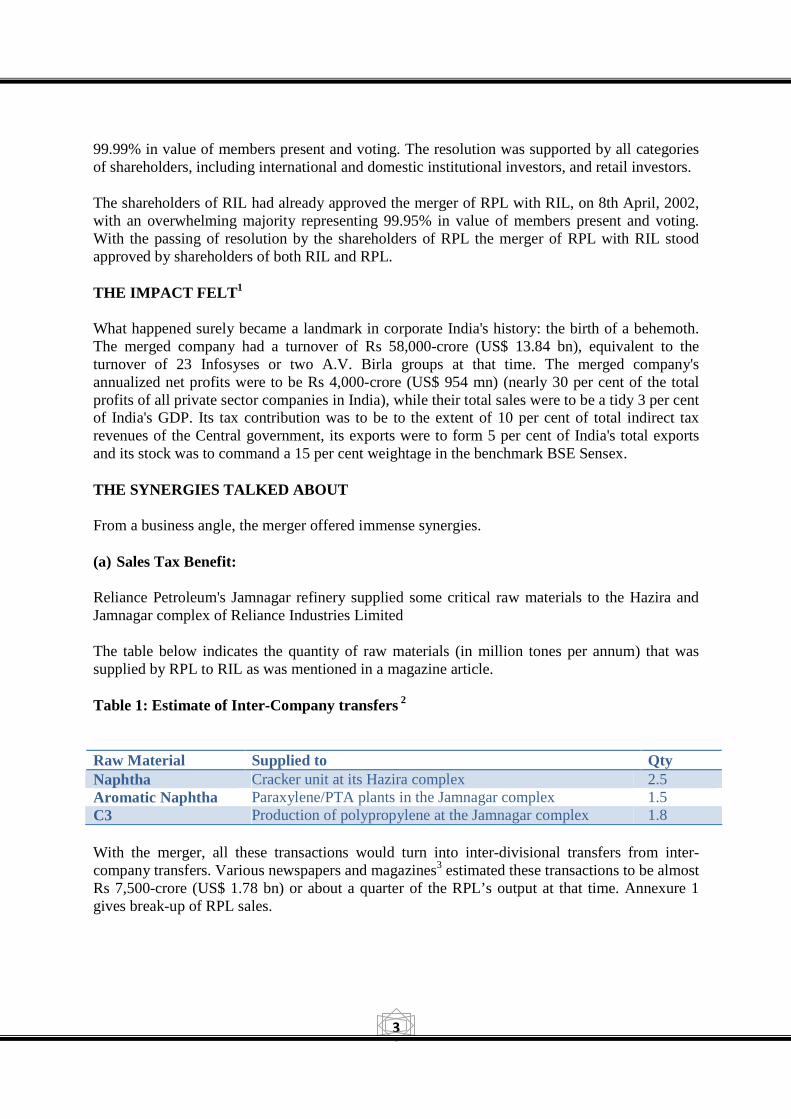
The table below indicates the quantity of raw materials (in million tones per annum) that was supplied by RPL to RIL as was mentioned in a magazine article.
Table 1: Estimate of Inter-Company transfers 2
Raw Material Supplied to Qty Naphtha Cracker unit at its Hazira complex 2.5 Aromatic Naphtha Paraxylene/PTA plants in the Jamnagar complex 1.5 C3 Production of polypropylene at the Jamnagar complex 1.8
With the merger, all these transactions would turn into inter-divisional transfers from inter-company transfers. Various newspapers and magazines3 estimated these transactions to be almost Rs 7,500-crore (US$ 1.78 bn) or about a quarter of the RPL’s output at that time. Annexure 1 gives break-up of RPL sales.
4
Gujarat government had given sales tax waiver to RPL. This waiver was predominantly being used for naphtha and propane sales to RIL. By merging two companies the sales tax benefit that RPL enjoyed would have been optimized
(b) Tax Shield Benefit
Reliance Petroleum was to bring with it additional tax shield in the form of depreciation. The book depreciation amounted to Rs 660.75-crore (US$ 0.157 bn) in FY 2000-01 and Rs 802-crore (US$ 0.19 bn) in FY 2001-02. This was to be a valuable tax shield for the merged entity considering the projected rise in polymer prices from end of 2002 resulting in Reliance Industries entering a period of high profit-growth. The depreciation cover that it generated could have been more valuable to Reliance Industries.
(c) Strong Balance Sheet of the combined entity – Tackle Oil Marketing Challenges
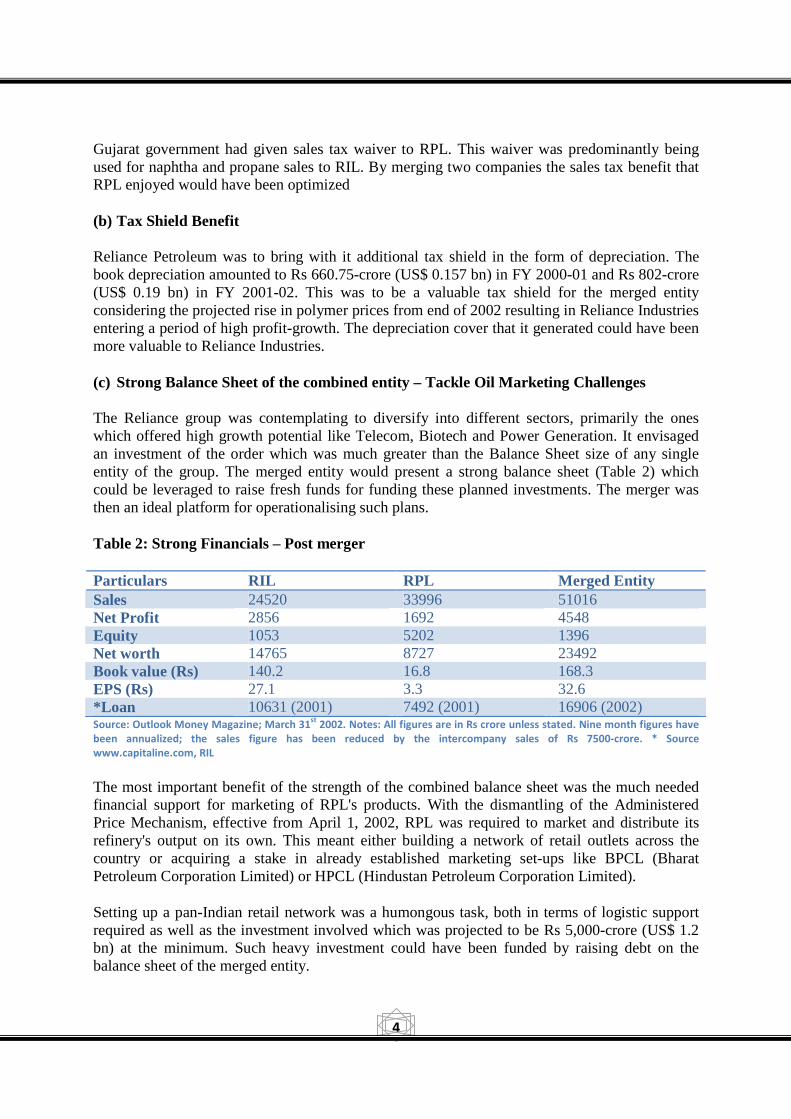
The Reliance group was contemplating to diversify into different sectors, primarily the ones which offered high growth potential like Telecom, Biotech and Power Generation. It envisaged an investment of the order which was much greater than the Balance Sheet size of any single entity of the group. The merged entity would present a strong balance sheet (Table 2) which could be leveraged to raise fresh funds for funding these planned investments. The merger was then an ideal platform for operationalising such plans.
Table 2: Strong Financials – Post merger
Particulars RIL RPL Merged Entity Sales 24520 33996 51016 Net Profit 2856 1692 4548 Equity 1053 5202 1396 Net worth 14765 8727 23492 Book value (Rs) 140.2 16.8 168.3 EPS (Rs) 27.1 3.3 32.6 *Loan 10631 (2001) 7492 (2001) 16906 (2002) Source: Outlook Money Magazine; March 31
st 2002. Notes: All figures are in Rs crore unless stated. Nine month figures have
been annualized; the sales figure has been reduced by the intercompany sales of Rs 7500-crore. * Source
www.capitaline.com, RIL
The most important benefit of the strength of the combined balance sheet was the much needed financial support for marketing of RPL's products. With the dismantling of the Administered Price Mechanism, effective from April 1, 2002, RPL was required to market and distribute its refinery's output on its own. This meant either building a network of retail outlets across the country or acquiring a stake in already established marketing set-ups like BPCL (Bharat Petroleum Corporation Limited) or HPCL (Hindustan Petroleum Corporation Limited).
Setting up a pan-Indian retail network was a humongous task, both in terms of logistic support required as well as the investment involved which was projected to be Rs 5,000-crore (US$ 1.2 bn) at the minimum. Such heavy investment could have been funded by raising debt on the balance sheet of the merged entity.
5
Acquiring a stake in an established marketing set-up like HPCL or BPCL would have provided RPL a crucial head start, compared to setting up the retail outlets. However considering the stiff competition it faced from international majors like Chevron, Exxon-Mobil & Shell in bidding for this stake, the price tag for either of these could have been upwards of Rs 5,500-crore (US$ 1.31 bn) (for the government's stake in one company, plus a 20 per cent open offer).
(d) Savings on the Interest:
RIL's debt rating post-merger was to remain the same at AAA+. RPL, however, had a slightly lower (AA) rating and consequently a relatively higher interest cost on its debt. The merger should have allowed the cost of this debt to be reduced to the levels enjoyed by RIL (50-100 basis points lower compared to RPL). RPL had a debt of Rs 7,000-8,000-crore (US$ 1.67 bn- US$ 1.90 bn) which after the merger could have been financed with fresh loans at lower rate. RPL had two debt instruments of non-convertible debentures - Rs 1,000-crore (US$ 0.24 bn) and Rs 5,000-crore (US$ 1.19 bn). Considering the proposed merger, Crisil had reaffirmed AAA and P1+ credit ratings for RIL and had placed RPL's existing AA+ credit rating on rating watch, with positive implications.
(e) Risk Diversification: In the global energy business, standalone refineries do not make a good business sense. Refining margins are thin and any business model that relies on oil refining alone cannot be profitable in the long run. It makes economic sense only when the entire chain of the oil business — from exploration to refining to marketing and distribution is integrated (see Annexure 2 for details). Before the merger, RIL was engaged in the upstream oil exploration and production (E&P) business as well as in petrochemicals whereas RPL was confined to refining. RIL’s gross margin was mainly affected by the price of naphtha, the feedstock for its cracker. With globalization, the growth and profitability of a firm was increasingly governed by the price of the end product. Merging with RPL would have insulated RIL against the volatility in naphtha prices and reduced volatility in its earnings. Moreover, RPL would have benefitted from a significant improvement in its business portfolio and acquired a wider spectrum of businesses – oil exploration and production, petrochemicals and telecommunication.
THE RPL STORY – FROM INCEPTION TILL BEFORE MERGER
The Project:
As a 1st step in the direction towards establishing a vertically integrated Reliance group, Reliance Refineries Pvt Ltd was incorporated in Sep.'91, which later got renamed to Reliance Petroleum (RPL) in Apr.'93.
The refinery project was initially conceived with a capacity of 9 mtpa, with a project cost of Rs 5142-crore (US$ 1.23 bn), comparable to the total size of the assets of RIL at that time. The project’s estimated time to completion was 5 years. However the project was delayed. The delays were explained by the fact that the group kept scaling up the proposed capacity – to 15 mtpa, 18 mtpa and eventually 27 mtpa. The refinery finally commenced production in Year 2000 at a project cost of Rs 14,250-crores (US$ 3.40 bn). It became the world's largest grassroots refinery
6
and the seventh largest refinery in the world at any single site coming at a cost which was a 30% discount on capital cost per tonne basis compared to some other refineries set up by other international companies during the same time, in Asia.4
RPL was amongst the most complex refineries in the region, with a Nelson’s complexity index of 9.93. The high degree of complexity indicated large secondary processing capacity, leading to higher value addition, and higher refining margins, as compared to less complex refineries. The refinery had been built adhering to the highest international standards of safety and environmental protection, and had the technical capability to deliver the products of international specifications, even beyond Euro II norms.
The Financing:
The refinery was floated as a part of separate company, Reliance Petroleum (RPL), promoted by Reliance Industries (RIL), instead of being built as a part of the RIL itself. Had that been the case then the funds for the project would have been acquired by issue of fresh equity of RIL at around the market price of RIL shares at that time (see Annexure 3 for details) and by taking fresh debt on the balance sheet of RIL. The prevalent debt/equity ratio for the projects of such nature and size used to be 1.5. However, the project finally commenced as a part of a separate company, RPL, and was initially financed through issue of securities whose design was revolutionary at that time.
The company(RPL) came out with a Rs 2,749-crore (US$ 0.65 bn) public issue of triple-option convertible debentures(TOCD)(See Annexure 4 for details), in Sep.'93, the largest ever public offering by an Indian company then, to part-finance the Rs 5,142-crore (US$ 1.22 bn) grass root refinery at Jamnagar, Gujarat. Many doubted Reliance’s ability to raise such large capital from the domestic market considering the project implementation period (estimated at around 5 years), before which not a single Rupee of revenue was to be generated. Also the sentiments were low in the Indian equity market on account of the mayhem created by the Harshad Mehta Scam (1992). However, the issue was oversubscribed, mainly on account of RIL’s tag and the inventive nature of TOCD. RPL enjoyed the support of 2 million international, domestic, institutional and retail shareholders. This was the second largest investor base in the Indian corporate sector next only to RIL.
The reason the instrument was designed in the manner can be explained as follows: The time before the first barrel of oil was to be refined was 5 years. The instrument was such that no cash out flow was expected during the first five years. Moreover, warrant conversions were allowed only after 48 months of the Initial Public Offer (September 1997). That was just 1 year before the expected commencement of the refinery operations. The management expected this fact to be reflected in the higher share price of RPL facilitating the conversion of warrants which in turn would have resulted in more funds coming into the Project to make possible any future expansions of the refinery. Moreover, the principal and the interest payment corresponding to the non convertible portion of the instrument were supposed to be paid out only during the 6th, 7th and 8th year after the IPO. By this time the Refinery was expected to be in its 1st, 2nd and 3rd year of operation respectively and would have been able to generate enough funds to service the payout. A Master Plan Indeed!!!
7
After 48 months of the IPO the project was already in its 5th year of existence and its commissioning was not expected for another at least 2-3 years. The delay was on account of increased capacity plans which also escalated the planned capital expenditure to almost three times that of the original. RPL was then on a look out for more funds since the moment to remit the non convertible part of the debentures was approaching and the revenue stream from the project was no where in picture.
In Sept 1997, when the warrant conversion was first allowed as per the original arrangement the shares of RPL were trading at Rs 22 where as the non- convertible debenture was trading at around Rs. 48 and the two warrants could be sold for Rs 5 each in the market. Thus the value of Debentures and the two options was more than the value of the two shares.
In order to make warrant conversion a possible option at that time and to make it more attractive to the investors the Reliance Petroleum board decided to offer a fourth option to TOCD holders The fourth option gave the investors an option to convert their non-convertible portion of the TOCD into three equity shares at a price of Rs 10, Rs 15 and Rs 15 to be issued in 1999, 2000 and 2001 respectively. The cost per share would have worked out to around Rs 13.3 per share. But if one added to it the interest cost which the investor would lose, the actual cost of an equity share would work out to between Rs 22-23, assuming an interest cost of 12 per cent per annum. Thus the conversion of the non-convertible portion hardly provided any gain to the investors which they would not have realized in case they opted to hold onto the non-convertible portion to maturity. And thus many investors chose not to convert.
The significance of this option becomes clear in the light of the fact that if all TOCD holders did not opt for the fourth option then equity shares to the extent of the unconverted portion of TOCDs (i.e. three equity shares per NCD) would have been offered to the promoter (RIL) on the same terms as that to the TOCD holders i.e., 3 shares for Rs 40.
In other financial transactions (unrelated to the TOCDs as discussed above), the promoter (RIL) directly, RIL associates and RIIHL subscribed to huge convertible debenture issues of RPL which later helped them to together acquire a majority equity stake in the finally fully diluted shareholding of RPL at terms that were favorable to them (RIL, RIL associates, RIIHL) (see Annexure 4 for details).
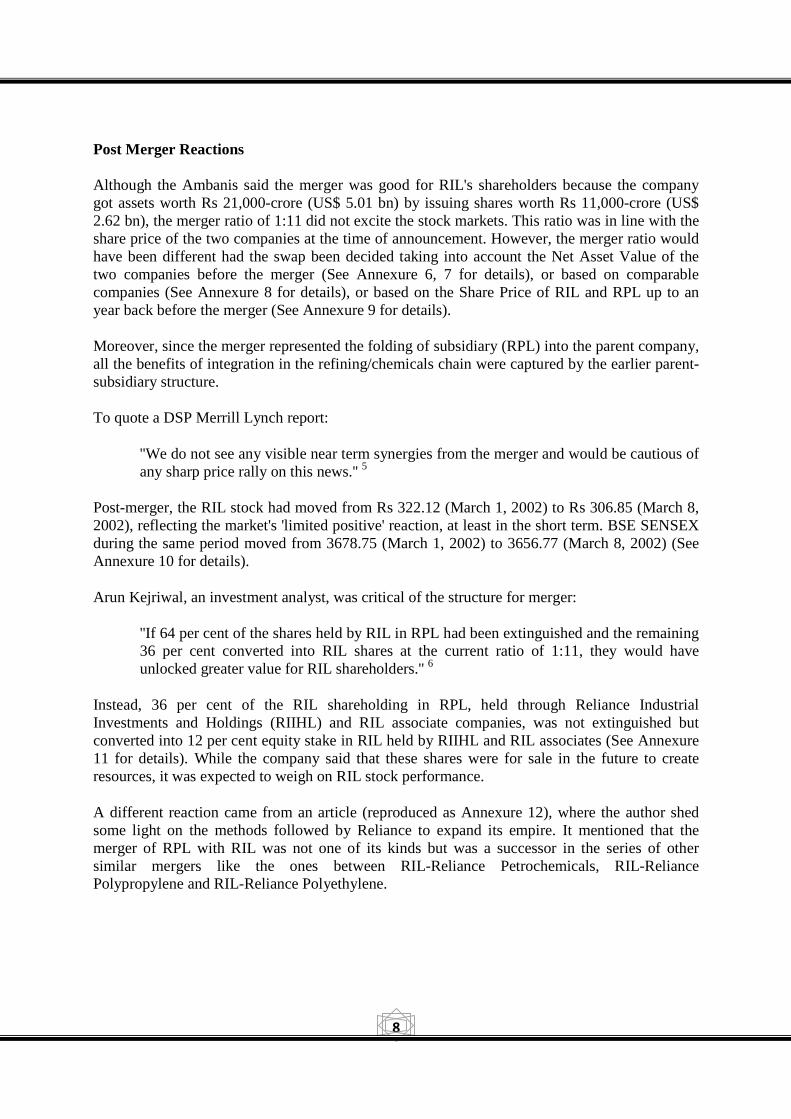
As a result of the various measures adopted to finance RPL (See Annexure 5 for details) from the time of its inception till just before the merger, the share holding structure of RPL stood as indicated in the table below:
Particular Percent Holding (%) Promoter
• RIL 28 • RIIHL 22 • RIL Associates 14
Total Promoter Holding 64 Minority Share Holding 36 Total Holding 100
8
Post Merger Reactions
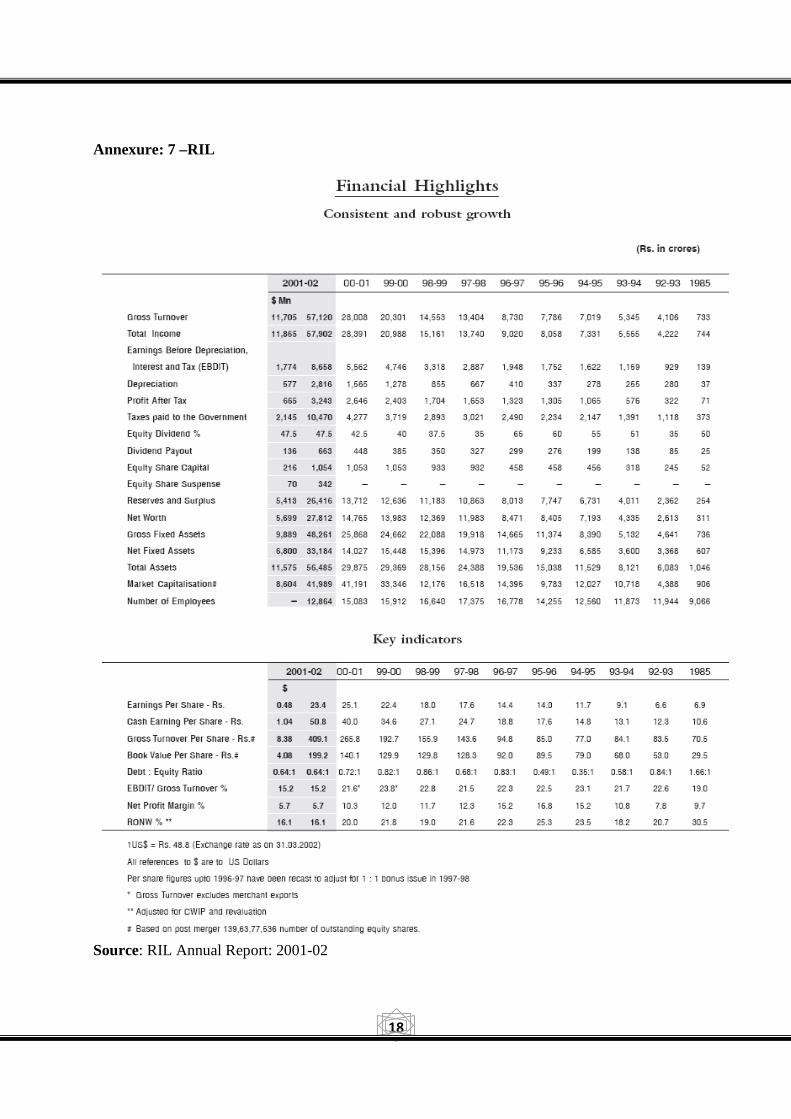
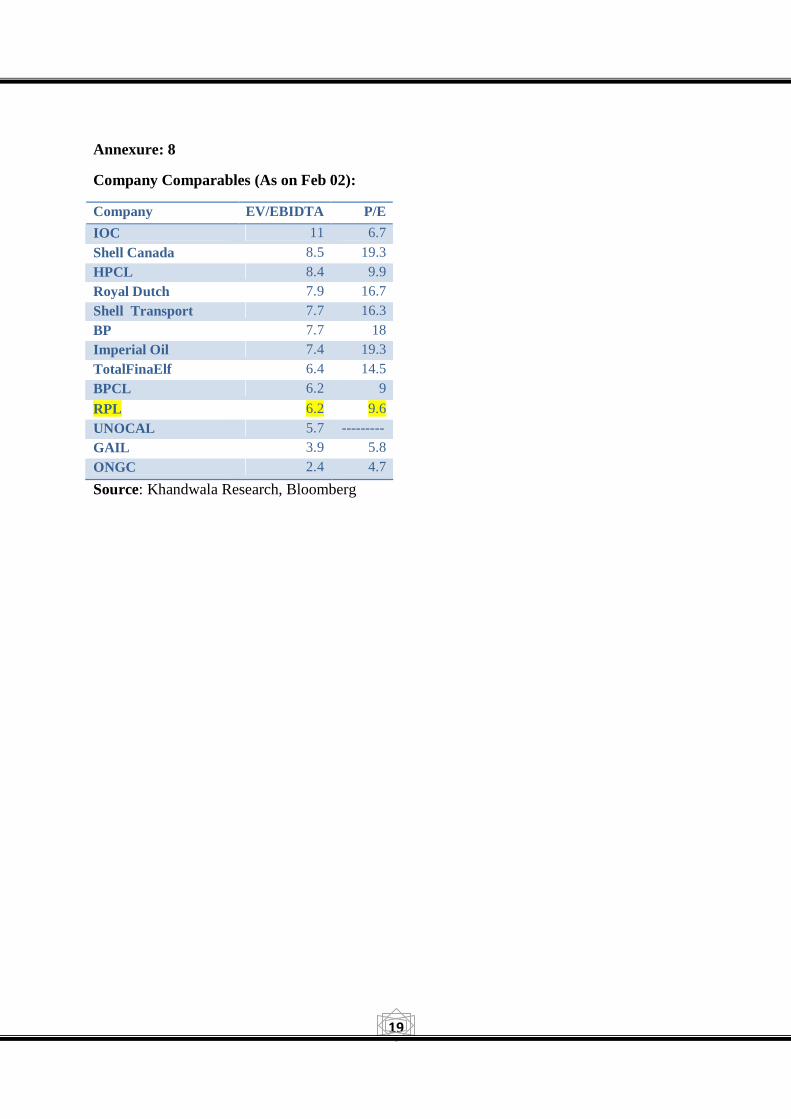
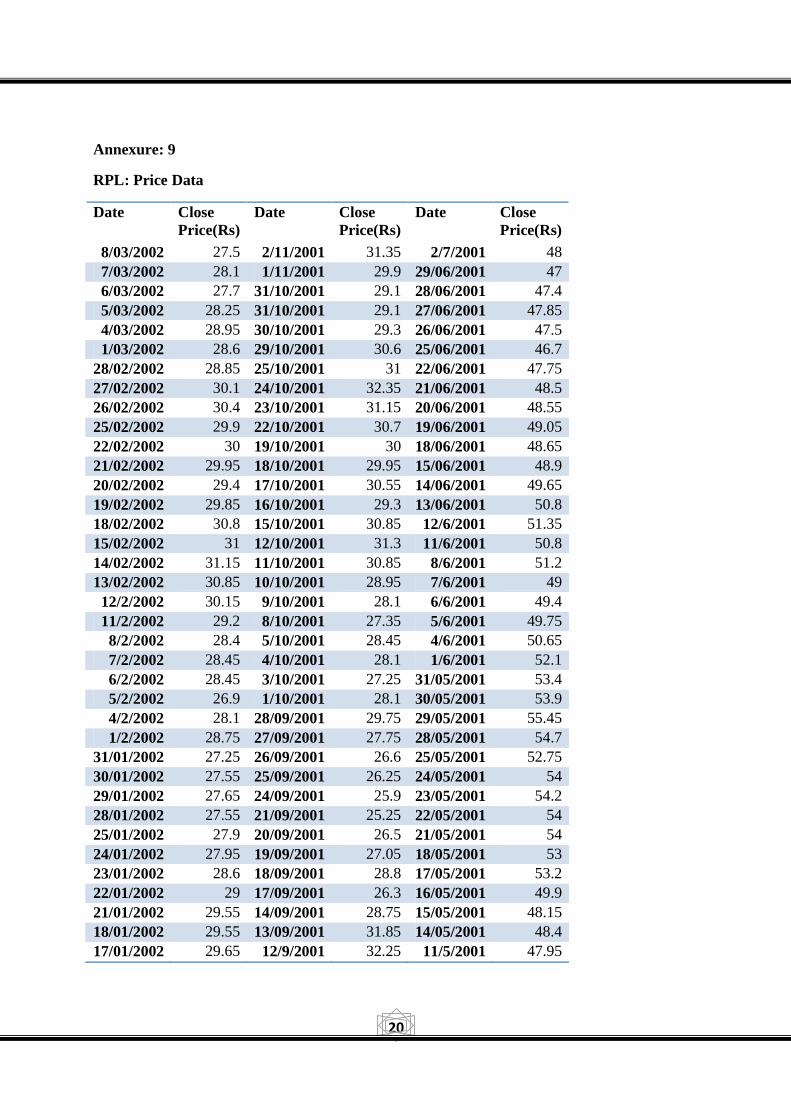
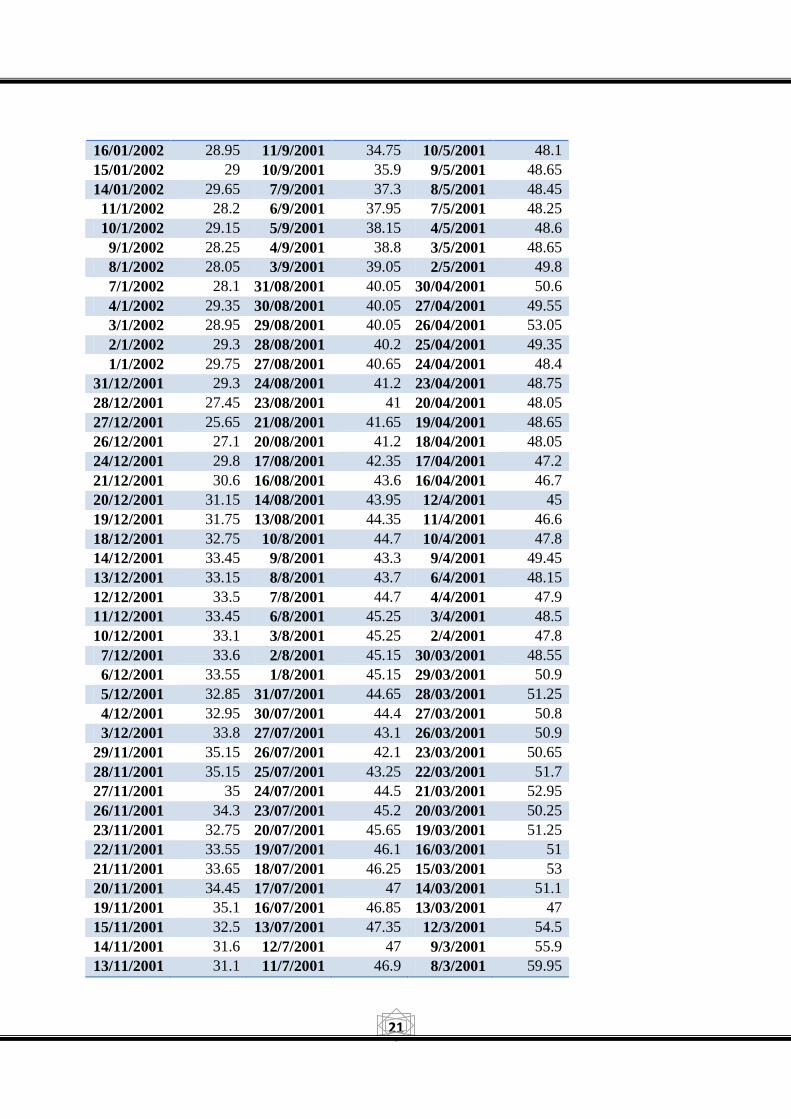
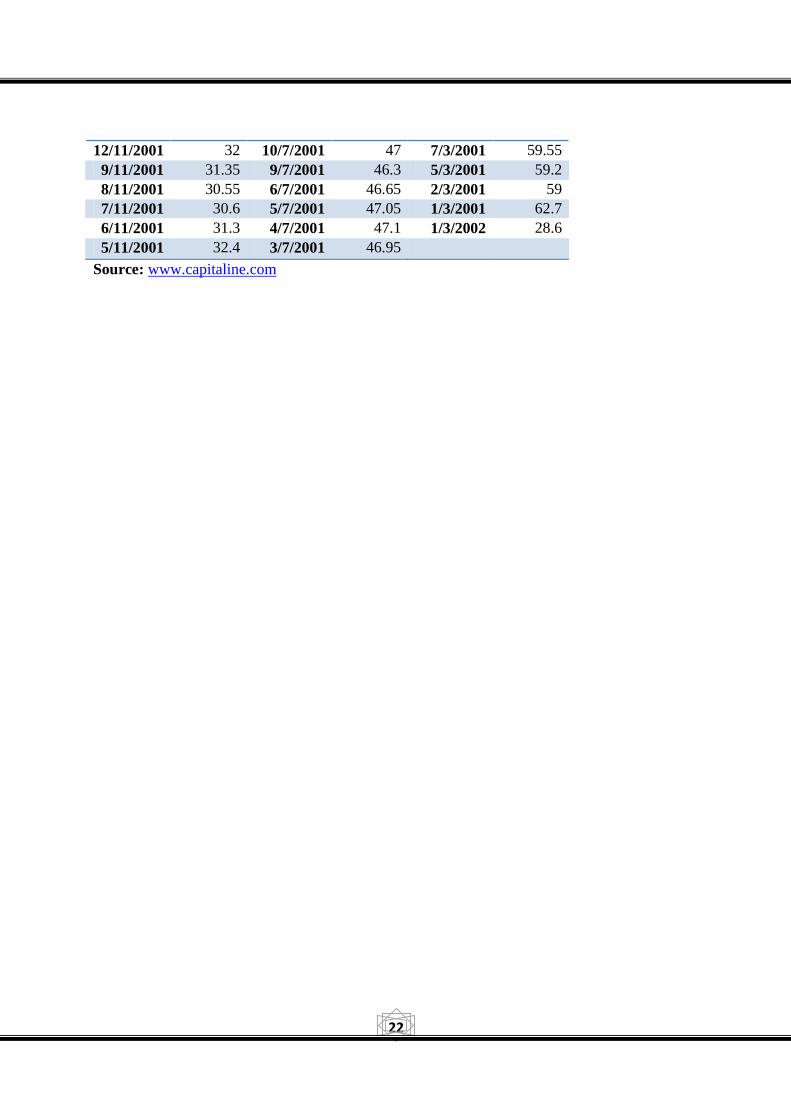
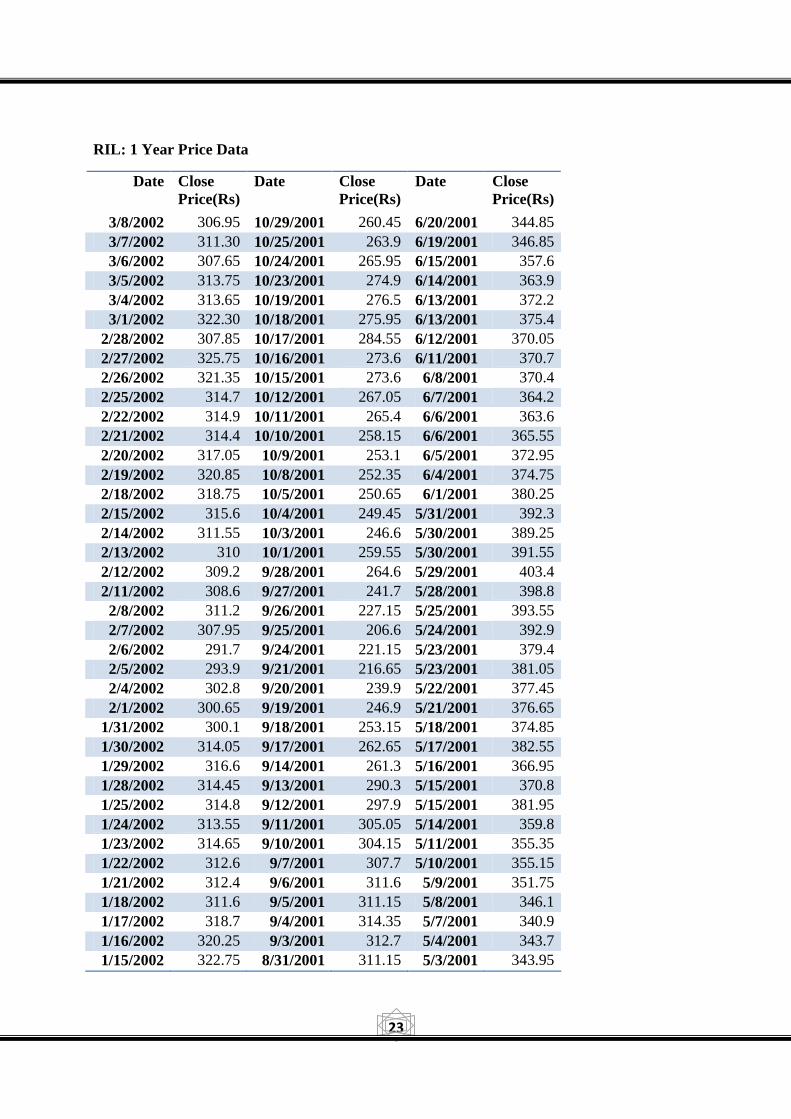
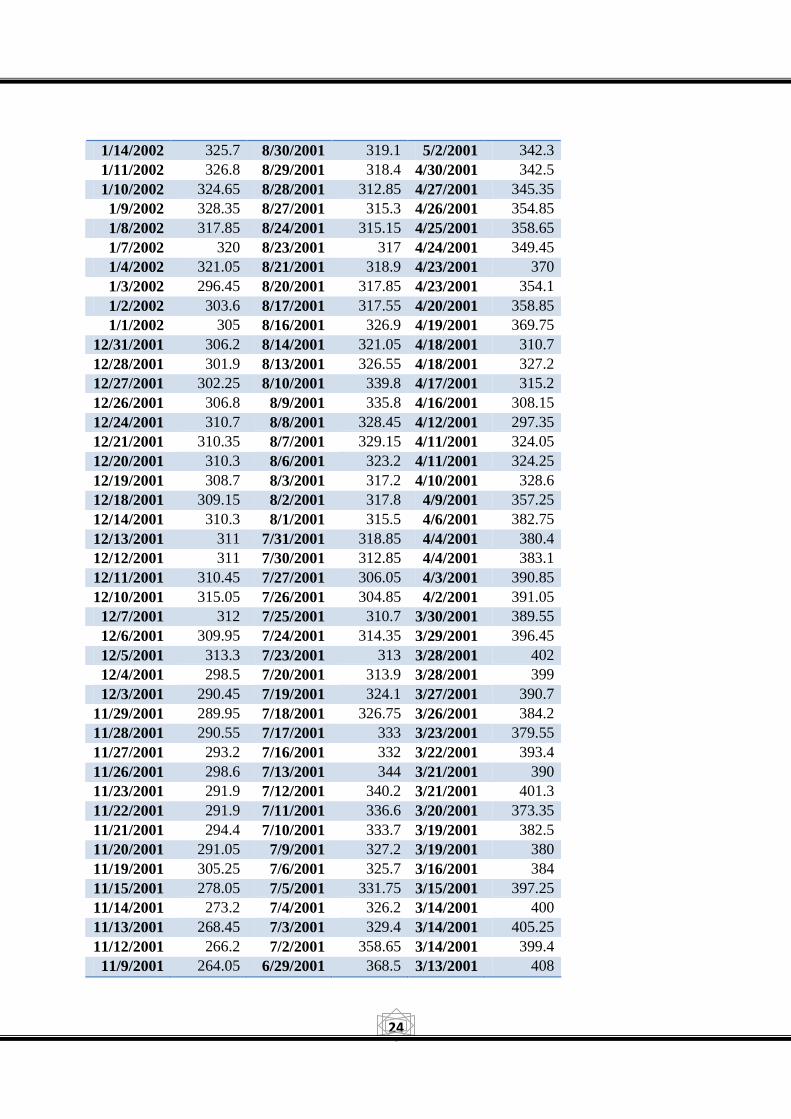
Although the Ambanis said the merger was good for RIL's shareholders because the company got assets worth Rs 21,000-crore (US$ 5.01 bn) by issuing shares worth Rs 11,000-crore (US$ 2.62 bn), the merger ratio of 1:11 did not excite the stock markets. This ratio was in line with the share price of the two companies at the time of announcement. However, the merger ratio would have been different had the swap been decided taking into account the Net Asset Value of the two companies before the merger (See Annexure 6, 7 for details), or based on comparable companies (See Annexure 8 for details), or based on the Share Price of RIL and RPL up to an year back before the merger (See Annexure 9 for details).
Moreover, since the merger represented the folding of subsidiary (RPL) into the parent company, all the benefits of integration in the refining/chemicals chain were captured by the earlier parent-subsidiary structure.
To quote a DSP Merrill Lynch report:
''We do not see any visible near term synergies from the merger and would be cautious of any sharp price rally on this news.'' 5
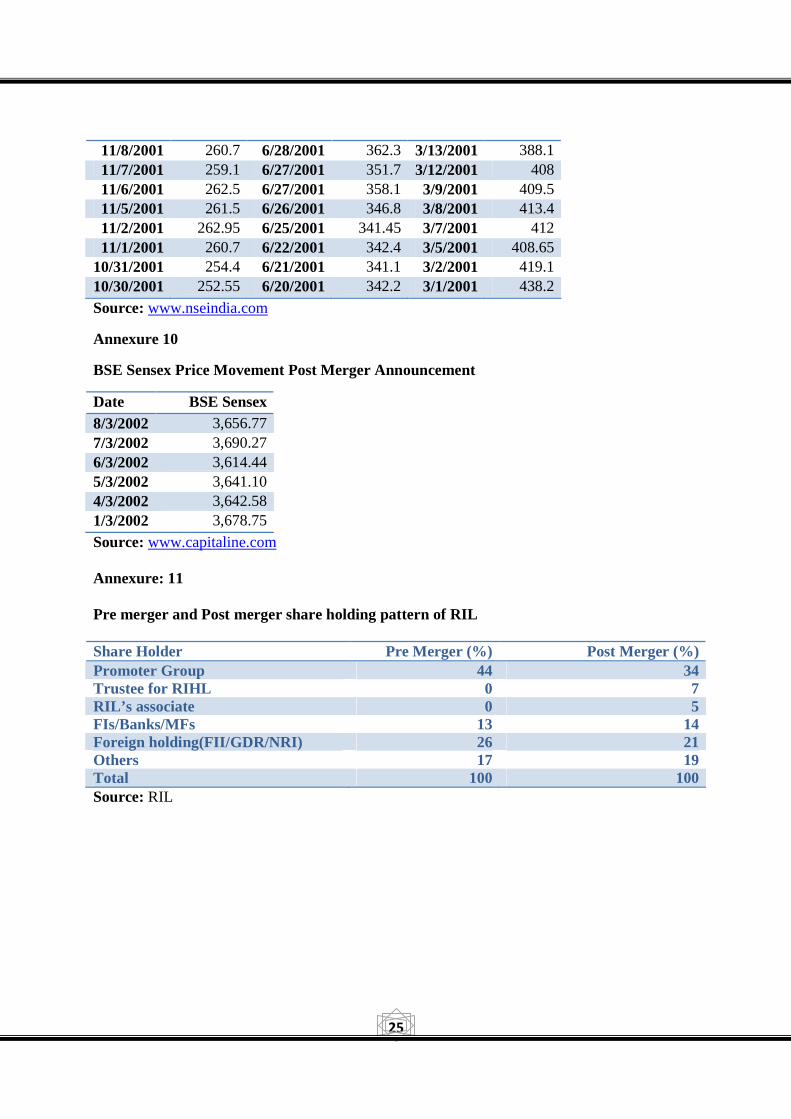
Post-merger, the RIL stock had moved from Rs 322.12 (March 1, 2002) to Rs 306.85 (March 8, 2002), reflecting the market's 'limited positive' reaction, at least in the short term. BSE SENSEX during the same period moved from 3678.75 (March 1, 2002) to 3656.77 (March 8, 2002) (See Annexure 10 for details).
Arun Kejriwal, an investment analyst, was critical of the structure for merger:
''If 64 per cent of the shares held by RIL in RPL had been extinguished and the remaining 36 per cent converted into RIL shares at the current ratio of 1:11, they would have unlocked greater value for RIL shareholders.'' 6
Instead, 36 per cent of the RIL shareholding in RPL, held through Reliance Industrial Investments and Holdings (RIIHL) and RIL associate companies, was not extinguished but converted into 12 per cent equity stake in RIL held by RIIHL and RIL associates (See Annexure 11 for details). While the company said that these shares were for sale in the future to create resources, it was expected to weigh on RIL stock performance.
A different reaction came from an article (reproduced as Annexure 12), where the author shed some light on the methods followed by Reliance to expand its empire. It mentioned that the merger of RPL with RIL was not one of its kinds but was a successor in the series of other similar mergers like the ones between RIL-Reliance Petrochemicals, RIL-Reliance Polypropylene and RIL-Reliance Polyethylene.
9
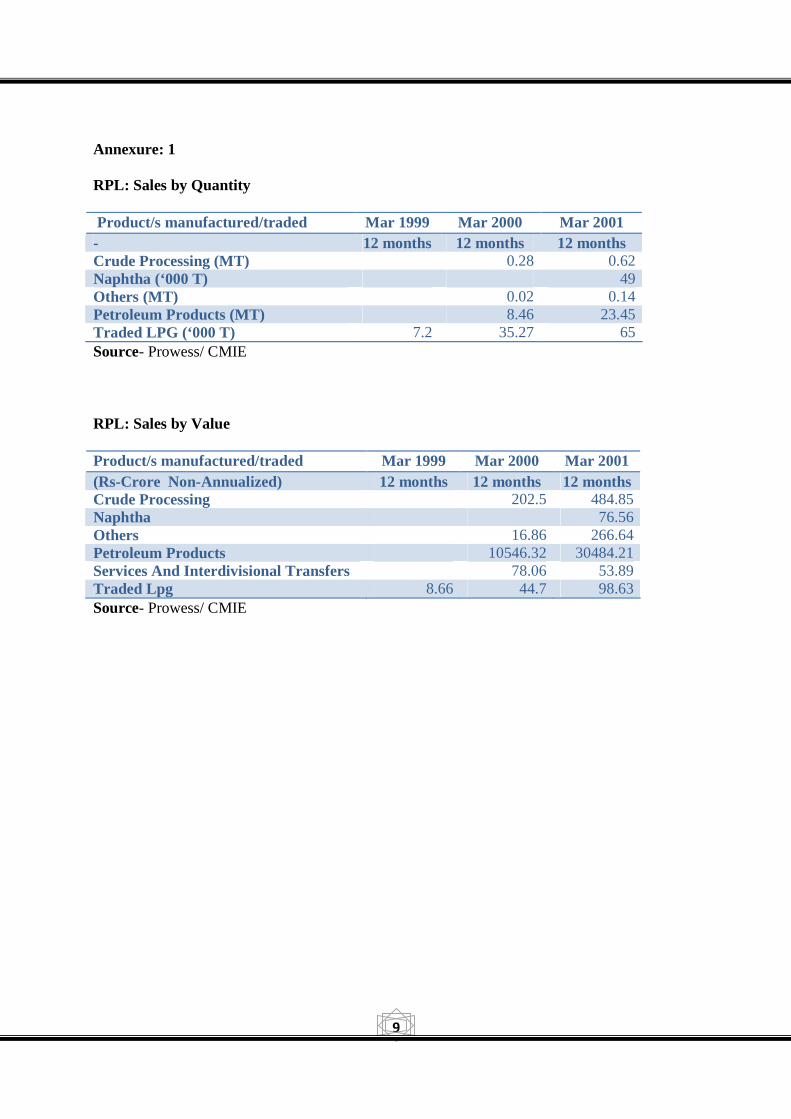
Annexure: 1
RPL: Sales by Quantity
Product/s manufactured/traded Mar 1999 Mar 2000 Mar 2001 - 12 months 12 months 12 months Crude Processing (MT) 0.28 0.62 Naphtha (‘000 T) 49 Others (MT) 0.02 0.14 Petroleum Products (MT) 8.46 23.45 Traded LPG (‘000 T) 7.2 35.27 65 Source- Prowess/ CMIE
RPL: Sales by Value
Product/s manufactured/traded Mar 1999 Mar 2000 Mar 2001 (Rs-Crore Non-Annualized) 12 months 12 months 12 months Crude Processing 202.5 484.85 Naphtha 76.56 Others 16.86 266.64 Petroleum Products 10546.32 30484.21 Services And Interdivisional Transfers 78.06 53.89 Traded Lpg 8.66 44.7 98.63 Source- Prowess/ CMIE

10
Annexure: 2 – Vertically Integrated RIL
Source: RIL
11
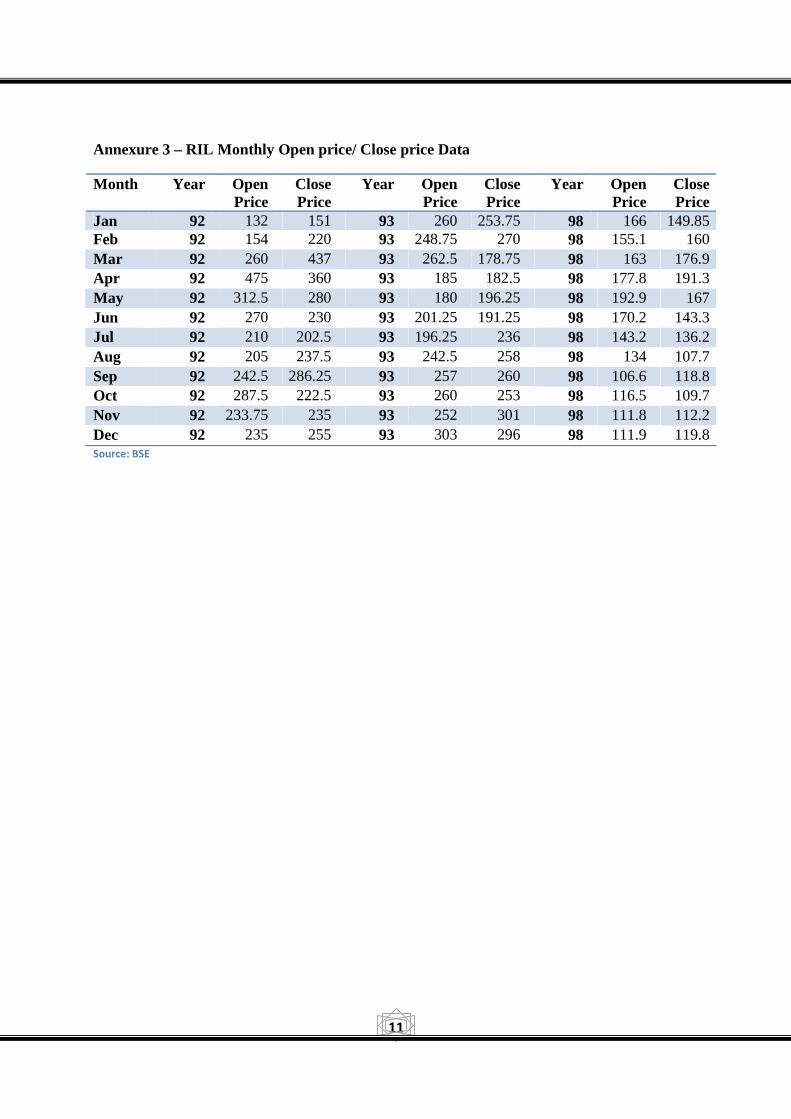
Annexure 3 – RIL Monthly Open price/ Close price Data
Month Year Open Price
Close Price
Year Open Price
Close Price
Year Open Price
Close Price
Jan 92 132 151 93 260 253.75 98 166 149.85 Feb 92 154 220 93 248.75 270 98 155.1 160 Mar 92 260 437 93 262.5 178.75 98 163 176.9 Apr 92 475 360 93 185 182.5 98 177.8 191.3 May 92 312.5 280 93 180 196.25 98 192.9 167 Jun 92 270 230 93 201.25 191.25 98 170.2 143.3 Jul 92 210 202.5 93 196.25 236 98 143.2 136.2 Aug 92 205 237.5 93 242.5 258 98 134 107.7 Sep 92 242.5 286.25 93 257 260 98 106.6 118.8 Oct 92 287.5 222.5 93 260 253 98 116.5 109.7 Nov 92 233.75 235 93 252 301 98 111.8 112.2 Dec 92 235 255 93 303 296 98 111.9 119.8 Source: BSE
12
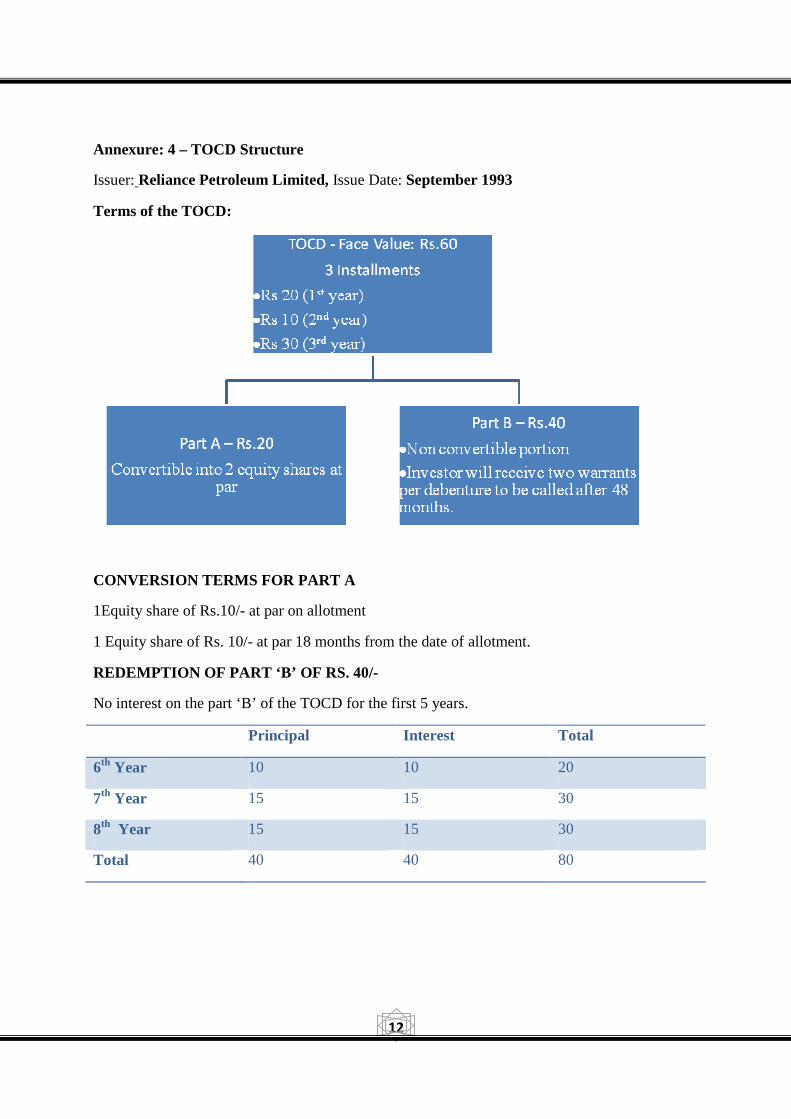
Annexure: 4 – TOCD Structure
Issuer: Reliance Petroleum Limited, Issue Date: September 1993
Terms of the TOCD:
CONVERSION TERMS FOR PART A
1Equity share of Rs.10/- at par on allotment
1 Equity share of Rs. 10/- at par 18 months from the date of allotment.
REDEMPTION OF PART ‘B’ OF RS. 40/-
No interest on the part ‘B’ of the TOCD for the first 5 years.
Principal Interest Total
6th Year 10 10 20
7th Year 15 15 30
8th Year 15 15 30
Total 40 40 80
13
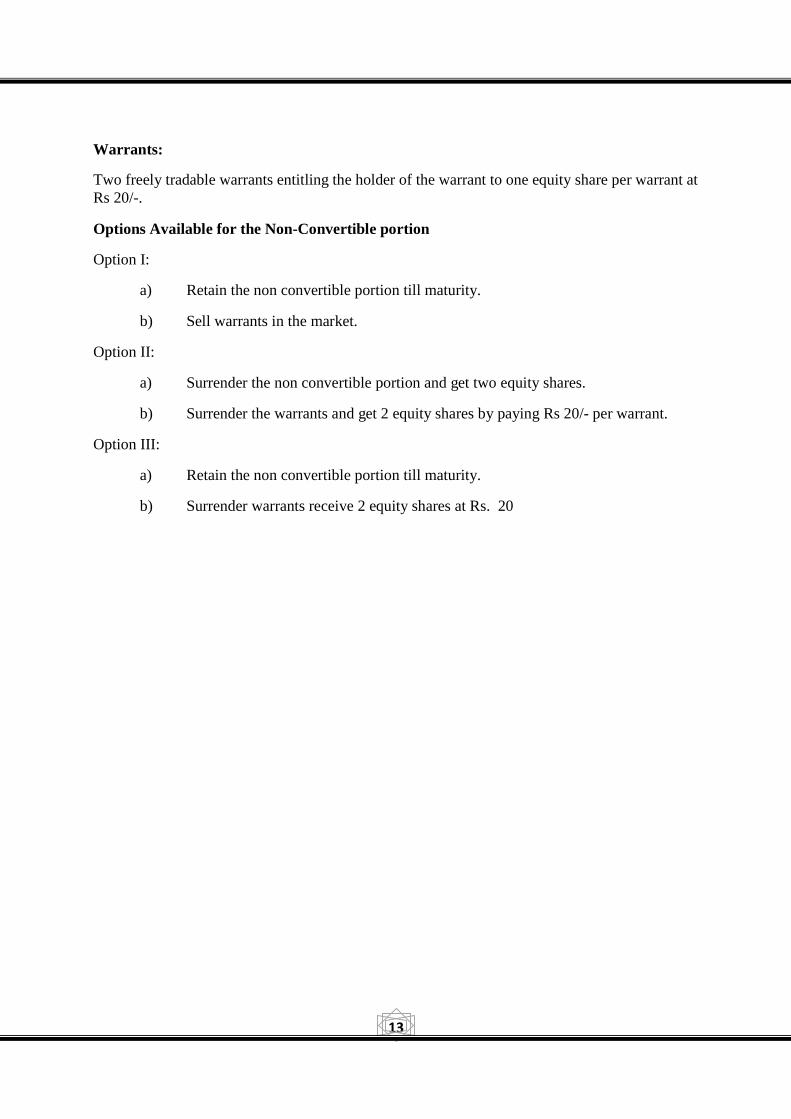
Warrants:
Two freely tradable warrants entitling the holder of the warrant to one equity share per warrant at Rs 20/-.
Options Available for the Non-Convertible portion
Option I:
a) Retain the non convertible portion till maturity.
b) Sell warrants in the market.
Option II:
a) Surrender the non convertible portion and get two equity shares.
b) Surrender the warrants and get 2 equity shares by paying Rs 20/- per warrant.
Option III:
a) Retain the non convertible portion till maturity.
b) Surrender warrants receive 2 equity shares at Rs. 20
14
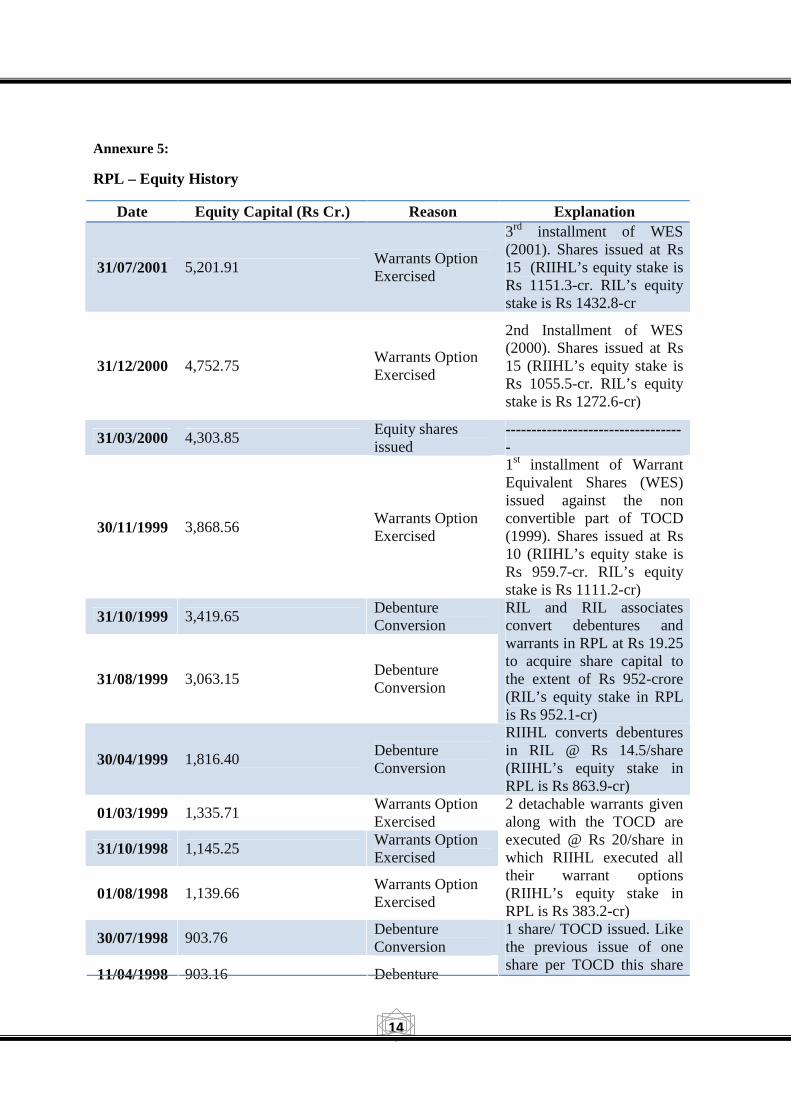
Annexure 5:
RPL – Equity History
Date Equity Capital (Rs Cr.) Reason Explanation
31/07/2001 5,201.91 Warrants Option Exercised
3rd installment of WES (2001). Shares issued at Rs 15 (RIIHL’s equity stake is Rs 1151.3-cr. RIL’s equity stake is Rs 1432.8-cr
31/12/2000 4,752.75 Warrants Option Exercised
2nd Installment of WES (2000). Shares issued at Rs 15 (RIIHL’s equity stake is Rs 1055.5-cr. RIL’s equity stake is Rs 1272.6-cr)
31/03/2000 4,303.85 Equity shares issued
-----------------------------------
30/11/1999 3,868.56 Warrants Option Exercised
1st installment of Warrant Equivalent Shares (WES) issued against the non convertible part of TOCD (1999). Shares issued at Rs 10 (RIIHL’s equity stake is Rs 959.7-cr. RIL’s equity stake is Rs 1111.2-cr)
31/10/1999 3,419.65 Debenture Conversion
31/08/1999 3,063.15 Debenture Conversion
RIL and RIL associates convert debentures and warrants in RPL at Rs 19.25 to acquire share capital to the extent of Rs 952-crore (RIL’s equity stake in RPL is Rs 952.1-cr)
30/04/1999 1,816.40 Debenture Conversion
RIIHL converts debentures in RIL @ Rs 14.5/share (RIIHL’s equity stake in RPL is Rs 863.9-cr)
01/03/1999 1,335.71 Warrants Option Exercised
31/10/1998 1,145.25 Warrants Option Exercised
01/08/1998 1,139.66 Warrants Option Exercised
2 detachable warrants given along with the TOCD are executed @ Rs 20/share in which RIIHL executed all their warrant options (RIIHL’s equity stake in RPL is Rs 383.2-cr)
30/07/1998 903.76 Debenture Conversion
11/04/1998 903.16 Debenture
1 share/ TOCD issued. Like the previous issue of one share per TOCD this share
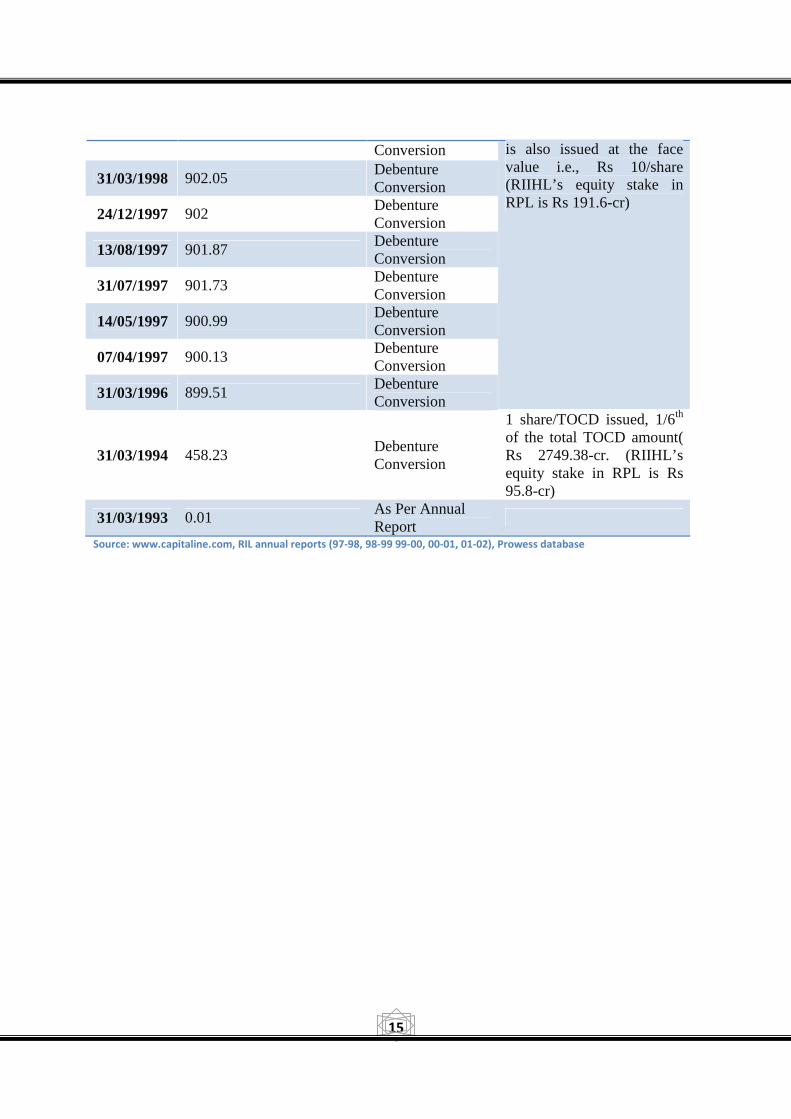
15
Conversion
31/03/1998 902.05 Debenture Conversion
24/12/1997 902 Debenture Conversion
13/08/1997 901.87 Debenture Conversion
31/07/1997 901.73 Debenture Conversion
14/05/1997 900.99 Debenture Conversion
07/04/1997 900.13 Debenture Conversion
31/03/1996 899.51 Debenture Conversion
is also issued at the face value i.e., Rs 10/share (RIIHL’s equity stake in RPL is Rs 191.6-cr)
31/03/1994 458.23 Debenture Conversion
1 share/TOCD issued, 1/6th of the total TOCD amount( Rs 2749.38-cr. (RIIHL’s equity stake in RPL is Rs 95.8-cr)
31/03/1993 0.01 As Per Annual Report
Source: www.capitaline.com, RIL annual reports (97-98, 98-99 99-00, 00-01, 01-02), Prowess database
16
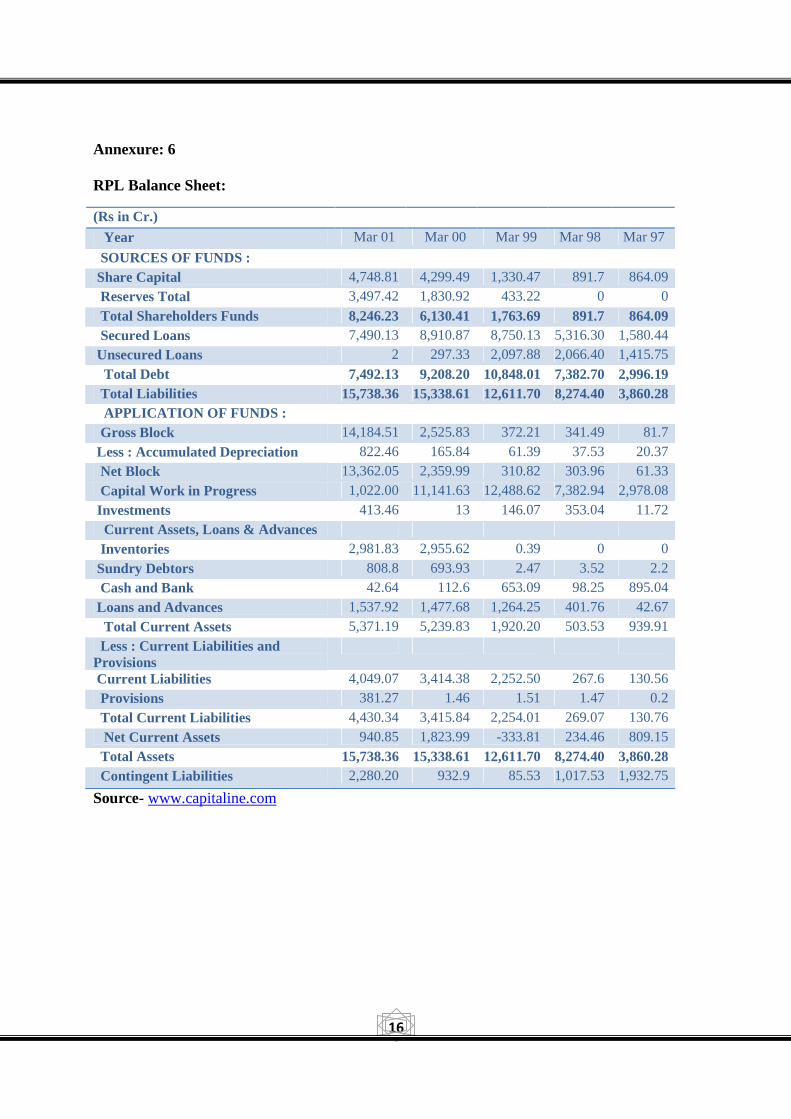
Annexure: 6
RPL Balance Sheet:
(Rs in Cr.)
Year Mar 01 Mar 00 Mar 99 Mar 98 Mar 97
SOURCES OF FUNDS :
Share Capital 4,748.81 4,299.49 1,330.47 891.7 864.09 Reserves Total 3,497.42 1,830.92 433.22 0 0
Total Shareholders Funds 8,246.23 6,130.41 1,763.69 891.7 864.09 Secured Loans 7,490.13 8,910.87 8,750.13 5,316.30 1,580.44 Unsecured Loans 2 297.33 2,097.88 2,066.40 1,415.75
Total Debt 7,492.13 9,208.20 10,848.01 7,382.70 2,996.19 Total Liabilities 15,738.36 15,338.61 12,611.70 8,274.40 3,860.28 APPLICATION OF FUNDS :
Gross Block 14,184.51 2,525.83 372.21 341.49 81.7
Less : Accumulated Depreciation 822.46 165.84 61.39 37.53 20.37 Net Block 13,362.05 2,359.99 310.82 303.96 61.33
Capital Work in Progress 1,022.00 11,141.63 12,488.62 7,382.94 2,978.08
Investments 413.46 13 146.07 353.04 11.72 Current Assets, Loans & Advances
Inventories 2,981.83 2,955.62 0.39 0 0
Sundry Debtors 808.8 693.93 2.47 3.52 2.2 Cash and Bank 42.64 112.6 653.09 98.25 895.04
Loans and Advances 1,537.92 1,477.68 1,264.25 401.76 42.67
Total Current Assets 5,371.19 5,239.83 1,920.20 503.53 939.91 Less : Current Liabilities and Provisions
Current Liabilities 4,049.07 3,414.38 2,252.50 267.6 130.56 Provisions 381.27 1.46 1.51 1.47 0.2
Total Current Liabilities 4,430.34 3,415.84 2,254.01 269.07 130.76
Net Current Assets 940.85 1,823.99 -333.81 234.46 809.15 Total Assets 15,738.36 15,338.61 12,611.70 8,274.40 3,860.28 Contingent Liabilities 2,280.20 932.9 85.53 1,017.53 1,932.75
Source- www.capitaline.com
17
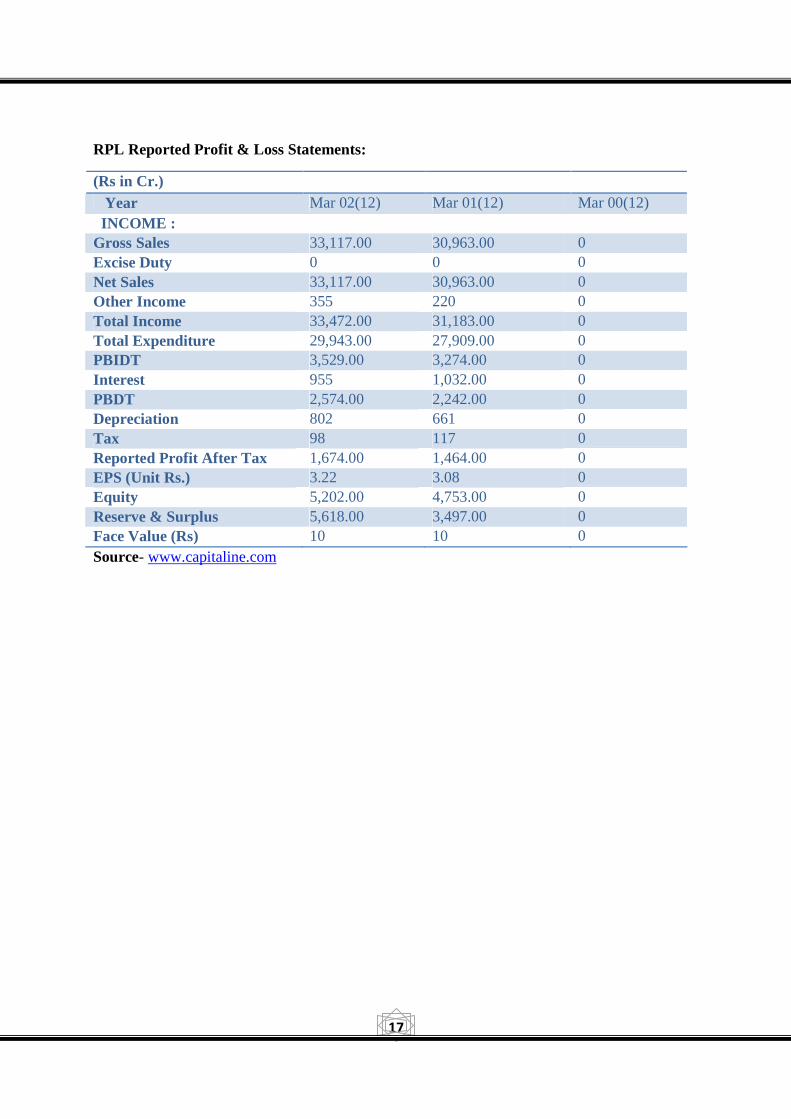
RPL Reported Profit & Loss Statements:
(Rs in Cr.) Year Mar 02(12) Mar 01(12) Mar 00(12) INCOME : Gross Sales 33,117.00 30,963.00 0 Excise Duty 0 0 0 Net Sales 33,117.00 30,963.00 0 Other Income 355 220 0 Total Income 33,472.00 31,183.00 0 Total Expenditure 29,943.00 27,909.00 0 PBIDT 3,529.00 3,274.00 0 Interest 955 1,032.00 0 PBDT 2,574.00 2,242.00 0 Depreciation 802 661 0 Tax 98 117 0 Reported Profit After Tax 1,674.00 1,464.00 0 EPS (Unit Rs.) 3.22 3.08 0 Equity 5,202.00 4,753.00 0 Reserve & Surplus 5,618.00 3,497.00 0 Face Value (Rs) 10 10 0 Source- www.capitaline.com
18
Annexure: 7 –RIL
Source: RIL Annual Report: 2001-02
19
Annexure: 8
Company Comparables (As on Feb 02):
Company EV/EBIDTA P/E
IOC 11 6.7
Shell Canada 8.5 19.3
HPCL 8.4 9.9 Royal Dutch 7.9 16.7
Shell Transport 7.7 16.3
BP 7.7 18 Imperial Oil 7.4 19.3
TotalFinaElf 6.4 14.5
BPCL 6.2 9
RPL 6.2 9.6
UNOCAL 5.7 --------- GAIL 3.9 5.8
ONGC 2.4 4.7
Source: Khandwala Research, Bloomberg
20
Annexure: 9
RPL: Price Data
Date Close Price(Rs)
Date Close Price(Rs)
Date Close Price(Rs)
8/03/2002 27.5 2/11/2001 31.35 2/7/2001 48 7/03/2002 28.1 1/11/2001 29.9 29/06/2001 47 6/03/2002 27.7 31/10/2001 29.1 28/06/2001 47.4 5/03/2002 28.25 31/10/2001 29.1 27/06/2001 47.85 4/03/2002 28.95 30/10/2001 29.3 26/06/2001 47.5 1/03/2002 28.6 29/10/2001 30.6 25/06/2001 46.7
28/02/2002 28.85 25/10/2001 31 22/06/2001 47.75 27/02/2002 30.1 24/10/2001 32.35 21/06/2001 48.5 26/02/2002 30.4 23/10/2001 31.15 20/06/2001 48.55 25/02/2002 29.9 22/10/2001 30.7 19/06/2001 49.05 22/02/2002 30 19/10/2001 30 18/06/2001 48.65 21/02/2002 29.95 18/10/2001 29.95 15/06/2001 48.9 20/02/2002 29.4 17/10/2001 30.55 14/06/2001 49.65 19/02/2002 29.85 16/10/2001 29.3 13/06/2001 50.8 18/02/2002 30.8 15/10/2001 30.85 12/6/2001 51.35 15/02/2002 31 12/10/2001 31.3 11/6/2001 50.8 14/02/2002 31.15 11/10/2001 30.85 8/6/2001 51.2 13/02/2002 30.85 10/10/2001 28.95 7/6/2001 49 12/2/2002 30.15 9/10/2001 28.1 6/6/2001 49.4 11/2/2002 29.2 8/10/2001 27.35 5/6/2001 49.75 8/2/2002 28.4 5/10/2001 28.45 4/6/2001 50.65 7/2/2002 28.45 4/10/2001 28.1 1/6/2001 52.1 6/2/2002 28.45 3/10/2001 27.25 31/05/2001 53.4 5/2/2002 26.9 1/10/2001 28.1 30/05/2001 53.9 4/2/2002 28.1 28/09/2001 29.75 29/05/2001 55.45 1/2/2002 28.75 27/09/2001 27.75 28/05/2001 54.7
31/01/2002 27.25 26/09/2001 26.6 25/05/2001 52.75 30/01/2002 27.55 25/09/2001 26.25 24/05/2001 54 29/01/2002 27.65 24/09/2001 25.9 23/05/2001 54.2 28/01/2002 27.55 21/09/2001 25.25 22/05/2001 54 25/01/2002 27.9 20/09/2001 26.5 21/05/2001 54 24/01/2002 27.95 19/09/2001 27.05 18/05/2001 53 23/01/2002 28.6 18/09/2001 28.8 17/05/2001 53.2 22/01/2002 29 17/09/2001 26.3 16/05/2001 49.9 21/01/2002 29.55 14/09/2001 28.75 15/05/2001 48.15 18/01/2002 29.55 13/09/2001 31.85 14/05/2001 48.4 17/01/2002 29.65 12/9/2001 32.25 11/5/2001 47.95
21
16/01/2002 28.95 11/9/2001 34.75 10/5/2001 48.1 15/01/2002 29 10/9/2001 35.9 9/5/2001 48.65 14/01/2002 29.65 7/9/2001 37.3 8/5/2001 48.45 11/1/2002 28.2 6/9/2001 37.95 7/5/2001 48.25 10/1/2002 29.15 5/9/2001 38.15 4/5/2001 48.6 9/1/2002 28.25 4/9/2001 38.8 3/5/2001 48.65 8/1/2002 28.05 3/9/2001 39.05 2/5/2001 49.8 7/1/2002 28.1 31/08/2001 40.05 30/04/2001 50.6 4/1/2002 29.35 30/08/2001 40.05 27/04/2001 49.55 3/1/2002 28.95 29/08/2001 40.05 26/04/2001 53.05 2/1/2002 29.3 28/08/2001 40.2 25/04/2001 49.35 1/1/2002 29.75 27/08/2001 40.65 24/04/2001 48.4
31/12/2001 29.3 24/08/2001 41.2 23/04/2001 48.75 28/12/2001 27.45 23/08/2001 41 20/04/2001 48.05 27/12/2001 25.65 21/08/2001 41.65 19/04/2001 48.65 26/12/2001 27.1 20/08/2001 41.2 18/04/2001 48.05 24/12/2001 29.8 17/08/2001 42.35 17/04/2001 47.2 21/12/2001 30.6 16/08/2001 43.6 16/04/2001 46.7 20/12/2001 31.15 14/08/2001 43.95 12/4/2001 45 19/12/2001 31.75 13/08/2001 44.35 11/4/2001 46.6 18/12/2001 32.75 10/8/2001 44.7 10/4/2001 47.8 14/12/2001 33.45 9/8/2001 43.3 9/4/2001 49.45 13/12/2001 33.15 8/8/2001 43.7 6/4/2001 48.15 12/12/2001 33.5 7/8/2001 44.7 4/4/2001 47.9 11/12/2001 33.45 6/8/2001 45.25 3/4/2001 48.5 10/12/2001 33.1 3/8/2001 45.25 2/4/2001 47.8 7/12/2001 33.6 2/8/2001 45.15 30/03/2001 48.55 6/12/2001 33.55 1/8/2001 45.15 29/03/2001 50.9 5/12/2001 32.85 31/07/2001 44.65 28/03/2001 51.25 4/12/2001 32.95 30/07/2001 44.4 27/03/2001 50.8 3/12/2001 33.8 27/07/2001 43.1 26/03/2001 50.9
29/11/2001 35.15 26/07/2001 42.1 23/03/2001 50.65 28/11/2001 35.15 25/07/2001 43.25 22/03/2001 51.7 27/11/2001 35 24/07/2001 44.5 21/03/2001 52.95 26/11/2001 34.3 23/07/2001 45.2 20/03/2001 50.25 23/11/2001 32.75 20/07/2001 45.65 19/03/2001 51.25 22/11/2001 33.55 19/07/2001 46.1 16/03/2001 51 21/11/2001 33.65 18/07/2001 46.25 15/03/2001 53 20/11/2001 34.45 17/07/2001 47 14/03/2001 51.1 19/11/2001 35.1 16/07/2001 46.85 13/03/2001 47 15/11/2001 32.5 13/07/2001 47.35 12/3/2001 54.5 14/11/2001 31.6 12/7/2001 47 9/3/2001 55.9 13/11/2001 31.1 11/7/2001 46.9 8/3/2001 59.95
22
12/11/2001 32 10/7/2001 47 7/3/2001 59.55 9/11/2001 31.35 9/7/2001 46.3 5/3/2001 59.2 8/11/2001 30.55 6/7/2001 46.65 2/3/2001 59 7/11/2001 30.6 5/7/2001 47.05 1/3/2001 62.7 6/11/2001 31.3 4/7/2001 47.1 1/3/2002 28.6 5/11/2001 32.4 3/7/2001 46.95
Source: www.capitaline.com
23
RIL: 1 Year Price Data
Date Close Price(Rs)
Date Close Price(Rs)
Date Close Price(Rs)
3/8/2002 306.95 10/29/2001 260.45 6/20/2001 344.85 3/7/2002 311.30 10/25/2001 263.9 6/19/2001 346.85 3/6/2002 307.65 10/24/2001 265.95 6/15/2001 357.6 3/5/2002 313.75 10/23/2001 274.9 6/14/2001 363.9 3/4/2002 313.65 10/19/2001 276.5 6/13/2001 372.2 3/1/2002 322.30 10/18/2001 275.95 6/13/2001 375.4
2/28/2002 307.85 10/17/2001 284.55 6/12/2001 370.05 2/27/2002 325.75 10/16/2001 273.6 6/11/2001 370.7 2/26/2002 321.35 10/15/2001 273.6 6/8/2001 370.4 2/25/2002 314.7 10/12/2001 267.05 6/7/2001 364.2 2/22/2002 314.9 10/11/2001 265.4 6/6/2001 363.6 2/21/2002 314.4 10/10/2001 258.15 6/6/2001 365.55 2/20/2002 317.05 10/9/2001 253.1 6/5/2001 372.95 2/19/2002 320.85 10/8/2001 252.35 6/4/2001 374.75 2/18/2002 318.75 10/5/2001 250.65 6/1/2001 380.25 2/15/2002 315.6 10/4/2001 249.45 5/31/2001 392.3 2/14/2002 311.55 10/3/2001 246.6 5/30/2001 389.25 2/13/2002 310 10/1/2001 259.55 5/30/2001 391.55 2/12/2002 309.2 9/28/2001 264.6 5/29/2001 403.4 2/11/2002 308.6 9/27/2001 241.7 5/28/2001 398.8 2/8/2002 311.2 9/26/2001 227.15 5/25/2001 393.55 2/7/2002 307.95 9/25/2001 206.6 5/24/2001 392.9 2/6/2002 291.7 9/24/2001 221.15 5/23/2001 379.4 2/5/2002 293.9 9/21/2001 216.65 5/23/2001 381.05 2/4/2002 302.8 9/20/2001 239.9 5/22/2001 377.45 2/1/2002 300.65 9/19/2001 246.9 5/21/2001 376.65
1/31/2002 300.1 9/18/2001 253.15 5/18/2001 374.85 1/30/2002 314.05 9/17/2001 262.65 5/17/2001 382.55 1/29/2002 316.6 9/14/2001 261.3 5/16/2001 366.95 1/28/2002 314.45 9/13/2001 290.3 5/15/2001 370.8 1/25/2002 314.8 9/12/2001 297.9 5/15/2001 381.95 1/24/2002 313.55 9/11/2001 305.05 5/14/2001 359.8 1/23/2002 314.65 9/10/2001 304.15 5/11/2001 355.35 1/22/2002 312.6 9/7/2001 307.7 5/10/2001 355.15 1/21/2002 312.4 9/6/2001 311.6 5/9/2001 351.75 1/18/2002 311.6 9/5/2001 311.15 5/8/2001 346.1 1/17/2002 318.7 9/4/2001 314.35 5/7/2001 340.9 1/16/2002 320.25 9/3/2001 312.7 5/4/2001 343.7 1/15/2002 322.75 8/31/2001 311.15 5/3/2001 343.95
24
1/14/2002 325.7 8/30/2001 319.1 5/2/2001 342.3 1/11/2002 326.8 8/29/2001 318.4 4/30/2001 342.5 1/10/2002 324.65 8/28/2001 312.85 4/27/2001 345.35 1/9/2002 328.35 8/27/2001 315.3 4/26/2001 354.85 1/8/2002 317.85 8/24/2001 315.15 4/25/2001 358.65 1/7/2002 320 8/23/2001 317 4/24/2001 349.45 1/4/2002 321.05 8/21/2001 318.9 4/23/2001 370 1/3/2002 296.45 8/20/2001 317.85 4/23/2001 354.1 1/2/2002 303.6 8/17/2001 317.55 4/20/2001 358.85 1/1/2002 305 8/16/2001 326.9 4/19/2001 369.75
12/31/2001 306.2 8/14/2001 321.05 4/18/2001 310.7 12/28/2001 301.9 8/13/2001 326.55 4/18/2001 327.2 12/27/2001 302.25 8/10/2001 339.8 4/17/2001 315.2 12/26/2001 306.8 8/9/2001 335.8 4/16/2001 308.15 12/24/2001 310.7 8/8/2001 328.45 4/12/2001 297.35 12/21/2001 310.35 8/7/2001 329.15 4/11/2001 324.05 12/20/2001 310.3 8/6/2001 323.2 4/11/2001 324.25 12/19/2001 308.7 8/3/2001 317.2 4/10/2001 328.6 12/18/2001 309.15 8/2/2001 317.8 4/9/2001 357.25 12/14/2001 310.3 8/1/2001 315.5 4/6/2001 382.75 12/13/2001 311 7/31/2001 318.85 4/4/2001 380.4 12/12/2001 311 7/30/2001 312.85 4/4/2001 383.1 12/11/2001 310.45 7/27/2001 306.05 4/3/2001 390.85 12/10/2001 315.05 7/26/2001 304.85 4/2/2001 391.05 12/7/2001 312 7/25/2001 310.7 3/30/2001 389.55 12/6/2001 309.95 7/24/2001 314.35 3/29/2001 396.45 12/5/2001 313.3 7/23/2001 313 3/28/2001 402 12/4/2001 298.5 7/20/2001 313.9 3/28/2001 399 12/3/2001 290.45 7/19/2001 324.1 3/27/2001 390.7
11/29/2001 289.95 7/18/2001 326.75 3/26/2001 384.2 11/28/2001 290.55 7/17/2001 333 3/23/2001 379.55 11/27/2001 293.2 7/16/2001 332 3/22/2001 393.4 11/26/2001 298.6 7/13/2001 344 3/21/2001 390 11/23/2001 291.9 7/12/2001 340.2 3/21/2001 401.3 11/22/2001 291.9 7/11/2001 336.6 3/20/2001 373.35 11/21/2001 294.4 7/10/2001 333.7 3/19/2001 382.5 11/20/2001 291.05 7/9/2001 327.2 3/19/2001 380 11/19/2001 305.25 7/6/2001 325.7 3/16/2001 384 11/15/2001 278.05 7/5/2001 331.75 3/15/2001 397.25 11/14/2001 273.2 7/4/2001 326.2 3/14/2001 400 11/13/2001 268.45 7/3/2001 329.4 3/14/2001 405.25 11/12/2001 266.2 7/2/2001 358.65 3/14/2001 399.4 11/9/2001 264.05 6/29/2001 368.5 3/13/2001 408
25
11/8/2001 260.7 6/28/2001 362.3 3/13/2001 388.1 11/7/2001 259.1 6/27/2001 351.7 3/12/2001 408 11/6/2001 262.5 6/27/2001 358.1 3/9/2001 409.5 11/5/2001 261.5 6/26/2001 346.8 3/8/2001 413.4 11/2/2001 262.95 6/25/2001 341.45 3/7/2001 412 11/1/2001 260.7 6/22/2001 342.4 3/5/2001 408.65
10/31/2001 254.4 6/21/2001 341.1 3/2/2001 419.1 10/30/2001 252.55 6/20/2001 342.2 3/1/2001 438.2
Source: www.nseindia.com
Annexure 10
BSE Sensex Price Movement Post Merger Announcement
Date BSE Sensex 8/3/2002 3,656.77 7/3/2002 3,690.27 6/3/2002 3,614.44 5/3/2002 3,641.10 4/3/2002 3,642.58 1/3/2002 3,678.75
Source: www.capitaline.com
Annexure: 11
Pre merger and Post merger share holding pattern of RIL
Share Holder Pre Merger (%) Post Merger (%) Promoter Group 44 34 Trustee for RIHL 0 7 RIL’s associate 0 5 FIs/Banks/MFs 13 14 Foreign holding(FII/GDR/NRI) 26 21 Others 17 19 Total 100 100 Source: RIL
26
Annexure: 12
Messiah of the investing masses
S. Vaidya Nathan
MR Dhirubhai Ambani made investing in the equity markets an acceptable practice in what was essentially a market with a narrow investor base in the 70s and part of the 80s.
Till the advent of a big-ticket mop-up of investor funds by Reliance, the stock market was confined to brokers, a few high net worth individuals, the UTI (which was not as big as it is today) and a small set of investors who profited from investing in MNCs when the companies were forced to dilute their stakes in the mid-70s by the Government.
It was not until a decade later that Mr Ambani and his Reliance group created mass investor interest in equities. The group's plans in petrochemicals were then taking shape in a big way. Even in the late 80s there were clear signs that the kind of capacities the group envisaged were much larger in what was a conservative milieu and at a time when licensing requirements were tight.
For much of the 80s, the group's fund-raising efforts were centred on its flagship company, Reliance Industries Ltd (RIL). It came out with a few straight equity and loads of convertible instruments.
In an approach practiced even as late as 2001-02 in the case of Reliance Petroleum, even the non-convertible part of convertible debentures as well as a series of RIL's non-convertible debentures were converted into equity later. This process was helped by price trends in the stock in the secondary markets. As the most actively traded share, the Reliance stock in the 80s was the focus for much speculative trading. The group was clued to the importance of the secondary market as being vital for its fund mobilisation efforts.
The group's investment companies have also been direct or indirect players in the equity market. For instance, the public offering document of Reliance Capital in the mid-90s indicated that it would support unlisted group companies (which were later desubsidiarised) in their market activities.
What was important was the manner in which the group ensured that its flagship RIL was not overloaded with equity. If this had happened, it would have acted as a company specific-dampener on the valuation of the stock.
The equity could not afford to rise too much ahead of earnings and in the CCI-controlled pricing era, conversion prices were not aligned to market prices and, therefore, every conversion tranche added to the equity sizeably. It is here that the next aspect of the strategy came to the fore. That was to float new companies or convert existing companies' business profile, to help fund mobilisation efforts.
27
New companies: The first off the block was Reliance Petrochemicals. Surely the group could not have had two entities in petrochemicals. The strategy was clear: Use RIL's tag to garner funds on a large scale through other companies, which came to the fore for just that.
When the project was close to fruition, the next part of strategy came into play: A merger with RIL at swap ratios that did not add much to the equity of the flagship company.
The stock price trends between the flagship and the fledgling fund mobilising entities, and the differential in their fundamentals were wide enough to allow a swap ratio that ensured that RIL's equity did not bloat too much in the merger process. This way, RIL's capacities were partially ramped up yet without expanding equity to the extent that a direct effort by it would have entailed.
After Reliance Petrochemicals, came an even more aggressive attempt by the group. Two listed group finance companies that were almost unknown acquired new avatars. Reliance Polpropylene and Reliance Polyethylene came, with more equity mobilisation efforts aimed at expanding the group's petrochemicals profile.
Interestingly, the two offer documents had to include a rider in the risk factors stating that the market price of the stocks could be the subject of manipulation and circular trading and did not necessarily represent the fundamentals. This followed a SEBI diktat to the effect.
But these two offers found ready takers, helped by the fact that investors in a public offer of the Reliance group generally made good money if they sold out. Once the fund mobilisation was over, these companies were drafted into the RIL fold through mergers.
The big idea: But by now, the economic scenario had changed and liberalisation was the order of the day. The group thought big and here its ability to visualise the advantages of large capacities (in many cases comparable to global majors or in a few exceeding them) was of importance in surviving in an economy with enhanced global exposure.
Born in such a background was Reliance Petroleum. It set out to put up a 9-million-tonne refinery for which it came out with the largest IPO in India (Rs 2,172 crore). There were also innovations in the form of triple option convertible debentures (TOCDs). Reliance Petroleum's IPO was lapped by with an investor base well in excess of 2 million — much larger than even that of RIL.
But the project did not kick off as scheduled. The delays were explained by the fact that the group kept scaling up the proposed capacity — to 15 million tones, 18 million tonnes and eventually 27 million tonnes. (This was also a strategy that was used with good effect in RIL). The project was eventually commissioned in 1999-2000.
Here the top brass kept insisting that Reliance Petroleum would not be merged. The rider was, till 2000 at least. Then two things happened. One, the TOCD holders were offered a conversion option for the non-convertible part. Then last year, the eventual outcome of a merger too
28
fructified at a swap ratio of 1:11. The end result: A substantial scaling up of assets, revenues and profits of RIL without commensurate burden by way of higher equity.
The bottomline: Ultimately, IPOs, rights offers, NCD offers, conversion offers for NCDs, flotation of new companies to serve as vehicles for fund mobilisation, mergers with flagship company RIL, innovative and complicated structuring instruments and conversion terms with similar attributes in the case of Reliance Petroleum, GDR offers, overseas bond offers with tenures ranging from 10 to 100 years — all these combined to provide a heady cocktail for generating funds from investors.
One may have divergent views on the methods used by the group to mop up funds. But there can no doubt about the fact that Mr Dhirubhai Ambani in this process served to make equity a "mass product".
Without the Ambani-Reliance thrust in the 80s and to a lesser extent in the 90s, and the interest kindled by the price manipulation by Harshad Mehta and Ketan Parekh in the 90s using "others funds", the equity market would be a far cry from what it is today.
Mr Dhirubhai Ambani brought investors into the market in a way that has helped not only his group but others as well.
Had India Inc. taken care to deliver value to shareholders, the "mass market" for equity created by Mr Dhirubahi Ambani would surely become a "more valuable market" for investors.
Source: The Hindu Business Line, July 08, 2002
Sources:
1. RIL-RPL Merger: The Inside Story, Business Today, March 31, 2002
2. RPL-RIL merger: Excellent synergies, smart timing? The Hindu Business line, March 02, 2002
3. RIL-RPL merger: Big boys play it right. Outlook Money Magazine, March 14, 2002
4. RIL , www.capitaline.com
5. RIL-RPL Merger: The Inside Story, Business Today, March 31, 2002
6. RIL-RPL Merger: The Inside Story, Business Today, March 31, 2002