Embed Size (px)
Citation preview

1
RIMPhil: a bioeconomic model for integrated weed
management of annual barnyardgrass (Echinochloa
crus-galli) in Philippine rice farming systems
Jesusa C. Beltran1,2,*
, David J. Pannell1,3
, Graeme J. Doole1,4
, and Benedict
White1
1School of Agricultural and Resource Economics, The University of Western Australia,
Crawley, WA 6009, Australia 2Philippine Rice Research Institute (PhilRice), Maligaya, Science City of Muñoz, Nueva
Ecija, 3119, Philippines 3Centre for Environmental Economics and Policy, The University of Western Australia,
Crawley, WA 6009, Australia 4Department of Economics, Waikato University, Private Bag 3109, Hamilton, New Zealand.
20 May 2011
Working Paper 1112
School of Agricultural and Resource Economics
http://www.are.uwa.edu.au
Citation: Beltran, J.C., Pannell, D.J., Doole, G.J., and White, B. (2011) RIMPhil: a bioeconomic model for
integrated weed management of annual barnyardgrass (Echinochloa crus-galli) in Philippine rice farming
systems, Working Paper 1112, School of Agricultural and Resource Economics, The University of Western
Australia, Crawley, Australia.
© Copyright remains with the authors of this document.

2
Abstract
This paper describes a complex, dynamic simulation model that has been developed for the analysis of
integrated weed management programmes for the control of annual barnyardgrass (Echinochloa crus-galli) in
rice farming systems in the Philippines. Users of the model may simulate any feasible combination of 49 weed
treatments options across wet and dry cropping seasons over 5, 10, 15, and 20 year periods, subject to a
predetermined sequence of planting methods. The main outputs of the model include weed seed and plant
densities and seasonal and annualised profit over the simulated planning horizon. Model output emphasises the
substantial economic benefits associated with effective long-term weed management strategies. In addition, the
most-profitable weed densities are found to be much lower than those usually recommended to producers,
indicating the importance of considering economic factors in the formulation of management recommendations.
Results broadly indicate that a mixture of chemical and non-chemical treatments provides good weed control in
rice crops, and maximises long-term profit for systems where the main weed is annual barnyardgrass. However,
the performance of this strategy is influenced by crop establishment method and weed density level. These
indicative results emphasise the value of the model for guiding the efficient control of annual barnyardgrass in
rice crops in the Philippines.
Key words. Barnyardgrass; Bioeconomic model; Integrated weed management; Rice farming systems.
1. Introduction
The strong negative impacts that weeds can have on rice yields, and hence farm profits, create a demand for
cost-effective weed management strategies. World-wide losses in rice yields due to weeds have been estimated
to be around 10 per cent of total production (Bastiaans and Kropff, 2003). This means that production losses due
to weeds in rice crops are around US$30 billion annually, highlighting the strong economic incentives accruing
to the employment of effective weed control.
Manual weeding has been commonly used in rice fields to minimise yield losses from weed competition.
However, declining labour availability for agriculture, increasing labour costs related to reduced labour supply,
and water scarcity have required rice producers to look for alternative weed-control treatments. Selective
herbicides have been extensively used, given their ease of application, high efficacy, and low cost relative to
alternative methods (Pingali et al., 1997). However, the use of herbicides has been accompanied globally by the
potential build up of herbicide-resistant weeds, weed species population shifts, and concerns about
environmental contamination and impacts on human health (Johnson and Mortimer, 2005).
Rice farmers throughout the Philippines have generally been encouraged by the Philippine Rice Research
Institute (PhilRice) to use integrated weed management (IWM) strategies. This encouragement has stemmed
from a focus to maintain crop yields, but without the need for unsustainable high levels of herbicide application.
IWM involves the use of a diversity of weed control methods, including non-chemical methods. These IWM
strategies may have benefits for the control of rice weeds by delaying the development of resistance and/or
allowing the control of herbicide-resistant weeds. In most cases, economic considerations, particularly profit, are

3
important to farmers in driving the adoption of agricultural innovations (Pannell et al., 2006). Nevertheless, the
inherent complexity of decision making in terms of weighting the relative benefits and costs of IWM control
options makes it difficult to identify economically advantageous actions. Key factors are the broad range of
information that requires consideration in an integrated manner, the large number of alternative treatments and
their possible combinations requiring evaluation, and their interrelationships with other components of the
farming system.
Bioeconomic models are an effective research tool for the evaluation of IWM strategies and the establishment of
research priorities (Pannell et al., 2004; Doole and Weetman, 2009). A bioeconomic model is commonly
understood as a mathematical modelling framework involving the biological, agronomic, and economic
parameters that are important for making a decision. Many bioeconomic models focussed on weed control have
been constructed, but almost all of these models have been used in developed countries (e.g. Wiles et al., 1996;
Pannell et al., 2004). There appears to be considerable opportunity for constructing weed control models,
embedded within decision support systems (DSS), in developing countries because these nations experience
relatively larger losses from weed competition, and subsequently would benefit from more effective and
sustainable weed control strategies.
DSSs for rice production in other countries—such as RiceWeed (VanDevender et al., 1994) and PRICE
(Wilkins et al., 2001)—have, in general, been somewhat simplified. There is no DSS for weed management in
rice crops that adequately deals with its natural complexity, despite rice being a staple commodity in many
nations, especially throughout Asia.
The objectives of this paper are to describe a weed control model constructed for a major weed of rice crops, to
present its key assumptions, and to illustrate its use in the analysis of weed control problems. The major weed is
annual barnyardgrass (Echinochloa crus-galli complex) and the model is constructed for irrigated rice farms in
the Philippines. The development of a bioeconomic model of weed control for the Philippines is important given
the complexity of IWM decisions experienced on rice farms and the importance of rice as a crop. Moreover, a
focus on the control of annual barnyardgrass is of broad value since this weed affects rice production in most
rice-producing nations.
The paper is structured as follows. Section 2 includes an overview of the weed control model. Section 3
describes output from a number of illustrative applications of the weed control model. Section 4 concludes.
2. Model description
2.1 Overview
Resistance and Integrated Management in the Philippines (RIMPhil) is a DSS developed to analyse the
implications of IWM programmes for rice farming in the Philippines, potentially including herbicide-resistant
weeds. The structure of the RIMPhil model is loosely based on that of the resistance and integrated management
(RIM) model, which has been developed in Western Australia to guide the management of annual ryegrass
(Pannell et al., 2004) and wild radish weeds (Monjardino et al., 2003). RIMPhil provides information and

4
insights about the long-term effects of different management strategies for annual barnyardgrass, one of the
most serious weed competitors of rice crops in the Philippines (Graf and Hill, 1992; De Dios et al., 2005). The
model is implemented in Microsoft Excel® using formulae and Visual Basic macros. RIMPhil is a dynamic
simulation model that only evaluates a range of potential weed management scenarios once they are entered
manually by a user. The best feasible strategies are determined for different situations through experimentation
with the model by a user. In the RIMPhil model, the user simulates various combinations of weed management
treatments subject to a predetermined sequence of planting methods. Concurrently, the user can view their
predicted effects on the annual barnyardgrass population, grain yield, profit, and costs over 5, 10, 15, and 20-
year periods. The user can assess all weed control options, and subsequently choose the most advantageous
strategies.
The user of RIMPhil can choose either transplanted or direct wet-seeded rice as a planting technique.
Transplanting involves replanting rice seedlings grown in nurseries to puddled soil, while direct-seeding
consists of sowing the pre-germinated and ungerminated seeds on a wet or dry puddled soil, respectively
(Pandey and Velasco, 2002). Planting methods can be selected in each of two cropping seasons within a year.
However, the user should be cautious in selecting a particular crop establishment method, as there are impacts
associated with the use of each method, predominantly in terms of having an effect on weed population
dynamics and economic outcomes. The profit earned is usually higher when the direct-seeding method is used
because the high cost of labour required for transplanting is not incurred (Moya et al., 2004). On the other hand,
weeds are a greater problem in direct-seeded rice than in transplanted rice because (i) the rice and weed plants
germinate at the same time in direct-seeded rice, resulting in less-competitive suppression of weeds than in
transplanted rice, and (ii) initial flooding to control weeds is not possible (Baltazar and De Datta, 1992).
The model permits the user to identify the maximum number of applications for each group of herbicides prior
to the onset of resistance in annual barnyardgrass. This allows them to state whether herbicide resistance will
not occur, has occurred, or can occur over the planning horizon. A wide selection of non-herbicide weed control
options are included in the model. This permits the user to identify profitable substitutes as herbicide efficacy is
lost.
2.2 Sources of data
The RIMPhil model incorporates around 300 parameters. These parameters are realistic for a typical lowland
irrigated rice farm, but can be adjusted by the user. Underlying RIMPhil is a realistic specification of default
values for each parameter. Standard data and information used in the model are collected from many different
sources.
The biological parameters of annual barnyardgrass used in the model are mostly obtained from research reports
collected from a variety of Asian countries, due to a lack of actual data from field experiments in the
Philippines. Some parameters are also based on expert opinion. This is required since many of the coefficients
that are necessary for a realistic model specification have received no formal experimental attention that could
yield suitable estimates. Parameters pertaining to the effectiveness of weed control strategies are estimated

5
based on farmer opinion and from published experimental research. These values are adjusted based on personal
communication with experts. Parameters for the weed-crop competition functions are calibrated based on the
results of experimental data and from judgements by weed scientists.
In terms of agronomic and economic parameters, most of the values are acquired from PhilRice, BAS (Bureau
of Agricultural Statistics), FPA (Fertilizer and Pesticide Association) (FPA), and IRRI (International Rice
Research Institute). Detailed information regarding the sources and magnitude of all parameters can be obtained
from the primary author on request.
2.3 Major assumptions in the RIMPhil model
The primary assumptions underlying the RIMPhil model are:
1. The model is deterministic and does not represent annual variations in weather, yield, prices, costs, and
herbicide performance, but potential weed-free yield varies between the two cropping seasons. Higher
grain yield is usually attained during the dry cropping season, rather than in the wet cropping season,
due to more favourable growing conditions (Balisacan et al., 2006).
2. It is assumed that the rice seed used is a modern inbred variety, requiring a period to maturity of 120
days. Nevertheless, this model is flexible in that users can change all of the rice crop parameters to
represent other varieties (e.g. hybrid rice).
3. There are two rice seed classification options included in the model: (1) poor quality or farmers’ seeds,
and (2) high quality or certified seeds. Farmers’ seeds have a lower procurement price, but also possess
a higher residual weed population and typically produce lower yields compared to the certified seeds.
In this model, the default seed class used is the farmers’ seeds.
4. The assumed default tillage system is reduced tillage. In this tillage system, some land preparation
activities are removed and the initial cultivation is from just 7 to 10 days before planting (DAT) or
seeding (DAS) (Moody, 1990). The user can also select reduced tillage with non-selective herbicide
applications (glyphosate or paraquat) or a thorough land preparation as a tillage option. These tillage
systems have high weed-control effectiveness, but are relatively expensive.
5. It is assumed that weeds other than annual barnyardgrass are controlled sufficiently in the field. This
means that only two species of plants are competing for the limited resources in the field: rice and
barnyardgrass.
6. Control treatments are implemented at different times and will affect weeds at different stages of their
life cycles. For this reason, combined effects of different weed controls are assumed to be
multiplicative, rather than additive (Pannell et al., 2004).
2.4 Biology
2.4.1 Weed population dynamics
There are a number of crucial factors driving the weed population to vary over time. These are:

6
1. Weed seed dormancy and carry-over from previous cropping season.
2. Timing of weed seed germination and seedling emergence relative to the rice crops (the weeds that
germinate earlier are more competitive and produce more seeds than later-germinating weeds).
3. Natural mortality rate of weed seeds and plants.
4. Weed seed production per plant.
5. Effects of weed-crop competition on seed production per plant.
6. Timing and effectiveness of weed management control options.
7. Impacts of selected planting method on weed population and crop yields.
Most of these factors are captured in the following general equation for calculating the weed plant density,
which is based on Gorddard et al. (1996):
,111 HNFIV DDDGSW (1)
where W represents the weed plant density that survives to maturity (plants m-2
), VS is the number of viable
weed seeds present at the start of the cropping season (seeds m-2
), IG is the proportion of initial weed seed pool
that germinates, FD is the proportion of germinated weed seeds that die naturally during the growing season,
ND is the proportion of germinated seeds that are killed by non-chemical weed controls, and HD is the
proportion of germinated seeds that are killed by herbicide application.
In the RIMPhil model, the crop and weed life stages are compared and synchronised to determine the critical
periods for weed management. Based on these findings, the barnyardgrass population dynamics is broken down
into seven defined periods within the cropping season, namely: (1) just before land preparation, (2) time for land
preparation, (3) 15 DAT/DAS, (4) 30 DAT/DAS, (5) 45 DAT/DAS, (6) just before harvest, and (7) after
harvest. This allows more accurate description of the evolution of the weed species across time.
The barnyardgrass plant density (plants m-2
) for each period is calculated using the following equation:
,111 RCPLNPC DGSDDWW (2)
where CW refers to the number of germinated barnyardgrass plants alive (plants m-2
) in the current period, PW
is the number of barnyardgrass (plants m-2
) surviving from early weed control treatments, ND is the proportion
of barnyardgrass that die from non-chemical treatments in the current period, LD is the proportion of the
barnyardgrass population that dies due to post-emergence herbicide treatments in the current period, PS refers
to the number of barnyardgrass seeds that remained viable in the soil from the previous period, CG is the
proportion of viable seeds that germinate in the current period, and RD is the proportion of germinated
barnyardgrass seeds that die from the use of pre-emergence herbicide treatments in the current period.

7
The actual number of barnyardgrass seeds produced (seeds m-2
) during the cropping season TS is calculated
using the following equation:
,WSWPT WSS (3)
where WPS refers to the seeds produced per weed plant during the cropping season (see Equation 5) and WSW
is the number of weed setting seeds.
Default values of factors influencing weed plant density and weed seed numbers in the soil included in the
model are the following:
Default initial weed seed density in the soil is 200 seeds m-2
.
In the model, the seed production of different cohorts of barnyardgrass plants is expressed as a
percentage of weeds emerging at the same time as the crop. The default values are: 0–15 DAS = 100
per cent, 16–30 DAS = 40 per cent, 31–45 DAS = 10 per cent, and before crop harvest = 2 per cent.
Seedlings that emerge early in the cropping season and survive from the control treatments grow larger
and produce more seeds than the later-emerging seedlings (Maun and Barrett, 1986). In addition,
seedlings of barnyardgrass that emerge and survive in direct-seeded rice are more competitive, relative
to the seedlings that emerge in transplanted rice (De Datta and Baltazar, 1996).
Natural mortality of weeds and seeds. The default rates for seedlings is 20 per cent, dormant seeds
during growing season is 10 per cent, and seeds during fallow period is 25 per cent.
Removal of weed seeds during harvest is 2 per cent.
Seed production per plant (see discussion for Equation 4).
Impacts of weed and crop densities on seed production (see discussion for Equation 4).
The effectiveness of treatments to reduce weeds or seeds (see Table 1).
Sub-lethal effect of chemical control is 20 per cent.
2.4.2 Weed-crop competition
The impacts of a rice crop’s competitive ability on the number of seeds produced (seeds m-2
) per barnyardgrass
plant WPS is captured in the equation:
,1
1E
WS
HB
DCHB
MSWP DW
W
DbWaSS
(4)
where MSS represents maximum barnyardgrass seed production (seeds m-2
season-1
), a signifies the
barnyardgrass background competition factor (BBCF) that is used to calculate the base level of intraspecies
competition affecting weed seed production, HBW refers to the healthy equivalent barnyardgrass population

8
density (plants m-2
) before harvest, b is the rice crop competition factor on barnyardgrass (RCFB), DCD refers
to the rice crop density depending on the seeding rate selected in the model, WSW is the number of
barnyardgrass (plants m-2
) surviving all of the treatments that occur before harvest, and ED represents the sub-
lethal effect of selective herbicides that leads to lower seed production by weeds. The underlying relationship is
illustrated in Figure 1. The parameter values used in the model are as follows: MSS =48,000, a =23, and
b =0.6/0.3 for transplanted/direct-seeded rice, respectively.
120
150400
700
0
20
150
400700
0
400
800
1200
1600
2000
Se
ed
pro
du
cti
on
pe
r w
ee
d p
lan
t
Barnyardgrass density
(plants m-2
)
Rice density
(plants m-2
)
Figure 1. Relationship between seed production of barnyardgrass and the number of rice and barnyardgrass
plants per square metre.
Figure 1 clearly demonstrates the strong impact that competition has on the seed production of barnyardgrass. It
shows that seed production per plant greatly decreases if the weed and/or rice crop densities increase. However,
increasing the sowing density of rice should only be performed at the level that is adequate to prevent weeds
from occupying open spaces, as higher densities can promote yield loss through intra-specific competition
(Stauber et al., 1991).
Rice yield depends on crop density and the competitive abilities of rice relative to barnyardgrass across planting
techniques (Kropff and Lotz, 1993). The relationship between crop yield and weed density is described in
Equation 5 and illustrated in Figure 2. The proportion of weed-managed yield that exists after accounting for the
yield loss due to weed competition PRY is calculated using:

9
,1
1YLYL
WAWSDC
DC
SR
PR MMWWdDc
D
D
cY
(5)
where c refers to the rice crop background competition factor (RBCF), SRD represents the standard rice crop
density (plants m-2
) for each planting method (this is not the actual density, but a standard level for comparison),
DCD refers to the actual rice crop density (plants m-2
) depending on the seeding rate used, d signifies the
barnyardgrass competition factor in the rice crop (BCFR), WSW is the number of barnyardgrass plants (plants
m-2
) just before harvest, WAW refers to the number of barnyardgrass plants (plants m-2
) that must be added to
WSW to account for the yield loss that will incur with the late removal of weeds, and YLM represents the
maximum proportion of grain yield loss at high weed densities.
0%
20%
40%
60%
80%
100%
120%
0 20 40 60 80 100 120 140 160 180 200
Barnyardgrass density (plants m-2
)
Pro
po
rtio
n o
f w
ee
d-f
ree
yie
ld
50 kg/ha seeding rate
100 kg/ha seeding rate
150 kg/ha seeding rate
200 kg/ha seeding rate
300 kg/ha seeding rate
Figure 2. Relationship between rice crop yield and barnyardgrass density.
In RIMPhil, assumed values for RBCF are 3.5 for both crop establishment methods, while the values of BCFR
are 180 per cent and 360 per cent for transplanted and direct-seeded rice, respectively. The estimated values of
WAW are calculated by multiplying the total number of weeds removed from day 31 DAT/DAS until before
crop harvest with the estimated proportion of removed weeds, with a default value of 10 per cent. Moreover, the
value of YLM varies according to the planting methods defined in each cropping season. Based on Moody
(1990), the estimated values of YLM that are used in the model during the dry season are 61 per cent for
transplanted rice and 64 per cent for direct wet-seeded rice. On the other hand, the YLM values during the wet

10
season are 56 per cent and 62 per cent for transplanted and direct wet-seeded rice, respectively. For the values of
standard SRD and actual crop DCD densities used in the model, a detailed discussion is provided in the
next section.
2.4.3 Crop-related variables
Default values of crop-related variables included in the model are the following:
Standard weed-managed yields. Assumed values used in the model are 5 tonnes (t) per hectare (ha) for
wet season and 6 t ha-1
for dry season, which can be altered by the user of the program. These values
are the maximum attainable yields for certified inbred varieties in both seasons under a rice field with
adequate fertility and no problems with water supply (Balisacan et al., 2006).
Standard rice crop density. Densities of 75 and 150 plants m-2
are the values that are used for standard
rice crop density SRD for transplanted and direct-seeded rice crops, respectively. These are based on
PhilRice recommended seeding rates of 20–40 kilogram (kg) ha-1
for transplanted rice (PhilRice, 2000)
and 40–80 kg ha-1
for direct wet-seeded rice (PhilRice, 2001b).
Seeding rates. There are five choices of seeding rates included in the model: 50, 100, 150, 200, and 300
kg ha-1
. The calculated actual crop density DCD depends on the selected seeding rate. The default
value used is 50 kg ha-1
for both planting techniques.
Yield penalty for using poor quality seeds. A default value of 10 per cent yield penalty for using poor
quality seeds is used in the model (Cataquiz et al., 2006).
Phytotoxic effects of herbicides rice crops (e.g. 0.5 per cent yield loss in rice treated with bispyribac
sodium). The assumed levels of phytotoxicity damage of each group of herbicides in this model are low
because rice crops almost always recover from toxic injury caused by herbicide application (De Datta
et al., 1989).
2.4.4 Treatment options
There are a total of 49 weed-control treatments included in the RIMPhil model (Table 1). These treatments are
divided into two general groups: herbicide and non-herbicide weed controls. There are 29 herbicide options
included in the model and these are sorted into three separate groups: selective herbicides (24), non-selective
herbicides with cultural methods (2), and user-defined selective herbicides (3). Selective and user-defined
selective herbicide treatments in the model are grouped according to their time of application, these being: (1)
pre-emergence herbicides with application time from 0–6 DAT/DAS, (2) early post-emergence herbicides with
application times from 7–15 DAT/DAS, and (3) late post-emergence herbicides with application time from 16–
30 DAT/DAS (De Datta and Baltazar, 1996). On the other hand, non-herbicide treatments included in the model
are either cultural or manual methods including stale-seedbed management (this involves repeated plowing and
harrowing of the land during the fallow period to stimulate weed growth), land cultivation, water management,
manual weeding, and mechanical weeding. Detailed descriptions of these options are not presented here, but can
be readily found elsewhere (e.g. PhilRice, 2001a).

11
Table 1. Weed treatment options included in the RIMPhil model.
Treatment Typea Rate of kill ( per cent)
TRb DR
c
1 Stale-seedbed (mechanical) NC 98 98
2 Stale-seedbed+glyphosate C 97 97
3 Stale-seedbed+paraquat C 97 97
4 Reduced tillage NC 80 80
5 Reduced tillage+glyphosate C 90 90
6 Reduced tillage+paraquat C 90 90
7 Full land cultivation NC 90 90
8 Poor quality/farmer’s seeds NC 0 0
9 High quality/certified seeds NC 10 10
10 Manual seeding NC - 0
11 Mechanical seeding (drumseeder) NC - 0
12 Use 50 kg/ha seeding rate NC * *
13 Use 100 kg/ha seeding rate NC * *
14 Use 150 kg/ha seeding rate NC * *
15 Use 200 kg/ha seeding rate NC * *
16 Use 300 kg/ha seeding rate NC * *
17 Butachlor (Group K3) H 90 -
18 Butachlor+safener (Group K3) H 90 90
19 Pretilachlor (Group K3) H 85 -
20 Pretilachlor+fenclorim (Group K3) H 85 85
21 Oxadiazon (Group E) H 80 85
22 Pendimethalin (Group K1) H 90 -
23 Thiobencarb (Group N) H 90 90
24 Bensulfuron+flufenacet (Group B and K3) H 85 85
25 Metsulfuron+chlorimuron-ethyl (Group B) H 85 85
26 Other pre-emergence herbicide H 0 0
27 Irrigate field 5-7 DAT at 2-3 cm NC 70 -
28 Irrigate field 7-10 DAS at 2-3 cm NC - 50
29 Cyhalofop-butyl (Group A) H 95 95
30 Pyribenzoxim (Group B) H 95 95
31 Pendimethalin (Group K1) H 85 -
32 Penoxsulam (Group B) H 95 95
33 Anilofos+ethoxysulfuron (Group K3 and B2) H 85 85
34 Butachlor+propanil (Group K3 and C2) H 85 85
35 Piperophos+2,4-D (Group K3 and O) H 85 85
36 Thiobencarb+2,4-D (Group N and O) H 85 85
37 Fentrazamide+propanil (Group K3 and C2) H 90 90
38 Other early post-emergence herbicide H 0 0
39 Manual weeding at 15-30 DAT/DAS NC 100 95
40 Mechanical weeding at 15-30 DAT/DAS NC 90 85
41 Bispyribac sodium (Group B) H 95 95
42 Cyhalofop-butyl (Group A) H 95 95
43 Thiobencarb (Group N) H 90 90
44 Fenoxaprop-p-ethyl (Group A) H 90 90
45 Metsulfuron+chlorimuron-ethyl (Group B) H 85 85
46 Penoxsulam+cyhalofop (Group B and A) H 95 95
47 Other late post-emergence herbicide H 0 0
48 Manual weeding at 31-45 DAT/DAS NC 95 95
49 Mechanical weeding at 31-45 DAT/DAS NC 95 95 a NC = non chemical, C = chemical and non chemical, H = chemical.
b TR = transplanted rice.
c DR = direct-
seeded rice. * Depends on crop and weed densities.

12
The RIMPhil model evaluates the effects of herbicide resistance by allowing the user to specify the number of
applications available for each herbicide group before the onset of complete resistance. The group letter
indicated for each herbicide (see Table 1) represents the herbicide’s mode of action based on the Herbicide
Resistance Action Committee (HRAC) classification system (HRAC, 2011).
2.5 Economics
The economic values that are used in RIMPhil provide the user with a long-term view on the economics of weed
management for rice crops. The model includes a wide range of relevant economic variables, including the cost
of weed strategies, their impact on weeds and therefore crop production, and the prices of inputs and outputs.
The model uses discounting to compare costs and benefits that occur at different times (Robison and Barry,
1996; Pannell, 2006). These discounted costs and benefits are summed to calculate the net present value (NPV),
and the preferred strategy is that with the highest NPV. The model also includes the complexities of tax and
long-term trends in prices and yields in the calculation of NPV. Detailed discussions of costs, benefits, and
annualised net profits or equivalent annual profit (EAP) are provided in the following subsections.
2.5.1 Costs
The variable costs included in the model are the non-weed control costs (inputs and other production costs) and
weed control costs (chemical and non-chemical weed control costs). Possible environmental costs are also
considered in the model and can be specified by the user of the program. These environmental costs include the
negative impacts associated with the use of cultivation (e.g. soil erosion) and chemical application (e.g.
contamination of ground and surface waters). All cost parameters used in the model are either directly based on
data obtained from relevant sources or derived from the calculations based on these data.
2.5.2 Returns
The total grain gross receipts (expressed in Philippines pesos (PHP) ha-1
) of the model are the returns before the
total grain production costs have been deducted. These values are estimated by multiplying the rice crop yield
after weeds (t ha-1
) by the net price of rice, with a default value of PHP12,500 t-1
(BAS, 2011). It is assumed that
the net price of rice is equal to the sale price, as private traders usually bear the cost of transportation (Dawe et
al., 2008).
The net returns from crops are estimated by subtracting the total variable input costs from the total gross
receipts. This generic equation is applied for both the wet and dry cropping seasons included in the model. To
calculate the annual gross margins, the net returns for both cropping seasons are added together.
2.5.3 Equivalent annual profit and tax
The EAP or annuity is a constant annual profit value that would provide the same NPV as the observed
sequence of benefits and costs (Pannell, 2006). As mentioned earlier, calculation of the EAP in RIMPhil also
takes account of the inflation rate on input costs and crop product prices and the rate of yield increase over time.
13
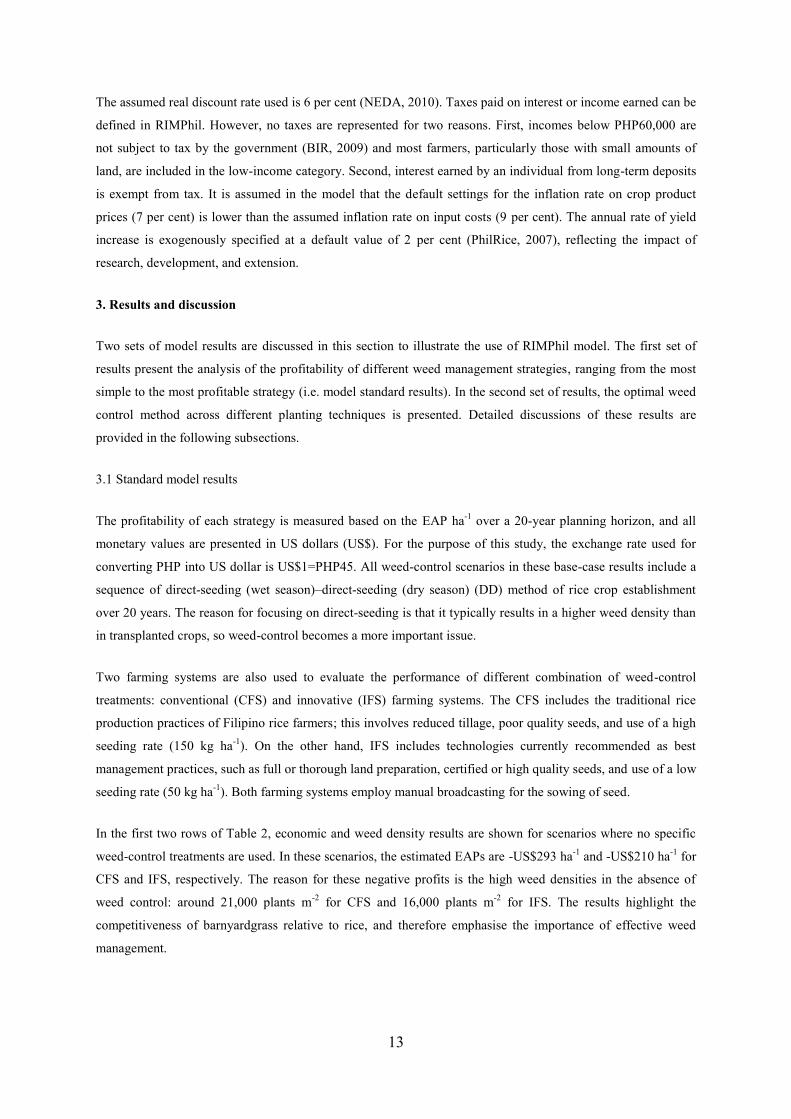
The assumed real discount rate used is 6 per cent (NEDA, 2010). Taxes paid on interest or income earned can be
defined in RIMPhil. However, no taxes are represented for two reasons. First, incomes below PHP60,000 are
not subject to tax by the government (BIR, 2009) and most farmers, particularly those with small amounts of
land, are included in the low-income category. Second, interest earned by an individual from long-term deposits
is exempt from tax. It is assumed in the model that the default settings for the inflation rate on crop product
prices (7 per cent) is lower than the assumed inflation rate on input costs (9 per cent). The annual rate of yield
increase is exogenously specified at a default value of 2 per cent (PhilRice, 2007), reflecting the impact of
research, development, and extension.
3. Results and discussion
Two sets of model results are discussed in this section to illustrate the use of RIMPhil model. The first set of
results present the analysis of the profitability of different weed management strategies, ranging from the most
simple to the most profitable strategy (i.e. model standard results). In the second set of results, the optimal weed
control method across different planting techniques is presented. Detailed discussions of these results are
provided in the following subsections.
3.1 Standard model results
The profitability of each strategy is measured based on the EAP ha-1
over a 20-year planning horizon, and all
monetary values are presented in US dollars (US$). For the purpose of this study, the exchange rate used for
converting PHP into US dollar is US$1=PHP45. All weed-control scenarios in these base-case results include a
sequence of direct-seeding (wet season)–direct-seeding (dry season) (DD) method of rice crop establishment
over 20 years. The reason for focusing on direct-seeding is that it typically results in a higher weed density than
in transplanted crops, so weed-control becomes a more important issue.
Two farming systems are also used to evaluate the performance of different combination of weed-control
treatments: conventional (CFS) and innovative (IFS) farming systems. The CFS includes the traditional rice
production practices of Filipino rice farmers; this involves reduced tillage, poor quality seeds, and use of a high
seeding rate (150 kg ha-1
). On the other hand, IFS includes technologies currently recommended as best
management practices, such as full or thorough land preparation, certified or high quality seeds, and use of a low
seeding rate (50 kg ha-1
). Both farming systems employ manual broadcasting for the sowing of seed.
In the first two rows of Table 2, economic and weed density results are shown for scenarios where no specific
weed-control treatments are used. In these scenarios, the estimated EAPs are -US$293 ha-1
and -US$210 ha-1
for
CFS and IFS, respectively. The reason for these negative profits is the high weed densities in the absence of
weed control: around 21,000 plants m-2
for CFS and 16,000 plants m-2
for IFS. The results highlight the
competitiveness of barnyardgrass relative to rice, and therefore emphasise the importance of effective weed
management.

14
Table 2. Equivalent annual profit (EAP) and final weed density for each weed control scenario over a 20-year
planning horizon.
Weed control scenario EAP
(US$ ha-1
)
Final weed density
(plants m-2
) CFS Conventional farming system (base scenario) -293 20,700
IFS Innovative farming system (base scenario) -210 16,320
Chemical control only
1a CFS with application of PEHa -247 3,327
1b IFS with application of PEH -184 2,189
1c 1a with one POSTb application 1,043 21
1d 1b with one POSTb application 402 58
1e 1d with low seeding rate replaced by high seeding rate 1,363 <0.01
1f 1c with another application of POST (i.e. 2x POST) 1,150 <0.01
1g 1d with another application of POST (i.e. 2x POST) 1,432 <0.01
Non-chemical control
2a CFS with use of water management -295 11,374
2b IFS with use of water management -217 8,965
2c 2a with water management replaced by stale seedbed -384 18, 187
2d 2b with water management replaced by stale seedbed -310 8,456
2e 2a with use DSc for seeding and 1x HW
d application -43,176 624
2f 2b with use DSc for seeding and 1x HW application -41,910 483
2g 2e with another application of HW (i.e. 2x HW) 1,245 <0.01
2h 2f with another application of HW (i.e. 2x HW) 1,518 <0.01
2i 2g with 2x HW replaced by 2x MWe applications 1,231 <0.01
2j 2h with 2x HW replaced by 2x MW applications 1,267 <0.01
Non-chemical and chemical control
3a CFS with water management and PEH application -191 1,718
3b IFS with water management and PEH application -154 1,138
3c 3a with use DSc for seeding and 1x HW application 1,221 <0.01
3d 3b with use DSc for seeding and 1x HW application 1,471 <0.01
3e 3c with another application of HW (i.e. 2x HW) 1,529 <0.01
3f 3d with another application of HW (i.e. 2x HW) 1,513 <0.01
3g 3c with 1x HW replaced by 1x MW application 413 157
3h 3d with 1x Hw replaced by 1x MW application 180 130
3i 3g with another application of MW (i.e. 2x MW) 1,462 <0.01
3j 3h with another application of MW (i.e. 2x MW) 1,461 <0.01
3k 3a with one POST application 1,185 <0.01
3l 3b with one POST application 1,449 0.01
3m 3k with another application of POST (i.e. 2x POST) 1,129 <0.01
3n 3l with another application of POST (i.e. 2x POST) 1,407 <0.01 a PEH: pre-emergence herbicides.
b POST: post-emergence herbicides.
c DS: drumseeder.
d HW: hand/manual
weeding. e MW: mechanical weeding.
All weed management strategies presented here are classified into three major groups: (1) chemical control, (2)
non-chemical control, and (3) combination of chemical and non-chemical controls. The profitability and
terminal weed density experienced under a range of different weed-control scenarios in these categories are
provided in Table 2 and are further elaborated in the following subsections.

15
3.1.1 Chemical control
The profitability of relying solely on chemicals to manage weeds in rice production is examined here. In these
scenarios, it is assumed that the continuous use of the same group of herbicides over 20 years will not develop
herbicide resistance. The chemical control strategies presented here vary in terms of timing of application and
frequency of use.
Application of pre-emergence herbicides (PEH). In scenario 1a and 1b, pre-emergence herbicide (i.e.
butachlor+safener) is applied in each cropping season to manage the weed problems in both farming systems.
With these methods, the EAPs are slightly improved to -US$247 ha-1
for scenario 1a and -US$184 ha-1
for
scenario 1b. The profits are still negative because of the large number of barnyardgrass plants that still infest the
rice crops (Table 2).
PEH with one application of post-emergence herbicides (POST). Under scenario 1c and 1d, one application of
POST per cropping season, as the primary means of weed control, is included in the previous scenarios (1a and
1b). Using these methods, the EAPs are significantly increased to US$1,043 ha-1
and US$402 ha-1
for scenario
1c and 1d, respectively. These values are a little lower if Group A herbicides (e.g. cyhalofop-butyl) are replaced
by Group B herbicides (e.g. bispyribac sodium), as the latter group is more expensive. The final weed densities
in these scenarios are also substantially reduced, indicating the efficacy of these chemicals. On the other hand,
the calculated profit in scenario 1c is higher than in scenario 1d, largely because of the use of a high seeding rate
in the former setting, which enhances the competitiveness of rice, relative to barnyardgrass. Thus, the low
seeding rate that is currently recommended by PhilRice is not necessarily the most beneficial strategy. Scenario
1e shows the results achieved when a high seeding rate (150 kg ha-1
) is used in scenario 1d. The EAP increases
greatly to US$1,363 ha-1
, higher than in scenario 1c, showing that the elements of the recommended strategies,
other than low seeding rates, are beneficial.
PEH with two applications of POST. In these management settings (scenario 1f and 1g), scenario 1c and 1d are
expanded by the inclusion of another POST application per season. This approach led to a considerable increase
in the EAPs over 20 years in scenario 1f and scenario 1g. Similarly, these methods achieved the highest rate of
barnyardgrass mortality, indicating their dual benefits and reinforcing that a key impact of weed management on
farm profits is through yield loss. This result highlights the substantial benefits accruing to the employment of
more weed control measures, particularly when there are high weed densities in the field.
3.1.2 Non-chemical control
The following scenarios present the model results for the profitability of using non-chemical control measures.
It is assumed that the weed-control methods selected for each scenario are the same in every year over 20 years.
Use of water management. In scenario 2a and 2d, irrigating the rice field during 7–10 DAS at 2–3 cm water
depth and raising this water level as the crop develops is the only method used in managing weeds per cropping
season in both farming systems. The EAPs did not improve and remain negative for both scenario 2a and 2b
(Table 2). The estimated values of EAP become even more negative when water management is replaced by the

16
use of the mechanical stale-seedbed method in CFS (scenario 2c) and IFS (scenario 2d) because the latter
approach is more costly, and also less effective at reducing weed populations. This shows that these indirect
methods of weed control would only be feasible if they are combined with direct methods of weed control (e.g.
hand weeding).
Use of water management with two applications of manual weeding. Manual weeding is used as the primary
means of weed control for every cropping season in scenario 2g and 2h. The use of a mechanical seeder (i.e.
drumseeder) for sowing the rice seeds is necessary to facilitate the use of manual weeding. Therefore, manual
broadcasting is replaced by the use of drumseeder in these scenarios. These strategies have very low weed
densities and relatively high profitability: US$1,245 ha-1
for scenario 2g and US$1,518 ha-1
for scenario 2h.
The use of a single manual weeding per season in both farming systems (i.e. scenario 2e for CFS and scenario 2f
for IFS) is also examined. Results show very high decreases in profits because there are so many weeds in the
field (compared to 2g and 2h), making manual weeding very expensive—the labour requirement of manual
weeding is highly dependent on weed density. On the other hand, if two weedings per season are used
(strategies 2g and 2h), weed density is maintained at a low enough level for hand weeding to be profitable. EAP
values, however, will drop to some extent if a mechanical weeder (i.e. rotary weeder) replaces manual weeding
as the direct means of weed control (scenario 2i and 2j).
3.1.3 Non-chemical and chemical control
As emphasised in many studies, relying on one method of control may be unsustainable. For example, placing a
high dependence on chemicals alone will lead to a build up of resistance, whereas dependence on just non-
chemical options may be very costly as these are labour intensive. Therefore, results are presented for a mixture
of chemical and non-chemical weed control methods. Note that the main difference between the profitable
integrated weed control strategies presented here is the choice of the primary means of weed-control from the
three direct methods: manual weeding, post-emergence herbicides (POST) application, and mechanical
weeding.
Use of water management with PEH application. The applications of both water management and PEH as weed
control strategies per season in both farming systems have produced higher EAP values (-US$191 ha-1
for
scenario 3a and -US$154 ha-1
for scenario 3b), relative to their separate individual applications: scenarios 1a and
1b for PEH application and scenarios 2a and 2b for use of water management. The profits are still negative
because unaccompanied water management and PEH applications are not enough to control the large number of
barnyardgrass plants in the field.
Use of water management with PEH and one manual weeding applications. Scenario 3a and 3b are extended by
the incorporation of one manual weeding in both CFS (scenario 3c) and IFS (scenario 3d). When one manual
weeding per season is integrated with PEH application, this method is both effective and increases profit
significantly. The profitability of a single manual weeding per season contrasts with the earlier result when
manual weeding was not combined with chemical control (see scenarios 2e and 2f). Inclusion of another

17
application of manual weeding (i.e. a total of two hand weedings per season) into scenarios 3c and 3d increased
the EAPs to more than US$1,500 ha-1
for both scenario 3e and 3f. Improvement in profit is due to reductions in
labour cost, as the labour requirement is less when weed density is minimal.
Use of water management with PEH and one mechanical weeding applications. In these scenarios, manual
weeding is replaced by the use of mechanical weeding in both the CFS (scenario 3g) and IFS (scenario 3h).
Implementing these strategies would significantly reduce long-term profits, relative to strategies in scenario 3c
and 3d that utilise manual weeding. Nevertheless, if an additional use of mechanical weeding per season is
included in both scenario 3g and 3h, the calculated EAP would increase from US$413 ha-1
(scenario 3g) to
US$1,462 ha-1
(scenario 3i). Similar results are observed for IFS if two applications of mechanical weeding are
used per season (scenario 3j) instead of one (scenario 3h).
Use of water management with PEH and one POST applications. Instead of manual and mechanical weeding,
POST application is used as a direct weed control measure in both CFS (scenario 3k) and IFS (scenario 3l) in
these simulations. The use of PEH with water management plus one POST application maximises the EAP in
both scenarios (Table 2). On the other hand, increasing the frequency of POST application to two applications
(scenario 3m and 3n) would reduce profit because good barnyardgrass control is already achieved with a single
POST application. This result highlights the diminishing or negative marginal profit associated with
implementing additional control strategies once the number of weeds is at a very low level.
Overall, the best strategy of those discussed so far is 3e, consisting of use of a water management, a drumseeder,
two manual weedings per season, and an application of a pre-emergence herbicide. This strategy produces the
highest value (US$1,529 ha-1
) of EAP (Table 2). However, this strategy involves the same treatments every
season for 20 years. EAP value could be improved by varying the types, timing, and frequency of application of
weed control measures over a long-term period. In fact, the optimal weed control strategy involves some
variation from year to year and season to season. This is explored further in the next section.
3.2 Optimal weed control
Three types of rice crop establishment methods are used to evaluate the ―optimal‖ weed control strategies. The
first two sequences involve continuous use of a single establishment method for the wet and dry cropping
seasons over a 20-year planning horizon, these establishment methods being the (1) DD sequence (introduced
above), (2) transplanting (wet season)–transplanting (dry season) method (TT), and (3) transplanting (wet)–
direct-seeding (dry) (TD), alternating for each cropping season over the planning horizon.
Optimisation techniques have been applied to identify near-optimal solutions in simulation models with a
similar structure (e.g. Doole and Pannell, 2008). However, the number of possible treatment combinations in
RIMPhil is so large that such search methods proved to be ineffective in the identification of optimal solutions.
Thus, for the purpose of this study, the ―optimal‖ strategies for each set of results are identified through an
extensive process of manual ―trial and error‖. These strategies are selected on the basis of producing the highest
long-term profit or EAP ha-1
over 20 years under the optimal weed density (i.e. weed threshold) that can be left

18
unmanaged in the field. As weed threshold increases, the profitable weed treatment level and/or type will vary.
From experimenting with the model, the ―optimal‖ weed threshold level is found to be significantly lower than
commonly assumed; a value of 0.1 plant m-2
is identified whereas one plant m-2
is often used in extension
programs. The optimal strategies presented here may not be globally optimal, but are likely close to this given
extensive experimentation with the model and the learning that has come from this that is utilised to identify the
components of the most-profitable strategies.
Table 3 shows the optimal set of weed control practices, describing the total numbers of applications of each
form of weed management used over the entire planning period (determined after exhaustive testing of
alternative strategies). The treatments used are broadly similar across all three scenarios, but differ in the
frequency of their use. Consistent in all three scenarios are the continuous applications of high quality seeds and
low seeding rate (50 kg ha-1
) for each cropping season over 20 years. The latter result is interesting. In an earlier
result, we showed that high seeding rates increased profits (compare strategies 1d and 1e). The reason for the
reversal of this result here is that the low seeding rate appears to be more profitable options at the optimal weed-
management strategies due to its lower cost.
Table 3. RIMPhil model results for the ―optimal‖ weed control strategy for three different sequences of rice crop
establishment methods over the 20-year planning horizon.
Weed Control/
Sequencea
TT DD TD
Total usage of
groups A and B
herbicides
0A; 0B 0A; 0B 0A; 0B
Total usage of
other groups of
selective herbicides
7c 17 14
c
Profitable non-
herbicide weed
control options
(number of uses)
Reduced tillage (37)
Full land preparation (3)
Certified seeds (40)
Low seeding rate (50 kg
ha-1
) (40)
Water management (7)
Hand weeding at 15–30
DAT (32)
Hand weeding at 31–45
DAT (5)
Reduced tillage (32)
Full land preparation (8)
Certified seeds (40)
Low seeding rate (50 kg
ha-1
) (40)
Water management (4)
Hand weeding at 15–30
DAS (40)
Hand weeding at 31–45
DAS (28)
Drumseeder (40)
Reduced tillage (30)
Full land preparation (10)
Certified seeds (40)
Low seeding rate (50 kg
ha-1
) (40)
Water management (9)
Hand weeding at 15–30
DAT/DAS (40)
Hand weeding at 31–45
DAT/DAS (6)
Drumseeder (20)
EAP for years 1–
20 (PHP ha-1
)
63,091 (US$1,402) 69,416 (US$1,543) 66,318 (US$1,474)
Weed density (20
year average m-2
)
0.01 0.03 0.01
Seeds in soil (20
years average m-2
)
1 5 3
a TT: transplanting for both season continuously, DD: direct-seeding for both season continuously, TD:
transplanting for wet season and direct-seeding for dry season continuously. b This number of herbicide
applications will not lead to resistance build up due to the assumed 100 per cent weed control effectiveness of
manual weeding with the transplanting method.

19
Results for all three scenarios involve extensive use of hand weeding and no use of Groups A and B selective
POST applications. Hand weeding and selective herbicides are both highly effective at removing weeds from
the rice crop, but given their relative costs, hand weeding is currently superior. The simulated optimal weed-
management strategy for each sequence provides good weed control. These strategies certainly make the
average weed and seed densities extremely low, as compared to the initial weed density of 60 plants m-2
and
seed density of 200 seeds m-2
. Reliance on herbicide application for weed control is low in these strategies, but
nevertheless barnyardgrass plants are well-managed and can be maintained at a low level for each cropping
season across all sequences of crop establishment methods. Manual weeding appears to be relatively cheaper
and more profitable to use than POST applications, as the cost of manual weeding depends directly on weed
numbers, whereas the cost of herbicides does not. If weed density is not maintained at a low level, then hand
weeding is not so attractive.
This finding is consistent with standard practice in the Philippines, where many farmers prefer to do manual
weeding if weed density is very low. However, high weed populations are a common situation on most rice
farms, and therefore most of the farmers rely on herbicides to control weeds (Marsh et al., 2005). Reliance on
herbicides is motivated by reduced labour costs and ease of implementation. Farmers can save time and money
with herbicide application, as it lowers or removes the costs associated with labour search and monitoring that
are incurred with manual weeding.
Overall, the most-valuable sequence is the DD sequence, despite more weed control treatments being
implemented over its duration. This rotation improves net profit by about 10 per cent over 20 years, as
compared to the TT rotation. The improvement in profit is primarily due to savings on labour costs spent on
transplanting rice. This result resembles those of Pandey and Velasco (2002) who also identified that, with
effective weed management, the net profit of direct-seeded rice is higher than transplanted rice. This
improvement in profit could be one of the main reasons why many Filipino farmers have been shifting to wet
direct-seeding, particularly during the dry season. Nevertheless, the altered system (TD rotation) seems to be an
attractive sequence too because it also provides good weed control, but with the use of less weed treatments.
Accordingly, the net profit achieved is not greatly lower than that earned within the DD scenario (about 4 per
cent).
Overall, these findings highlight the optimality of hand weeding, relative to herbicide use, as the primary means
of weed control in Philippine rice farming systems, regardless of the method of crop establishment. However,
this result is, of course, dependent on weed density, current prices, and costs.
4. Conclusions
The complexity of analysing the implications of IWM strategies for rice production in the Philippines has
motivated the construction of the RIMPhil model. This model provides a powerful tool for investigating the
biological, agricultural, and economic performance of different long-term weed management systems. RIMPhil
can be used to evaluate a number of important questions relating to the economics of weed management
problems, such as:

20
How do weed management strategies influence the productivity and profitability of rice farming
across different sequences of planting techniques (i.e. transplanting versus direct-seeding) across a
long-term planning horizon?
How much income is likely to be lost by farmers facing high labour costs and the build up of
herbicide resistance?
Within this context, which combination of weed management practices is optimal for a rice farmer
in the long term?
Is it more profitable to preserve or exploit the herbicide resource available to Filipino rice farmers?
Model output emphasises the substantial benefits of effective long-term weed management strategies. The most-
profitable weed densities are very low—lower than those usually achieved in farmers’ field. Similarly, the most-
profitable weed control threshold is lower than that usually recommended to farmers. This indicates the
importance of considering economic factors in the formulation of management recommendations for producers.
Moreover, model results indicate that a mixture of chemical and non-chemical treatments provides good weed
control in rice crops, and maximises long-term profit for systems where the main weed is barnyardgrass.
However, the performance of this strategy is influenced by crop establishment method and weed density level.
Given current prices of herbicides and labour, manual weeding, as a primary means of weed control, is more
profitable than herbicides across all crop establishment rotations provided that weeds are well-managed and
maintained at their ―optimal‖ low weed density level.
Overall, the RIMPhil model provides a consistent framework to guide the efficient control of barnyardgrass in
rice crops in the Philippines. Extension of the model to incorporate other weeds and rice farming systems in
other countries are interesting extensions to this research.
Acknowledgements
The authors are thankful to PhilRice, Australian Centre for International Agricultural Research (ACIAR), and
School of Agricultural Resource Economics of University of Western Australia (UWA) for funding this
research. We are also grateful for advice, information, and assistance from a large number of people who
contributed to the development of the DSS, particularly Joel Janiya, Edwin Martin, Lani Juliano, and Madonna
Casimero.
References
Balisacan, A.M., Sebastian, L.S. and Associates., 2006. Securing Rice, Reducing Poverty: Challenges and
Policy Directions. BAR-PhilRice Publication, Philippines.
Baltazar, A.M. and De Datta, S.K., 1992. Weed management in rice. Weed Abstracts 41, 495–508.
BAS, 2011. Bureau of Agricultural Statistics (BAS), CountrySTAT Philippines. [Online]. Available from URL:
http://www.countrystat.bas.gov.ph [accessed 10 January 2011].
Bastiaans, L. and Kropff, M.J., 2003. WEEDS | Weed Competition. Encyclopedia of Applied Plant Sciences.
Elsevier, Oxford, pp. 1494–1500.

21
BIR, 2009. Bureau of Internal Revenue (BIR), Revenue Regulations. [Online]. Available from URL:
http://www.census.gov.ph [accessed 5 August 2009].
Cataquiz, G.C., Casiwan, C.B. and Dawe, D.C., 2006. Seed subsidies need to be well targeted and of limited
duration, in: Dawe, D.C., Moya, P.F. and Casiwan, C.B. (eds.), Why Does the Philippines Import Rice?
Meeting the Challenge of Trade Liberalization. IRRI (Los Baños, Laguna) and PhilRice (Science City
of Muñoz), Manila, Philippines, pp. 77–80.
Dawe, D.C., Moya, P.F., Casiwan, C.B. and Cabling, J.M., 2008. Rice marketing systems in the Philippines and
Thailand: do large numbers of competitive traders ensure good performance? Food Policy 33, 455–463.
De Datta, S.K. and Baltazar, A.M., 1996. Integrated weed management in rice in Asia, in: Naylor, R. (ed.),
Herbicides in Asian Rice: Transitions in Weed Management. Palo Alto (California): Institute for
International Studies, Stanford University and Manila (Philippines): International Rice Research
Institute, pp. 145–166.
De Datta, S.K., Bernasor, P.C., Migo, T.R. and Llagas, M.A., 1989. Emerging weed control technology for
broadcast seeded rice. Progress in Irrigated Rice Research. International Rice Research Institute,
Manila, Philippines, pp. 133–147.
De Dios, J.L., Javier, E.F., Malabayabas, M.D., Casimero, M.C. and Espiritu, A.J., 2005. An overview of direct-
seeding for rice crop establishment in the Philippines, in: Toriyama, K., Heong, K.L. and Hardy, B.
(eds.), Rice is Life: Scientific Perspective for the 21st century. Proceedings of the World Rice Research
Conference. IRRI and Japan International Research Center for Agricultural Sciences (CD-ROM), 4–7
November 2004, Tokyo and Tsukuba, Japan, pp. 189–192.
Doole, G. J. and Pannell, D. J., 2008. Optimisation of a large, constrained simulation model using compressed
annealing. Journal of Agricultural Economics 59, 188–206.
Doole, G.J. and Weetman, E., 2009. Tactical management of pasture fallows in Western Australian cropping
systems. Agricultural Systems 102, 24–32.
Gorddard, R.J., Pannell, D.J. and Hertzler, G., 1996. Economic evaluation of strategies for management of
herbicide resistance. Agricultural Systems 51, 281–298.
Graf, B. and Hill, J.E., 1992. Modelling the competition for light and nitrogen between rice and Echinochloa
crus-galli. Agricultural Systems 40, 345–359.
HRAC, 2011. Classification of herbicides according to the modes of action. [Online]. Available from URL:
http://www.plantprotection.org/HRAC/Bindex.cfm?doc=moa2002.htm [accessed 4 February 2011].
Johnson, D.E. and Mortimer, A.M., 2005. Issues for integrated weed management and decision support in
direct-seeded rice, in: Toriyama, K., Heong, K.L. and Hardy, B. (eds.), Rice is Life: Scientific
Perspective for the 21st century. Proceedings of the World Rice Research Conference. IRRI and Japan
International Research Center for Agricultural Sciences (CD-ROM), 4–7 November 2004, Tokyo and
Tsukuba, Japan, pp. 211–214.
Kropff, M.J. and Lotz, L.A.P., 1993. Empirical models for crop-weed competition interactions, in: Kropff, M.J.
and van Laar, H.H. (eds.), Modelling Crop-weed Interactions. CAB International, Wallingford, Oxon
OX10 8DE, UK, pp. 9–23.
Marsh, S.P., LLewellyn, R.S., Casimero, M.C. and Cataquiz, G.C., 2005. Direct-seeding of rice and herbicide
use in the Philippines: implications for weed management. Paper Presented at the 49th Australian
22
Agricultural and Resource Economics Society Conference, 8-11 February 2005, Coffs Harbour, New
South Wales.
Maun, M.A. and Barrett, S.C.H., 1986. The biology of Canadian weeds. 77 Echinochloa crus-galli (L.) Beauv.
Canadian Journal of Plant Science 66, 739–759.
Monjardino, M., Pannell, D.J. and Powles, S.B., 2003. Multispecies resistance and integrated management: a
bioeconomic model for integrated management of rigid ryegrass (Lolium rigidum) and wild radish
(Raphanus raphanistrum). Weed Science 51, 798–809.
Moody, K., 1990. Yield losses due to weeds in rice in the Philippines. Crop Loss Assessment in IRRI.
International Rice Research Institute, Philippines, pp. 193–202.
Moya, P.F., Dawe, D.C., Pabale, D., Tiongco, M., Chin, N.V., Devarajan, S., Djatiharti, A., Lai, N.X.,
Niyomvit, L., Ping, H.X., Redondo, G.O. and Wardana, P., 2004. The economics of intensively
irrigated rice in Asia, in: Dobermann, A., Witt, C. and Dawe, D.C. (eds.), Increasing Productivity of
Intensive Rice Systems Through Site-specific Nutrient Management. Science Publisher, Inc. and IRRI,
Ensfield, N. H. (USA) and Los Baños (Philippines), pp. 29–58.
NEDA, 2010. National Economic and Development Authority (NEDA), National Economic Indicators.
[Online]. Available from URL: http://www.neda.gov.ph [accessed 18 August 2010].
Pandey, S. and Velasco, L., 2002. Economics of direct-seeding in Asia: patterns of adoption and research
priorities, in: Pandey, S., Mortimer, M., Wade, L., Tuong, T.P., Lopez, K. and Hardy, B. (eds.), Direct
Seeding: Research Issue and Opportunities. Proceedings of the International Workshop on Direct
Seeding in Asian Rice Systems: Strategic Research Issues and Opportunities. International Rice
Research Institute, Los Baños (Philippines), 25–28 January 2000, Bangkok, Thailand, pp. 3–14.
Pannell, D.J., 2006. Avoiding simplistic assumptions in discounting cash flows for private decisions, in: Pannell,
D.J. and Schilizzi, S.G.M. (eds.), Economics and the Future, Time and Discounting in Private and
Public Decision Making. Edward Elgar Publishing, Inc, Willian Pratt House, 9 Dewey Court,
Northampton, Massachusetts 01060, USA, pp. 26–36.
Pannell, D.J., Marshall, G.R., Barr, N., Curtis, A., Vanclay, F. and Wilkinson, R., 2006. Understanding and
promoting adoption of conservation practices by rural landholders. Australian Journal of Experimental
Agriculture 46, 1407–1424.
Pannell, D.J., Stewart, V., Bennett, A., Monjardino, M., Schmidt, C. and Powles, S.B., 2004. RIM: a
bioeconomic model for integrated weed management of Lolium rigidum in Western Australia.
Agricultural Systems 79, 305–325.
PhilRice, 2000. 40 kg certified seeds per hectare. Rice Technology Bulletin 2000 No. 26. Philippine Rice
Research Institute (PhilRice), Philippines.
PhilRice, 2001a. Management options for ricefields weeds. Rice Technology Bulletin 2001, No. 38. Philippine
Rice Research Institute (PhilRice), Philippines.
PhilRice, 2001b. Wet-seeded rice production. Rice Technology Bulletin 2001, No. 41. Philippine Rice Research
Institute (PhilRice), Philippines.
PhilRice, 2007. Rice Figures in the Philippines. Philippine Rice Research Institute (PhilRice), Science City of
Muñoz, Nueva Ecija, Philippines.

23
Pingali, P.L., Hossain, M. and Gerpacio, R.V., 1997. Asian Rice Bowls: The Returning Crisis? CAB
International in association with International Rice Research Institute (IRRI).
Robison, L.J. and Barry, P.J., 1996. Present Value Models and Investment Analysis. The Academic Page,
Northport, Alabama.
Stauber, L.G., Smith, R.J., Jr. and Talbert, R.E., 1991. Density and spatial interference of barnyardgrass
(Echinochloa crus-galli) with rice (Oryza sativa). Weed Science 39, 163–168.
VanDevender, K.W., Costello, T.A., Ferguson, J.A., Huey, B.A., Slaton, N.A., Smith, R.J., Jr. and Helms, R.S.,
1994. Weed management support system for rice producers. Applied Engineering in Agriculture 10,
573–578.
Wiles, L.J., King, R.P., Schweizer, E.E., Lybecker, D.W. and Swinton, S.M., 1996. GWM: general weed
management model. Agricultural Systems 50, 355–376.
Wilkins, R.M., Garratt, J.A. and Laister, A.J., 2001. PRICE: a decision support tool for the control of weeds in
tropical irrigated rice, in: Bakker-Dhaliwal, R., Bell, M.A., Marcotte, P. and Morin, S. (eds.), Decision
Support Systems (DSS): Information Technology in a Changing World. Mini Review IRRN 26.2,
IRRI, Los Baños, Laguna, Philippines.