Embed Size (px)
Citation preview
Rinconada Water Treatment Plant
Reliability Improvement Project (RIP)
Filter Pilot Study
AWWA 2014 Fall Conference
Lei Hong, Ph.D., P.E.
Lale Guven, Environmental Engineer
October 23, 2014
|
Presentation Outline
Background of Rinconada WTP
Objectives of filter media pilot study
Pilot system and test plan
Data analyses
Study conclusions
Acknowledgements
2 Outline
|
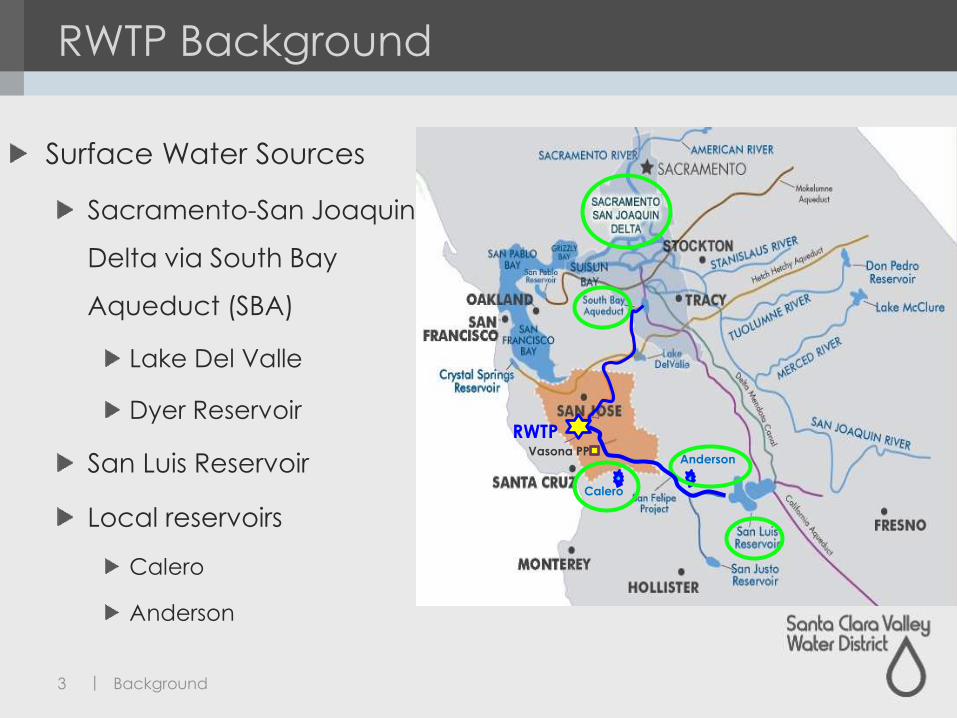
RWTP Background
Surface Water Sources
Sacramento-San Joaquin
Delta via South Bay
Aqueduct (SBA)
Lake Del Valle
Dyer Reservoir
San Luis Reservoir
Local reservoirs
Calero
Anderson
3 Background
RWTP
Calero
AndersonVasona PP
|
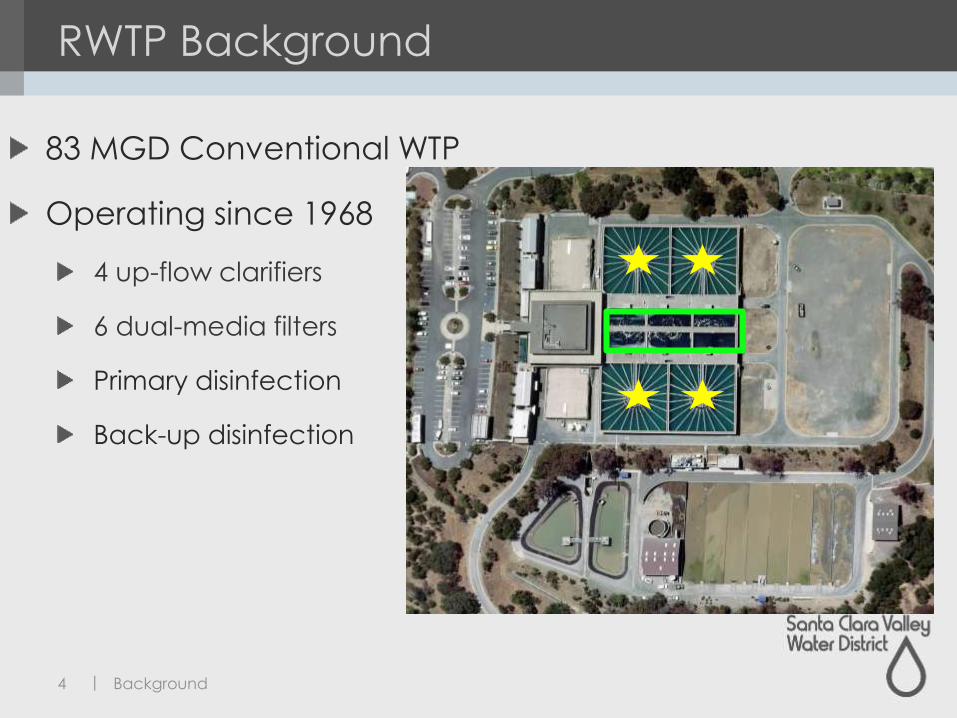
RWTP Background
4 Background
83 MGD Conventional WTP
Operating since 1968
4 up-flow clarifiers
6 dual-media filters
Primary disinfection
Back-up disinfection
|
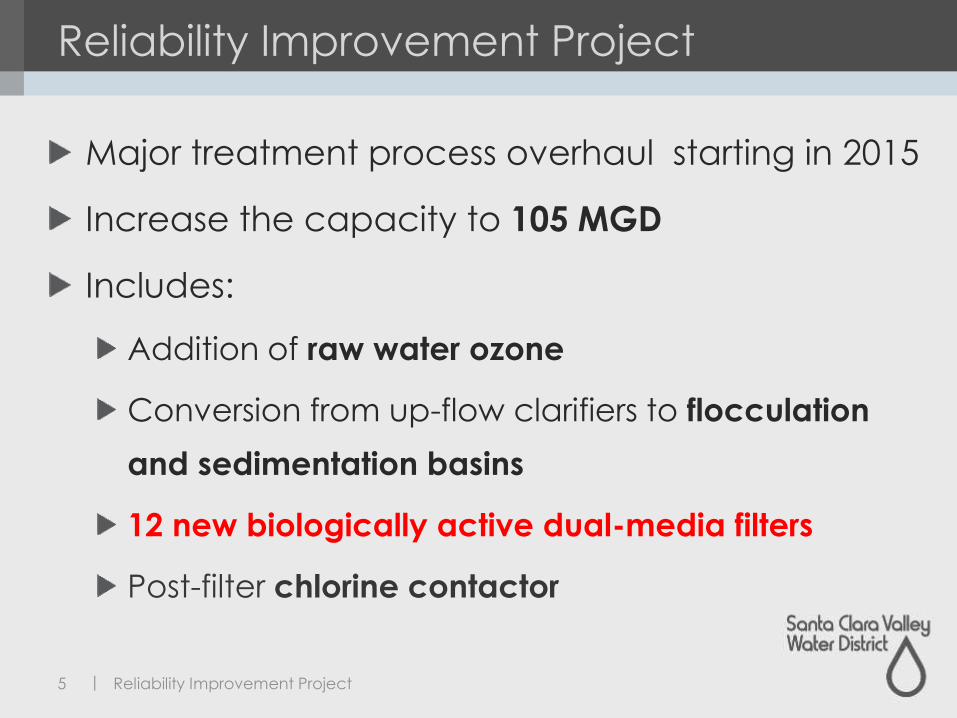
Reliability Improvement Project
Major treatment process overhaul starting in 2015
Increase the capacity to 105 MGD
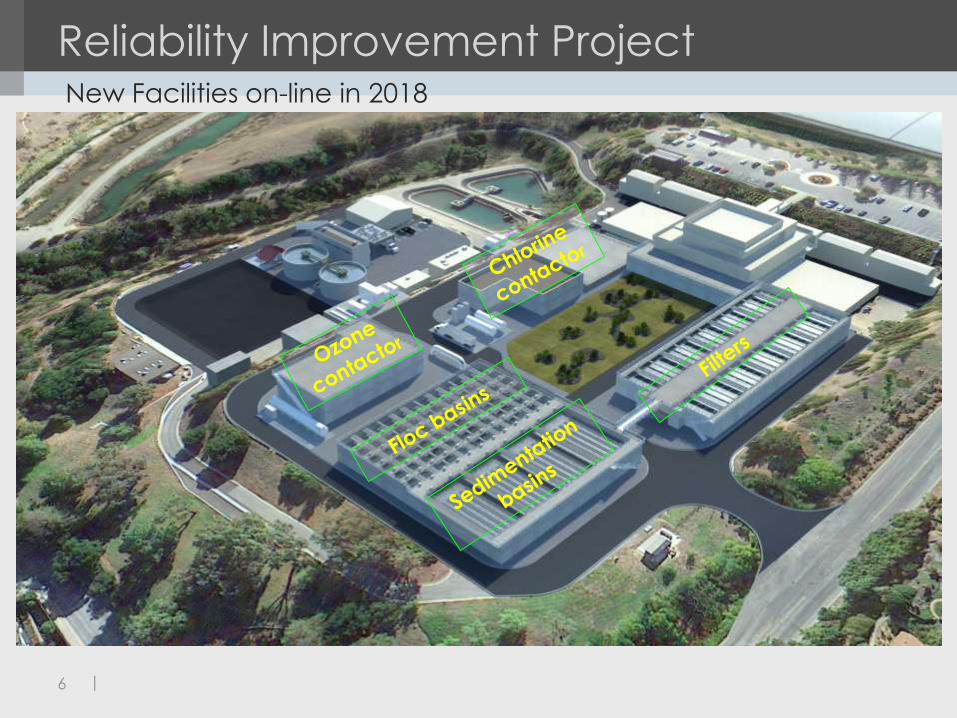
Includes:
Addition of raw water ozone
Conversion from up-flow clarifiers to flocculation
and sedimentation basins
12 new biologically active dual-media filters
Post-filter chlorine contactor
5 Reliability Improvement Project
|
Reliability Improvement ProjectNew Facilities on-line in 2018
6
|
Pilot Study Objectives
Evaluate the performance of different
dual-media configurations using
anthracite with various raw water
qualities at varying filtration rates.
Select the best-performing media
configuration to recommend for the
RWTP RIP final design documentation.
7 Objectives
|
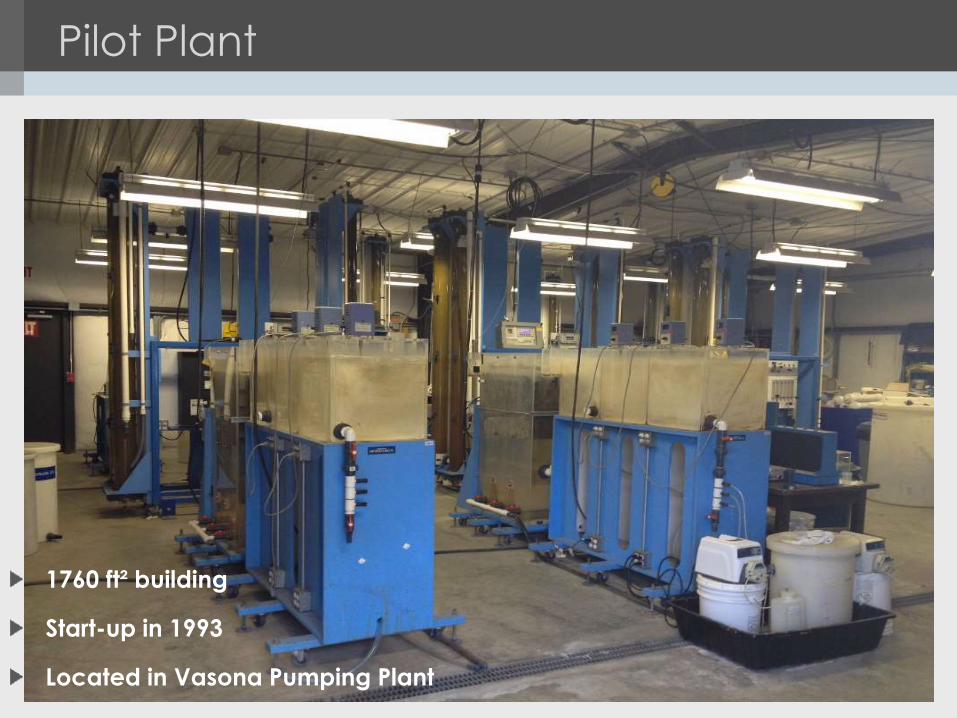
Pilot Plant
8
1760 ft² building
Start-up in 1993
Located in Vasona Pumping Plant
|
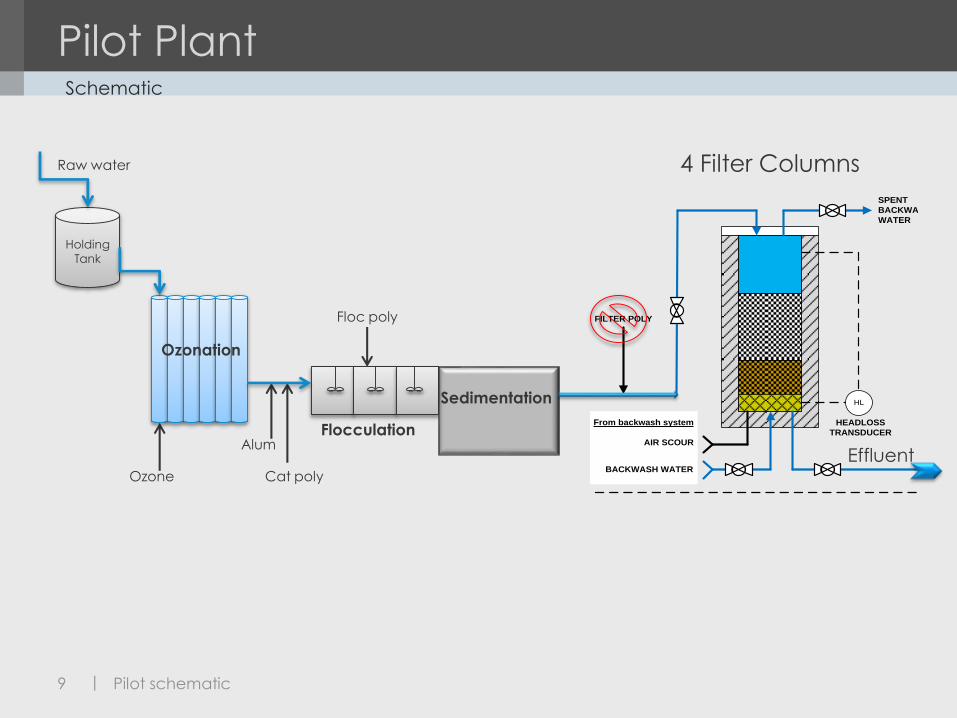
Pilot PlantSchematic
9 Pilot schematic
Raw water
Holding
Tank
Ozone
Alum
Cat poly
Flocculation
Sedimentation
Floc poly
Ozonation
M
VSC
From backwash system
AIR SCOUR
SPENT
BACKWASH
WATER
PCPROCESS
CONTROLLER
FLOW
INDICATING
TRANSMITTER
TURBTURBIDIMETER
HACH 1720C
FI ROTAMETER
HL
BACKWASH WATER
FILTER POLY
PROGRESSING
CAVITY PUMP
HEADLOSS
TRANSDUCER
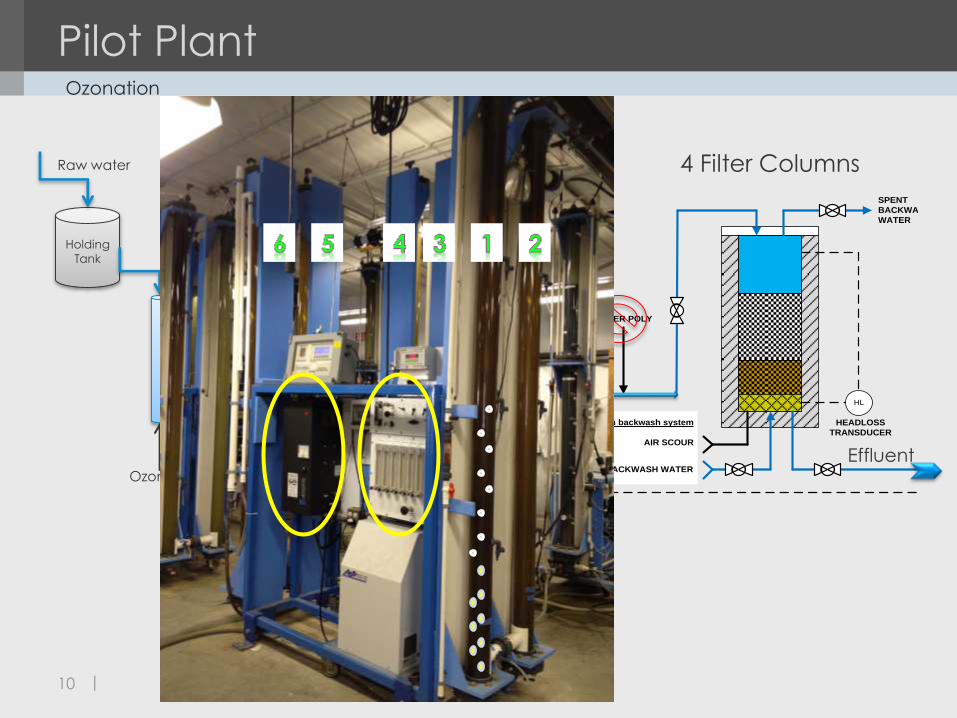
4 Filter Columns
Effluent
|
Pilot PlantOzonation
10
Raw water
Holding
Tank
Ozone
Alum
Cat poly
Flocculation
Sedimentation
Floc poly
Ozonation
M
VSC
From backwash system
AIR SCOUR
SPENT
BACKWASH
WATER
PCPROCESS
CONTROLLER
FLOW
INDICATING
TRANSMITTER
TURBTURBIDIMETER
HACH 1720C
FI ROTAMETER
HL
BACKWASH WATER
FILTER POLY
PROGRESSING
CAVITY PUMP
HEADLOSS
TRANSDUCER
4 Filter Columns
Effluent
|
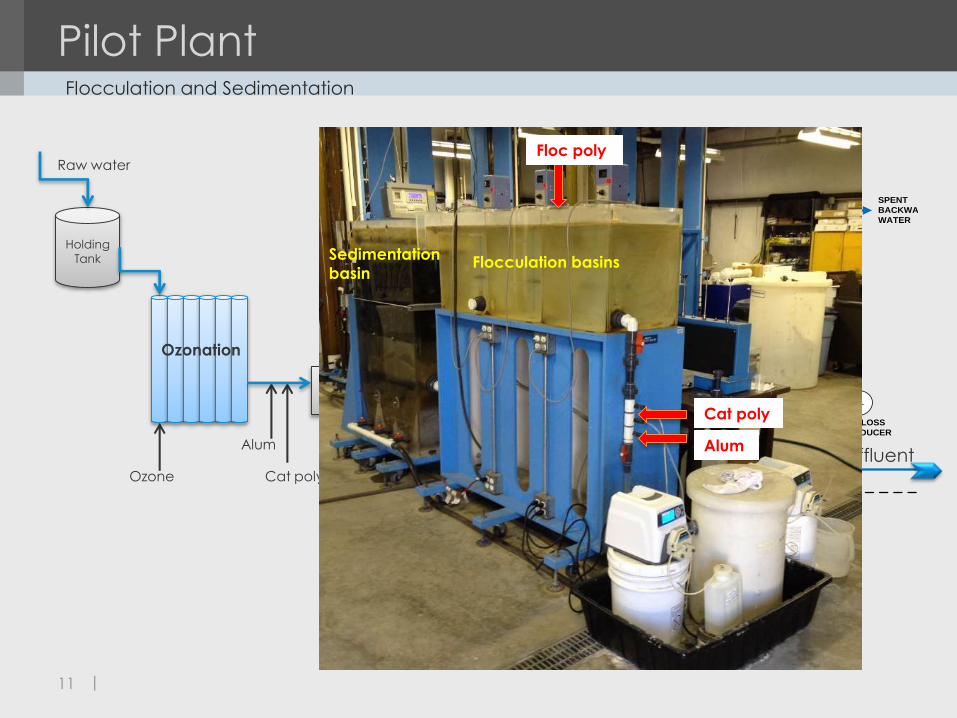
Pilot PlantFlocculation and Sedimentation
11
Raw water
Holding
Tank
Ozone
Alum
Cat poly
Flocculation
Sedimentation
Floc poly
Ozonation
M
VSC
From backwash system
AIR SCOUR
SPENT
BACKWASH
WATER
PCPROCESS
CONTROLLER
FLOW
INDICATING
TRANSMITTER
TURBTURBIDIMETER
HACH 1720C
FI ROTAMETER
HL
BACKWASH WATER
FILTER POLY
PROGRESSING
CAVITY PUMP
HEADLOSS
TRANSDUCER
4 Filter Columns
EffluentAlum
Cat poly
Floc poly
Flocculation basinsSedimentation
basin
|
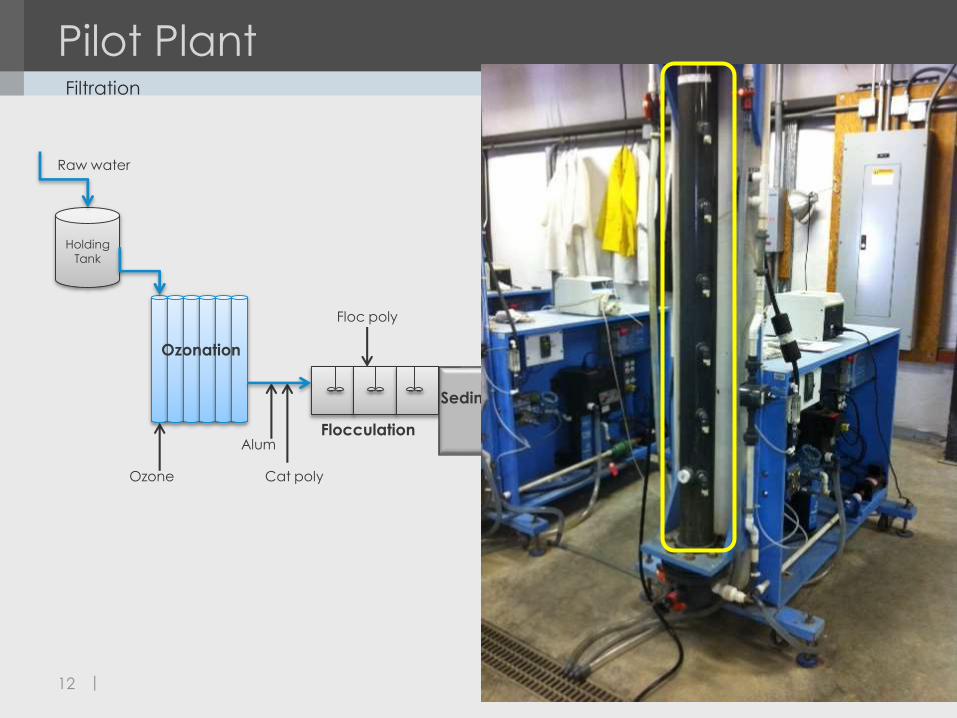
Pilot PlantFiltration
12
Raw water
Holding
Tank
Ozone
Alum
Cat poly
Flocculation
Sedimentation
Floc poly
Ozonation
M
VSC
From backwash system
AIR SCOUR
SPENT
BACKWASH
WATER
PCPROCESS
CONTROLLER
FLOW
INDICATING
TRANSMITTER
TURBTURBIDIMETER
HACH 1720C
FI ROTAMETER
HL
BACKWASH WATER
FILTER POLY
PROGRESSING
CAVITY PUMP
HEADLOSS
TRANSDUCER
4 Filter Columns
Effluent
|
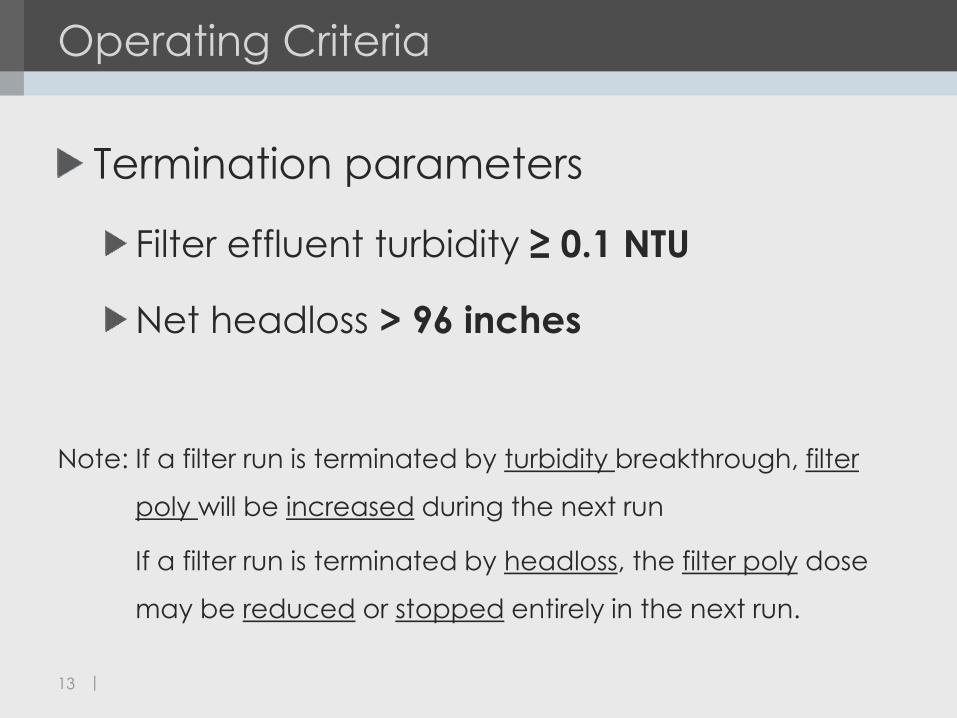
Operating Criteria
13
Termination parameters
Filter effluent turbidity ≥ 0.1 NTU
Net headloss > 96 inches
Note: If a filter run is terminated by turbidity breakthrough, filter
poly will be increased during the next run
If a filter run is terminated by headloss, the filter poly dose
may be reduced or stopped entirely in the next run.
|
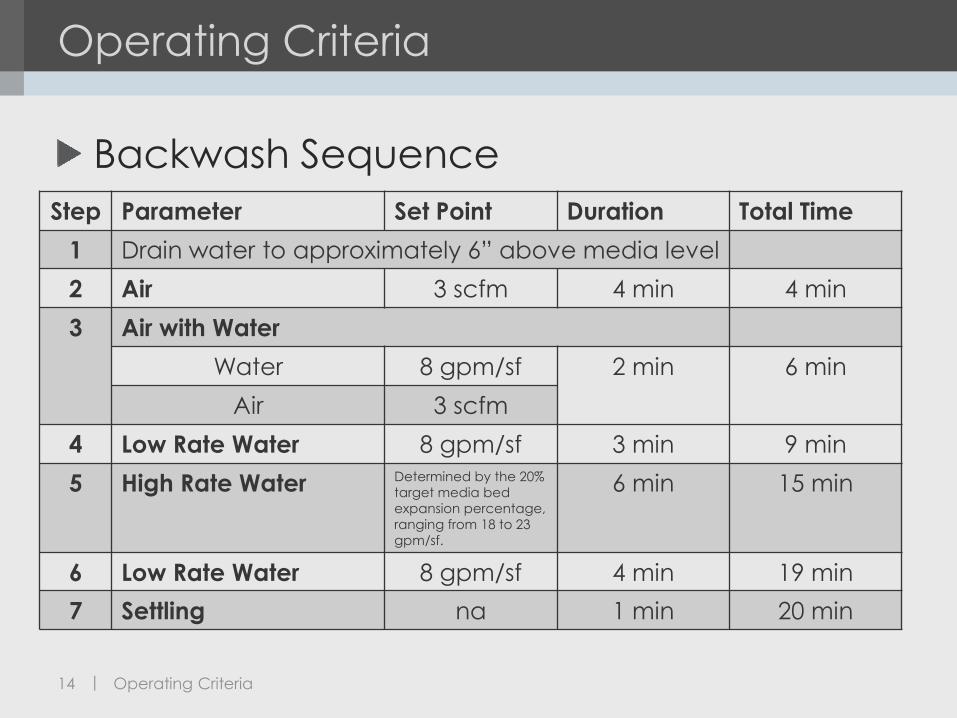
Operating Criteria
Step Parameter Set Point Duration Total Time
1 Drain water to approximately 6” above media level
2 Air 3 scfm 4 min 4 min
3 Air with Water
Water 8 gpm/sf 2 min 6 min
Air 3 scfm
4 Low Rate Water 8 gpm/sf 3 min 9 min
5 High Rate Water Determined by the 20%
target media bed
expansion percentage,
ranging from 18 to 23
gpm/sf.
6 min 15 min
6 Low Rate Water 8 gpm/sf 4 min 19 min
7 Settling na 1 min 20 min
14 Operating Criteria
Backwash Sequence
|
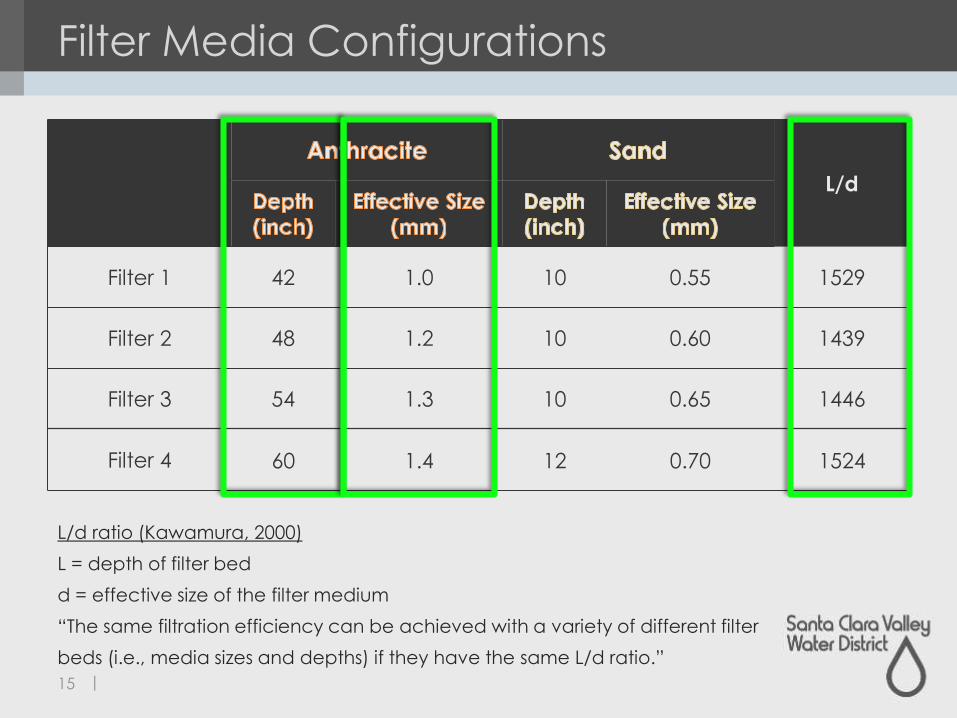
Filter Media Configurations
15
L/d
Filter 1 42 1.0 10 0.55 1529
Filter 2 48 1.2 10 0.60 1439
Filter 3 54 1.3 10 0.65 1446
Filter 4 60 1.4 12 0.70 1524
L/d ratio (Kawamura, 2000)
L = depth of filter bed
d = effective size of the filter medium
“The same filtration efficiency can be achieved with a variety of different filter
beds (i.e., media sizes and depths) if they have the same L/d ratio.”
|
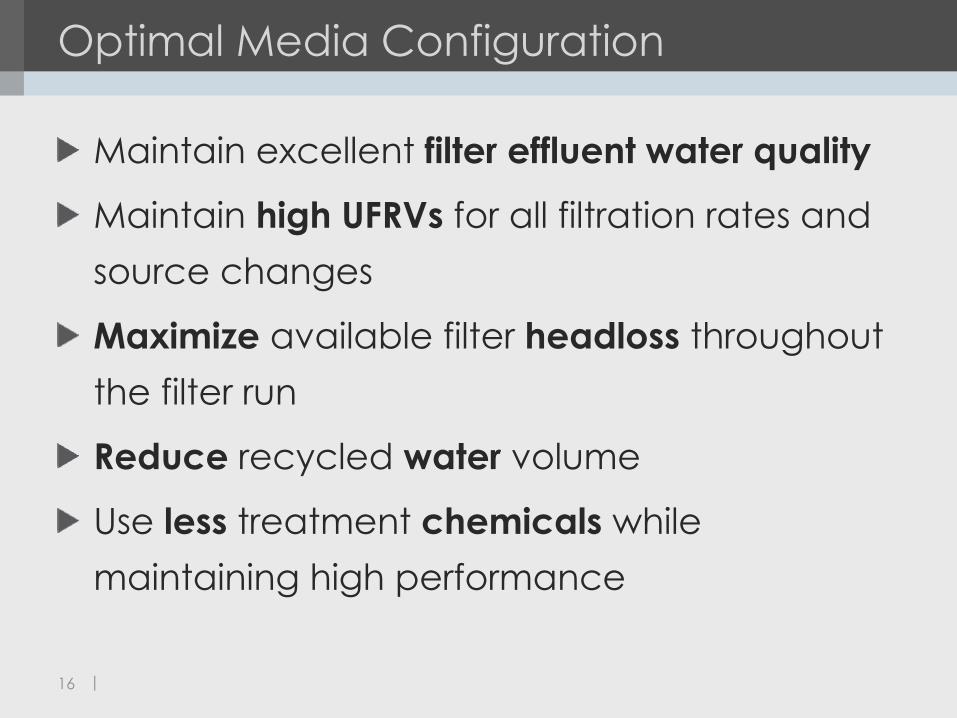
Optimal Media Configuration
16
Maintain excellent filter effluent water quality
Maintain high UFRVs for all filtration rates and
source changes
Maximize available filter headloss throughout
the filter run
Reduce recycled water volume
Use less treatment chemicals while
maintaining high performance
|
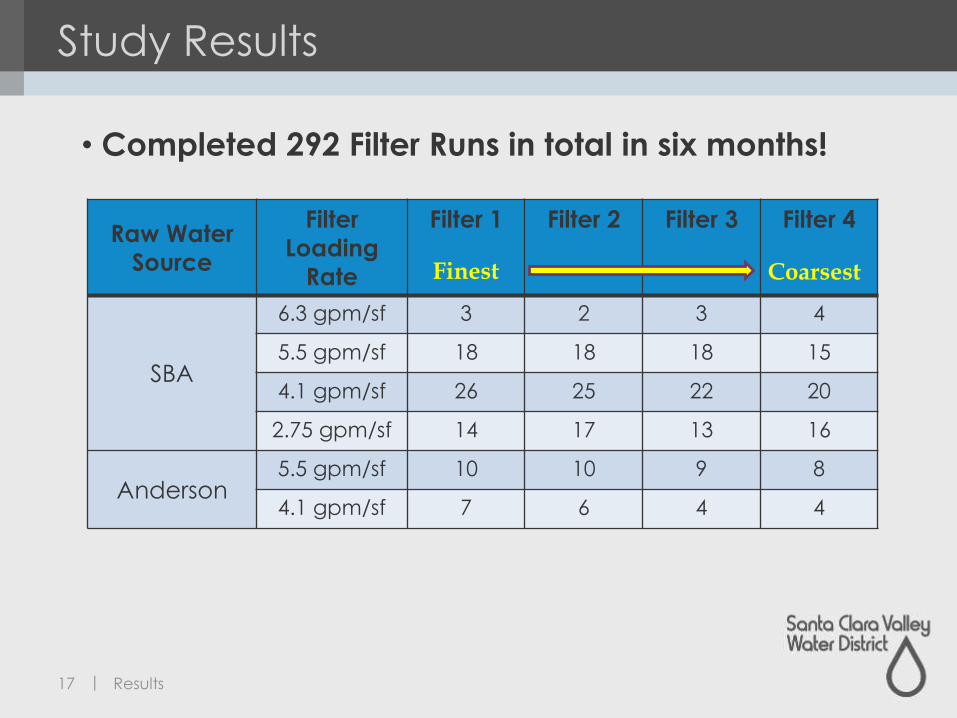
Study Results
17 Results
Raw Water
Source
Filter
Loading
Rate
Filter 1 Filter 2 Filter 3 Filter 4
SBA
6.3 gpm/sf 3 2 3 4
5.5 gpm/sf 18 18 18 15
4.1 gpm/sf 26 25 22 20
2.75 gpm/sf 14 17 13 16
Anderson5.5 gpm/sf 10 10 9 8
4.1 gpm/sf 7 6 4 4
• Completed 292 Filter Runs in total in six months!
Finest Coarsest
|
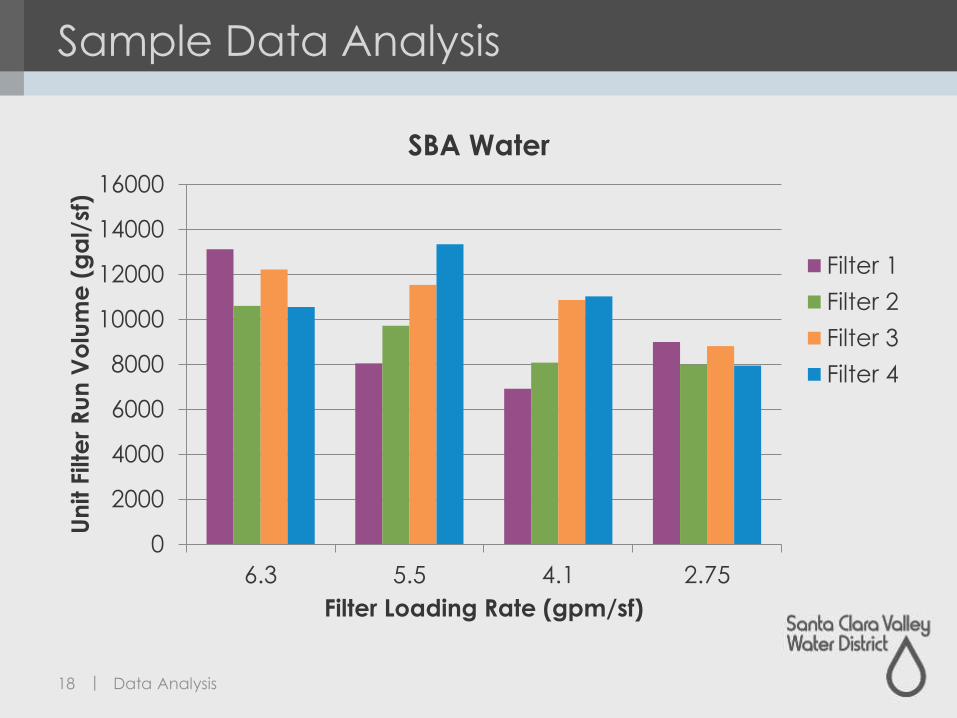
Sample Data Analysis
18 Data Analysis
0
2000
4000
6000
8000
10000
12000
14000
16000
6.3 5.5 4.1 2.75
Un
it F
ilte
r R
un
Vo
lum
e (
ga
l/sf
)
Filter Loading Rate (gpm/sf)
SBA Water
Filter 1
Filter 2
Filter 3
Filter 4
|
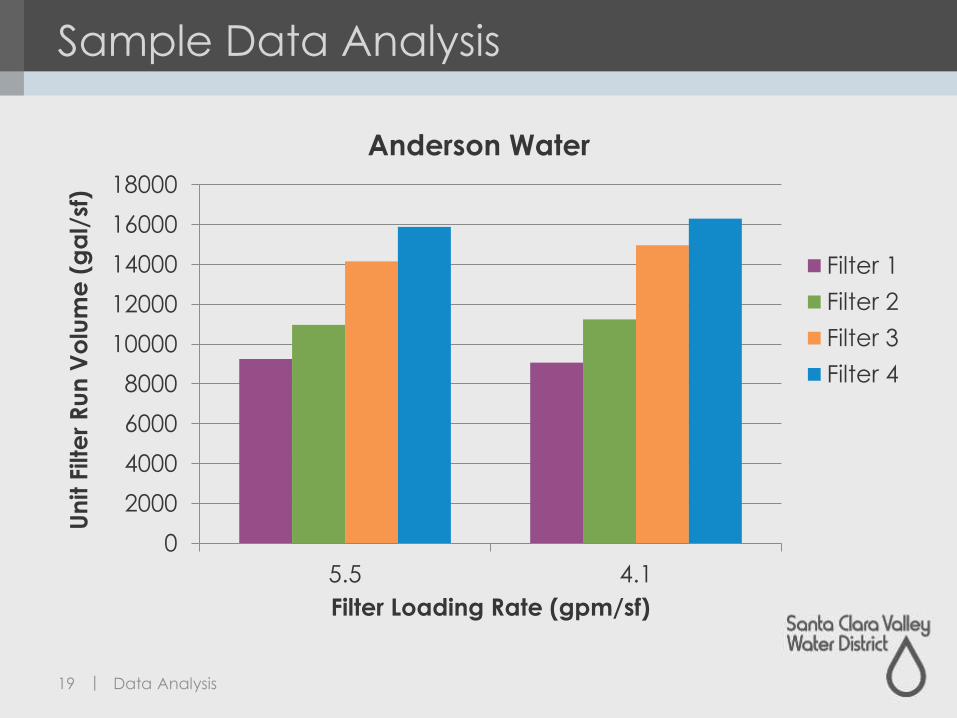
Sample Data Analysis
19 Data Analysis
0
2000
4000
6000
8000
10000
12000
14000
16000
18000
5.5 4.1
Un
it F
ilte
r R
un
Vo
lum
e (
ga
l/sf
)
Filter Loading Rate (gpm/sf)
Anderson Water
Filter 1
Filter 2
Filter 3
Filter 4
|
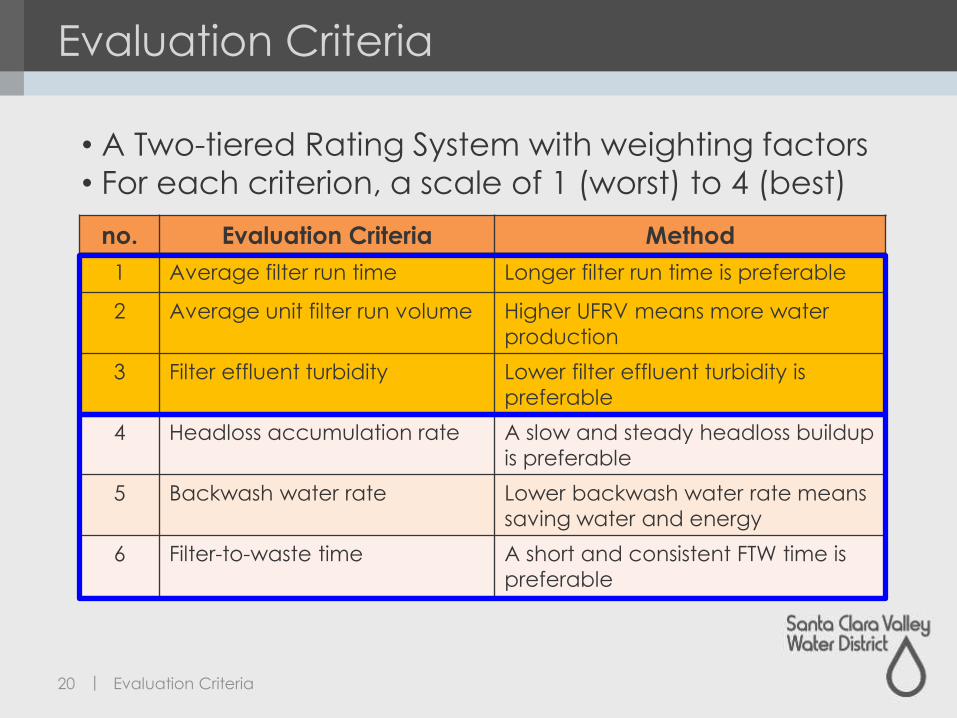
Evaluation Criteria
20 Evaluation Criteria
no. Evaluation Criteria Method
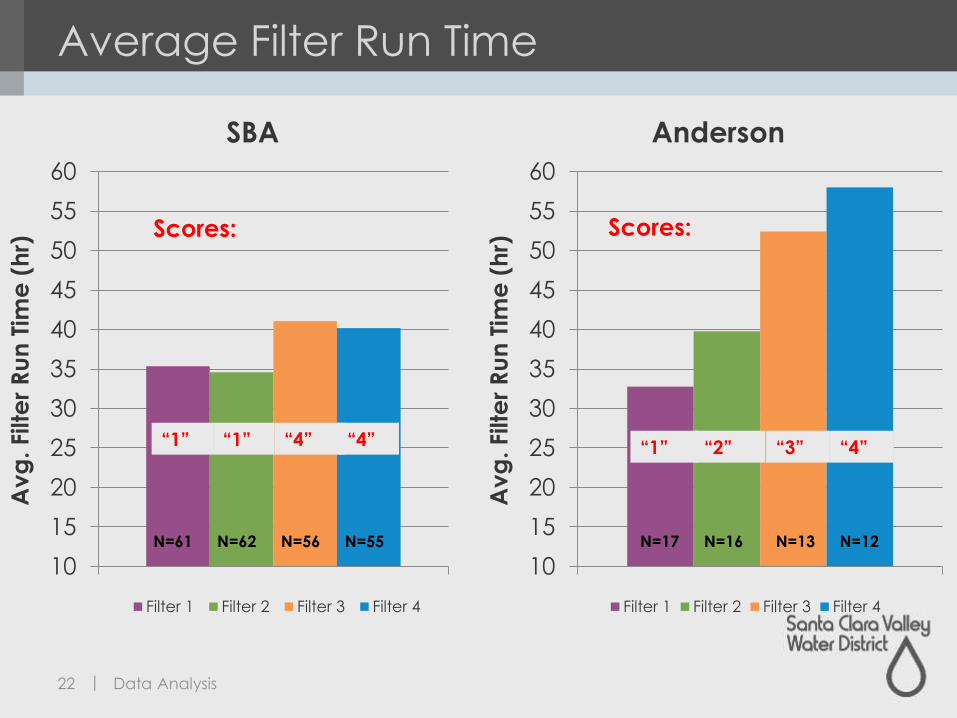
1 Average filter run time Longer filter run time is preferable
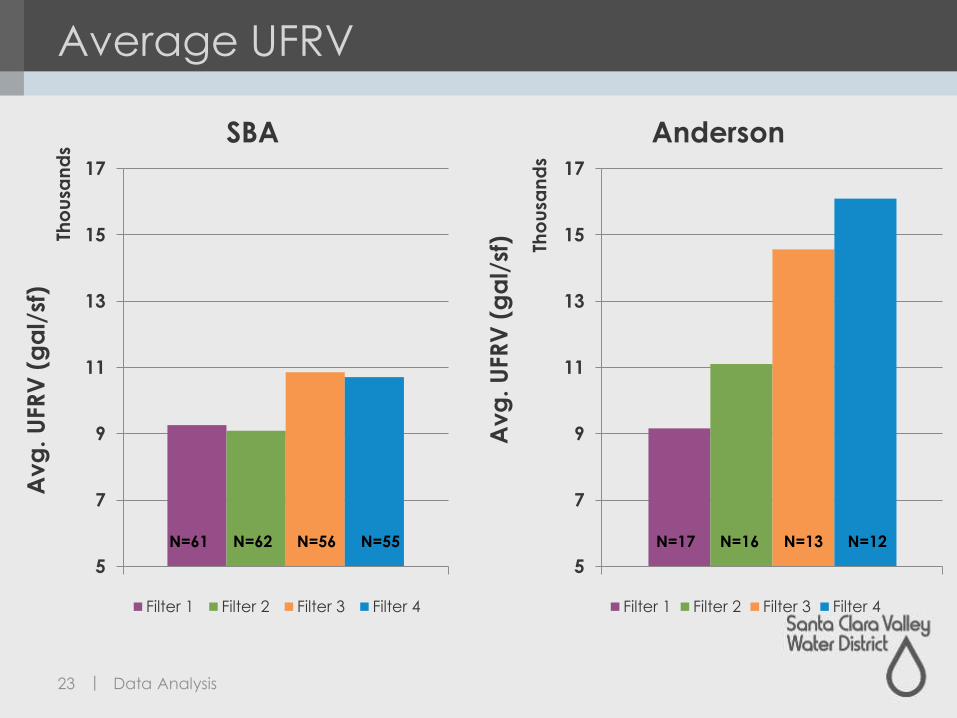
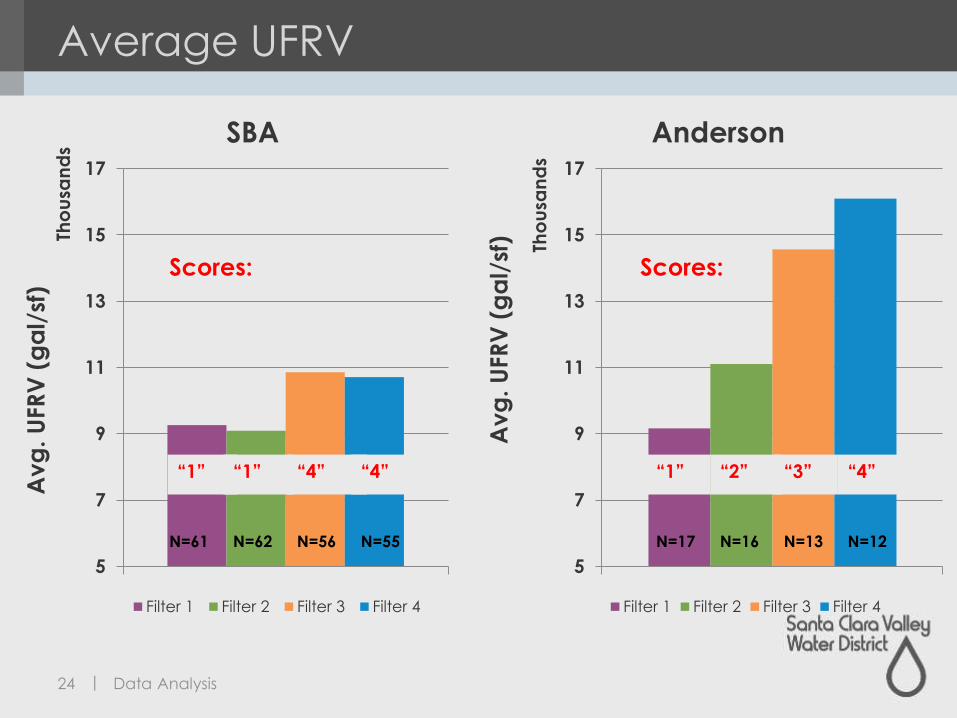
2 Average unit filter run volume Higher UFRV means more water
production
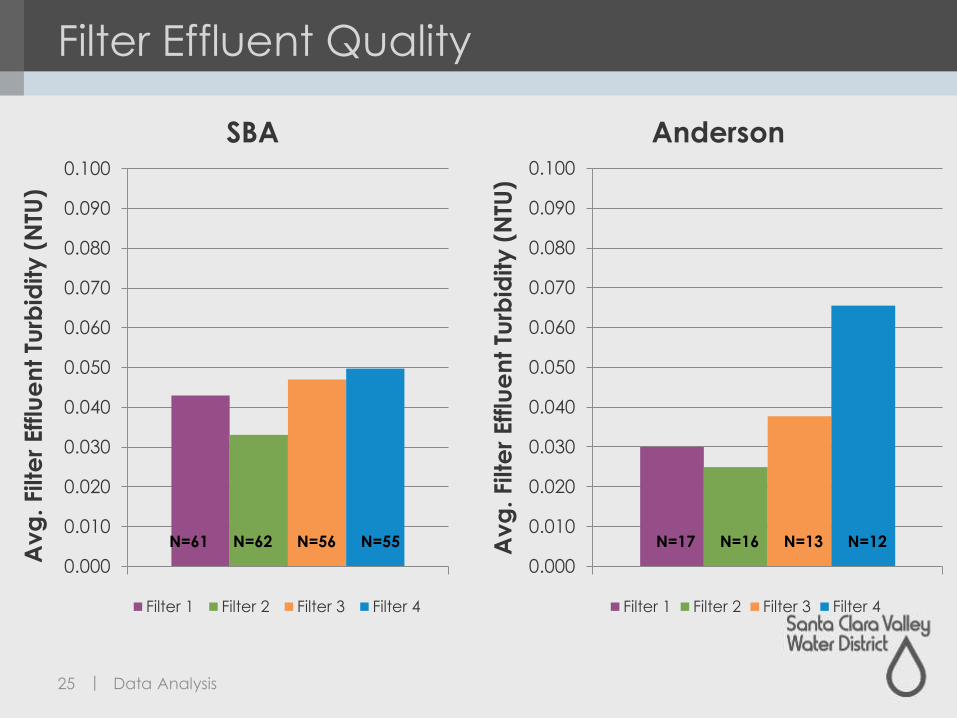
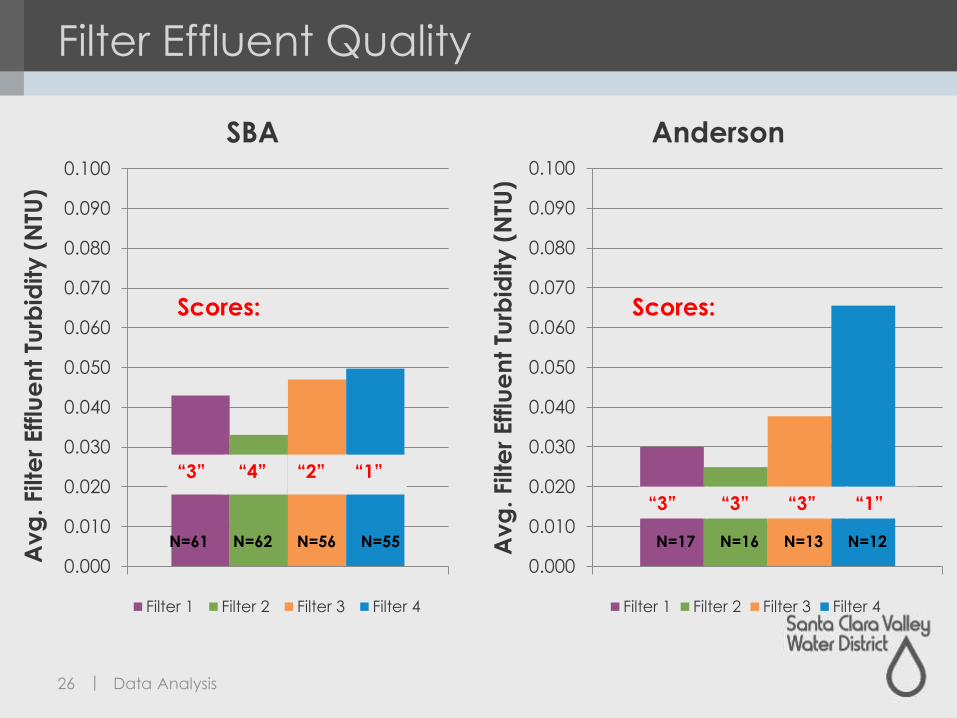
3 Filter effluent turbidity Lower filter effluent turbidity is
preferable
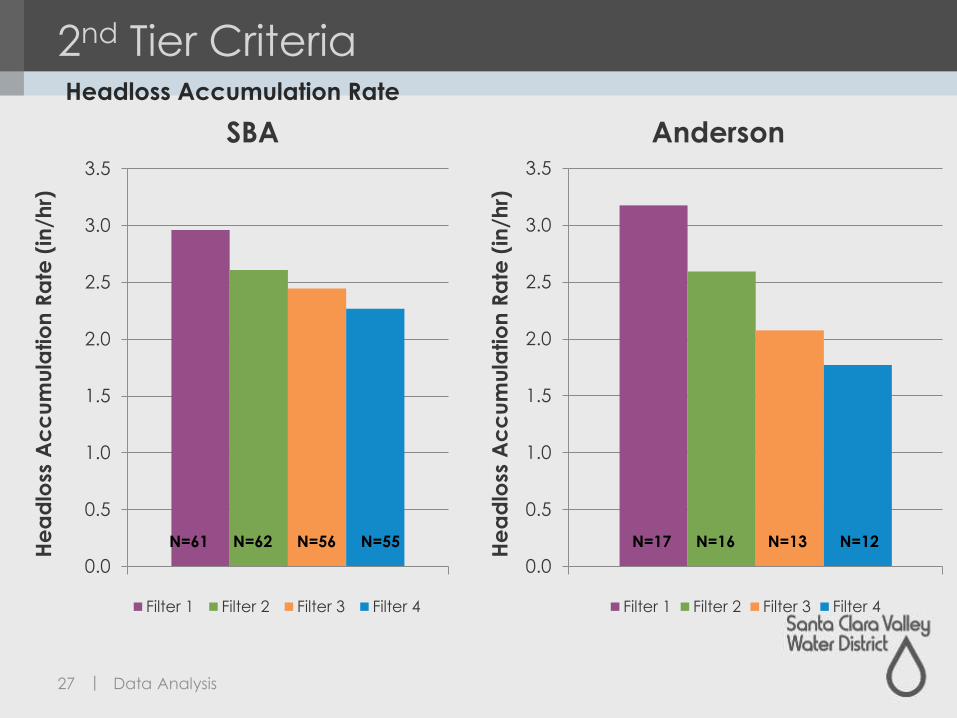
4 Headloss accumulation rate A slow and steady headloss buildup
is preferable
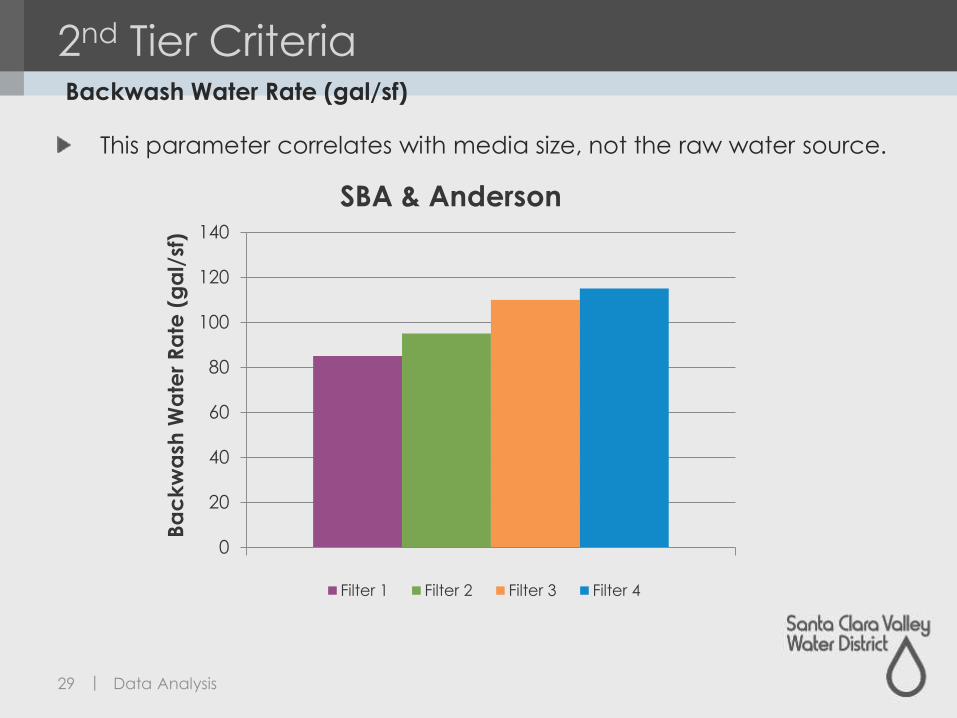
5 Backwash water rate Lower backwash water rate means
saving water and energy
6 Filter-to-waste time A short and consistent FTW time is
preferable
• A Two-tiered Rating System with weighting factors
• For each criterion, a scale of 1 (worst) to 4 (best)
|
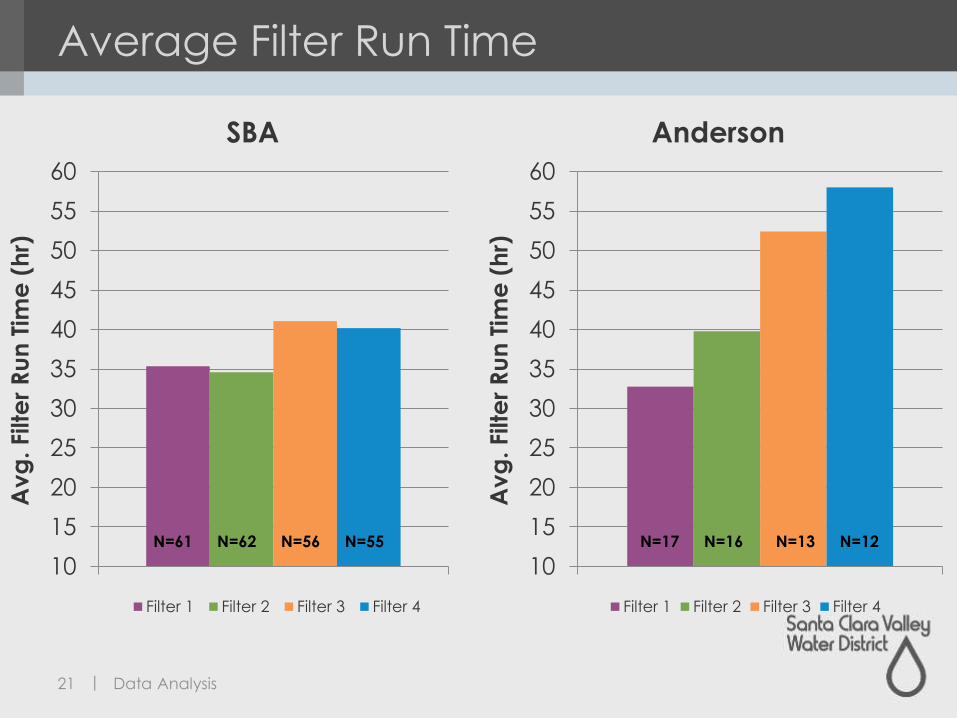
Average Filter Run Time
21 Data Analysis
10
15
20
25
30
35
40
45
50
55
60
Av
g. Filte
r R
un
Tim
e (
hr)
SBA
Filter 1 Filter 2 Filter 3 Filter 4
N=61 N=62 N=56 N=55
10
15
20
25
30
35
40
45
50
55
60
Av
g. Filte
r R
un
Tim
e (
hr)
Anderson
Filter 1 Filter 2 Filter 3 Filter 4
N=17 N=16 N=13 N=12
|
Average Filter Run Time
22 Data Analysis
10
15
20
25
30
35
40
45
50
55
60
Av
g. Filte
r R
un
Tim
e (
hr)
SBA
Filter 1 Filter 2 Filter 3 Filter 4
N=61 N=62 N=56 N=55
“1” “1” “4” “4”
10
15
20
25
30
35
40
45
50
55
60
Av
g. Filte
r R
un
Tim
e (
hr)
Anderson
Filter 1 Filter 2 Filter 3 Filter 4
N=17 N=16 N=13 N=12
Scores:
“1” “2” “3” “4”
Scores:
|
Average UFRV
23 Data Analysis
5
7
9
11
13
15
17
Av
g. U
FR
V (
ga
l/sf
)Th
ou
san
ds
SBA
Filter 1 Filter 2 Filter 3 Filter 4
N=61 N=62 N=56 N=55
5
7
9
11
13
15
17
Av
g. U
FR
V (
ga
l/sf
) Tho
usa
nd
s
Anderson
Filter 1 Filter 2 Filter 3 Filter 4
N=17 N=16 N=13 N=12
|
Average UFRV
24 Data Analysis
5
7
9
11
13
15
17
Av
g. U
FR
V (
ga
l/sf
)Th
ou
san
ds
SBA
Filter 1 Filter 2 Filter 3 Filter 4
N=61 N=62 N=56 N=55
“1” “1” “4” “4”
Scores:
5
7
9
11
13
15
17
Av
g. U
FR
V (
ga
l/sf
) Tho
usa
nd
s
Anderson
Filter 1 Filter 2 Filter 3 Filter 4
N=17 N=16 N=13 N=12
Scores:
“1” “2” “3” “4”
|
Filter Effluent Quality
25 Data Analysis
0.000
0.010
0.020
0.030
0.040
0.050
0.060
0.070
0.080
0.090
0.100
Av
g. Filte
r Efflu
en
t Tu
rbid
ity
(N
TU)
SBA
Filter 1 Filter 2 Filter 3 Filter 4
N=61 N=62 N=56 N=55
0.000
0.010
0.020
0.030
0.040
0.050
0.060
0.070
0.080
0.090
0.100
Av
g. Filte
r Eff
lue
nt
Turb
idity
(N
TU)
Anderson
Filter 1 Filter 2 Filter 3 Filter 4
N=17 N=16 N=13 N=12
|
Filter Effluent Quality
26 Data Analysis
0.000
0.010
0.020
0.030
0.040
0.050
0.060
0.070
0.080
0.090
0.100
Av
g. Filte
r Efflu
en
t Tu
rbid
ity
(N
TU)
SBA
Filter 1 Filter 2 Filter 3 Filter 4
N=61 N=62 N=56 N=55
“3” “4” “2” “1”
Scores:
0.000
0.010
0.020
0.030
0.040
0.050
0.060
0.070
0.080
0.090
0.100
Av
g. Filte
r Eff
lue
nt
Turb
idity
(N
TU)
Anderson
Filter 1 Filter 2 Filter 3 Filter 4
N=17 N=16 N=13 N=12
“3” “3” “3” “1”
Scores:
|
2nd Tier Criteria
27
Headloss Accumulation Rate
Data Analysis
0.0
0.5
1.0
1.5
2.0
2.5
3.0
3.5
He
ad
loss
Ac
cu
mu
latio
n R
ate
(in
/hr)
SBA
Filter 1 Filter 2 Filter 3 Filter 4
N=61 N=62 N=56 N=55
0.0
0.5
1.0
1.5
2.0
2.5
3.0
3.5
He
ad
loss
Ac
cu
mu
latio
n R
ate
(in
/hr)
Anderson
Filter 1 Filter 2 Filter 3 Filter 4
N=17 N=16 N=13 N=12
|
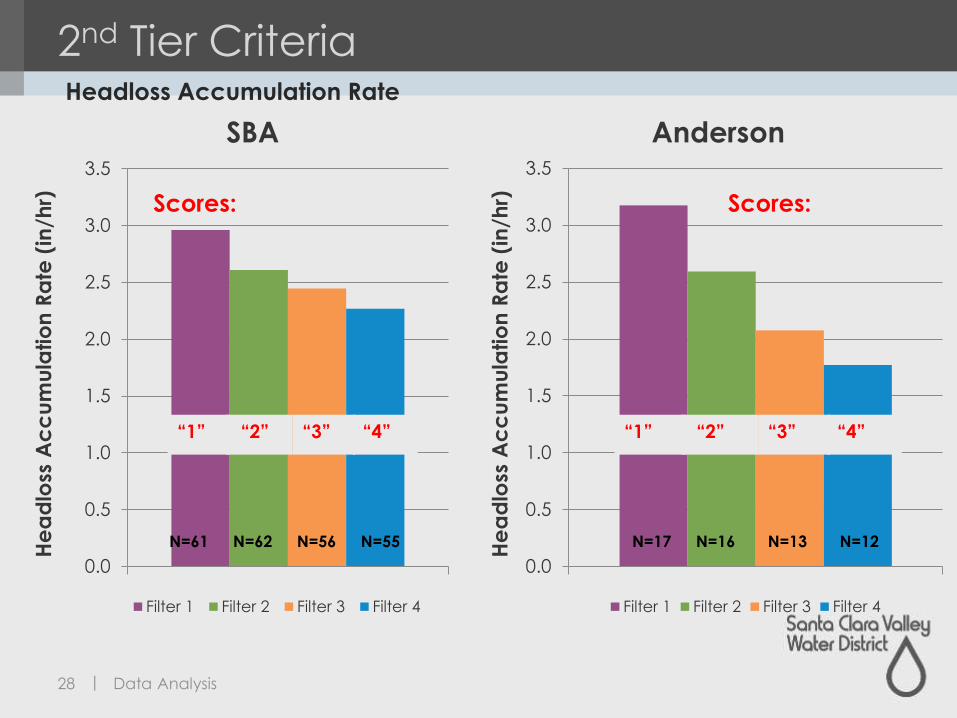
2nd Tier Criteria
28
Headloss Accumulation Rate
Data Analysis
0.0
0.5
1.0
1.5
2.0
2.5
3.0
3.5
He
ad
loss
Ac
cu
mu
latio
n R
ate
(in
/hr)
SBA
Filter 1 Filter 2 Filter 3 Filter 4
N=61 N=62 N=56 N=55
“1” “2” “3” “4”
Scores:
0.0
0.5
1.0
1.5
2.0
2.5
3.0
3.5
He
ad
loss
Ac
cu
mu
latio
n R
ate
(in
/hr)
Anderson
Filter 1 Filter 2 Filter 3 Filter 4
N=17 N=16 N=13 N=12
“1” “2” “3” “4”
Scores:
|
2nd Tier Criteria
29
Backwash Water Rate (gal/sf)
Data Analysis
0
20
40
60
80
100
120
140
Ba
ck
wa
sh W
ate
r R
ate
(g
al/
sf)
SBA & Anderson
Filter 1 Filter 2 Filter 3 Filter 4
This parameter correlates with media size, not the raw water source.
|
2nd Tier Criteria
30
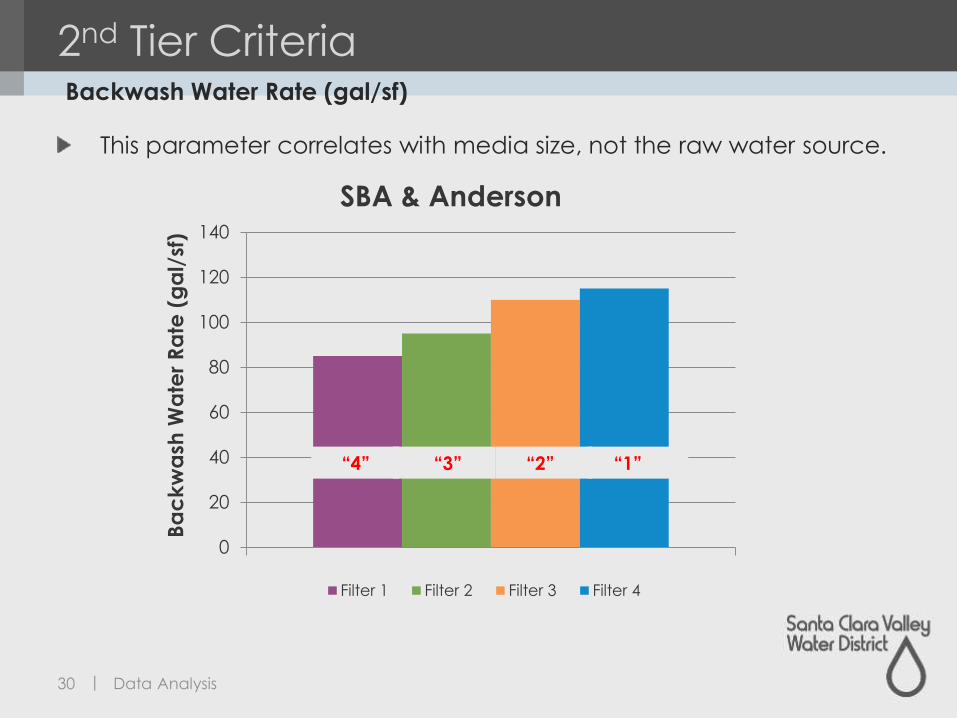
Backwash Water Rate (gal/sf)
Data Analysis
0
20
40
60
80
100
120
140
Ba
ck
wa
sh W
ate
r R
ate
(g
al/
sf)
SBA & Anderson
Filter 1 Filter 2 Filter 3 Filter 4
“4” “3” “2” “1”
This parameter correlates with media size, not the raw water source.
|
2nd Tier Criteria
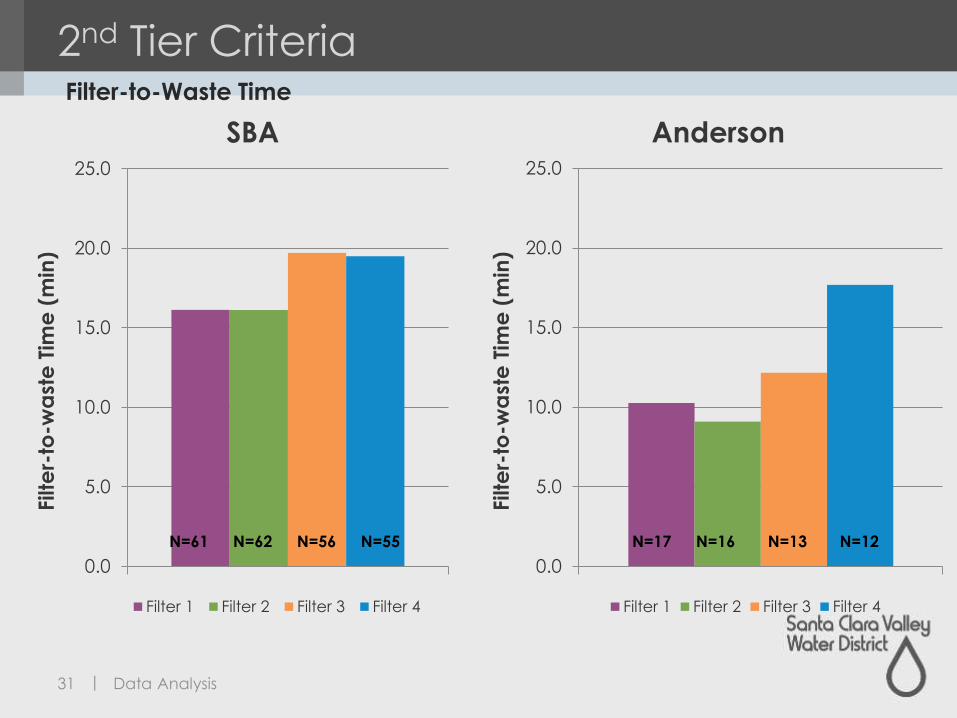
31
Filter-to-Waste Time
Data Analysis
0.0
5.0
10.0
15.0
20.0
25.0
Filte
r-to
-wa
ste
Tim
e (
min
)
SBA
Filter 1 Filter 2 Filter 3 Filter 4
N=61 N=62 N=56 N=55
0.0
5.0
10.0
15.0
20.0
25.0
Filte
r-to
-wa
ste
Tim
e (
min
)
Anderson
Filter 1 Filter 2 Filter 3 Filter 4
N=17 N=16 N=13 N=12
|
2nd Tier Criteria
32
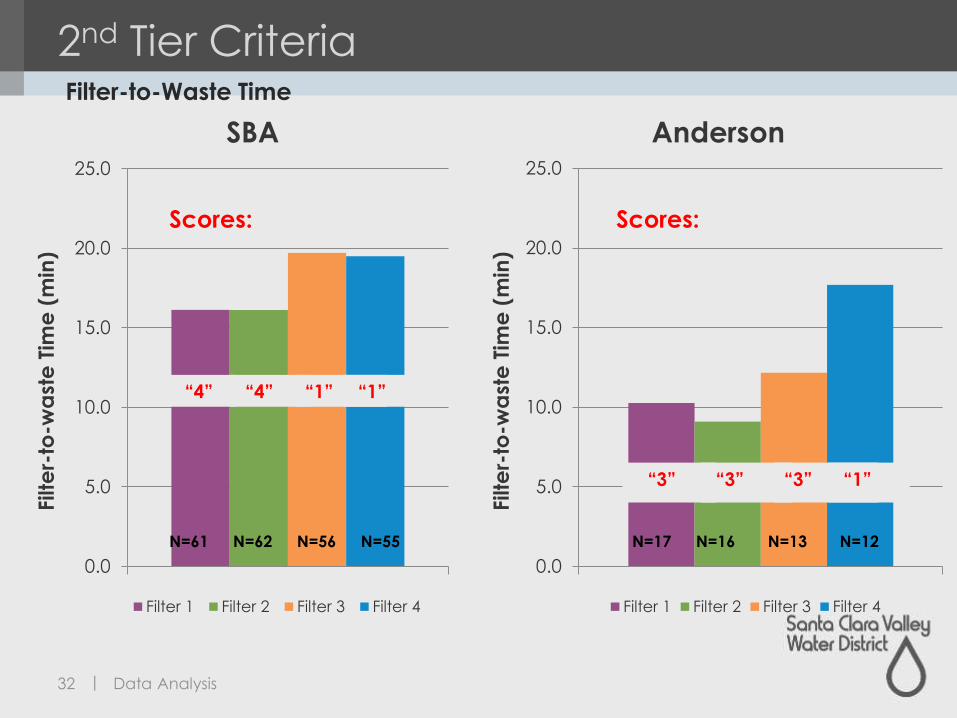
Filter-to-Waste Time
Data Analysis
0.0
5.0
10.0
15.0
20.0
25.0
Filte
r-to
-wa
ste
Tim
e (
min
)
SBA
Filter 1 Filter 2 Filter 3 Filter 4
N=61 N=62 N=56 N=55
“4” “4” “1” “1”
Scores:
0.0
5.0
10.0
15.0
20.0
25.0
Filte
r-to
-wa
ste
Tim
e (
min
)
Anderson
Filter 1 Filter 2 Filter 3 Filter 4
N=17 N=16 N=13 N=12
Scores:
“3” “3” “3” “1”
|
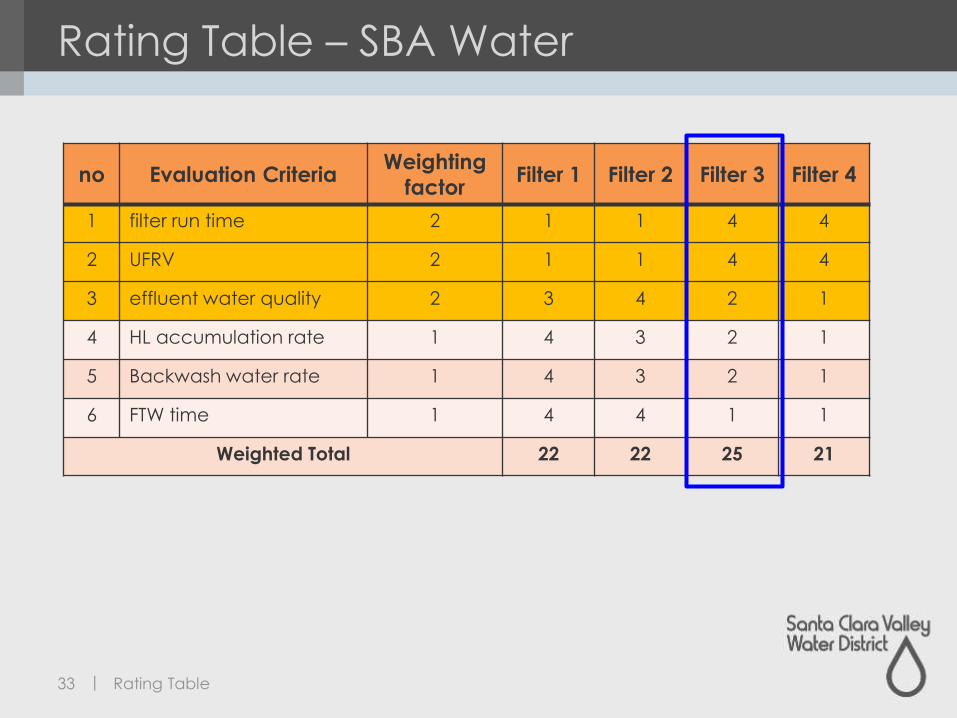
Rating Table – SBA Water
33 Rating Table
no Evaluation CriteriaWeighting
factorFilter 1 Filter 2 Filter 3 Filter 4
1 filter run time 2 1 1 4 4
2 UFRV 2 1 1 4 4
3 effluent water quality 2 3 4 2 1
4 HL accumulation rate 1 4 3 2 1
5 Backwash water rate 1 4 3 2 1
6 FTW time 1 4 4 1 1
Weighted Total 22 22 25 21
|
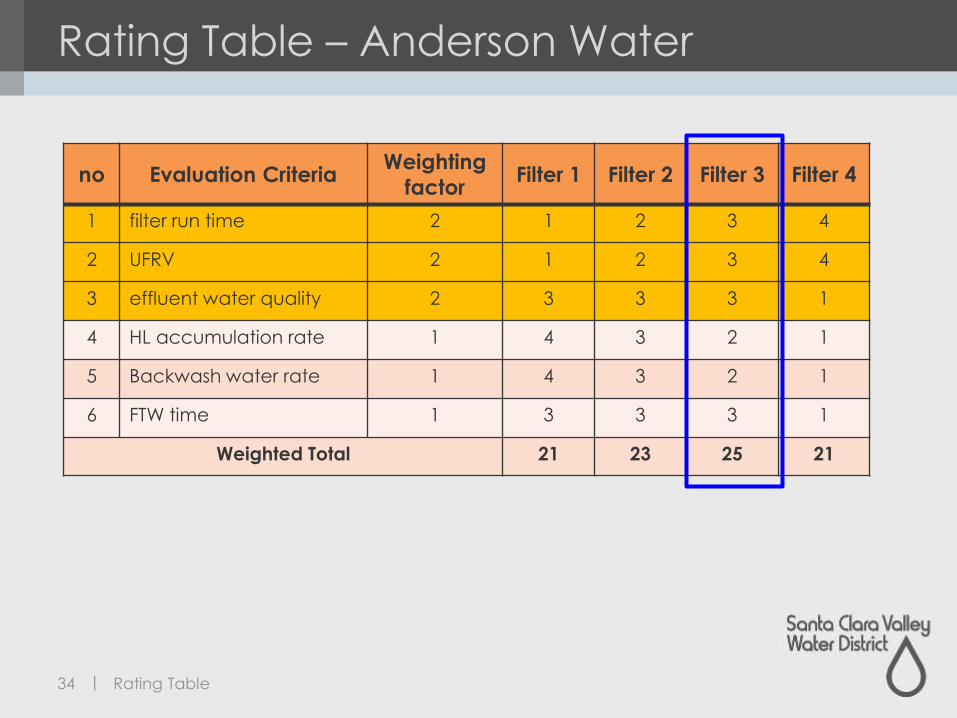
Rating Table – Anderson Water
34 Rating Table
no Evaluation CriteriaWeighting
factorFilter 1 Filter 2 Filter 3 Filter 4
1 filter run time 2 1 2 3 4
2 UFRV 2 1 2 3 4
3 effluent water quality 2 3 3 3 1
4 HL accumulation rate 1 4 3 2 1
5 Backwash water rate 1 4 3 2 1
6 FTW time 1 3 3 3 1
Weighted Total 21 23 25 21
|
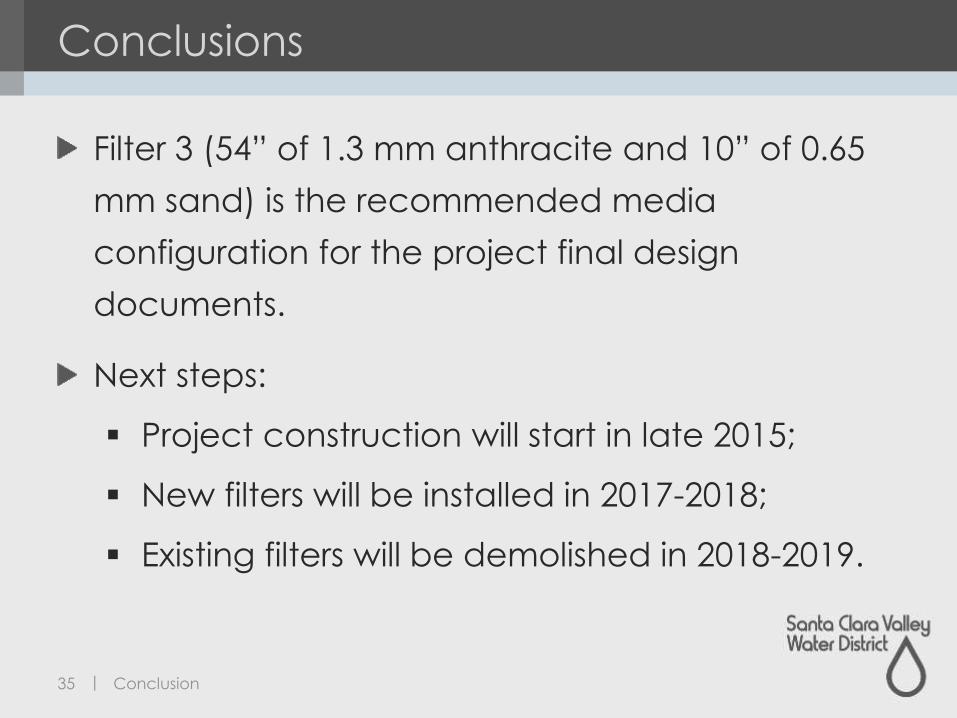
Conclusions
Filter 3 (54” of 1.3 mm anthracite and 10” of 0.65
mm sand) is the recommended media
configuration for the project final design
documents.
35 Conclusion
Next steps:
Project construction will start in late 2015;
New filters will be installed in 2017-2018;
Existing filters will be demolished in 2018-2019.
|
Acknowledgement
Four Units within the District
CDM Smith
All in all, to run this study 24-7:
5 WQ engineers + 3 interns + 1 WTP operator
36 Acknowledgement

|38
|
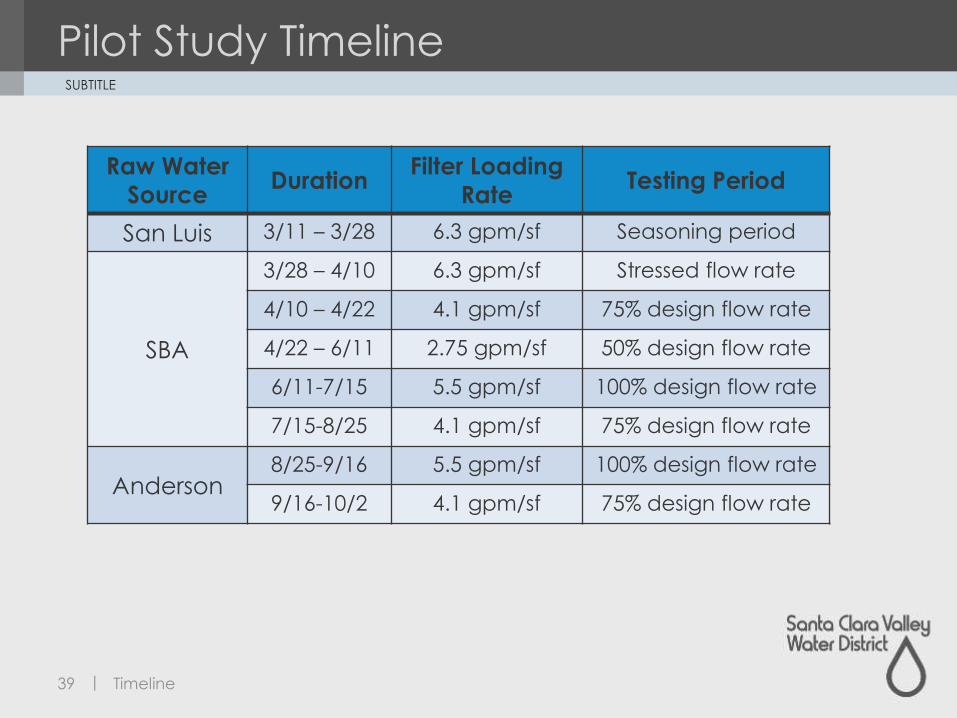
Pilot Study Timeline
39
SUBTITLE
Timeline
Raw Water
SourceDuration
Filter Loading
RateTesting Period
San Luis 3/11 – 3/28 6.3 gpm/sf Seasoning period
SBA
3/28 – 4/10 6.3 gpm/sf Stressed flow rate
4/10 – 4/22 4.1 gpm/sf 75% design flow rate
4/22 – 6/11 2.75 gpm/sf 50% design flow rate
6/11-7/15 5.5 gpm/sf 100% design flow rate
7/15-8/25 4.1 gpm/sf 75% design flow rate
Anderson8/25-9/16 5.5 gpm/sf 100% design flow rate
9/16-10/2 4.1 gpm/sf 75% design flow rate