Embed Size (px)
Citation preview
NEDBANK GROUP LimitED iNtEGRAtED REPORt 2010146
Nedbank Group follows a policy of enterprisewide risk management
(ERM), which aligns strategy, policies, charters, people, processes,
technology and knowledge in order to evaluate and manage the
opportunities, threats and uncertainties the group may face in
its ongoing efforts to create shareholder value. ERM also seeks to
integrate risk and capital management across the group’s entire
risk universe, including business units and operating divisions,
geographical locations and legal entities.
Against this backdrop, all risks – including those associated with sustainability – are managed according to a ‘three lines of defence’ model. It is the Nedbank Group’s view that a strong risk governance process is the foundation for successful risk management, which is why this model represents the core of the business’ Enterprisewide Risk Management Framework (ERMF). The ERMF places emphasis on accountability, responsibility, independence, reporting, communications and transparency, and comprises 17 risk categories that are managed, monitored, measured and reported on by the first, second and third line-of-defence functions.
The responsibilities of each of these lines of defence are as follows:
Nedbank Group has also developed individual risk frameworks for the effective management of social, environmental, and transformation risk. These frameworks serve as best-practice guidelines for the management of risks associated with these pillars of sustainability within the organisation, offering clear governance structures (committees, charters and policies) to deal with risks associated with the group’s sustainability objectives.
The sustainability governance structures and policy framework are detailed on page 95.
OutlOOk fOr 2011To build on the solid foundation established in 2010 the strategic emphasis will be placed on the following:
• Being client-driven – preparations will continue in order to meet the new legislative requirements while providing effective risk leadership and maintaining strong relationships with the board, regulators and stakeholders.
• Managing for value – this will be achieved through c ontinued embedding and enhancing of the –
– Internal Models Approach (IMA) for market risk capital requirements;
– Advanced Measurement Approach (AMA) for operational risk; and
– Advanced Internal Ratings-based (AIRB) Approach for credit risk.
• Primary clients and cross-sell – sound risk principles are to be maintained during a period of focus on non-interest revenue (NIR) growth and assistance will be provided to identify cross selling opportunities, facilitate solutions for new products and services and align these with risk appetite.
• Risk as an enabler – alignment to the business will continue to ensure risk and reward optimisation and achievement and exceeding of key performance objectives.
• Productivity and execution – the focus remains on working smarter, simplifying policies, charters, and procedures, and streamlining internal approval processes.
• Creating a unique and innovative culture – continued emphasis on the importance of the reengineering processes to demonstrate consistent and proactive responses to business needs and offer relevant risk management guidance. In the medium to long term agility and proportionate response to regulation, risk management and strategy will continue to be focus areas.
• Transformation – embedding transformation, achieving transformation targets, and ensuring visible, accessible leadership will continue as high priorities.
• Being a green and caring group – support of the group’s carbon-neutral strategy will continue as will ensuring a safe and secure environment for staff and clients and the further integration of social and environmental risk management tools and practices across the group.
The board and management of Nedbank Group are responsible for the implementation and
management of risk.First line
Group Risk and Enterprise Governance and Compliance perform a policy setting and
monitoring role to ensure implementation of risk management principles and adherence to
regulation and legislation.
Second line
Group Internal Audit, external auditors and independent actuaries provide additional assurance
on the effectiveness of risk management in the organisation.
Third line
riSk and balance SheeT MANAGEMENT REvIEwThE susTAINABIlITy oF NEdBANk GRouP’s oPERATIoNs Is ENsuREd By MEANs oF sTRICT AdhERENCE To CoMPETITIvE GovERNANCE ANd CoMPlIANCE PRACTICEs, whICh INCludE Good GovERNANCE, sTRoNG EThICs ANd A CulTuRE oF CoMPlIANCE; EFFECTIvE MANAGEMENT oF soCIAl, ENvIRoNMENTAl ANd EThICAl RIsks; ANd A CoMMITMENT To REsPoNsIBlE lENdING.
6 Nedbank Risk FA.indd 146 22/03/2011 12:07 PM
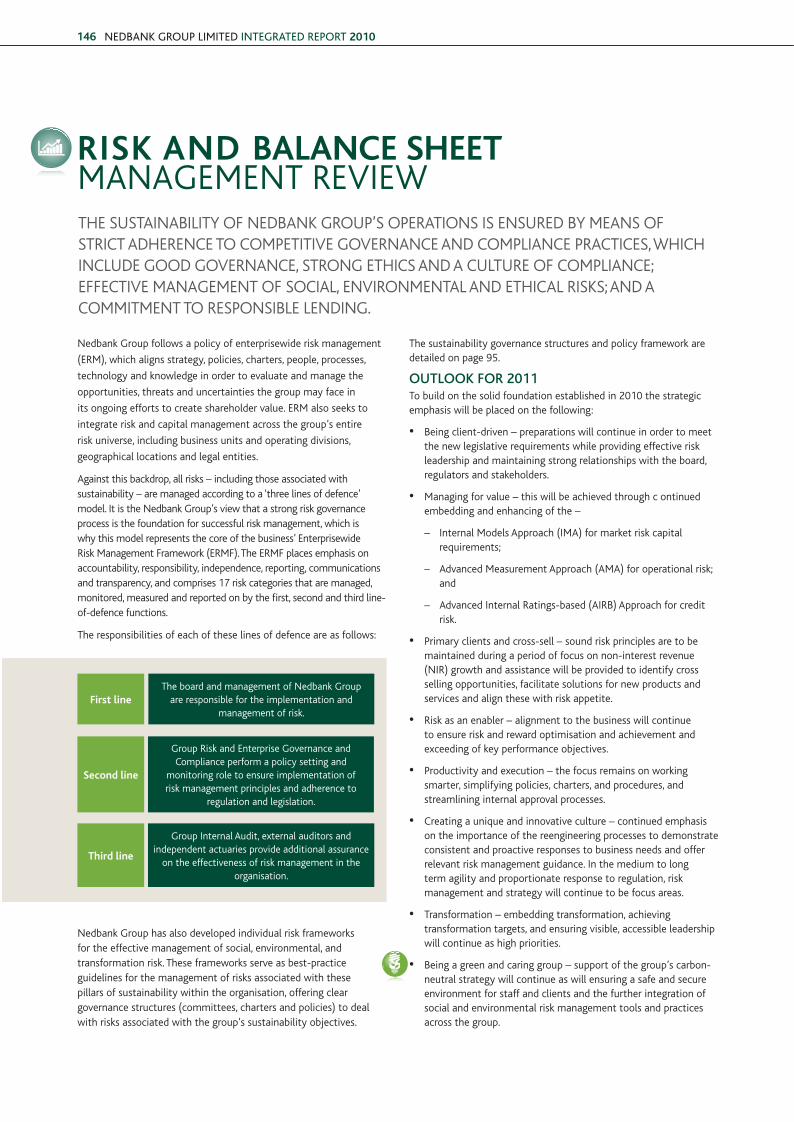
ovERvIEw GRouP REPoRTs
oPERATIoNAl ovERvIEw
susTAINABlE dEvEloPMENT PERFoRMANCE
RIsk, GovERNANCE ANd CoMPlIANCE
147
HIGHlIGHtSrEGulAtOrY AND StAtutOrY DEVElOPMENtS
• basel iii
– Majority of the proposals are now finalised but some
significant aspects are still outstanding.
– studies and opinions of the impact of Basel III on the banking
industry and economic growth vary.
– Implementation timelines extended considerably, commencing
in 2013 with various phase-ins and transitional arrangements
through to 2019.
– on capital
■ Most heavily impacted are banks with relatively large
capital market businesses, particularly trading activities,
complex securitisations, over-the-counter derivatives
(counterparty credit risk) and securities lending.
■ Nedbank Group has a relatively small capital markets
business and the overall impact is manageable.
– on liquidity
■ Internationally most banks generally fall short of the two
new liquidity ratios, with shortfalls in high-quality liquid
assets and stable funding presenting significant business
model implications. Both ratios remain under observation
and banks have several years to meet them.
In particular, the net stable funding ratio (NsFR), in its
current form, seems likely to curtail longer-term lending
significantly. This is contrary to the primary role of banks
to act as regulated financial intermediaries to convert
short-term deposits into long-term lending, which enables
economies to grow.
■ For Nedbank Group and generally the entire sA banking
industry the impact of these two liquidity ratios would
be pervasive if implemented as is, particularly the NsFR.
however, a pragmatic approach is likely to be followed by
the south African Reserve Bank (sARB).
• Solvency ii
– solvency Assessment and Management (sAM) is expected
to be implemented in south Africa from 2014. sAM is south
Africa’s version of the international solvency II requirements,
which is similar to Basel II but for the insurance industry.
– Impact on Nedbank Group (in the Nedbank wealth Cluster
only) is relatively small.
• companies act
– The Companies Act 71 of 2008 required significant
amendment. The Companies Amendment Bill, which is
expected to come into force on 1 April 2011, amends almost
every section of the original act and the regulations are
currently in draft form.
– For Nedbank Group and the sA banking industry the effect
of the unintended consequences of s136(2) was addressed
through the Banking Association of south Africa and the
proposed revisions should resolve these concerns. Nedbank
Group is assessing the full effect that this new act will have
on its business.
• The consumer Protection act
– sA banks are required to be compliant by 31 March 2011.
– Nedbank Group awaits the final regulations to complete its
compliance programme.
• Protection of Personal information act
– It is expected that the Protection of Personal Information Bill
will be passed into law during the Parliamentary first quarter
of 2011.
In addition to the above, Nedbank has provided commentary on
various energy, water and climate change regulatory developments.
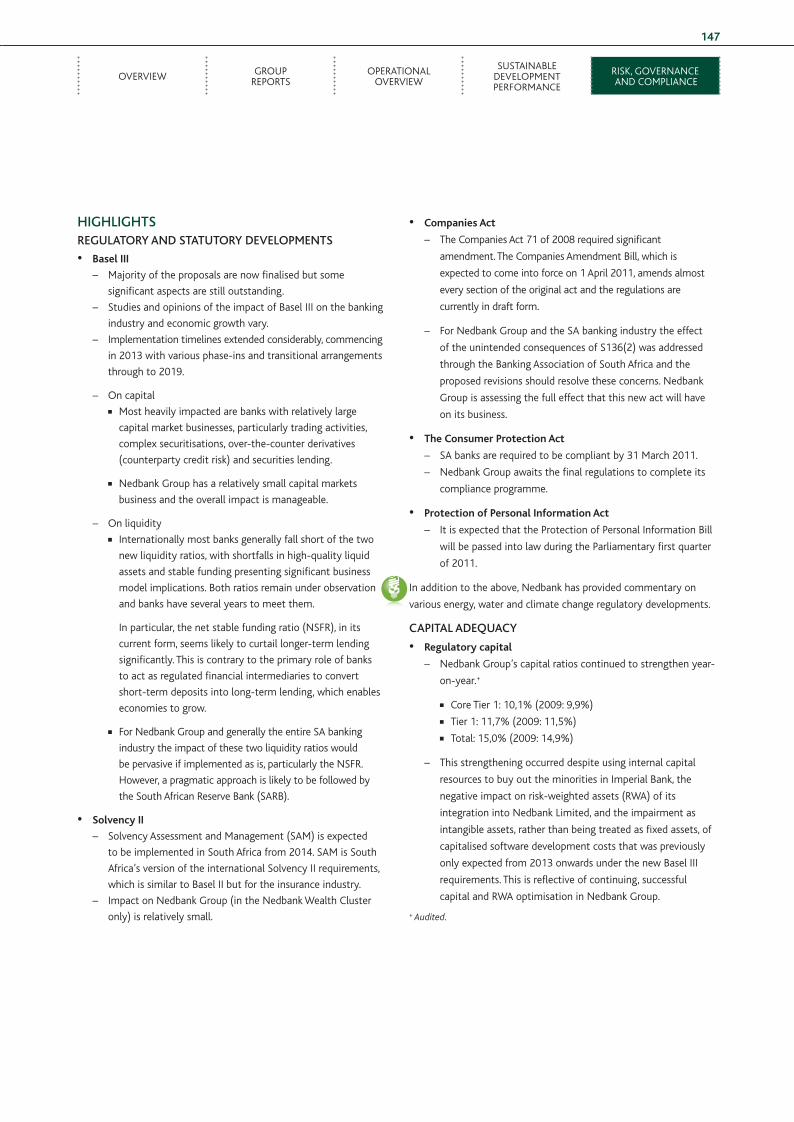
CAPItAl ADEQuACY
• regulatory capital
– Nedbank Group’s capital ratios continued to strengthen year-
on-year.+
■ Core Tier 1: 10,1% (2009: 9,9%)
■ Tier 1: 11,7% (2009: 11,5%)
■ Total: 15,0% (2009: 14,9%)
– This strengthening occurred despite using internal capital
resources to buy out the minorities in Imperial Bank, the
negative impact on risk-weighted assets (RwA) of its
integration into Nedbank limited, and the impairment as
intangible assets, rather than being treated as fixed assets, of
capitalised software development costs that was previously
only expected from 2013 onwards under the new Basel III
requirements. This is reflective of continuing, successful
capital and RwA optimisation in Nedbank Group.
+ Audited.
6 Nedbank Risk FA.indd 147 22/03/2011 12:07 PM
NEDBANK GROUP LimitED iNtEGRAtED REPORt 2010148
– Given the predominant focus on the core Tier 1 ratio by
Basel III, and new requirements to ensure all classes of
capital instruments fully absorb losses at the point of non-
viability before taxpayers are exposed to loss, all of which
will be phased-in over time, Nedbank Group’s focus is
firmly on its core Tier 1 ratio.
In consideration of Nedbank Group’s high total capital
adequacy ratio of 15,0% the Imperial Bank Tier 2 bond
(‘IPB2’), amounting to R500 million, was called (without
being replaced) and the intention is to do the same with
the Nedbank limited bond (‘Ned 5’) that is callable in
April 2011, subject to sARB approval.
• economic capital
– Available financial resources: Economic capital ratio 144%
(2009: 142%). R12 784 million surplus capital above
minimum requirements plus the 10% buffer.
– during 2010 the group implemented several refinements to
the calculation and allocation of economic capital.
• internal capital adequacy assessment Process
– The annual group Internal Capital Adequacy Assessment
Process (ICAAP) was completed and signed off by the board
in July 2010. The sARB’s supervisory Review and Evaluation
Process (sREP) of Nedbank Group’s ICAAP was concluded
favourably in h2 2010 with no material issues raised.
– Best-practice stress and scenario testing framework and
process were followed to confirm the robustness of the
group’s capital adequacy.
• leverage ratio
– This remains low at 13,8 times (2009: 14,4 times) when
compared with international levels.
• external credit ratings
– In July 2010 Moody’s Investor services reaffirmed Nedbank
limited’s financial strength rating at C- and its global local
currency rating at A2. The outlook for all ratings was also
maintained at stable.
– In July 2010 Fitch Ratings reaffirmed Nedbank Group’s
long-term foreign and local currency issuer default rating
(IdR) at BBB, and national long-term rating at AA-(zaf). The
short-term foreign currency IdR was maintained at F2. The
outlook for all three ratings was also maintained at stable.
fuNDING AND lIQuIDItY
• well managed through another difficult and uncertain year in
global banking.
• significantly lengthened the long-term funding ratio to 23%
(2009: 18%), including successful issue of R6,2 billion in senior
unsecured debt during 2010.
• Matched maturity funds transfer pricing (MMFTP) and liquidity
premiums (pricing for liquidity risk) well entrenched across the
business.
• sound loan-to-deposit ratio of 97%.
• Further strengthened the liquidity buffer.
• well-diversified funding mix (ie retail versus wholesale deposit
reliance) and strong retail household deposits positioning maintained.
• low reliance on interbank and foreign markets.
• Internal liquidity Adequacy Assessment Process introduced and
embedded within the organisation, a similar concept to ICAAP.
caPiTal adequacy%
dECEMBER 2010
INTERNAl TARGET RANGEs
* surplus (R billion) above regulatory minima
dECEMBER 2009
11,711,5
8,5 – 10,0
15,0
11,5 – 13,0
14,9
EsTIMATEd BAsEl III AT 2010
10,19,9
7,5 – 9,0
*15,3 *15,6
*14,8 *15,3
*13,5 *13,9
CORE tiER 1 tiER 1 tOtAL
Nedbank could already absorb the Basel III capital implications, with all capital ratios remaining above the top end of current target ranges.
16,0
14,0
12,0
10,0
8,0
6,0
4,0
2,0
0,0
6 Nedbank Risk FA.indd 148 22/03/2011 12:07 PM

ovERvIEw GRouP REPoRTs
oPERATIoNAl ovERvIEw
susTAINABlE dEvEloPMENT PERFoRMANCE
RIsk, GovERNANCE ANd CoMPlIANCE
rISk AND bAlANCE SHEEt MANAGEMENt rEVIEw
149
MArGIN MANAGEMENt
• Net interest margin (NIM) reduced to 3,35% (2009: 3,39%)
mainly due to the impact of endowment (on capital and non-
rate-sensitive liabilities) and costs of lengthening the funding
profile and holding a higher liquidity buffer.
• however, NIM has performed better than originally forecast due
to a strong focus on asset pricing and mix (as per manage-for-
value strategy), application of MMFTP, allocation of risk-based
capital and liquidity premiums among growth and market share
gains across most categories of advances (with the exception of
home loans in line with group strategy of focusing on areas with
high economic profit potential).
CHANGES tO AND SOutH AfrICAN rESErVE bANk APPrOVAl fOr CErtAIN MEtHODOlOGIES
• advanced Measurement approach and internal Model
approach
– Received approval from the sARB to use the AMA for
operational risk (from 2010) and IMA for market trading risk
(from 2011) for regulatory capital purposes for Nedbank
limited.
– Nedbank limited now has approval for all three major
Pillar 1 risk types for Basel II, having received approval for
the AIRB Approach for credit risk on day 1 implementation
of Basel II (January 2008).
– The regulatory capital approaches above now align with
those already in use for economic capital (and ICAAP)
purposes. This contributes to Nedbank Group’s RwA
optimisation while representing a more sophisticated
measurement of risk.
• capital allocation to businesses (as discussed in the
June 2010 results)
– Increase in quantum of economic capital allocated to
businesses for risk-adjusted performance measurement and
segmental analysis due to methodology enhancements and
alignment with the group’s regulatory core Tier 1 capital
level, which impacts the return on ordinary shareholders’
funds (RoE) calculation.
• credit loss ratio (as discussed in the June 2010 results)
– Change in calculation from simple average to daily averages
and exclusion of trading assets to reflect the ratio more
accurately.
rISk MANAGEMENt
• strong credit risk management.+
– The credit loss ratio on the banking book improved to
1,36% [2009: 1,52% (restated)].
– defaulted advances reduced by 1,04% to R26 765 million
(2009: R27 045 million).
– Maintained a conservative approach and total impairment
provisions increased by 14,6% to R11 226 million (2009:
R9 798 million).
– sound credit growth achieved in current external
economic environment under the bank’s manage-for-value
strategic focus on improving assets quality through active
management of the bank’s portfolios towards high economic
profit areas.
• Group’s ERMF continued to be resilient.
• sound risk governance and compliance prevails, aligned with
Basel II.v requirements.
• Effective operational and security risk management, containing
impact of crime to reasonable levels.
• Alternative operational risks to sustainability, such as
environmental and transformation risks, are well managed by the
group.
• successful reputational risk management, such as the favourable
securities Regulation Panel ruling on the Pinnacle Point litigation.
• successful Imperial Bank integration into Nedbank limited.
• significant steps to enhance risk management in Nedbank Retail
and to fix economics in secured lending.
• Prudent risk appetite followed with group metrics cascaded into
all business units.
• Risk-based remuneration practices applied since 2008 align in all
material respects with recent international requirements.
• Robust capital and liquidity risk management.
For the group’s comprehensive disclosure on risk and balance sheet
management in line with Regulation 43 of the regulations
relating to banks in south Africa please refer to the group’s
updated Pillar 3 Report that will be released on the group’s
website at www.nedbankgroup.co.za by 8 April 2011. This
summary review primarily focuses on the key financial risks and
balance sheet management components.
+ Audited.
6 Nedbank Risk FA.indd 149 22/03/2011 12:07 PM
NEDBANK GROUP LimitED iNtEGRAtED REPORt 2010150
OVErVIEw 2010The sA economy had a strong start to the year primarily driven by
global demand for commodities and manufacturing production.
however, the fragility of the global recovery as a result of high
government debt in developed economies was highlighted by fiscal
consolidation in European economies during the course of the
year. This impacted global demand for sA exports, resulting in the
domestic recovery losing momentum despite the boost from the
FIFA 2010 world Cup. Against this backdrop the domestic banking
environment improved modestly, supported by 30-year-low interest
rates that translated to an improved credit environment.
The landscape of banking continues to change following the global
financial crisis, although the Euro region remains a major concern,
and the significant international regulatory response in particular to
what is commonly referred to as Basel III.
bASEl IIIMost of the Basel III proposals have recently been finalised, with
some significant aspects remaining outstanding, but envisaged to be
completed in 2011.
Considerable debate continues on the impact of Basel III on the
banking industry and, consequently, economic growth. Particular
focus has fallen on the new liquidity ratios and the cumulative
impact of the vast array of new Basel III requirements, especially
when considering forward growth projections. In south Africa the
details of exactly how Basel III will be adopted are still to be advised
by the sARB.
SuMMArY Of bASEl III
• new basel ii.v requirements (finalised in July 2009)
– Enhancements to Pillar 1
■ securitisation
■ Trading market risk
– Enhancements to Pillar 2 (and hence the ICAAP)
■ Bankwide governance and risk management
■ Principles for sound liquidity risk management
■ Principles for risk concentrations
■ sound remuneration practices (risk-based)
■ valuation and liquidity risks of financial instrument fair-
value practices
■ Principles for sound stress testing practices
■ off-balance-sheet exposures and securitisation activities
■ Reputational risk and implicit support
– Enhancements to Pillar 3 (public disclosure)
■ securitisation exposures
The above are incorporated into the draft changes to the
sA banking regulations, effective 1 January 2012.
In addition, the sARB are proposing to entirely phase out hybrid
debt capital (non-core Tier 1), which is contrary to Basel III
that allows for existing hybrid debt to remain, and introduce a
1,06 multiplier to credit RwA of AIRB banks (to align with the
original Basel II Accord).
• basel iii requirements (finalised in december 2010)
– Raise quality, consistency and transparency of capital base
– Enhance risk coverage
– Introduce new leverage ratio
– Reduce procyclicality and introduce new countercyclical
buffers
– Address systemic risk and interconnectedness
– Introduce new global liquidity framework [notably the new
liquidity coverage ratio (lCR) and NsFR]
– Basel III timelines
■ Commence 2013 with long phase-ins through to 2019.
There is no formal indication yet from the sARB on south Africa’s
adoption, other than ‘south African banks will not need to raise
additional capital in response to Basel III’ and that ‘a pragmatic
approach will be followed in respect of the new Basel III liquidity
ratios’.
• basel iii requirements (work in progress; to be finalised
during 2011)
– Capital surcharge for systemically important financial
institutions (sIFIs)
– loss absorbency requirements for all capital instruments
(finalised in January 2011)
– Counterparty credit risk
– Trading book review
– Convergence with International Financial Reporting standards
• Observation periods commence in 2011/2012 for:
– New liquidity ratios (lCR and NsFR)
– New leverage ratio
In summary, greater clarity and finalisation have been achieved to
date, but significant uncertainty remains.
POtENtIAl IMPACt ON NEDbANk GrOuP Of kEY bASEl III COMPONENtS
• capital
– overall, considered to be ‘manageable’ but await finalisation
of the outstanding Basel III requirements and details from the
sARB for adoption in south Africa.
– sA banks’ regulatory capital rules were already considerably
more conservative than the Basel II international rules. The
Tier 1 minimum ratio is 7% in south Africa, while the core Tier 1
minimum is 5,25%. In addition, a unique to south Africa, 1,5%
Pillar 2a capital buffer is already in force. All the major sA banks
are currently operating at capital ratios significantly above the
minimum regulatory ratios required.
– Core Tier 1 capital is the main focus. In view of the new
Basel III capital buffers, it is likely that Nedbank Group’s
target may increase from the current 7,5% – 9,0%. The group
expects to meet this via earnings, continuing capital and RwA
optimisation, the strategic positioning of products, business
mix and our new portfolio tilt strategic focus, integrated with
the efforts of enhancing RoE and optimising economic profit.
6 Nedbank Risk FA.indd 150 22/03/2011 12:07 PM
ovERvIEw GRouP REPoRTs
oPERATIoNAl ovERvIEw
susTAINABlE dEvEloPMENT PERFoRMANCE
RIsk, GovERNANCE ANd CoMPlIANCE
rISk AND bAlANCE SHEEt MANAGEMENt rEVIEw
151
– Nedbank Group has a strong track record over the past
three years of significant capital and RwA optimisation. This is
expected to continue.
– The new Basel III regulatory deductions against core Tier 1
qualifying capital resources only commence in January 2014.
These deductions are not significant for Nedbank Group.
– hybrid debt capital (non-core Tier 1) will be phased out
by the sARB. The group’s Tier 2 debt capital also needs to
be addressed (replace and reduce the extent in view of the
new Basel III loss absorbency requirements) over the long
transitional period.
– All the major sA banks have also completed three
comprehensive, annual ICAAPs since 2008. These are required
to be signed off by the board of directors of each bank and
are then subjected to a detailed sREP by the sARB.
• leverage
– No challenges are envisaged in terms of compliance with
Basel III’s new leverage ratio, which includes off-balance-sheet
exposure.
• risk coverage
– The Basel III requirements will impact most significantly on
banks with large capital markets businesses. higher RwA
requirements will primarily come from trading books, complex
securitisations, securities lending and over-the-counter
derivatives.
– Nedbank Group’s trading book is small in relation to its total
bank operations, securitisation exposure and activities are
very low, and counterparty credit risk, including repurchase
transactions and securities financing, is mostly restricted
to low-risk, non-complex transactions. Credit derivative
activities are also restricted to single-name trades of sA
exposures and biased towards providing risk mitigation.
The group does not envisage a significant overall increase
in minimum capital or RwA requirements, subject to the
outcome of the Basel III proposals still to be finalised
in 2011.
In particular, the outstanding Basel III proposals on sIFIs
and counterparty credit risk do need to be finalised before a
conclusion can be reached on this aspect. In south Africa a
unique Pillar 2 add-on of 1,5% already exists, additional to
the minimum Basel II total ratio requirement of 8%.
• remuneration
– As regards the emphasis on ‘risk-based’ remuneration together
with additional sound governance practices, Nedbank Group
is very well positioned and has only a few minor gaps to
close (see the Remuneration Report in volume 2 of the 2010
integrated report).
6 Nedbank Risk FA.indd 151 22/03/2011 12:07 PM
NEDBANK GROUP LimitED iNtEGRAtED REPORt 2010152
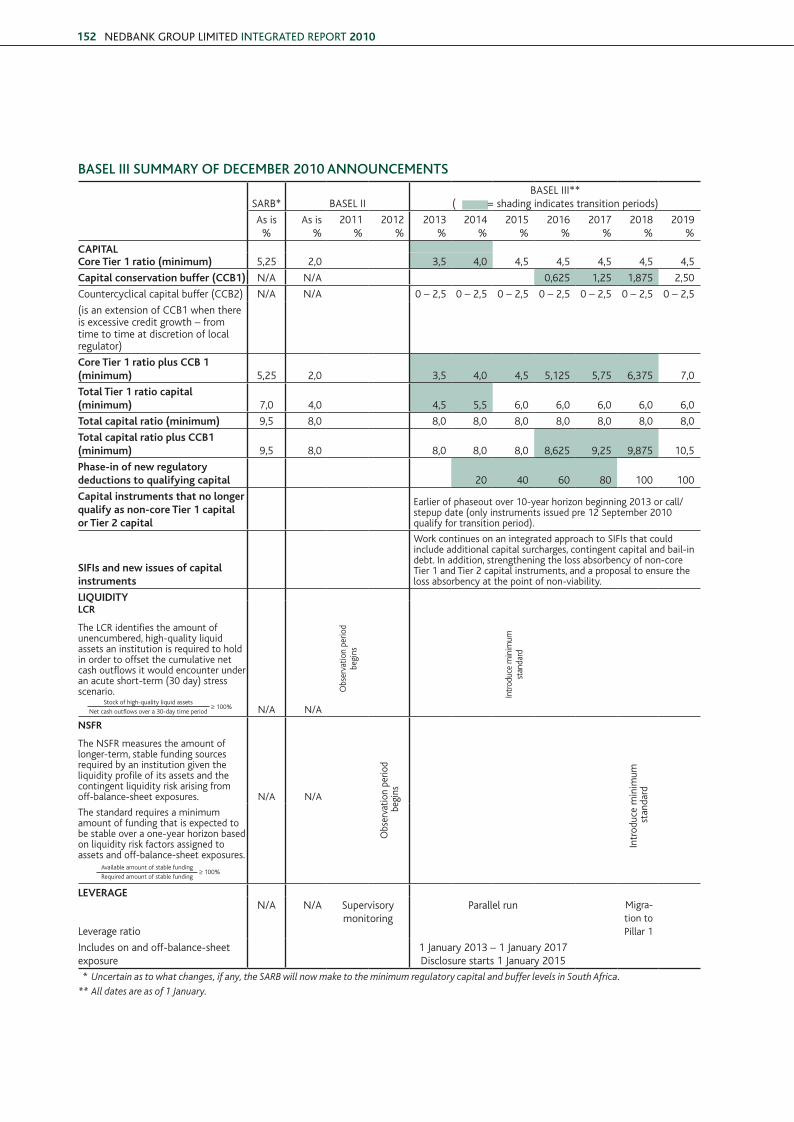
bASEl III SuMMArY Of DECEMbEr 2010 ANNOuNCEMENtS
sARB* BAsEl II BAsEl III**
( = shading indicates transition periods)
As is %
As is %
2011%
2012%
2013%
2014%
2015%
2016%
2017%
2018%
2019%
caPiTal core Tier 1 ratio (minimum) 5,25 2,0 3,5 4,0 4,5 4,5 4,5 4,5 4,5
capital conservation buffer (ccb1) N/A N/A 0,625 1,25 1,875 2,50
Countercyclical capital buffer (CCB2) N/A N/A 0 – 2,5 0 – 2,5 0 – 2,5 0 – 2,5 0 – 2,5 0 – 2,5 0 – 2,5
(is an extension of CCB1 when there is excessive credit growth – from time to time at discretion of local regulator)
core Tier 1 ratio plus ccb 1 (minimum) 5,25 2,0 3,5 4,0 4,5 5,125 5,75 6,375 7,0
Total Tier 1 ratio capital (minimum) 7,0 4,0 4,5 5,5 6,0 6,0 6,0 6,0 6,0
Total capital ratio (minimum) 9,5 8,0 8,0 8,0 8,0 8,0 8,0 8,0 8,0
Total capital ratio plus ccb1 (minimum) 9,5 8,0 8,0 8,0 8,0 8,625 9,25 9,875 10,5
Phase-in of new regulatory deductions to qualifying capital 20 40 60 80 100 100
capital instruments that no longer qualify as non-core Tier 1 capital or Tier 2 capital
Earlier of phaseout over 10-year horizon beginning 2013 or call/stepup date (only instruments issued pre 12 september 2010 qualify for transition period).
SiFis and new issues of capital instruments
work continues on an integrated approach to sIFIs that could include additional capital surcharges, contingent capital and bail-in debt. In addition, strengthening the loss absorbency of non-core Tier 1 and Tier 2 capital instruments, and a proposal to ensure the loss absorbency at the point of non-viability.
liquidiTy lcr
The lCR identifies the amount of unencumbered, high-quality liquid assets an institution is required to hold in order to offset the cumulative net cash outflows it would encounter under an acute short-term (30 day) stress scenario.
N/A N/A
obs
erva
tion
perio
dbe
gins
Intr
oduc
e m
inim
umst
anda
rd
nSFr
The NsFR measures the amount of longer-term, stable funding sources required by an institution given the liquidity profile of its assets and the contingent liquidity risk arising from off-balance-sheet exposures. N/A N/A
obs
erva
tion
perio
d b
egin
s
Intr
oduc
e m
inim
um s
tand
ard
The standard requires a minimum amount of funding that is expected to be stable over a one-year horizon based on liquidity risk factors assigned to assets and off-balance-sheet exposures.
leVeraGe
leverage ratio
N/A N/A supervisory monitoring
Parallel run Migra-tion to
Pillar 1
Includes on and off-balance-sheet exposure
1 January 2013 – 1 January 2017disclosure starts 1 January 2015
* Uncertain as to what changes, if any, the SARB will now make to the minimum regulatory capital and buffer levels in South Africa.
** All dates are as of 1 January.
stock of high-quality liquid assets
Net cash outflows over a 30-day time period≥ 100%
Available amount of stable funding
Required amount of stable funding≥ 100%
6 Nedbank Risk FA.indd 152 22/03/2011 12:07 PM
ovERvIEw GRouP REPoRTs
oPERATIoNAl ovERvIEw
susTAINABlE dEvEloPMENT PERFoRMANCE
RIsk, GovERNANCE ANd CoMPlIANCE
rISk AND bAlANCE SHEEt MANAGEMENt rEVIEw
153
• liquidity – Although the implementation timelines have been extended
considerably, compliance with the two proposed liquidity ratios (especially the NsFR) remains the major concern for sA banks, unless benefits arise from National Treasury’s structural Funding and liquidity Task Team, which is addressing this issue and the structural issues in the country’s financial industry.
– sA’s banking industry has remained structurally sound and weathered the global financial crisis and local recession well due to a number of factors, including:
■ sound and proactive regulation of financial services, especially in the banking sector.
■ strong risk and capital management in the sA banking industry.
■ Basel II being successfully implemented and embraced in south Africa.
■ The National Credit Act (NCA) being successfully implemented in south Africa to help minimise irresponsible lending practices, overgearing and excessive consumer debt.
■ Fiscal authorities in south Africa never allowing interest rates to fall as low, and for as long, as those in the united states, where this resulted in excessive borrowing and untenable levels of household debt. south Africa has not had negative real interest rates.
■ Exchange controls preventing large flows of funds from local institutions out of the country.
■ low reliance on foreign funding/capital markets. ■ Rand liquidity remaining stable, with the interbank market
operating normally. ■ The originate-and-sell business model and complex credit
derivatives and/or securitisation vehicles, which resulted in excessive leverage in some foreign banks, not being implemented and used in south Africa to the same extent.
■ Charging of liquidity premiums in client borrowings and improved asset pricing.
■ lessons learned from the 2002/3 sA banking crisis.
Government support was not required by the sA banking industry at any time during this global financial crisis.
while always striving to maintain close alignment with Basel III standards, for the factors set out above south Africa would be justified in appropriately modifying the specific requirements of the proposed liquidity ratios in Basel III.
– Nedbank Group fully subscribes to the principles set out in the Basel III liquidity risk framework and has already
embedded these principles into its existing liquidity risk
management framework. By way of example, Nedbank
Group is compliant with the Principles for sound liquidity
Risk Management and supervision that were issued in
september 2008.
– In terms of revising the regulations it is broadly anticipated
that the sARB will subscribe to the principles encapsulated in
the proposed Basel III liquidity standards.
however, it is also anticipated that, given the structural factors
impacting the ability of sA banks to comply with the ‘as is’
proposed liquidity ratios, the sARB will follow a pragmatic
approach in terms of what can be achieved, without creating
unintended consequences (eg slower economic growth and
higher unemployment).
‘Once finalised in the course of 2010 by the Basel
Committee, these requirements related to a stressed liquidity
coverage ratio, and a structural liquidity ratio will be considered
for incorporation into the regulatory framework. However,
ultimately, liquidity in the SA financial sector is mainly a structural
matter that is likely to require extensive dialogue between various
key roleplayers such as the National Treasury, the central bank,
the Financial Services Board and the Department’ (2009 Annual
Report, Bank Supervision Department, South African Reserve
Bank).
– Compliance with the lCR and the NsFR are not related
to issues of principle but rather to specific factors and, in
particular, the structural issues, benefits and characteristics of
the sA financial system.
we have graphically depicted below the manner in which sA
banks are currently funded, based on the latest industry data.
we draw the following conclusions of total sA bank funding
from this data:
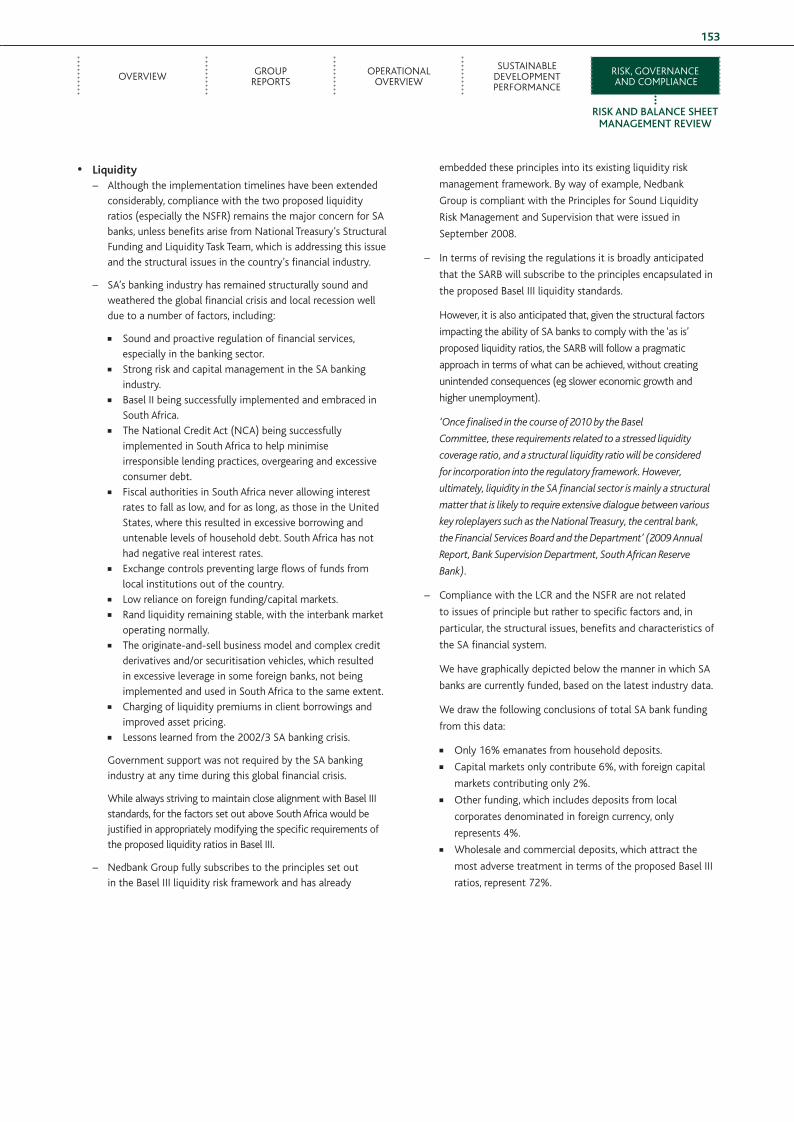
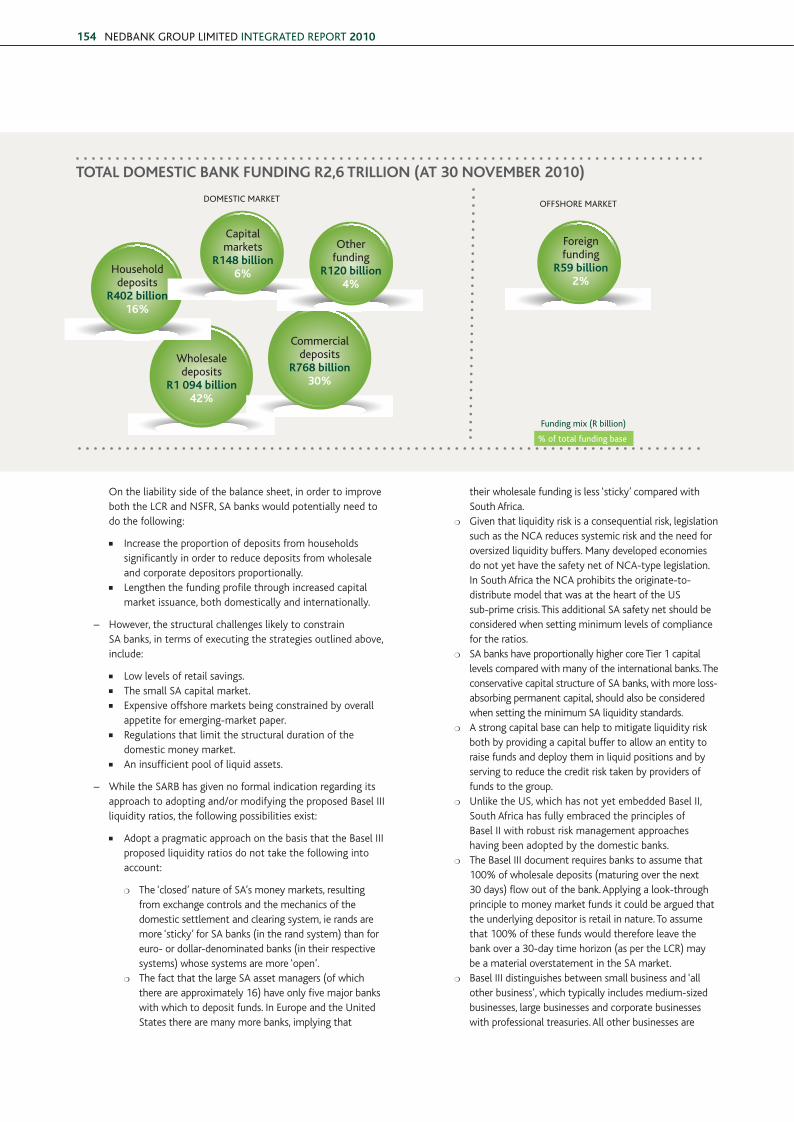
■ only 16% emanates from household deposits.
■ Capital markets only contribute 6%, with foreign capital
markets contributing only 2%.
■ other funding, which includes deposits from local
corporates denominated in foreign currency, only
represents 4%.
■ wholesale and commercial deposits, which attract the
most adverse treatment in terms of the proposed Basel III
ratios, represent 72%.
6 Nedbank Risk FA.indd 153 22/03/2011 12:07 PM
NEDBANK GROUP LimitED iNtEGRAtED REPORt 2010154
on the liability side of the balance sheet, in order to improve both the lCR and NsFR, sA banks would potentially need to do the following:
■ Increase the proportion of deposits from households significantly in order to reduce deposits from wholesale and corporate depositors proportionally.
■ lengthen the funding profile through increased capital market issuance, both domestically and internationally.
– however, the structural challenges likely to constrain sA banks, in terms of executing the strategies outlined above, include:
■ low levels of retail savings. ■ The small sA capital market. ■ Expensive offshore markets being constrained by overall
appetite for emerging-market paper. ■ Regulations that limit the structural duration of the
domestic money market. ■ An insufficient pool of liquid assets.
– while the sARB has given no formal indication regarding its approach to adopting and/or modifying the proposed Basel III liquidity ratios, the following possibilities exist:
■ Adopt a pragmatic approach on the basis that the Basel III proposed liquidity ratios do not take the following into account:
❍ The ‘closed’ nature of sA’s money markets, resulting from exchange controls and the mechanics of the domestic settlement and clearing system, ie rands are more ‘sticky’ for sA banks (in the rand system) than for euro- or dollar-denominated banks (in their respective systems) whose systems are more ‘open’.
❍ The fact that the large sA asset managers (of which there are approximately 16) have only five major banks with which to deposit funds. In Europe and the united states there are many more banks, implying that
their wholesale funding is less ‘sticky’ compared with south Africa.
❍ Given that liquidity risk is a consequential risk, legislation such as the NCA reduces systemic risk and the need for oversized liquidity buffers. Many developed economies do not yet have the safety net of NCA-type legislation. In south Africa the NCA prohibits the originate-to-distribute model that was at the heart of the us sub-prime crisis. This additional sA safety net should be considered when setting minimum levels of compliance for the ratios.
❍ sA banks have proportionally higher core Tier 1 capital levels compared with many of the international banks. The conservative capital structure of sA banks, with more loss-absorbing permanent capital, should also be considered when setting the minimum sA liquidity standards.
❍ A strong capital base can help to mitigate liquidity risk both by providing a capital buffer to allow an entity to raise funds and deploy them in liquid positions and by serving to reduce the credit risk taken by providers of funds to the group.
❍ unlike the us, which has not yet embedded Basel II, south Africa has fully embraced the principles of Basel II with robust risk management approaches having been adopted by the domestic banks.
❍ The Basel III document requires banks to assume that 100% of wholesale deposits (maturing over the next 30 days) flow out of the bank. Applying a look-through principle to money market funds it could be argued that the underlying depositor is retail in nature. To assume that 100% of these funds would therefore leave the bank over a 30-day time horizon (as per the lCR) may be a material overstatement in the sA market.
❍ Basel III distinguishes between small business and ‘all other business’, which typically includes medium-sized businesses, large businesses and corporate businesses with professional treasuries. All other businesses are
TOTal dOMeSTic bank FundinG r2,6 TrilliOn (aT 30 nOVeMber 2010)
Wholesaledeposits
r1 094 billion42%
Commercialdeposits
r768 billion30%
Householddeposits
r402 billion16%
Capital markets
r148 billion6%
Other funding
r120 billion4%
Foreign funding
r59 billion2%
Funding mix (R billion)
DOmEstiC mARKEt OFFsHORE mARKEt
% of total funding base
6 Nedbank Risk FA.indd 154 22/03/2011 12:07 PM
ovERvIEw GRouP REPoRTs
oPERATIoNAl ovERvIEw
susTAINABlE dEvEloPMENT PERFoRMANCE
RIsk, GovERNANCE ANd CoMPlIANCE
rISk AND bAlANCE SHEEt MANAGEMENt rEVIEw
155
treated equally in that 75% of their deposits are assumed to leave the bank within a 30-day interval (assuming they have a low operational relationship with the bank). we believe that there is considerable scope to differentiate between medium, large and corporate-type commercial clients in the sA environment.
■ Broaden the definition of high-quality assets considered to be eligible in terms of the lCR.
❍ while addressing the structural issues through National Treasury’s structural Funding and liquidity Task Team is a longer-term initiative, the sARB could in the short-term consider broadening the definition of high-quality assets. That is, in addition to the Basel III level 1 and 2 liquid assets, the sARB could introduce level 3 and 4 assets (eg other bank debt such as negotiable certificates of deposit, promissory notes and floating-rate notes).
■ Allow the creation of ‘collateral pools’ for inclusion in the stock of high-quality liquid assets.
❍ In view of the structural constraints to lengthening the funding profile or replacing wholesale funding with retail deposits, that is limitations in terms of addressing the liability side of the balance sheet, a key consideration is addressing the asset side of the balance sheet by bolstering the stock of liquid assets via converting typically long-dated illiquid assets into high-quality liquid assets.
❍ An option for consideration is to allow banks to create ‘collateral pools’ that meet preagreed sARB requirements (eg maximum loan-to-value, minimum seasoning or payment-to-income ratios) and which may be pledged as security against stress funding. These ‘collateral pools’ could then be included in the stock of liquid assets making up the lCR.
■ Introduction of a national deposit insurance scheme. ❍ south Africa is not aligned with many other
jurisdictions in terms of deposit insurance schemes. The impact of this needs to be considered as sA banks’ liquidity ratios will reflect negatively compared with international jurisdictions with deposit insurance schemes as, in terms of the Basel III ratios and
definitions, such a scheme is required in order to classify deposits as ‘stable’ and thus receive a more favourable treatment.
– Nedbank Group’s additional possible courses of action could include:
■ Purchasing further level 1 assets (including government bonds, treasury bills, debentures) assuming this quantum of level 1 assets would be available. This would not have a pervasive impact on projected RoEs.
■ structuring certain new corporate lending in the form of A- or better corporate bonds rather than as advances (client dependent) in order to increase the market capacity of level two assets.
■ Through Nedbank Group’s new portfolio tilt strategic approach, reducing certain long-dated lending.
■ utilising Nedbank Group’s well-diversified funding mix supported by a strong retail and commercial deposit franchise (and a strong market share of household deposits).
■ utilising the domestic and international capital markets, for example securitisation vehicles, as this market is opening up again and is starting to show signs of improved liquidity.
CrEDIt rISkThe recovery in the credit cycle has proven to be more modest compared with previous cycles. household demand for credit was contained by the consumer debt burden remaining relatively high, increased regulatory requirements, policy uncertainty and employment growth only resuming late in the year, resulting in a less broad-based recovery. In the corporate sector excess capacity and uncertainty over the sustainability of the local and global recovery limited spending. Government fixed-investment spending, although continuing to contract, emerged as the main foundation for growth.
household finances improved in south Africa as debt was slowly reduced and interest rates eased to the lowest levels in 36 years. Against this background, the ratio of household debt to disposable income decreased to 78,2% from just over 80% at the end of 2009. At the same time debt service costs decreased to 7,5%, the lowest level since June 2006, and are now at a level that is more conducive to improving economic growth in the consumer sector.
6 Nedbank Risk FA.indd 155 22/03/2011 12:07 PM
NEDBANK GROUP LimitED iNtEGRAtED REPORt 2010156
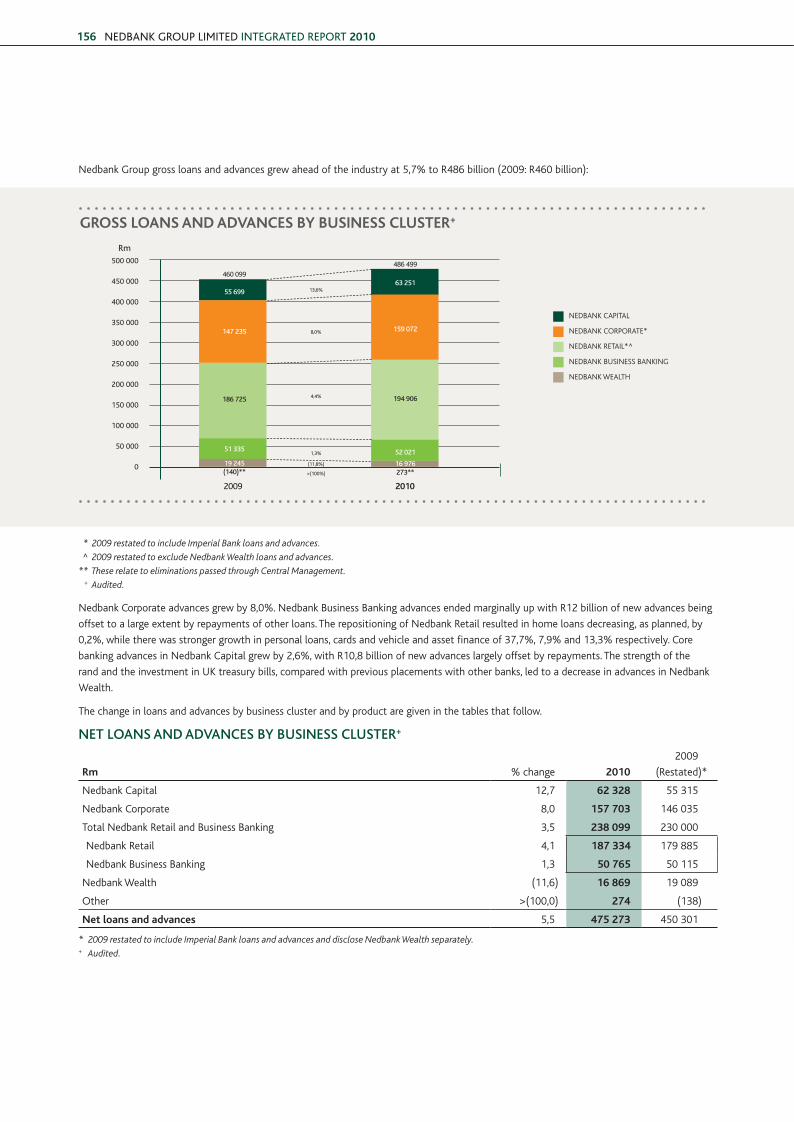
Nedbank Group gross loans and advances grew ahead of the industry at 5,7% to R486 billion (2009: R460 billion):
* 2009 restated to include Imperial Bank loans and advances.
^ 2009 restated to exclude Nedbank Wealth loans and advances.
** These relate to eliminations passed through Central Management.
+ Audited.
Nedbank Corporate advances grew by 8,0%. Nedbank Business Banking advances ended marginally up with R12 billion of new advances being
offset to a large extent by repayments of other loans. The repositioning of Nedbank Retail resulted in home loans decreasing, as planned, by
0,2%, while there was stronger growth in personal loans, cards and vehicle and asset finance of 37,7%, 7,9% and 13,3% respectively. Core
banking advances in Nedbank Capital grew by 2,6%, with R10,8 billion of new advances largely offset by repayments. The strength of the
rand and the investment in uk treasury bills, compared with previous placements with other banks, led to a decrease in advances in Nedbank
wealth.
The change in loans and advances by business cluster and by product are given in the tables that follow.
NEt lOANS AND ADVANCES bY buSINESS CluStEr+
rm % change 2010
2009
(Restated)*
Nedbank Capital 12,7 62 328 55 315
Nedbank Corporate 8,0 157 703 146 035
Total Nedbank Retail and Business Banking 3,5 238 099 230 000
Nedbank Retail 4,1 187 334 179 885
Nedbank Business Banking 1,3 50 765 50 115
Nedbank wealth (11,6) 16 869 19 089
other >(100,0) 274 (138)
net loans and advances 5,5 475 273 450 301
* 2009 restated to include Imperial Bank loans and advances and disclose Nedbank Wealth separately.+ Audited.
1,3%
(11,8%)
>(100%)
4,4%
8,0%
13,6%
GrOSS lOanS and adVanceS by buSineSS cluSTer+
500 000
450 000
400 000
350 000
300 000
250 000
200 000
150 000
100 000
50 000
0
Rm
2009 2010
NEdBANk CAPITAl
NEdBANk CoRPoRATE*
NEdBANk RETAIl*^
NEdBANk BusINEss BANkING
NEdBANk wEAlTh
19 245 16 976(140)** 273**
186 725 194 906
147 235 159 072
55 69963 251
51 335 52 021
460 099
486 499
6 Nedbank Risk FA.indd 156 22/03/2011 12:07 PM
ovERvIEw GRouP REPoRTs
oPERATIoNAl ovERvIEw
susTAINABlE dEvEloPMENT PERFoRMANCE
RIsk, GovERNANCE ANd CoMPlIANCE
rISk AND bAlANCE SHEEt MANAGEMENt rEVIEw
157
SuMMArY Of lOANS AND ADVANCES bY PrODuCt+
rm % change 2010
2009
(Restated)*
home loans 0,7 145 895 144 921
Commercial mortgages 6,7 86 100 80 672
Properties in possession (25,4) 662 887
Credit cards 7,9 7 910 7 334
overdrafts 20,0 13 307 11 093
Term loans 9,2 74 605 68 321
overnight loans 1,1 12 552 12 420
other loans to clients (0,7) 42 897 43 203
leases and instalment sales 5,9 67 881 64 128
Preference shares and debentures 23,2 20 499 16 633
Factoring accounts 46,9 3 202 2 179
deposits placed under reverse repurchase agreements 35,2 10 849 8 026
Trade, other bills and bankers’ acceptances (50,4) 140 282
Gross loans and advances 5,7 486 499 460 099
Impairment of loans and advances 14,6 (11 226) (9 798)
net loans and advances 5,5 475 273 450 301
+ Audited.
* Comparative results have been restated for the integration of Imperial Bank. Mortgage loans as migrated to the Property Finance Division have been reclassified from home loans to commercial mortgages and those to Nedbank Retail have been reclassified from commercial mortgages to home loans in line with the group’s reporting. The net result of this reclassification is a R4,2 billion adjustment from home loans to commercial mortgages.
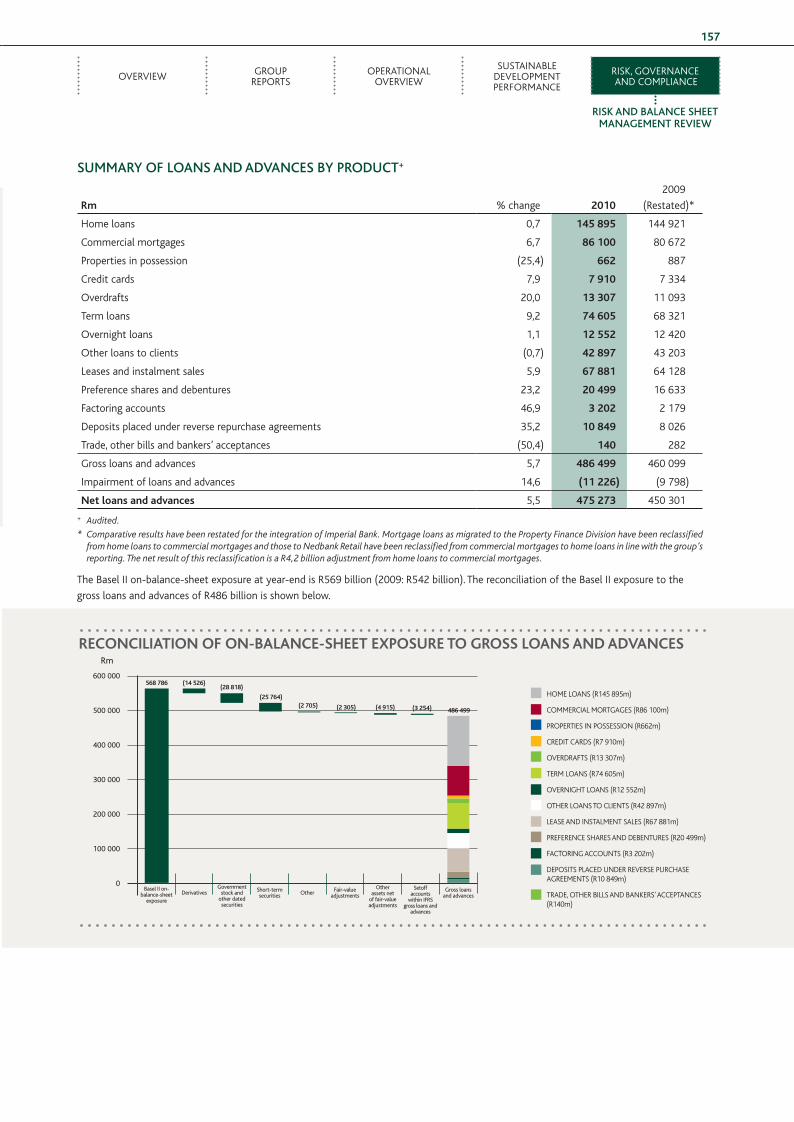
The Basel II on-balance-sheet exposure at year-end is R569 billion (2009: R542 billion). The reconciliation of the Basel II exposure to the
gross loans and advances of R486 billion is shown below.
recOnciliaTiOn OF On-balance-SheeT exPOSure TO GrOSS lOanS and adVanceS
600 000
500 000
400 000
300 000
200 000
100 000
0
Rm
hoME loANs (R145 895m)
CoMMERCIAl MoRTGAGEs (R86 100m)
PRoPERTIEs IN PossEssIoN (R662m)
CREdIT CARds (R7 910m)
ovERdRAFTs (R13 307m)
TERM loANs (R74 605m)
ovERNIGhT loANs (R12 552m)
oThER loANs To ClIENTs (R42 897m)
lEAsE ANd INsTAlMENT sAlEs (R67 881m)
PREFERENCE shAREs ANd dEBENTuREs (R20 499m)
FACToRING ACCouNTs (R3 202m)
dEPosITs PlACEd uNdER REvERsE PuRChAsE AGREEMENTs (R10 849m)
TRAdE, oThER BIlls ANd BANkERs’ ACCEPTANCEs (R140m)
Basel ii on-balance-sheet
exposureDerivatives
Government stock and
other dated securities
short-term securities Other Fair-value
adjustments
Other assets net
of fair-value adjustments
setoff accounts
within iFRs gross loans and
advances
Gross loans and advances
568 786 (14 526)(28 818)
(25 764)(2 705) (2 305) (4 915) (3 254) 486 499
6 Nedbank Risk FA.indd 157 22/03/2011 12:07 PM
NEDBANK GROUP LimitED iNtEGRAtED REPORt 2010158
bAlANCE SHEEt CrEDIt EXPOSurE** PEr bASEl II ASSEt ClASS AND buSINESS CluStEr
regulated
rmNedbankCapital*
NedbankCorporate*
TotalNedbank
Retail andBusinessBanking
NedbankRetail
NedbankBusinessBanking
Nedbankwealth
CentralManage-
ment 20102009
(Restated)
airb approach 85 103 141 570 194 785 142 536 52 249 12 237 18 071 451 766 431 493
Corporate 24 125 71 123 6 403 6 403 1 101 652 92 400
specialised lending – high- volatility commercial real estate 6 740 6 740 7 442
specialised lending – income-producing real estate 41 567 2 369 2 369 43 936 42 209
specialised lending – object finance 439
specialised lending – commodities finance 67 67 55
specialised lending – project finance 2 097 2 097 4 811
small and medium enterprises (sME) – corporate 631 4 066 22 879 22 879 27 576 23 672
Public sector entities 6 643 10 512 3 3 17 158 15 997
local governments and municipalities 245 6 038 1 060 1 060 7 343 5 623
sovereign 13 730 54 18 070 31 854 26 567
Banks 36 060 1 455 37 515 36 913
securities firms 104 10 114 906
Retail mortgages 4 113 432 108 958 4 474 11 447 124 883 123 621
Retail revolving credit 8 802 8 802 64 8 866 7 028
Retail – other 749 23 328 21 552 1 776 726 24 803 23 241
sME – retail 91 5 16 280 2 995 13 285 16 376 20 340
securitisation exposure 557 229 229 786 229
6 Nedbank Risk FA.indd 158 22/03/2011 12:07 PM
ovERvIEw GRouP REPoRTs
oPERATIoNAl ovERvIEw
susTAINABlE dEvEloPMENT PERFoRMANCE
RIsk, GovERNANCE ANd CoMPlIANCE
rISk AND bAlANCE SHEEt MANAGEMENt rEVIEw
159
bAlANCE SHEEt CrEDIt EXPOSurE** PEr bASEl II ASSEt ClASS AND buSINESS CluStEr (continued)regulated
rmNedbank
Capital*Nedbank
Corporate*
TotalNedbank
Retail andBusinessBanking
NedbankRetail
NedbankBusinessBanking
Nedbankwealth
CentralManage-
ment 20102009
(Restated)
The Standardised approach (TSa) – 20 493 48 051 48 051 – 10 912 167 79 623 75 224
Corporate 2 932 159 159 129 3 220 4 368
sME – corporate 10 007 3 047 3 047 13 054 13 634
Public sector entities 32 32 30
local governments and municipalities 17 4 4 21 2 578
sovereign 1 450 1 239 2 689 1 198
Banks 1 236 60 60 6 798 38 8 132 8 613
securities firms 313 313 307
Retail mortgages 2 804 3 483 3 483 2 137 8 424 7 274
Retail – other 1 523 37 710 37 710 738 39 971 33 409
sME – retail 179 3 267 3 267 3 446 3 514
securitisation exposure 321 321 321 299
Properties in possession – 5 639 631 8 18 – 662 887
non-regulated entities 21 096 11 393 4 938 4 530 408 470 (1 162) 36 735 34 473
balance sheet exposure (basel ii) 106 199 173 461 248 413 195 748 52 665 23 637 17 076 568 786 542 077
less assets included in Basel II asset
classes (42 948) (11 515) (1 106) (843) (263) (6 661) (16 803) (79 033) (78 216)
derivatives (14 419) (34) (60) (60) (1) (12) (14 526) (13 582)
Government stock and other dated
securities (6 849) (3 899) (18 070) (28 818) (33 903)
short-term securities (20 204) (1 357) (4 203) (25 764) (18 213)
Call money (1 057) (74) (132) (1 263) (929)
deposits with monetary
institutions (909) (656) 9 (1 556) (2 424)
Remittances in transit 119 (5) (9) 4 114 108
Fair-value adjustments (364) (1 844) (97) (12) (85) (2 305) (1 000)
other assets net of fair-value adjustments on assets 854 (3 770) (944) (762) (182) (2 325) 1 270 (4 915) (8 273)
setoff of accounts within International Financial Reporting standards (IFRs) total gross loans and advances – (2 873) (381) – (381) – – (3 254) (3 762)
Gross loans and advances 63 251 159 073 246 926 194 905 52 021 16 976 273 486 499 460 099
* Nedbank Corporate and Nedbank Capital include London Branch (AIRB Approach).
** Balance sheet exposure includes on-balance-sheet, repurchase and resale and derivative exposures.
6 Nedbank Risk FA.indd 159 22/03/2011 12:07 PM
NEDBANK GROUP LimitED iNtEGRAtED REPORt 2010160
ADVANCED INtErNAl rAtINGS-bASED APPrOACH fOr NEDbANk GrOuP Through Nedbank limited and london Branch 87% of the total credit extended in Nedbank Group is covered by the Basel II AIRB Approach, with the Imperial Bank, Fairbairn and Nedbank African subsidiaries’ credit portfolios on TsA. Nedbank intends to apply to the sARB in 2011 for approval to use the AIRB approach for the legacy Imperial Bank book.
The results shown below include both the Nedbank limited and london Branch exposure:
SuMMArY Of ADVANCED INtErNAl rAtINGS-bASED APPrOACHbASEl II CrEDIt EXPOSurES bY CluStEr AND ASSEt ClASS
2010rm
AIrb on-balance-
sheetexposure
AIrb off-balance-
sheetexposure
repurchase and resale
exposureDerivative exposure
total credit
extended*
Exposureat default
(EAD)
Downturnexpected
loss(perfor-
ming)
best estimate
of expected
loss (non-performing)
nedbank capital 60 348 6 843 10 829 13 926 91 946 78 604 216 744
Corporate 18 312 522 1 163 4 650 24 647 24 699 189 744
specialised lending – commodities finance 67 67 69
specialised lending – project finance 2 097 2 097 2 161 5
sME – corporate 241 390 631 710 4
Public sector entities 4 997 506 1 140 6 643 6 721
local governments and municipalities 147 98 245 193
sovereign 13 730 12 13 742 13 773
Banks 19 449 82 9 066 7 545 36 142 23 470 13
securities firms 7 614 94 3 718 631 2
Retail mortgages 4 4 4
Retail – other 740 9 749 749 2
sME – retail 91 91 111 1
securitisation 557 5 613 6 170 5 313
nedbank corporate 141 570 58 186 – – 199 756 184 138 444 491
Corporate 71 123 49 485 120 608 106 034 263 25
specialised lending – high-volatility commercial real estate 6 740 341 7 081 7 082 42 319
specialised lending – income-producing real estate 41 567 1 805 43 372 44 634 113 67
sME – corporate 4 066 782 4 848 4 776 24 80
Public sector entities 10 512 3 314 13 826 12 999 1
local governments and municipalities 6 038 480 6 518 6 545 1
sovereign 54 54 55
Banks 1 455 1 946 3 401 1 970
securities firms 10 10 10
Retail mortgages 3 3
Retail – other
sME – retail 5 30 35 33
6 Nedbank Risk FA.indd 160 22/03/2011 12:07 PM
ovERvIEw GRouP REPoRTs
oPERATIoNAl ovERvIEw
susTAINABlE dEvEloPMENT PERFoRMANCE
RIsk, GovERNANCE ANd CoMPlIANCE
rISk AND bAlANCE SHEEt MANAGEMENt rEVIEw
161
SuMMArY Of ADVANCED INtErNAl rAtINGS-bASED APPrOACHbASEl II CrEDIt EXPOSurES bY CluStEr AND ASSEt ClASS
2010rm
AIrb on-balance-
sheetexposure
AIrb off-balance-
sheetexposure
repurchase and resale
exposureDerivative exposure
total credit
extended*
Exposureat default
(EAD)
Downturnexpected
loss(perfor
ming)
best estimate
of expected
loss (non-performing)
Total nedbank retail and business banking 194 785 57 023 – – 251 808 244 405 2 614 6 150
Corporate 6 403 3 162 9 565 8 316 40 60
specialised lending – income- producing real estate 2 369 219 2 588 2 630 8 6
sME – corporate 22 879 8 845 31 724 31 044 152 362
Public sector entities 3 16 19 13
local governments and municipalities 1 060 12 1 072 1 113
Retail mortgages 113 432 19 402 132 834 136 481 814 2 889
Retail revolving credit 8 802 16 001 24 803 16 907 516 718
Retail – other 23 328 2 020 25 348 23 884 853 1 434
sME – retail 16 280 7 346 23 626 23 788 231 681
securitisation 229 229 229
nedbank retail 142 536 37 368 – – 179 904 174 837 2 223 5 146
Corporate 222 222 222 6
Retail mortgages 108 958 18 050 127 008 130 860 780 2 778
Retail revolving credit 8 802 16 001 24 803 16 907 516 718
Retail – other 21 552 1 885 23 437 22 005 837 1 243
sME – retail 2 995 1 210 4 205 4 614 84 407
securitisation 229 229 229
nedbank business banking 52 249 19 655 – – 71 904 69 568 391 1 004
Corporate 6 403 2 940 9 343 8 094 34 60
specialised lending – income-producing real estate 2 369 219 2 588 2 630 8 6
sME – corporate 22 879 8 845 31 724 31 044 152 362
Public sector entities 3 16 19 13
local governments and municipalities 1 060 12 1 072 1 113
Retail mortgages 4 474 1 352 5 826 5 621 34 111
Retail – other 1 776 135 1 911 1 879 16 191
sME – retail 13 285 6 136 19 421 19 174 147 274
nedbank Wealth 12 237 3 094 – – 15 331 16 988 39 76
Retail mortgages 11 447 2 789 14 236 15 549 31 74
Retail revolving credit 64 221 285 563 3 1
Retail – other 726 84 810 876 5 1
central Management 18 071 – – – 18 071 18 071 – 20
Corporate 1 1 1 20
sovereign 18 070 18 070 18 070
Total 427 011 125 146 10 829 13 926 576 912 542 206 3 313 7 481
downturn expected loss (AIRB Approach) 10 794
IFRs impairment on loans and advances 9 062
excess of downturn expected loss over eligible provisions 1 732
6 Nedbank Risk FA.indd 161 22/03/2011 12:07 PM
NEDBANK GROUP LimitED iNtEGRAtED REPORt 2010162
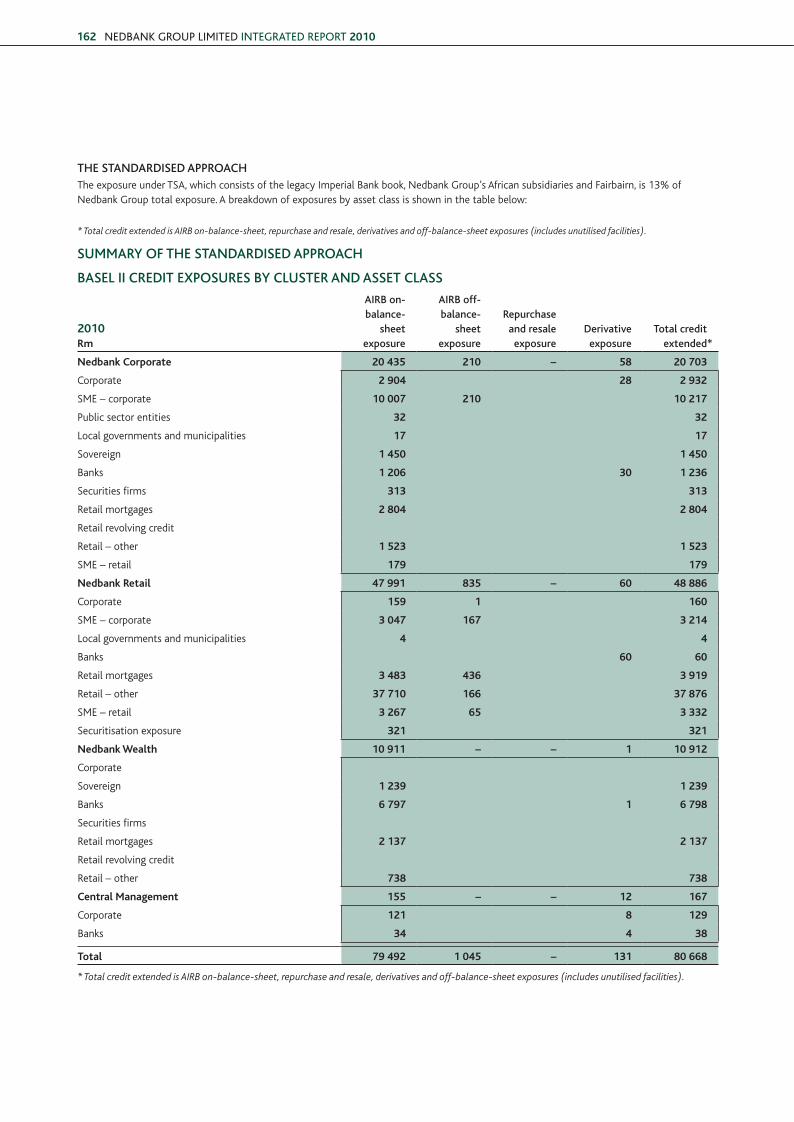
* Total credit extended is AIRB on-balance-sheet, repurchase and resale, derivatives and off-balance-sheet exposures (includes unutilised facilities).
SuMMArY Of tHE StANDArDISED APPrOACH
bASEl II CrEDIt EXPOSurES bY CluStEr AND ASSEt ClASS
2010 rm
AIrb on-balance-
sheet exposure
AIrb off-balance-
sheet exposure
repurchaseand resaleexposure
Derivativeexposure
total creditextended*
nedbank corporate 20 435 210 – 58 20 703
Corporate 2 904 28 2 932
sME – corporate 10 007 210 10 217
Public sector entities 32 32
local governments and municipalities 17 17
sovereign 1 450 1 450
Banks 1 206 30 1 236
securities firms 313 313
Retail mortgages 2 804 2 804
Retail revolving credit
Retail – other 1 523 1 523
sME – retail 179 179
nedbank retail 47 991 835 – 60 48 886
Corporate 159 1 160
sME – corporate 3 047 167 3 214
local governments and municipalities 4 4
Banks 60 60
Retail mortgages 3 483 436 3 919
Retail – other 37 710 166 37 876
sME – retail 3 267 65 3 332
securitisation exposure 321 321
nedbank Wealth 10 911 – – 1 10 912
Corporate
sovereign 1 239 1 239
Banks 6 797 1 6 798
securities firms
Retail mortgages 2 137 2 137
Retail revolving credit
Retail – other 738 738
central Management 155 – – 12 167
Corporate 121 8 129
Banks 34 4 38
Total 79 492 1 045 – 131 80 668
* Total credit extended is AIRB on-balance-sheet, repurchase and resale, derivatives and off-balance-sheet exposures (includes unutilised facilities).
tHE StANDArDISED APPrOACHThe exposure under TsA, which consists of the legacy Imperial Bank book, Nedbank Group’s African subsidiaries and Fairbairn, is 13% of Nedbank Group total exposure. A breakdown of exposures by asset class is shown in the table below:
6 Nedbank Risk FA.indd 162 22/03/2011 12:07 PM
ovERvIEw GRouP REPoRTs
oPERATIoNAl ovERvIEw
susTAINABlE dEvEloPMENT PERFoRMANCE
RIsk, GovERNANCE ANd CoMPlIANCE
rISk AND bAlANCE SHEEt MANAGEMENt rEVIEw
163
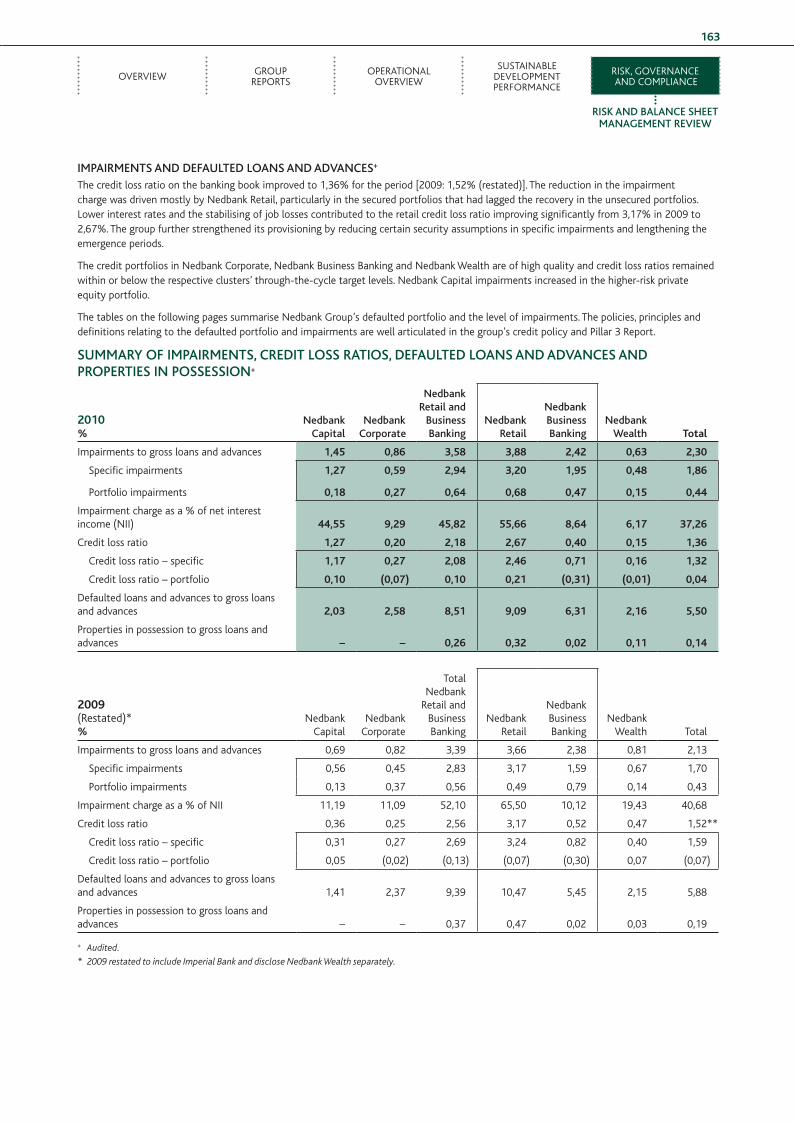
IMPAIrMENtS AND DEfAultED lOANS AND ADVANCES+
The credit loss ratio on the banking book improved to 1,36% for the period [2009: 1,52% (restated)]. The reduction in the impairment charge was driven mostly by Nedbank Retail, particularly in the secured portfolios that had lagged the recovery in the unsecured portfolios. lower interest rates and the stabilising of job losses contributed to the retail credit loss ratio improving significantly from 3,17% in 2009 to 2,67%. The group further strengthened its provisioning by reducing certain security assumptions in specific impairments and lengthening the emergence periods.
The credit portfolios in Nedbank Corporate, Nedbank Business Banking and Nedbank wealth are of high quality and credit loss ratios remained within or below the respective clusters’ through-the-cycle target levels. Nedbank Capital impairments increased in the higher-risk private equity portfolio.
The tables on the following pages summarise Nedbank Group’s defaulted portfolio and the level of impairments. The policies, principles and definitions relating to the defaulted portfolio and impairments are well articulated in the group’s credit policy and Pillar 3 Report.
SuMMArY Of IMPAIrMENtS, CrEDIt lOSS rAtIOS, DEfAultED lOANS AND ADVANCES AND PrOPErtIES IN POSSESSION+
2010%
Nedbank Capital
Nedbank Corporate
Nedbank retail and
business banking
Nedbank retail
Nedbank business banking
Nedbank wealth Total
Impairments to gross loans and advances 1,45 0,86 3,58 3,88 2,42 0,63 2,30
specific impairments 1,27 0,59 2,94 3,20 1,95 0,48 1,86
Portfolio impairments 0,18 0,27 0,64 0,68 0,47 0,15 0,44
Impairment charge as a % of net interest income (NII) 44,55 9,29 45,82 55,66 8,64 6,17 37,26
Credit loss ratio 1,27 0,20 2,18 2,67 0,40 0,15 1,36
Credit loss ratio – specific 1,17 0,27 2,08 2,46 0,71 0,16 1,32
Credit loss ratio – portfolio 0,10 (0,07) 0,10 0,21 (0,31) (0,01) 0,04
defaulted loans and advances to gross loans and advances 2,03 2,58 8,51 9,09 6,31 2,16 5,50
Properties in possession to gross loans and advances – – 0,26 0,32 0,02 0,11 0,14
2009(Restated)*%
Nedbank Capital
Nedbank Corporate
Total Nedbank
Retail and Business Banking
Nedbank Retail
Nedbank Business Banking
Nedbank wealth Total
Impairments to gross loans and advances 0,69 0,82 3,39 3,66 2,38 0,81 2,13
specific impairments 0,56 0,45 2,83 3,17 1,59 0,67 1,70
Portfolio impairments 0,13 0,37 0,56 0,49 0,79 0,14 0,43
Impairment charge as a % of NII 11,19 11,09 52,10 65,50 10,12 19,43 40,68
Credit loss ratio 0,36 0,25 2,56 3,17 0,52 0,47 1,52**
Credit loss ratio – specific 0,31 0,27 2,69 3,24 0,82 0,40 1,59
Credit loss ratio – portfolio 0,05 (0,02) (0,13) (0,07) (0,30) 0,07 (0,07)
defaulted loans and advances to gross loans and advances 1,41 2,37 9,39 10,47 5,45 2,15 5,88
Properties in possession to gross loans and advances – – 0,37 0,47 0,02 0,03 0,19
+ Audited.
* 2009 restated to include Imperial Bank and disclose Nedbank Wealth separately.
6 Nedbank Risk FA.indd 163 22/03/2011 12:07 PM
NEDBANK GROUP LimitED iNtEGRAtED REPORt 2010164
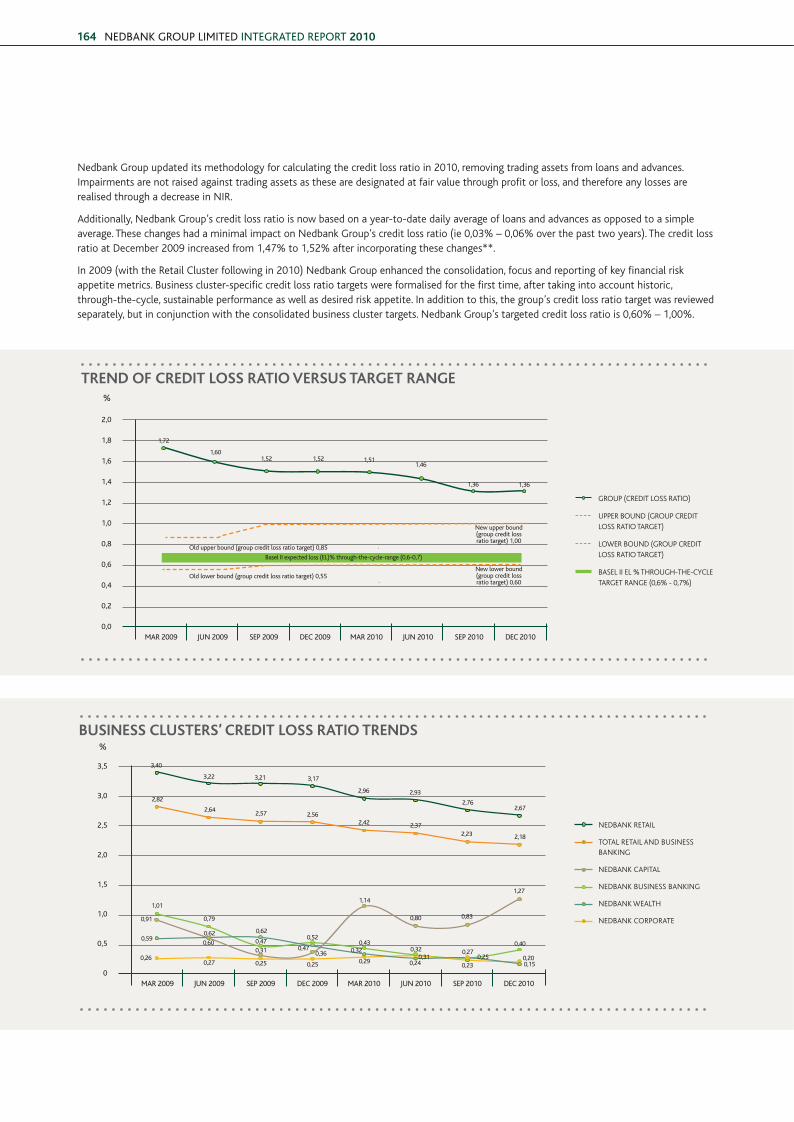
Nedbank Group updated its methodology for calculating the credit loss ratio in 2010, removing trading assets from loans and advances. Impairments are not raised against trading assets as these are designated at fair value through profit or loss, and therefore any losses are realised through a decrease in NIR.
Additionally, Nedbank Group’s credit loss ratio is now based on a year-to-date daily average of loans and advances as opposed to a simple average. These changes had a minimal impact on Nedbank Group’s credit loss ratio (ie 0,03% – 0,06% over the past two years). The credit loss ratio at december 2009 increased from 1,47% to 1,52% after incorporating these changes**.
In 2009 (with the Retail Cluster following in 2010) Nedbank Group enhanced the consolidation, focus and reporting of key financial risk appetite metrics. Business cluster-specific credit loss ratio targets were formalised for the first time, after taking into account historic, through-the-cycle, sustainable performance as well as desired risk appetite. In addition to this, the group’s credit loss ratio target was reviewed separately, but in conjunction with the consolidated business cluster targets. Nedbank Group’s targeted credit loss ratio is 0,60% – 1,00%.
The business clusters’ credit loss ratios over time are also shown below.
Note: Nedbank Corporate and Nedbank Retail credit loss ratios restated due to Imperial Bank integration.
buSineSS cluSTerS’ crediT lOSS raTiO TrendS
3,5
3,0
2,5
2,0
1,5
1,0
0,5
0
%
NEdBANk RETAIl
ToTAl RETAIl ANd BusINEss BANkING
NEdBANk CAPITAl
NEdBANk BusINEss BANkING
NEdBANk wEAlTh
NEdBANk CoRPoRATE
mAR 2009 JUN 2009 sEP 2009 DEC 2009 mAR 2010 JUN 2010 sEP 2010 DEC 2010
3,40
2,82
3,22
2,64
1,01
0,80 0,83
1,27
0,79
0,47
0,91
0,59
0,260,27 0,25 0,25 0,29 0,24
0,25 0,20
0,62
0,47 0,320,31
0,23 0,15
0,62
0,600,31 0,36
1,14
0,520,43
0,32 0,270,40
2,57 2,562,42 2,37
2,23 2,18
3,21 3,17
2,96 2,93
2,762,67
Trend OF crediT lOSS raTiO VerSuS TarGeT ranGe
2,0
1,8
1,6
1,4
1,2
1,0
0,8
0,6
0,4
0,2
0,0
%
mAR 2009 JUN 2009 sEP 2009 DEC 2009 mAR 2010 JUN 2010 sEP 2010 DEC 2010
GRouP (CREdIT loss RATIo)
uPPER BouNd (GRouP CREdIT loss RATIo TARGET)
lowER BouNd (GRouP CREdIT loss RATIo TARGET)
BAsEl II El % ThRouGh-ThE-CyClE TARGET RANGE (0,6% - 0,7%)
Old upper bound (group credit loss ratio target) 0,85
Basel ii expected loss (EL)% through-the-cycle-range (0,6-0,7)
Old lower bound (group credit loss ratio target) 0,55New lower bound (group credit loss ratio target) 0,60
New upper bound (group credit loss ratio target) 1,00
1,72
1,601,52 1,52 1,51
1,46
1,36 1,36
6 Nedbank Risk FA.indd 164 22/03/2011 12:07 PM
ovERvIEw GRouP REPoRTs
oPERATIoNAl ovERvIEw
susTAINABlE dEvEloPMENT PERFoRMANCE
RIsk, GovERNANCE ANd CoMPlIANCE
rISk AND bAlANCE SHEEt MANAGEMENt rEVIEw
165
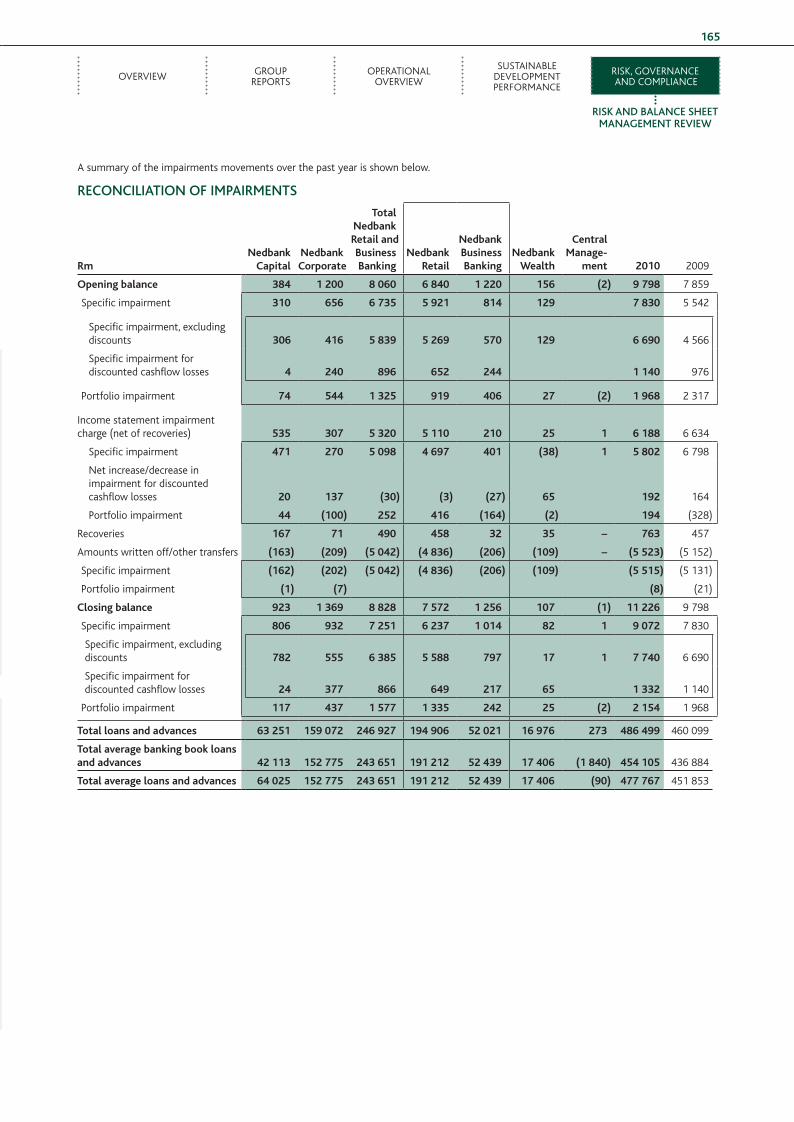
A summary of the impairments movements over the past year is shown below.
rECONCIlIAtION Of IMPAIrMENtS
rmnedbank
capital nedbankcorporate
Totalnedbankretail andbusinessbanking
nedbankretail
nedbankbusinessbanking
nedbankWealth
centralManage-
ment 2010 2009
Opening balance 384 1 200 8 060 6 840 1 220 156 (2) 9 798 7 859
specific impairment 310 656 6 735 5 921 814 129 7 830 5 542
specific impairment, excluding discounts 306 416 5 839 5 269 570 129 6 690 4 566
specific impairment for discounted cashflow losses 4 240 896 652 244 1 140 976
Portfolio impairment 74 544 1 325 919 406 27 (2) 1 968 2 317
Income statement impairment charge (net of recoveries) 535 307 5 320 5 110 210 25 1 6 188 6 634
specific impairment 471 270 5 098 4 697 401 (38) 1 5 802 6 798
Net increase/decrease in impairment for discounted cashflow losses 20 137 (30) (3) (27) 65 192 164
Portfolio impairment 44 (100) 252 416 (164) (2) 194 (328)
Recoveries 167 71 490 458 32 35 – 763 457
Amounts written off/other transfers (163) (209) (5 042) (4 836) (206) (109) – (5 523) (5 152)
specific impairment (162) (202) (5 042) (4 836) (206) (109) (5 515) (5 131)
Portfolio impairment (1) (7) (8) (21)
closing balance 923 1 369 8 828 7 572 1 256 107 (1) 11 226 9 798
specific impairment 806 932 7 251 6 237 1 014 82 1 9 072 7 830
specific impairment, excluding discounts 782 555 6 385 5 588 797 17 1 7 740 6 690
specific impairment for discounted cashflow losses 24 377 866 649 217 65 1 332 1 140
Portfolio impairment 117 437 1 577 1 335 242 25 (2) 2 154 1 968
Total loans and advances 63 251 159 072 246 927 194 906 52 021 16 976 273 486 499 460 099
Total average banking book loans and advances 42 113 152 775 243 651 191 212 52 439 17 406 (1 840) 454 105 436 884
Total average loans and advances 64 025 152 775 243 651 191 212 52 439 17 406 (90) 477 767 451 853
6 Nedbank Risk FA.indd 165 22/03/2011 12:07 PM
NEDBANK GROUP LimitED iNtEGRAtED REPORt 2010166
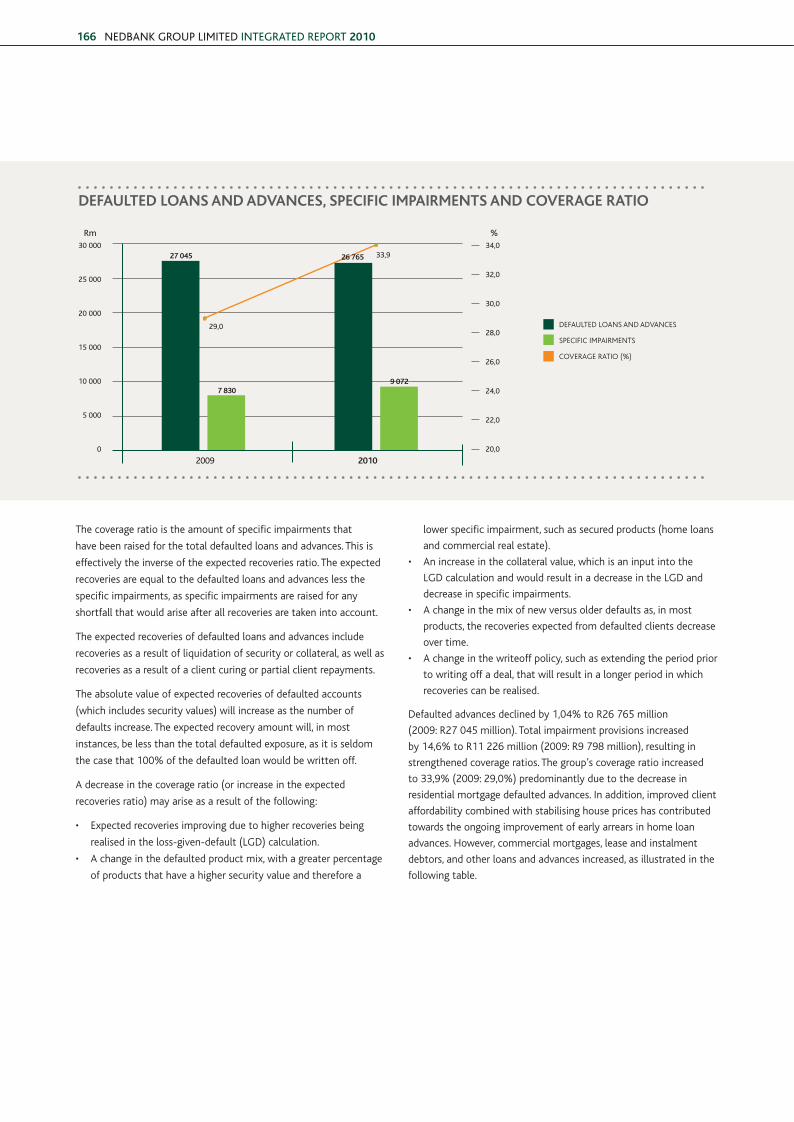
The coverage ratio is the amount of specific impairments that
have been raised for the total defaulted loans and advances. This is
effectively the inverse of the expected recoveries ratio. The expected
recoveries are equal to the defaulted loans and advances less the
specific impairments, as specific impairments are raised for any
shortfall that would arise after all recoveries are taken into account.
The expected recoveries of defaulted loans and advances include
recoveries as a result of liquidation of security or collateral, as well as
recoveries as a result of a client curing or partial client repayments.
The absolute value of expected recoveries of defaulted accounts
(which includes security values) will increase as the number of
defaults increase. The expected recovery amount will, in most
instances, be less than the total defaulted exposure, as it is seldom
the case that 100% of the defaulted loan would be written off.
A decrease in the coverage ratio (or increase in the expected
recoveries ratio) may arise as a result of the following:
• Expected recoveries improving due to higher recoveries being
realised in the loss-given-default (lGd) calculation.
• A change in the defaulted product mix, with a greater percentage
of products that have a higher security value and therefore a
lower specific impairment, such as secured products (home loans
and commercial real estate).
• An increase in the collateral value, which is an input into the
lGd calculation and would result in a decrease in the lGd and
decrease in specific impairments.
• A change in the mix of new versus older defaults as, in most
products, the recoveries expected from defaulted clients decrease
over time.
• A change in the writeoff policy, such as extending the period prior
to writing off a deal, that will result in a longer period in which
recoveries can be realised.
defaulted advances declined by 1,04% to R26 765 million
(2009: R27 045 million). Total impairment provisions increased
by 14,6% to R11 226 million (2009: R9 798 million), resulting in
strengthened coverage ratios. The group’s coverage ratio increased
to 33,9% (2009: 29,0%) predominantly due to the decrease in
residential mortgage defaulted advances. In addition, improved client
affordability combined with stabilising house prices has contributed
towards the ongoing improvement of early arrears in home loan
advances. however, commercial mortgages, lease and instalment
debtors, and other loans and advances increased, as illustrated in the
following table.
deFaulTed lOanS and adVanceS, SPeciFic iMPairMenTS and cOVeraGe raTiO
30 000
25 000
20 000
15 000
10 000
5 000
0
34,0
32,0
30,0
28,0
26,0
24,0
22,0
20,0
Rm %
2009 2010
dEFAulTEd loANs ANd AdvANCEs
sPECIFIC IMPAIRMENTs
CovERAGE RATIo (%)
27 045
29,0
33,926 765
7 8309 072
6 Nedbank Risk FA.indd 166 22/03/2011 12:07 PM
ovERvIEw GRouP REPoRTs
oPERATIoNAl ovERvIEw
susTAINABlE dEvEloPMENT PERFoRMANCE
RIsk, GovERNANCE ANd CoMPlIANCE
rISk AND bAlANCE SHEEt MANAGEMENt rEVIEw
167
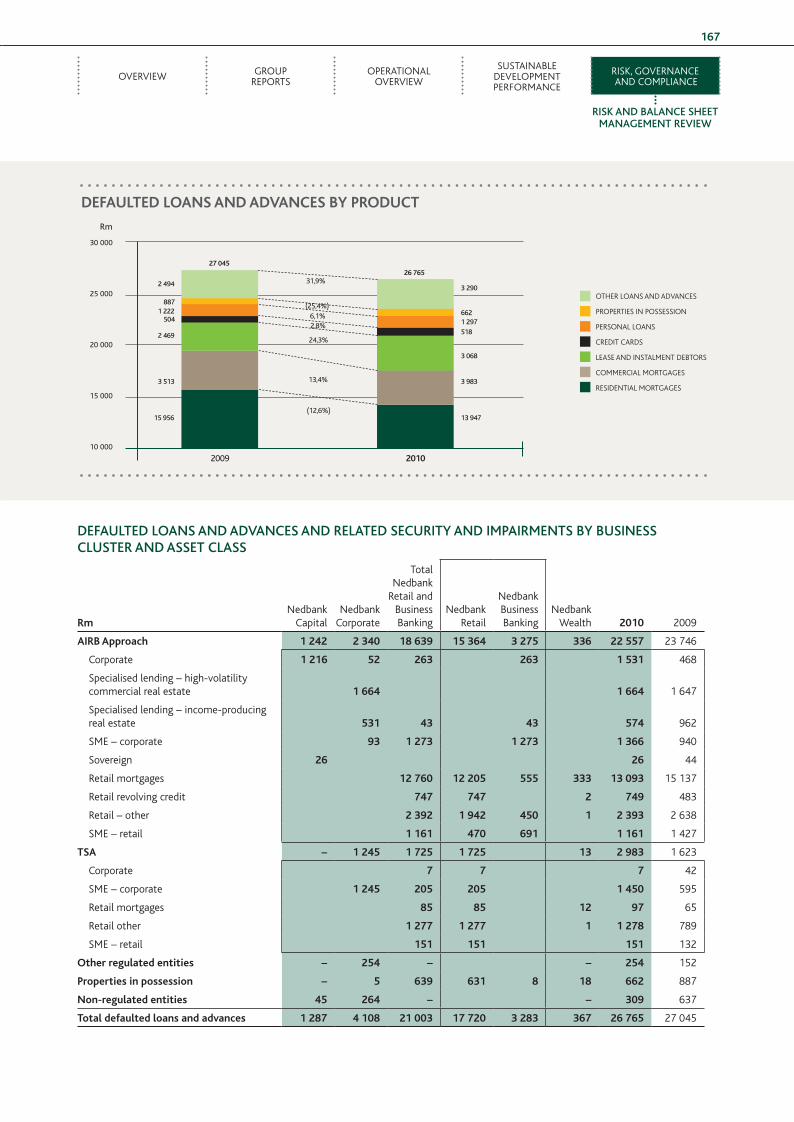
DEfAultED lOANS AND ADVANCES AND rElAtED SECurItY AND IMPAIrMENtS bY buSINESS CluStEr AND ASSEt ClASS
rmNedbank
Capital Nedbank
Corporate
TotalNedbank
Retail and BusinessBanking
NedbankRetail
NedbankBusinessBanking
Nedbankwealth 2010 2009
airb approach 1 242 2 340 18 639 15 364 3 275 336 22 557 23 746
Corporate 1 216 52 263 263 1 531 468
specialised lending – high-volatility commercial real estate 1 664 1 664 1 647
specialised lending – income-producing real estate 531 43 43 574 962
sME – corporate 93 1 273 1 273 1 366 940
sovereign 26 26 44
Retail mortgages 12 760 12 205 555 333 13 093 15 137
Retail revolving credit 747 747 2 749 483
Retail – other 2 392 1 942 450 1 2 393 2 638
sME – retail 1 161 470 691 1 161 1 427
TSa – 1 245 1 725 1 725 13 2 983 1 623
Corporate 7 7 7 42
sME – corporate 1 245 205 205 1 450 595
Retail mortgages 85 85 12 97 65
Retail other 1 277 1 277 1 1 278 789
sME – retail 151 151 151 132
Other regulated entities – 254 – – 254 152
Properties in possession – 5 639 631 8 18 662 887
non-regulated entities 45 264 – – 309 637
Total defaulted loans and advances 1 287 4 108 21 003 17 720 3 283 367 26 765 27 045
deFaulTed lOanS and adVanceS by PrOducT
Rm
oThER loANs ANd AdvANCEs
PRoPERTIEs IN PossEssIoN
PERsoNAl loANs
CREdIT CARds
lEAsE ANd INsTAlMENT dEBToRs
CoMMERCIAl MoRTGAGEs
REsIdENTIAl MoRTGAGEs
(12,6%)
13,4%
24,3%
2,8%6,1%
(25,4%)
31,9%
30 000
25 000
20 000
15 000
10 000
2009 2010
15 956 13 947
3 513 3 983
2 469
3 068
504
518
1 222
1 297
887
662
2 4943 290
27 04526 765
6 Nedbank Risk FA.indd 167 22/03/2011 12:07 PM
NEDBANK GROUP LimitED iNtEGRAtED REPORt 2010168
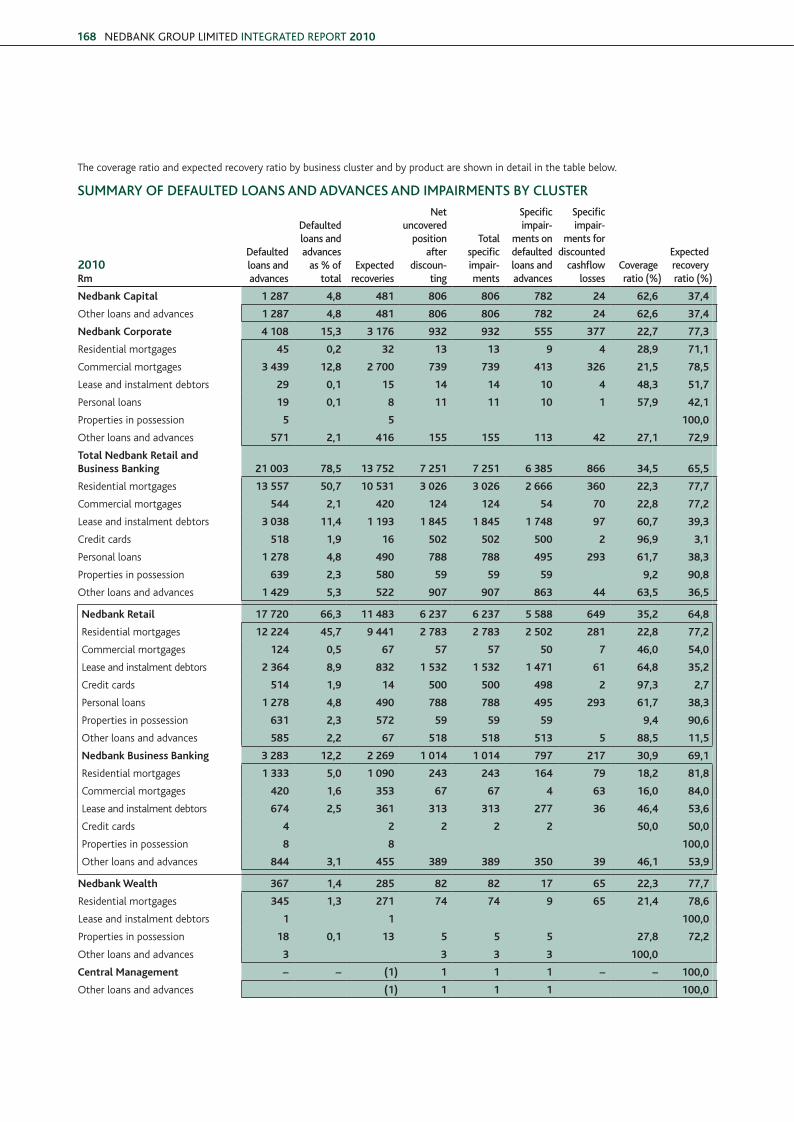
The coverage ratio and expected recovery ratio by business cluster and by product are shown in detail in the table below.
SuMMArY Of DEfAultED lOANS AND ADVANCES AND IMPAIrMENtS bY CluStEr
2010rm
Defaulted loans and advances
Defaulted loans and advances
as % of total
Expected recoveries
Net uncovered
position after
discoun-ting
total specific impair-ments
Specific impair-
ments on defaulted loans and advances
Specific impair-
ments for discounted
cashflow losses
Coverage ratio (%)
Expected recovery ratio (%)
nedbank capital 1 287 4,8 481 806 806 782 24 62,6 37,4
other loans and advances 1 287 4,8 481 806 806 782 24 62,6 37,4
nedbank corporate 4 108 15,3 3 176 932 932 555 377 22,7 77,3
Residential mortgages 45 0,2 32 13 13 9 4 28,9 71,1
Commercial mortgages 3 439 12,8 2 700 739 739 413 326 21,5 78,5
lease and instalment debtors 29 0,1 15 14 14 10 4 48,3 51,7
Personal loans 19 0,1 8 11 11 10 1 57,9 42,1
Properties in possession 5 5 100,0
other loans and advances 571 2,1 416 155 155 113 42 27,1 72,9
Total nedbank retail and business banking 21 003 78,5 13 752 7 251 7 251 6 385 866 34,5 65,5
Residential mortgages 13 557 50,7 10 531 3 026 3 026 2 666 360 22,3 77,7
Commercial mortgages 544 2,1 420 124 124 54 70 22,8 77,2
lease and instalment debtors 3 038 11,4 1 193 1 845 1 845 1 748 97 60,7 39,3
Credit cards 518 1,9 16 502 502 500 2 96,9 3,1
Personal loans 1 278 4,8 490 788 788 495 293 61,7 38,3
Properties in possession 639 2,3 580 59 59 59 9,2 90,8
other loans and advances 1 429 5,3 522 907 907 863 44 63,5 36,5
nedbank retail 17 720 66,3 11 483 6 237 6 237 5 588 649 35,2 64,8
Residential mortgages 12 224 45,7 9 441 2 783 2 783 2 502 281 22,8 77,2
Commercial mortgages 124 0,5 67 57 57 50 7 46,0 54,0
lease and instalment debtors 2 364 8,9 832 1 532 1 532 1 471 61 64,8 35,2
Credit cards 514 1,9 14 500 500 498 2 97,3 2,7
Personal loans 1 278 4,8 490 788 788 495 293 61,7 38,3
Properties in possession 631 2,3 572 59 59 59 9,4 90,6
other loans and advances 585 2,2 67 518 518 513 5 88,5 11,5
nedbank business banking 3 283 12,2 2 269 1 014 1 014 797 217 30,9 69,1
Residential mortgages 1 333 5,0 1 090 243 243 164 79 18,2 81,8
Commercial mortgages 420 1,6 353 67 67 4 63 16,0 84,0
lease and instalment debtors 674 2,5 361 313 313 277 36 46,4 53,6
Credit cards 4 2 2 2 2 50,0 50,0
Properties in possession 8 8 100,0
other loans and advances 844 3,1 455 389 389 350 39 46,1 53,9
nedbank Wealth 367 1,4 285 82 82 17 65 22,3 77,7
Residential mortgages 345 1,3 271 74 74 9 65 21,4 78,6
lease and instalment debtors 1 1 100,0
Properties in possession 18 0,1 13 5 5 5 27,8 72,2
other loans and advances 3 3 3 3 100,0
central Management – – (1) 1 1 1 – – 100,0
other loans and advances (1) 1 1 1 100,0
6 Nedbank Risk FA.indd 168 22/03/2011 12:07 PM
ovERvIEw GRouP REPoRTs
oPERATIoNAl ovERvIEw
susTAINABlE dEvEloPMENT PERFoRMANCE
RIsk, GovERNANCE ANd CoMPlIANCE
rISk AND bAlANCE SHEEt MANAGEMENt rEVIEw
169
SuMMArY Of DEfAultED lOANS AND ADVANCES AND IMPAIrMENtS bY CluStEr (continued)
2010rm
Defaulted loans and advances
Defaulted loans and advances
as % of total
Expected recoveries
Net uncovered
position after
discoun-ting
total specific impair-ments
Specific impair-
ments on defaulted loans and advances
Specific impair-
ments for discounted
cashflow losses
Coverage ratio (%)
Expected recovery ratio (%)
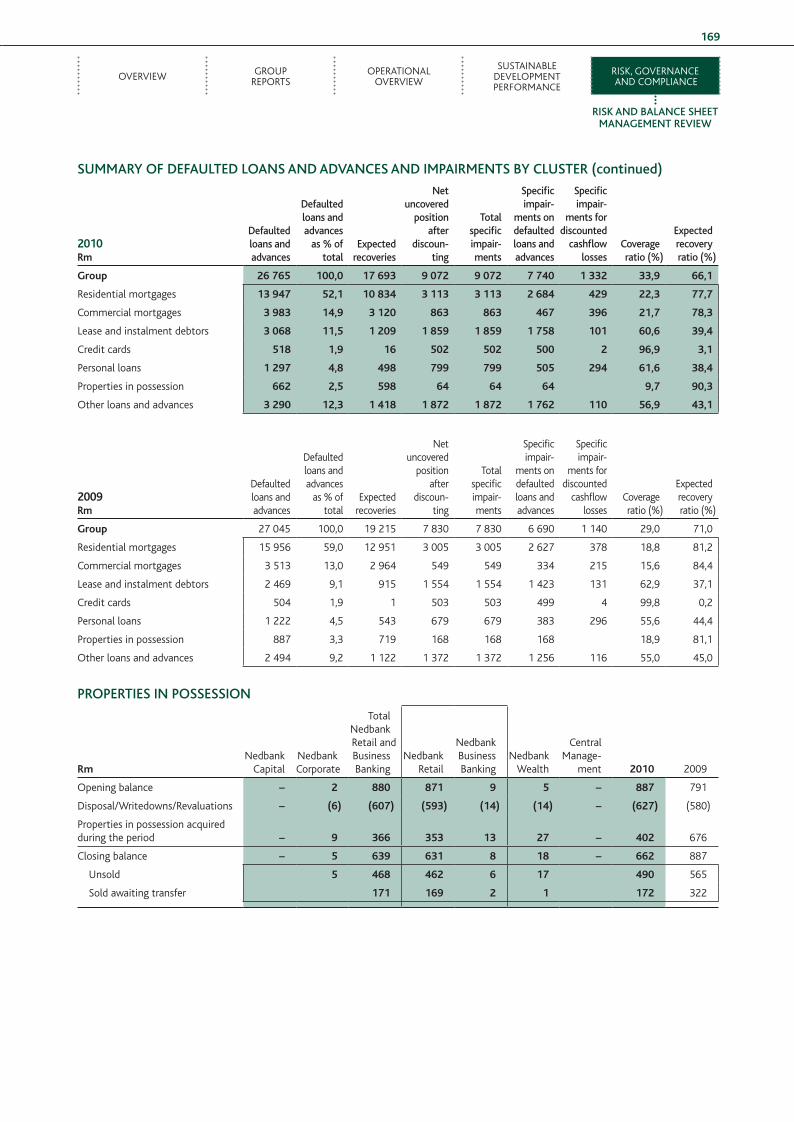
Group 26 765 100,0 17 693 9 072 9 072 7 740 1 332 33,9 66,1
Residential mortgages 13 947 52,1 10 834 3 113 3 113 2 684 429 22,3 77,7
Commercial mortgages 3 983 14,9 3 120 863 863 467 396 21,7 78,3
lease and instalment debtors 3 068 11,5 1 209 1 859 1 859 1 758 101 60,6 39,4
Credit cards 518 1,9 16 502 502 500 2 96,9 3,1
Personal loans 1 297 4,8 498 799 799 505 294 61,6 38,4
Properties in possession 662 2,5 598 64 64 64 9,7 90,3
other loans and advances 3 290 12,3 1 418 1 872 1 872 1 762 110 56,9 43,1
2009rm
defaulted loans and advances
defaulted loans and advances
as % of total
Expected recoveries
Net uncovered
position after
discoun-ting
Total specific impair-ments
specific impair-
ments on defaulted loans and advances
specific impair-
ments for discounted
cashflow losses
Coverage ratio (%)
Expected recovery ratio (%)
Group 27 045 100,0 19 215 7 830 7 830 6 690 1 140 29,0 71,0
Residential mortgages 15 956 59,0 12 951 3 005 3 005 2 627 378 18,8 81,2
Commercial mortgages 3 513 13,0 2 964 549 549 334 215 15,6 84,4
lease and instalment debtors 2 469 9,1 915 1 554 1 554 1 423 131 62,9 37,1
Credit cards 504 1,9 1 503 503 499 4 99,8 0,2
Personal loans 1 222 4,5 543 679 679 383 296 55,6 44,4
Properties in possession 887 3,3 719 168 168 168 18,9 81,1
other loans and advances 2 494 9,2 1 122 1 372 1 372 1 256 116 55,0 45,0
PrOPErtIES IN POSSESSION
rmNedbank
Capital NedbankCorporate
Total Nedbank Retail and Business Banking
NedbankRetail
NedbankBusinessBanking
Nedbankwealth
Central Manage-
ment 2010 2009
opening balance – 2 880 871 9 5 – 887 791
disposal/writedowns/Revaluations – (6) (607) (593) (14) (14) – (627) (580)
Properties in possession acquired during the period – 9 366 353 13 27 – 402 676
Closing balance – 5 639 631 8 18 – 662 887
unsold 5 468 462 6 17 490 565
sold awaiting transfer 171 169 2 1 172 322
6 Nedbank Risk FA.indd 169 22/03/2011 12:07 PM
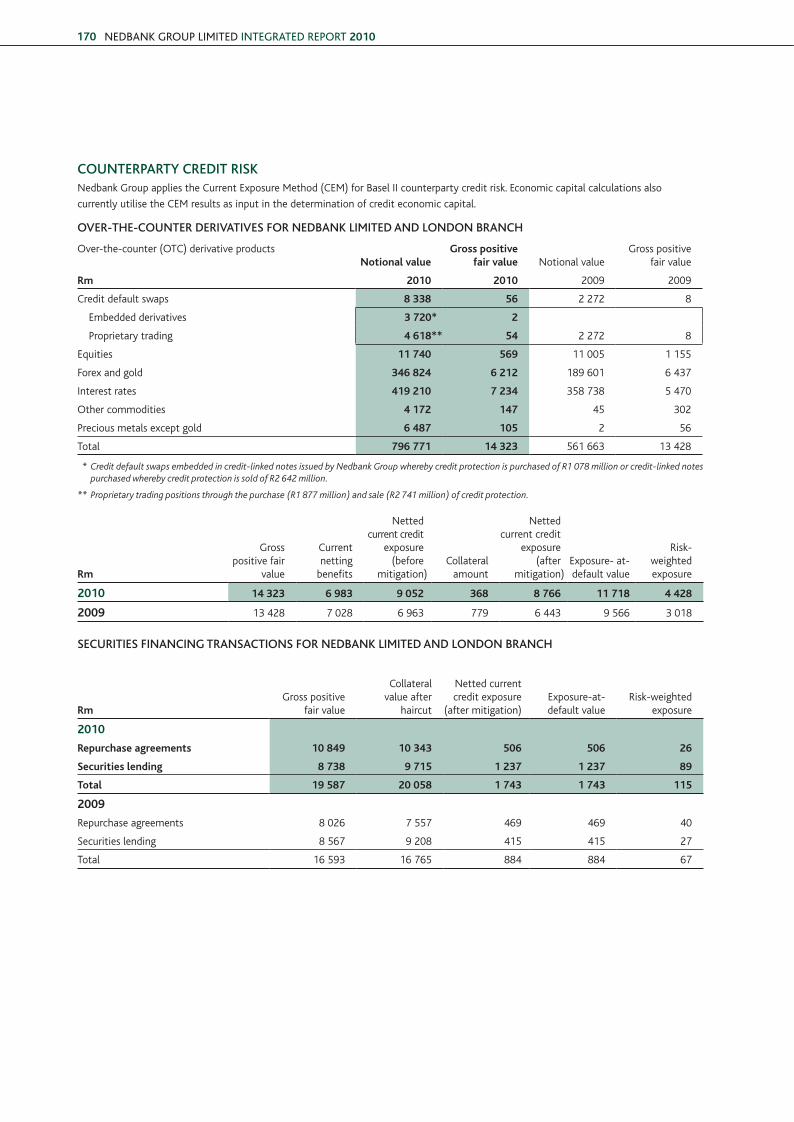
NEDBANK GROUP LimitED iNtEGRAtED REPORt 2010170
COuNtErPArtY CrEDIt rISkNedbank Group applies the Current Exposure Method (CEM) for Basel II counterparty credit risk. Economic capital calculations also
currently utilise the CEM results as input in the determination of credit economic capital.
OVEr-tHE-COuNtEr DErIVAtIVES fOr NEDbANk lIMItED AND lONDON brANCH
over-the-counter (oTC) derivative products notional value
Gross positive fair value Notional value
Gross positive fair value
rm 2010 2010 2009 2009
Credit default swaps 8 338 56 2 272 8
Embedded derivatives 3 720* 2
Proprietary trading 4 618** 54 2 272 8
Equities 11 740 569 11 005 1 155
Forex and gold 346 824 6 212 189 601 6 437
Interest rates 419 210 7 234 358 738 5 470
other commodities 4 172 147 45 302
Precious metals except gold 6 487 105 2 56
Total 796 771 14 323 561 663 13 428
* Credit default swaps embedded in credit-linked notes issued by Nedbank Group whereby credit protection is purchased of R1 078 million or credit-linked notes purchased whereby credit protection is sold of R2 642 million.
** Proprietary trading positions through the purchase (R1 877 million) and sale (R2 741 million) of credit protection.
rm
Gross positive fair
value
Current netting
benefits
Netted current credit
exposure (before
mitigation)Collateral
amount
Netted current credit
exposure (after
mitigation)Exposure- at- default value
Risk-weighted exposure
2010 14 323 6 983 9 052 368 8 766 11 718 4 428
2009 13 428 7 028 6 963 779 6 443 9 566 3 018
SECurItIES fINANCING trANSACtIONS fOr NEDbANk lIMItED AND lONDON brANCH
rmGross positive
fair value
Collateral value after
haircut
Netted current credit exposure
(after mitigation)Exposure-at- default value
Risk-weighted exposure
2010
repurchase agreements 10 849 10 343 506 506 26
Securities lending 8 738 9 715 1 237 1 237 89
Total 19 587 20 058 1 743 1 743 115
2009
Repurchase agreements 8 026 7 557 469 469 40
securities lending 8 567 9 208 415 415 27
Total 16 593 16 765 884 884 67
6 Nedbank Risk FA.indd 170 22/03/2011 12:07 PM
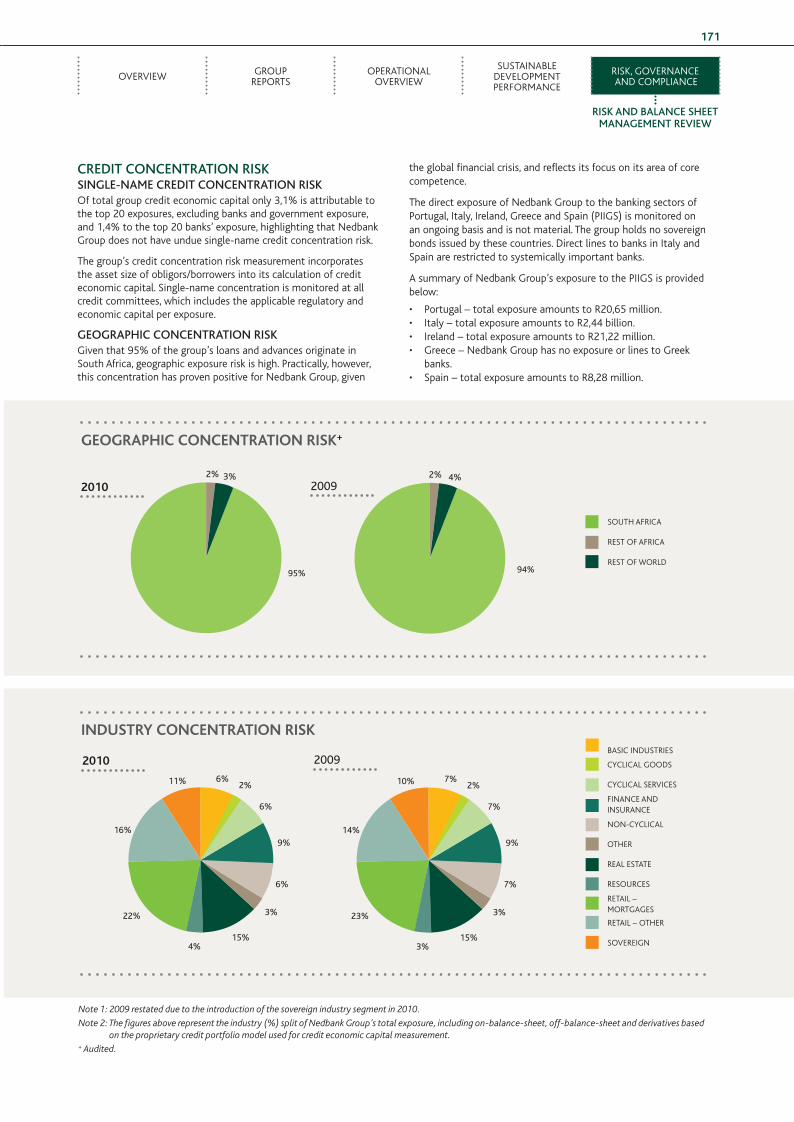
ovERvIEw GRouP REPoRTs
oPERATIoNAl ovERvIEw
susTAINABlE dEvEloPMENT PERFoRMANCE
RIsk, GovERNANCE ANd CoMPlIANCE
rISk AND bAlANCE SHEEt MANAGEMENt rEVIEw
171
CrEDIt CONCENtrAtION rISkSINGlE-NAME CrEDIt CONCENtrAtION rISkof total group credit economic capital only 3,1% is attributable to the top 20 exposures, excluding banks and government exposure, and 1,4% to the top 20 banks’ exposure, highlighting that Nedbank Group does not have undue single-name credit concentration risk.
The group’s credit concentration risk measurement incorporates the asset size of obligors/borrowers into its calculation of credit economic capital. single-name concentration is monitored at all credit committees, which includes the applicable regulatory and economic capital per exposure.
GEOGrAPHIC CONCENtrAtION rISkGiven that 95% of the group’s loans and advances originate in south Africa, geographic exposure risk is high. Practically, however, this concentration has proven positive for Nedbank Group, given
the global financial crisis, and reflects its focus on its area of core competence.
The direct exposure of Nedbank Group to the banking sectors of Portugal, Italy, Ireland, Greece and spain (PIIGs) is monitored on an ongoing basis and is not material. The group holds no sovereign bonds issued by these countries. direct lines to banks in Italy and spain are restricted to systemically important banks.
A summary of Nedbank Group’s exposure to the PIIGs is provided below:
• Portugal – total exposure amounts to R20,65 million.• Italy – total exposure amounts to R2,44 billion.• Ireland – total exposure amounts to R21,22 million.• Greece – Nedbank Group has no exposure or lines to Greek
banks.• spain – total exposure amounts to R8,28 million.
Note 1: 2009 restated due to the introduction of the sovereign industry segment in 2010.
Note 2: The figures above represent the industry (%) split of Nedbank Group’s total exposure, including on-balance-sheet, off-balance-sheet and derivatives based on the proprietary credit portfolio model used for credit economic capital measurement.
+ Audited.
GeOGraPhic cOncenTraTiOn riSk+
souTh AFRICA
REsT oF AFRICA
REsT oF woRld
2010
95%
2009
94%
3%2% 4%2%
induSTry cOncenTraTiOn riSk
RETAIl –MoRTGAGEs
RETAIl – oThER
sovEREIGN
BAsIC INdusTRIEs
CyClICAl Goods
CyClICAl sERvICEs
FINANCE ANd INsuRANCE
NoN-CyClICAl
oThER
REAl EsTATE
REsouRCEs
2010 2009
10%
23%
15%3%
3%
7%
9%
7%
14%
7%2%11%
22%
15%4%
3%
6%
9%
6%
16%
6%2%
6 Nedbank Risk FA.indd 171 22/03/2011 12:07 PM
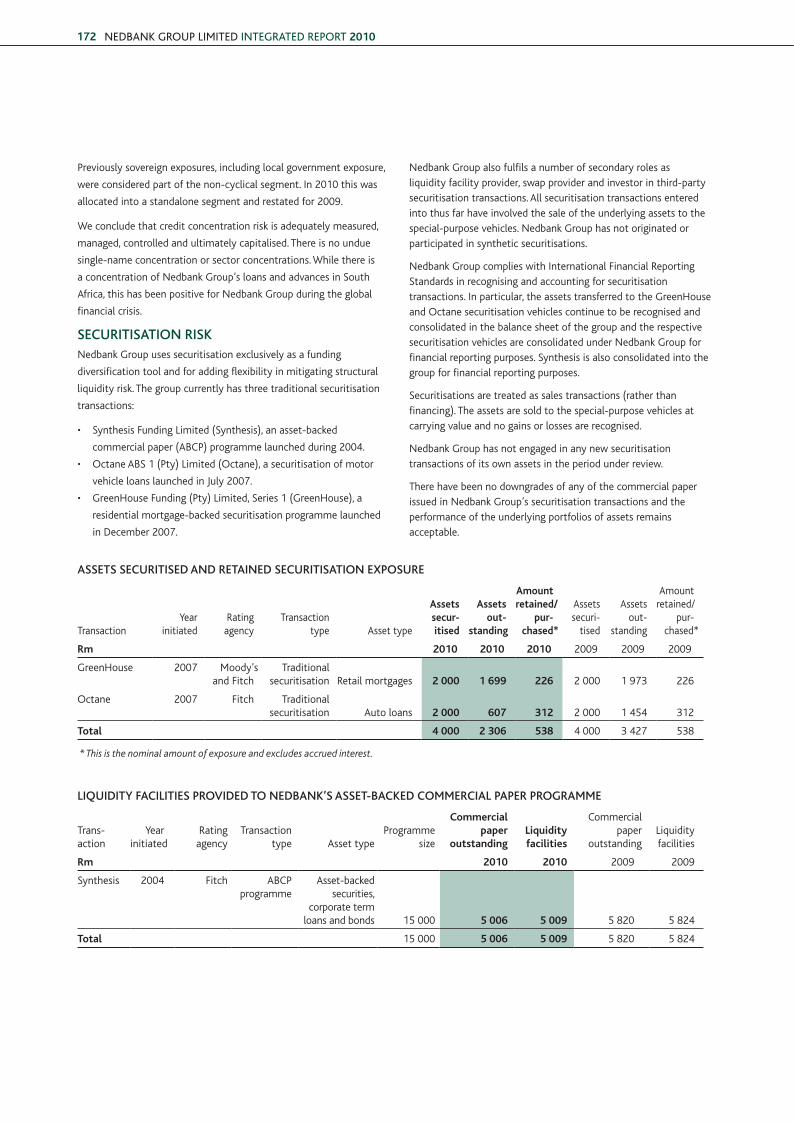
NEDBANK GROUP LimitED iNtEGRAtED REPORt 2010172
Previously sovereign exposures, including local government exposure,
were considered part of the non-cyclical segment. In 2010 this was
allocated into a standalone segment and restated for 2009.
we conclude that credit concentration risk is adequately measured,
managed, controlled and ultimately capitalised. There is no undue
single-name concentration or sector concentrations. while there is
a concentration of Nedbank Group’s loans and advances in south
Africa, this has been positive for Nedbank Group during the global
financial crisis.
SECurItISAtION rISkNedbank Group uses securitisation exclusively as a funding
diversification tool and for adding flexibility in mitigating structural
liquidity risk. The group currently has three traditional securitisation
transactions:
• synthesis Funding limited (synthesis), an asset-backed
commercial paper (ABCP) programme launched during 2004.
• octane ABs 1 (Pty) limited (octane), a securitisation of motor
vehicle loans launched in July 2007.
• Greenhouse Funding (Pty) limited, series 1 (Greenhouse), a
residential mortgage-backed securitisation programme launched
in december 2007.
Nedbank Group also fulfils a number of secondary roles as liquidity facility provider, swap provider and investor in third-party securitisation transactions. All securitisation transactions entered into thus far have involved the sale of the underlying assets to the special-purpose vehicles. Nedbank Group has not originated or participated in synthetic securitisations.
Nedbank Group complies with International Financial Reporting standards in recognising and accounting for securitisation transactions. In particular, the assets transferred to the Greenhouse and octane securitisation vehicles continue to be recognised and consolidated in the balance sheet of the group and the respective securitisation vehicles are consolidated under Nedbank Group for financial reporting purposes. synthesis is also consolidated into the group for financial reporting purposes.
securitisations are treated as sales transactions (rather than financing). The assets are sold to the special-purpose vehicles at carrying value and no gains or losses are recognised.
Nedbank Group has not engaged in any new securitisation transactions of its own assets in the period under review.
There have been no downgrades of any of the commercial paper issued in Nedbank Group’s securitisation transactions and the performance of the underlying portfolios of assets remains acceptable.
ASSEtS SECurItISED AND rEtAINED SECurItISAtION EXPOSurE
Transactionyear
initiatedRating agency
Transactiontype Asset type
assets secur-itised
assets out-
standing
amountretained/
pur-chased*
Assets securi-
tised
Assets out-
standing
Amountretained/
pur-chased*
rm 2010 2010 2010 2009 2009 2009
Greenhouse 2007 Moody’sand Fitch
Traditionalsecuritisation Retail mortgages 2 000 1 699 226 2 000 1 973 226
octane 2007 Fitch Traditionalsecuritisation Auto loans 2 000 607 312 2 000 1 454 312
Total 4 000 2 306 538 4 000 3 427 538
* This is the nominal amount of exposure and excludes accrued interest.
lIQuIDItY fACIlItIES PrOVIDED tO NEDbANk’S ASSEt-bACkED COMMErCIAl PAPEr PrOGrAMME
Trans-action
year initiated
Ratingagency
Transactiontype Asset type
Programme size
commercialpaper
outstandingliquidityfacilities
Commercialpaper
outstandingliquidityfacilities
rm 2010 2010 2009 2009
synthesis 2004 Fitch ABCPprogramme
Asset-backedsecurities,
corporate termloans and bonds 15 000 5 006 5 009 5 820 5 824
Total 15 000 5 006 5 009 5 820 5 824
6 Nedbank Risk FA.indd 172 22/03/2011 12:07 PM
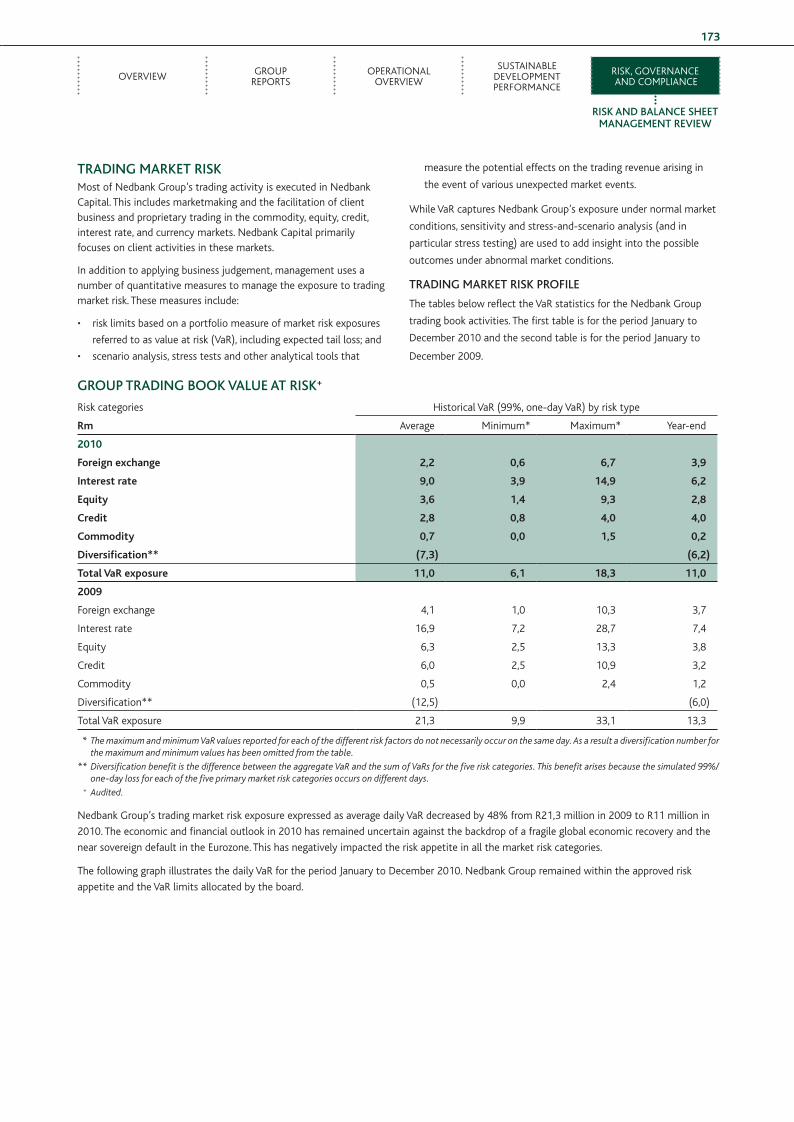
ovERvIEw GRouP REPoRTs
oPERATIoNAl ovERvIEw
susTAINABlE dEvEloPMENT PERFoRMANCE
RIsk, GovERNANCE ANd CoMPlIANCE
rISk AND bAlANCE SHEEt MANAGEMENt rEVIEw
173
trADING MArkEt rISkMost of Nedbank Group’s trading activity is executed in Nedbank Capital. This includes marketmaking and the facilitation of client business and proprietary trading in the commodity, equity, credit, interest rate, and currency markets. Nedbank Capital primarily focuses on client activities in these markets.
In addition to applying business judgement, management uses a number of quantitative measures to manage the exposure to trading market risk. These measures include:
• risk limits based on a portfolio measure of market risk exposures
referred to as value at risk (vaR), including expected tail loss; and
• scenario analysis, stress tests and other analytical tools that
measure the potential effects on the trading revenue arising in
the event of various unexpected market events.
while vaR captures Nedbank Group’s exposure under normal market
conditions, sensitivity and stress-and-scenario analysis (and in
particular stress testing) are used to add insight into the possible
outcomes under abnormal market conditions.
trADING MArkEt rISk PrOfIlE
The tables below reflect the vaR statistics for the Nedbank Group
trading book activities. The first table is for the period January to
december 2010 and the second table is for the period January to
december 2009.
GrOuP trADING bOOk VAluE At rISk+
Risk categories historical vaR (99%, one-day vaR) by risk type
rm Average Minimum* Maximum* year-end
2010
Foreign exchange 2,2 0,6 6,7 3,9
interest rate 9,0 3,9 14,9 6,2
equity 3,6 1,4 9,3 2,8
credit 2,8 0,8 4,0 4,0
commodity 0,7 0,0 1,5 0,2
diversification** (7,3) (6,2)
Total Var exposure 11,0 6,1 18,3 11,0
2009
Foreign exchange 4,1 1,0 10,3 3,7
Interest rate 16,9 7,2 28,7 7,4
Equity 6,3 2,5 13,3 3,8
Credit 6,0 2,5 10,9 3,2
Commodity 0,5 0,0 2,4 1,2
diversification** (12,5) (6,0)
Total vaR exposure 21,3 9,9 33,1 13,3
* The maximum and minimum VaR values reported for each of the different risk factors do not necessarily occur on the same day. As a result a diversification number for the maximum and minimum values has been omitted from the table.
** Diversification benefit is the difference between the aggregate VaR and the sum of VaRs for the five risk categories. This benefit arises because the simulated 99%/one-day loss for each of the five primary market risk categories occurs on different days.
+ Audited.
Nedbank Group’s trading market risk exposure expressed as average daily vaR decreased by 48% from R21,3 million in 2009 to R11 million in
2010. The economic and financial outlook in 2010 has remained uncertain against the backdrop of a fragile global economic recovery and the
near sovereign default in the Eurozone. This has negatively impacted the risk appetite in all the market risk categories.
The following graph illustrates the daily vaR for the period January to december 2010. Nedbank Group remained within the approved risk
appetite and the vaR limits allocated by the board.
6 Nedbank Risk FA.indd 173 22/03/2011 12:07 PM
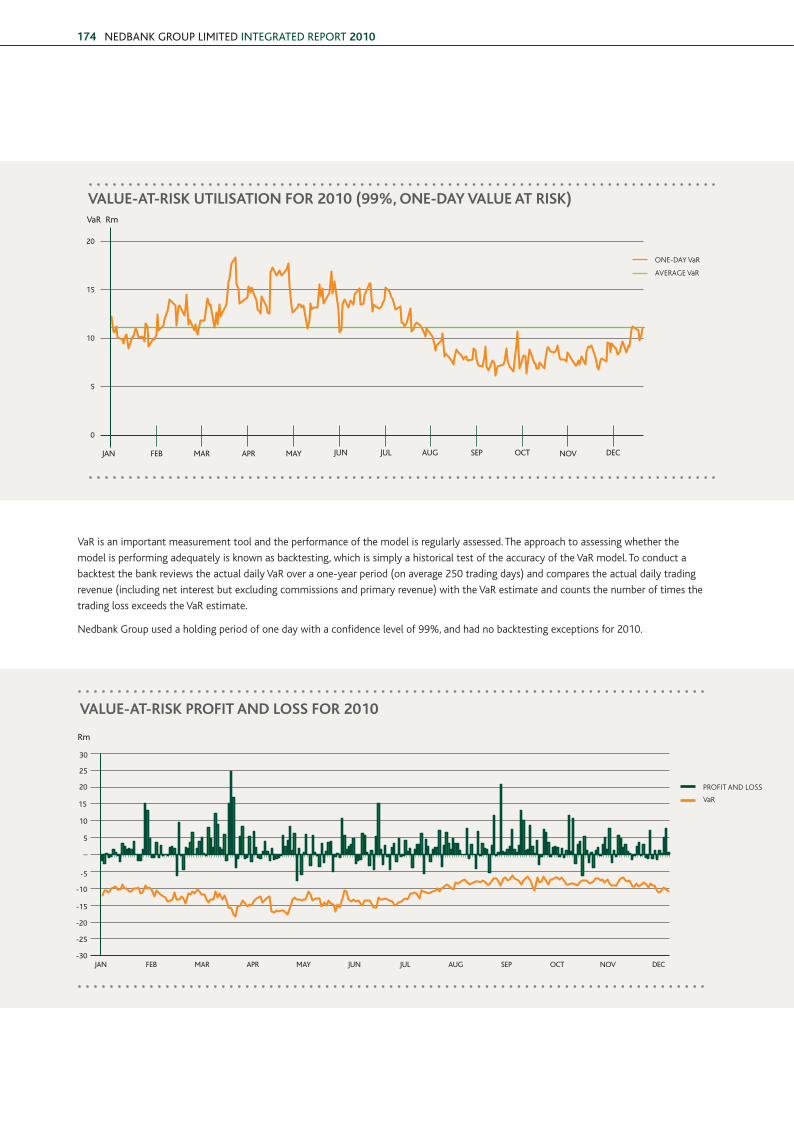
NEDBANK GROUP LimitED iNtEGRAtED REPORt 2010174
VAluE-At- rISk utIlISAtION fOr 2010(99%, one-day Var)
vaR is an important measurement tool and the performance of the model is regularly assessed. The approach to assessing whether the
model is performing adequately is known as backtesting, which is simply a historical test of the accuracy of the vaR model. To conduct a
backtest the bank reviews the actual daily vaR over a one-year period (on average 250 trading days) and compares the actual daily trading
revenue (including net interest but excluding commissions and primary revenue) with the vaR estimate and counts the number of times the
trading loss exceeds the vaR estimate.
Nedbank Group used a holding period of one day with a confidence level of 99%, and had no backtesting exceptions for 2010.
Value-aT-riSk uTiliSaTiOn FOr 2010 (99%, One-day Value aT riSk)
20
15
10
5
0
VaR Rm
JAN FEB mAR APR mAY JUN JUL AUG sEP OCt NOV DEC
oNE-dAy vaR
AvERAGE vaR
Value-aT-riSk PrOFiT and lOSS FOr 2010
Rm
mAR APR mAYJAN FEB JUN AUGJUL sEP OCt NOV DEC
25
20
30
15
10
5
–
-5
-10
-15
-20
-30
-25
PRoFIT ANd loss
vaR
6 Nedbank Risk FA.indd 174 22/03/2011 12:07 PM
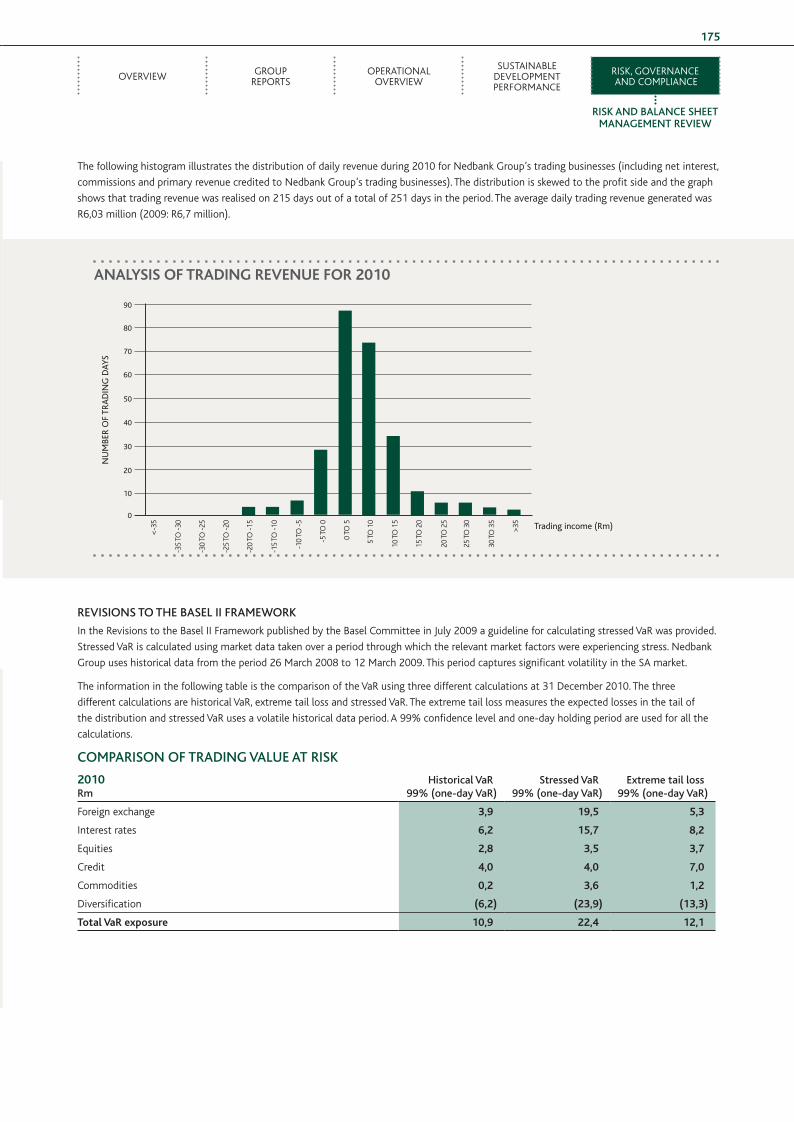
ovERvIEw GRouP REPoRTs
oPERATIoNAl ovERvIEw
susTAINABlE dEvEloPMENT PERFoRMANCE
RIsk, GovERNANCE ANd CoMPlIANCE
rISk AND bAlANCE SHEEt MANAGEMENt rEVIEw
175
The following histogram illustrates the distribution of daily revenue during 2010 for Nedbank Group’s trading businesses (including net interest,
commissions and primary revenue credited to Nedbank Group’s trading businesses). The distribution is skewed to the profit side and the graph
shows that trading revenue was realised on 215 days out of a total of 251 days in the period. The average daily trading revenue generated was
R6,03 million (2009: R6,7 million).
ANAlYSIS Of trADING rEVENuE fOr 2010
rEVISIONS tO tHE bASEl II frAMEwOrk
In the Revisions to the Basel II Framework published by the Basel Committee in July 2009 a guideline for calculating stressed vaR was provided.
stressed vaR is calculated using market data taken over a period through which the relevant market factors were experiencing stress. Nedbank
Group uses historical data from the period 26 March 2008 to 12 March 2009. This period captures significant volatility in the sA market.
The information in the following table is the comparison of the vaR using three different calculations at 31 december 2010. The three
different calculations are historical vaR, extreme tail loss and stressed vaR. The extreme tail loss measures the expected losses in the tail of
the distribution and stressed vaR uses a volatile historical data period. A 99% confidence level and one-day holding period are used for all the
calculations.
COMPArISON Of trADING VAluE At rISk
2010rm
Historical Var99% (one-day Var)
Stressed Var99% (one-day Var)
Extreme tail loss99% (one-day Var)
Foreign exchange 3,9 19,5 5,3
Interest rates 6,2 15,7 8,2
Equities 2,8 3,5 3,7
Credit 4,0 4,0 7,0
Commodities 0,2 3,6 1,2
diversification (6,2) (23,9) (13,3)
Total Var exposure 10,9 22,4 12,1
analySiS OF TradinG reVenue FOr 2010
NU
mBE
R O
F tR
AD
iNG
DAY
s
trading income (Rm)
<-3
5
-35
To -
30
-30
To -
25
-25
To -
20
-20
To -
15
-15
To -
10
-10
To -
5
-5 T
o 0
0 To
5
5 To
10
10 T
o 1
5
15 T
o 2
0
20 T
o 2
5
25 T
o 3
0
30 T
o 3
5
>35
40
50
60
70
80
90
30
20
0
10
6 Nedbank Risk FA.indd 175 22/03/2011 12:07 PM
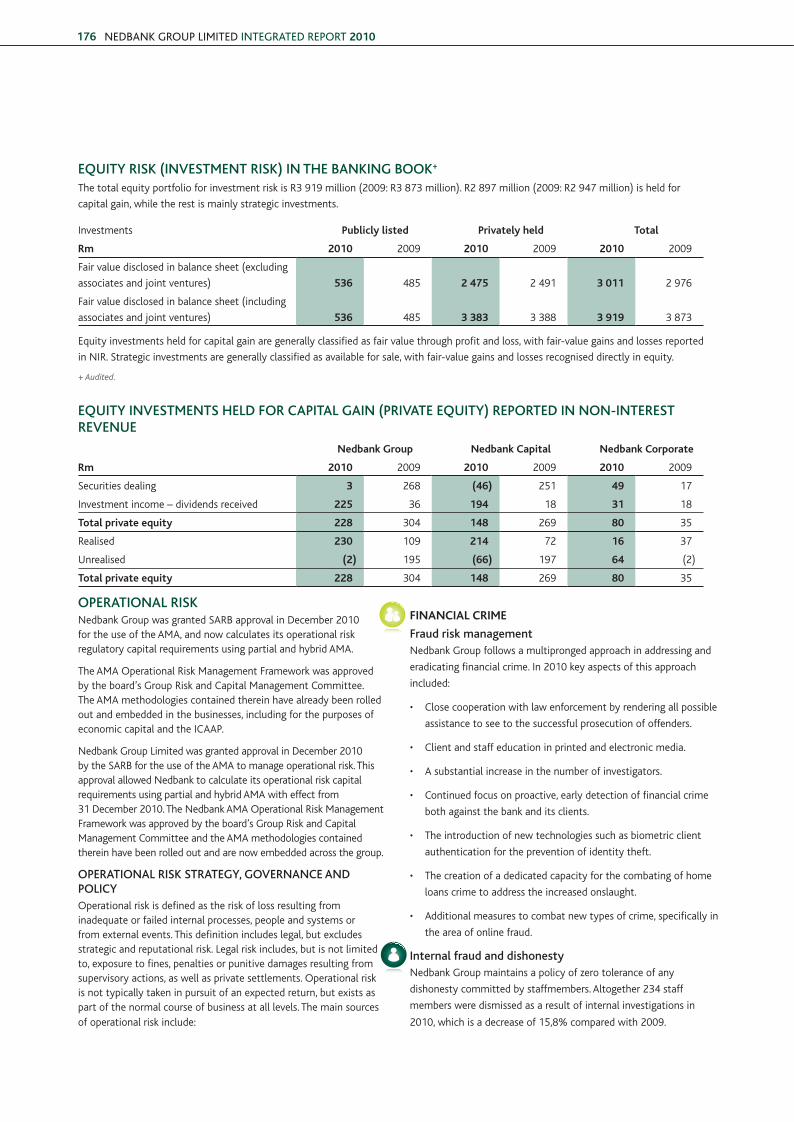
NEDBANK GROUP LimitED iNtEGRAtED REPORt 2010176
EQuItY rISk (INVEStMENt rISk) IN tHE bANkING bOOk+
The total equity portfolio for investment risk is R3 919 million (2009: R3 873 million). R2 897 million (2009: R2 947 million) is held for
capital gain, while the rest is mainly strategic investments.
Investments Publicly listed Privately held Total
rm 2010 2009 2010 2009 2010 2009
Fair value disclosed in balance sheet (excluding
associates and joint ventures) 536 485 2 475 2 491 3 011 2 976
Fair value disclosed in balance sheet (including
associates and joint ventures) 536 485 3 383 3 388 3 919 3 873
Equity investments held for capital gain are generally classified as fair value through profit and loss, with fair-value gains and losses reported
in NIR. strategic investments are generally classified as available for sale, with fair-value gains and losses recognised directly in equity.
+ Audited.
EQuItY INVEStMENtS HElD fOr CAPItAl GAIN (PrIVAtE EQuItY) rEPOrtED IN NON-INtErESt rEVENuE
nedbank Group nedbank capital nedbank corporate
rm 2010 2009 2010 2009 2010 2009
securities dealing 3 268 (46) 251 49 17
Investment income – dividends received 225 36 194 18 31 18
Total private equity 228 304 148 269 80 35
Realised 230 109 214 72 16 37
unrealised (2) 195 (66) 197 64 (2)
Total private equity 228 304 148 269 80 35
OPErAtIONAl rISkNedbank Group was granted sARB approval in december 2010 for the use of the AMA, and now calculates its operational risk regulatory capital requirements using partial and hybrid AMA.
The AMA operational Risk Management Framework was approved by the board’s Group Risk and Capital Management Committee. The AMA methodologies contained therein have already been rolled out and embedded in the businesses, including for the purposes of economic capital and the ICAAP.
Nedbank Group limited was granted approval in december 2010 by the sARB for the use of the AMA to manage operational risk. This approval allowed Nedbank to calculate its operational risk capital requirements using partial and hybrid AMA with effect from 31 december 2010. The Nedbank AMA operational Risk Management Framework was approved by the board’s Group Risk and Capital Management Committee and the AMA methodologies contained therein have been rolled out and are now embedded across the group.
OPErAtIONAl rISk StrAtEGY, GOVErNANCE AND POlICYoperational risk is defined as the risk of loss resulting from inadequate or failed internal processes, people and systems or from external events. This definition includes legal, but excludes strategic and reputational risk. legal risk includes, but is not limited to, exposure to fines, penalties or punitive damages resulting from supervisory actions, as well as private settlements. operational risk is not typically taken in pursuit of an expected return, but exists as part of the normal course of business at all levels. The main sources of operational risk include:
Financial criMe
fraud risk managementNedbank Group follows a multipronged approach in addressing and
eradicating financial crime. In 2010 key aspects of this approach
included:
• Close cooperation with law enforcement by rendering all possible
assistance to see to the successful prosecution of offenders.
• Client and staff education in printed and electronic media.
• A substantial increase in the number of investigators.
• Continued focus on proactive, early detection of financial crime
both against the bank and its clients.
• The introduction of new technologies such as biometric client
authentication for the prevention of identity theft.
• The creation of a dedicated capacity for the combating of home
loans crime to address the increased onslaught.
• Additional measures to combat new types of crime, specifically in
the area of online fraud.
Internal fraud and dishonestyNedbank Group maintains a policy of zero tolerance of any
dishonesty committed by staffmembers. Altogether 234 staff
members were dismissed as a result of internal investigations in
2010, which is a decrease of 15,8% compared with 2009.
6 Nedbank Risk FA.indd 176 22/03/2011 12:07 PM
ovERvIEw GRouP REPoRTs
oPERATIoNAl ovERvIEw
susTAINABlE dEvEloPMENT PERFoRMANCE
RIsk, GovERNANCE ANd CoMPlIANCE
rISk AND bAlANCE SHEEt MANAGEMENt rEVIEw
177
Assessment of fraud riskThe risk of internal and external fraud is evaluated on several levels:
• Risk control self-assessments are conducted on an ongoing basis to ensure that the appropriate controls are in place and monitored effectively. where controls are lacking, action plans are formulated and implemented to ensure that the risk of fraud is within the accepted risk appetite of the group.
• Fraud key risk and control indicators have been developed and are monitored, tracked and reported on in accordance with the operational Risk Management Framework (oRMF).
• Facilitated fraud risk assessments are undertaken as outlined in the International standards for Auditing 240 (IsA 240).
• New products and all processes related to their use are evaluated to ensure that all aspects of fraud risk, legal risk and regulatory risk (such as the anti-money-laundering requirements) are considered.
Due-diligence investigationsdue-diligence investigations are performed at the outset of any business relationship with clients, partners, vendors, agents/intermediaries and joint ventures. In addition, an ongoing assessment of the commercial, political, social and security environment where business is undertaken or likely to be undertaken is done. social, economic and governmental changes in a country can create an environment that reduces security and increases the risk to the group’s assets: staff, premises and information and, consequently, its ability to continue to do business.
Internal and external whistleblowing reporting linessecurity and fraud incidents can be reported, around the clock, through an internal reporting line, which is supported by an external, independently managed whistleblowing hotline, available to staff and clients. The facility also extends to Nedbank Africa subsidiaries in Namibia, swaziland, lesotho, Malawi and Zimbabwe. An ethics panel has been established for the appropriate handling of reports of a sensitive or serious nature.
In 2010 1 497 anonymous tipoffs were received (2009: 1 114).
Online fraudduring 2010 the group undertook various initiatives to protect its clients from online fraud, including participation in a concerted media campaign with the rest of the banking sector to educate consumers about online safety. Free software to all internet banking clients to protect them from phishing attacks was provided by Nedbank and a sophisticated phishing response infrastructure was created, which led to the successful prevention of 89,6% of all phishing losses.
Cybercrime riskNedbank Group has taken note of the current and expected impact of cybercrime on the banking industry and its clients and has established an extensive internal digital forensic capability to deal with this risk effectively. The group also provides training and awareness in digital forensics at tertiary institutions and to the law enforcement community in south Africa.
Security riskIn 2010 a concerted focus on staff and client safety saw a 90% decrease in robbery incidents against 2009 figures. Robberies and burglaries remain a threat and these are mitigated, managed and monitored by highly sophisticated technology in a joint operations
centre. Biometric doors at branch entrances, automated roller shutter doors, a well-implemented cash management system and improved response to incidents are critical in the management of security risk. A guard tracking device, digital video recorder live camera streaming and a security analysis management system are all scheduled for implementation in 2011.
Relations with the south African Police services (sAPs) and National prosecuting authority were strengthened for the banking sector under the facilitation of south African Business Intelligence Centre.
Cooperation with the criminal justice systemIn addition to the day-to-day cooperation with law enforcement in the fight against crime, in 2010 Nedbank Group reported 522 suspicions of corruption and/or fraud in excess of R100 000 to the sAPs in terms of section 34 of the Prevention and Combating of Corrupt Activity Act. The group was also able to assist the sAPs in its investigations by responding to 3 163 subpoenas.
Nedbank Group considers financial crime to be a major operational risk that leads to significant losses, and it is for this reason that the group pursues a vigorous policy of mitigating the risk through active risk management.
legal risklegal risk arises from the necessity that the group conduct its activities in conformity with the business and contractual legal principles applicable in each of the jurisdictions where the group conducts its business. The possibility of a failure to meet these legal requirements may result in unenforceable contract disputes, litigation, fines, penalties or claims for damages or other adverse consequences.
COMPlIANCE AND rEGulAtOrY rISkCompliance and Regulatory risk is the risk of legal or regulatory sanctions, material financial loss, or loss to reputation that the group may suffer as a result of its failure to comply with laws, regulations, rules, related self-regulatory organisation standards, and codes of conduct applicable to its banking and other activities.
Compliance and regulatory risk has become increasingly significant and there continues to be considerable demand for the group to comply with various new and amended regulatory requirements. however, the group remains committed to the highest regulatory and compliance standards, especially due to the increasing scale and complexity of laws and regulations.
The Enterprise Governance and Compliance function that forms part of the second line of defence risk management model assists the Group in managing compliance and regulatory risk. The objective of compliance and regulatory risk management is to ensure that legal and regulatory requirements to which the business is or will be subject to are identified and complied with.
Further details regarding the Enterprise Governance and Compliance function are contained on page 196.
MONEY lAuNDErING, tErrOrISt fINANCING AND SANCtIONS rISk MANAGEMENt Nedbank Group does not associate, in any way, with money-laundering activities or terrorist financing. Clearly defined policies and procedures ensure compliance with all statutory requirements and regulatory obligations or, in the absence of these, that agreed standards are met. The group takes a proactive approach by
6 Nedbank Risk FA.indd 177 22/03/2011 12:07 PM
NEDBANK GROUP LimitED iNtEGRAtED REPORt 2010178
endeavouring to identify any business relationships or applications for business relationships or transactions with individuals, entities and countries targeted in financial sanctions legislation.
The Business Risk Management Forum (BRMF), a Group Executive subcommittee, chaired by the Chief Risk officer, is mandated to provide strategic direction for, and monitor the effective implementation of, anti-money-laundering (AMl), combating the financing of terrorists (CFT) and sanctions compliance initiatives throughout the group. The Executive steering Committee of the Money laundering Control Programme, a subcommittee of the BRMF, ensures the internationalisation and operational implementation of AMl, CFT and sanctions compliance.
Nedbank Group Risk maintains a close and transparent working relationship with the Financial Intelligence Centre (FIC), attends bimonthly meetings with the FIC, regular meetings with the sARB and JsE limited and the Financial services Board to ensure compliance with their requirements and obtain clarification, where necessary.
At 31 december 2010 a total of 4 387 503 client records were reflected on Nedbank Group’s Client Information system as having been verified. of the 123 090 non-verified client records 105 946 have been restricted, with 17 144 records currently being restricted. The number of non-verified, not yet restricted records equates to 0,31% of the total number of records, which compares well with the BRMF-approved risk threshold of 0,5%.
Training for AMl and CFT remains a high priority. For the 24 months to 31 december 2010 a total of 21 255 of the selected 29 699 employees completed the awareness training for AMl and CFT.
Nedbank Group’s e-learning training intervention for CFT and related activities, which was first implemented in 2009, was recognised by the FIC as ‘innovative and a first of its kind in south Africa’.
Annual directors’ training programmes for money-laundering, terrorist financing and sanctions risk management were developed in 2010 and presented to the Group Risk and Capital Management Committee on 19 october 2010 in compliance with sARB, FIC and international requirements.
INfOrMAtION AND tECHNOlOGY rISkTechnology risk stems from risks associated with misalignment with business strategy, uncoordinated or an inefficient information technology (IT) strategy, project failure to deliver desired change, data protection, information privacy, effects of physical disasters on information systems, IT outsourcing, IT performance and information systems governance. The Group Technology Cluster manages information and technology risk through the Technology Management Policy.
In addition to the abovementioned existing regulations, Nedbank is providing input into energy, water and climate-change-related regulatory developments, including the Integrated Resource Plan 2010; the National Climate Change Response Green Paper 2010; Reducing Greenhouse Gas Emissions: The Carbon Tax option; the strategy for a developmental Green Economy for Gauteng; the Integrated Energy Plan for the Republic of south Africa; the long-term Mitigation scenarios – Technical Report and the Renewable-energy Feed-in Tariff – Phase I and II.
buSineSS cOnTinuiTy ManaGeMenTBusiness continuity management (BCM) aims at ensuring resilient group business activities emergencies and disasters. The BCM function provides overall guidance and direction, monitors compliance with regulatory and best-practice requirements and facilitates regular review of BCM practices.
PEOPlE rISkPeople risk is the risk associated with inadequacies in human capital and the management of human resources, policies and processes resulting in the inability to attract, manage, motivate, develop and retain competent resources, with concomitant negative impact on the achievement of strategic group objectives. The group vigorously manages people risk through Group human Resources at the central and business clusters.
To minimise the exposure to operational risk that arises as a consequence of the group’s financial risk-taking initiatives within credit, market and operating activities, Nedbank Group has implemented and embedded an oRMF, which contains AMA-compliant methodologies, policies and guidelines to facilitate a consistent and worldclass approach to operational risk management.
Personnel integrity managementNedbank Group minimises people risk by ensuring that controls are incorporated into the recruitment and selection processes of all employees, including contractors, temporary employees and consultants. This process aims to minimise the group’s vulnerability to fraud, embezzlement, theft, corruption and mismanagement of job responsibilities. It also cultivates a culture of business ethics and integrity in keeping with Nedbank Group’s values and endorses the Code of Good Banking Practice that states that ‘Banks will conduct their business with uncompromising integrity and fairness so as to promote complete trust and confidence in the banking industry’.
The Financial Advisory and Intermediary services Act, 37 of 2002, determines the ‘fit and proper’ requirements that are applicable to all financial service providers, key individuals, representatives and compliance officers. Nedbank ensures screening of these persons every 24 months to ensure the highest level of honesty and integrity. All new appointments of directors or executive directors, as required by the Banks Act, 94 of 1990, are screened to comply with the requirements of honesty and integrity. This also reduces the potential for conflicts of interest.
Business clusters act as the first line of defence and are responsible for the identification, management, monitoring and reporting of operational risk. operational risk is reported and monitored through the divisional and cluster enterprisewide risk committees and overseen by the Group operational Risk Committee (GoRC) and the board’s Group Risk and Capital Management Committee. The Group operational Risk Management (GoRM) division, within the Group Risk Cluster, acts as the second line of defence in the Nedbank enterprise risk management framework.
The primary responsibilities of GoRM are to develop, maintain and champion the Group operational Risk Management Framework, policies and enablers to support oRM in the business as well as the implementation of the Basel II and regulatory requirements and international best practice for oRM.
6 Nedbank Risk FA.indd 178 22/03/2011 12:07 PM
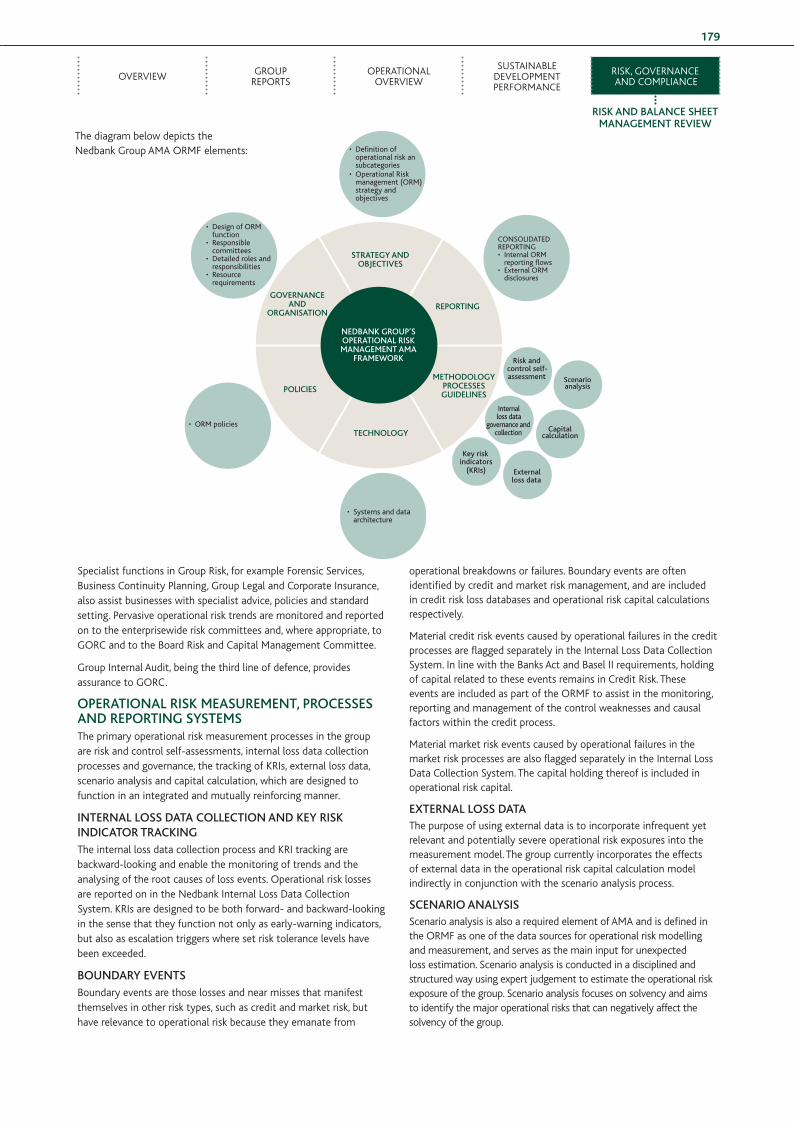
ovERvIEw GRouP REPoRTs
oPERATIoNAl ovERvIEw
susTAINABlE dEvEloPMENT PERFoRMANCE
RIsk, GovERNANCE ANd CoMPlIANCE
rISk AND bAlANCE SHEEt MANAGEMENt rEVIEw
179
specialist functions in Group Risk, for example Forensic services, Business Continuity Planning, Group legal and Corporate Insurance, also assist businesses with specialist advice, policies and standard setting. Pervasive operational risk trends are monitored and reported on to the enterprisewide risk committees and, where appropriate, to GoRC and to the Board Risk and Capital Management Committee.
Group Internal Audit, being the third line of defence, provides assurance to GoRC.
OPErAtIONAl rISk MEASurEMENt, PrOCESSES AND rEPOrtING SYStEMS The primary operational risk measurement processes in the group are risk and control self-assessments, internal loss data collection processes and governance, the tracking of kRIs, external loss data, scenario analysis and capital calculation, which are designed to function in an integrated and mutually reinforcing manner.
INtErNAl lOSS DAtA COllECtION AND kEY rISk INDICAtOr trACkING The internal loss data collection process and kRI tracking are backward-looking and enable the monitoring of trends and the analysing of the root causes of loss events. operational risk losses are reported on in the Nedbank Internal loss data Collection system. kRIs are designed to be both forward- and backward-looking in the sense that they function not only as early-warning indicators, but also as escalation triggers where set risk tolerance levels have been exceeded.
bOuNDArY EVENtSBoundary events are those losses and near misses that manifest themselves in other risk types, such as credit and market risk, but have relevance to operational risk because they emanate from
operational breakdowns or failures. Boundary events are often identified by credit and market risk management, and are included in credit risk loss databases and operational risk capital calculations respectively.
Material credit risk events caused by operational failures in the credit processes are flagged separately in the Internal loss data Collection system. In line with the Banks Act and Basel II requirements, holding of capital related to these events remains in Credit Risk. These events are included as part of the oRMF to assist in the monitoring, reporting and management of the control weaknesses and causal factors within the credit process.
Material market risk events caused by operational failures in the market risk processes are also flagged separately in the Internal loss data Collection system. The capital holding thereof is included in operational risk capital.
EXtErNAl lOSS DAtA The purpose of using external data is to incorporate infrequent yet relevant and potentially severe operational risk exposures into the measurement model. The group currently incorporates the effects of external data in the operational risk capital calculation model indirectly in conjunction with the scenario analysis process.
SCENArIO ANAlYSIS scenario analysis is also a required element of AMA and is defined in the oRMF as one of the data sources for operational risk modelling and measurement, and serves as the main input for unexpected loss estimation. scenario analysis is conducted in a disciplined and structured way using expert judgement to estimate the operational risk exposure of the group. scenario analysis focuses on solvency and aims to identify the major operational risks that can negatively affect the solvency of the group.
GOVErNANCE AND
OrGANISAtION
POlICIES
tECHNOlOGY
MEtHODOlOGY PrOCESSES GuIDElINES
rEPOrtING
StrAtEGY AND ObjECtIVES
NEDbANk GrOuP’S OPErAtIONAl rISk MANAGEMENt AMA
frAMEwOrk risk and control self-assessment Scenario
analysis
Internal loss data
governance and collection Capital
calculation
key risk indicators
(krIs) External loss data
• Definition of operational risk an subcategories
• Operational Risk management (ORm) strategy and objectives
• Design of ORm function
• Responsible committees
• Detailed roles and responsibilities
• Resource requirements
• ORm policies
• systems and data architecture
CONsOLiDAtED REPORtiNG• internal ORm
reporting flows• External ORm
disclosures
The diagram below depicts the Nedbank Group AMA oRMF elements:
6 Nedbank Risk FA.indd 179 22/03/2011 12:07 PM
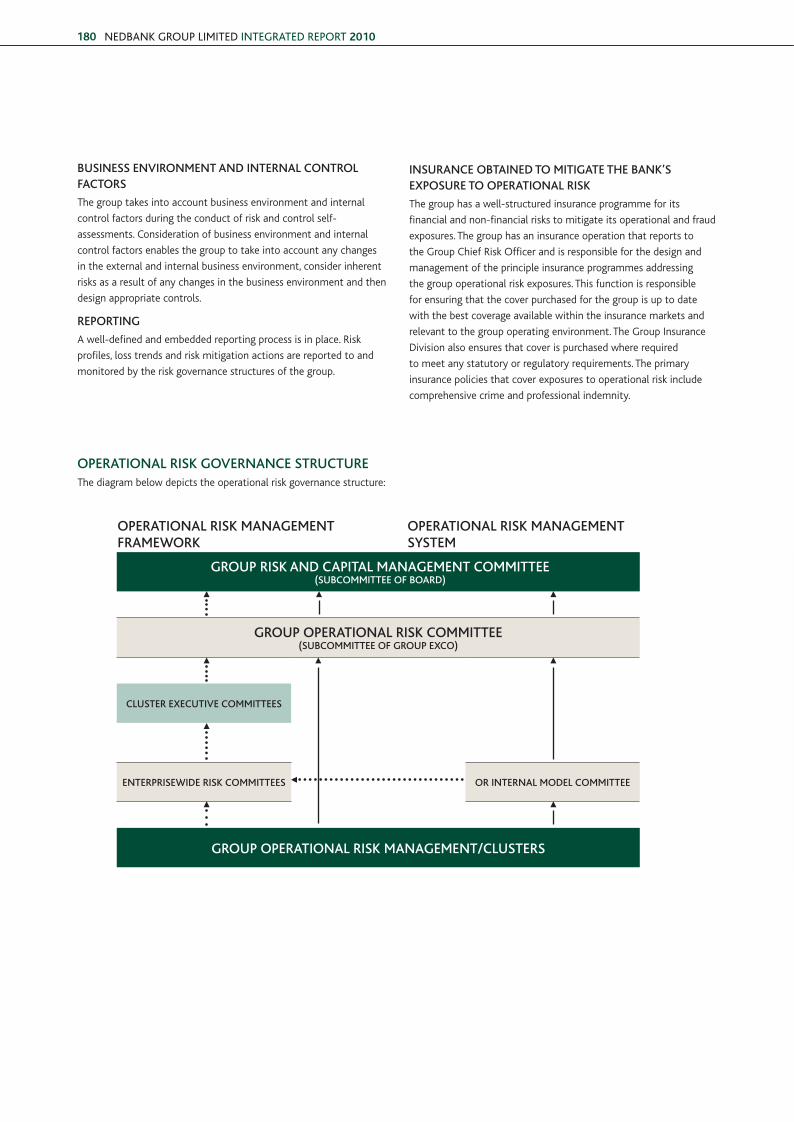
NEDBANK GROUP LimitED iNtEGRAtED REPORt 2010180
buSINESS ENVIrONMENt AND INtErNAl CONtrOl fACtOrS
The group takes into account business environment and internal
control factors during the conduct of risk and control self-
assessments. Consideration of business environment and internal
control factors enables the group to take into account any changes
in the external and internal business environment, consider inherent
risks as a result of any changes in the business environment and then
design appropriate controls.
rEPOrtING
A well-defined and embedded reporting process is in place. Risk
profiles, loss trends and risk mitigation actions are reported to and
monitored by the risk governance structures of the group.
INSurANCE ObtAINED tO MItIGAtE tHE bANk’S EXPOSurE tO OPErAtIONAl rISk
The group has a well-structured insurance programme for its
financial and non-financial risks to mitigate its operational and fraud
exposures. The group has an insurance operation that reports to
the Group Chief Risk officer and is responsible for the design and
management of the principle insurance programmes addressing
the group operational risk exposures. This function is responsible
for ensuring that the cover purchased for the group is up to date
with the best coverage available within the insurance markets and
relevant to the group operating environment. The Group Insurance
division also ensures that cover is purchased where required
to meet any statutory or regulatory requirements. The primary
insurance policies that cover exposures to operational risk include
comprehensive crime and professional indemnity.
OPErAtIONAl rISk MANAGEMENt frAMEwOrk
OPErAtIONAl rISk MANAGEMENt SYStEM
GrOuP rISk AND CAPItAl MANAGEMENt COMMIttEE (SubCOMMIttEE Of bOArD)
GrOuP OPErAtIONAl rISk COMMIttEE (SubCOMMIttEE Of GrOuP EXCO)
CluStEr EXECutIVE COMMIttEES
ENtErPrISEwIDE rISk COMMIttEES Or INtErNAl MODEl COMMIttEE
GrOuP OPErAtIONAl rISk MANAGEMENt/CluStErS
OPErAtIONAl rISk GOVErNANCE StruCturEThe diagram below depicts the operational risk governance structure:
6 Nedbank Risk FA.indd 180 22/03/2011 12:07 PM
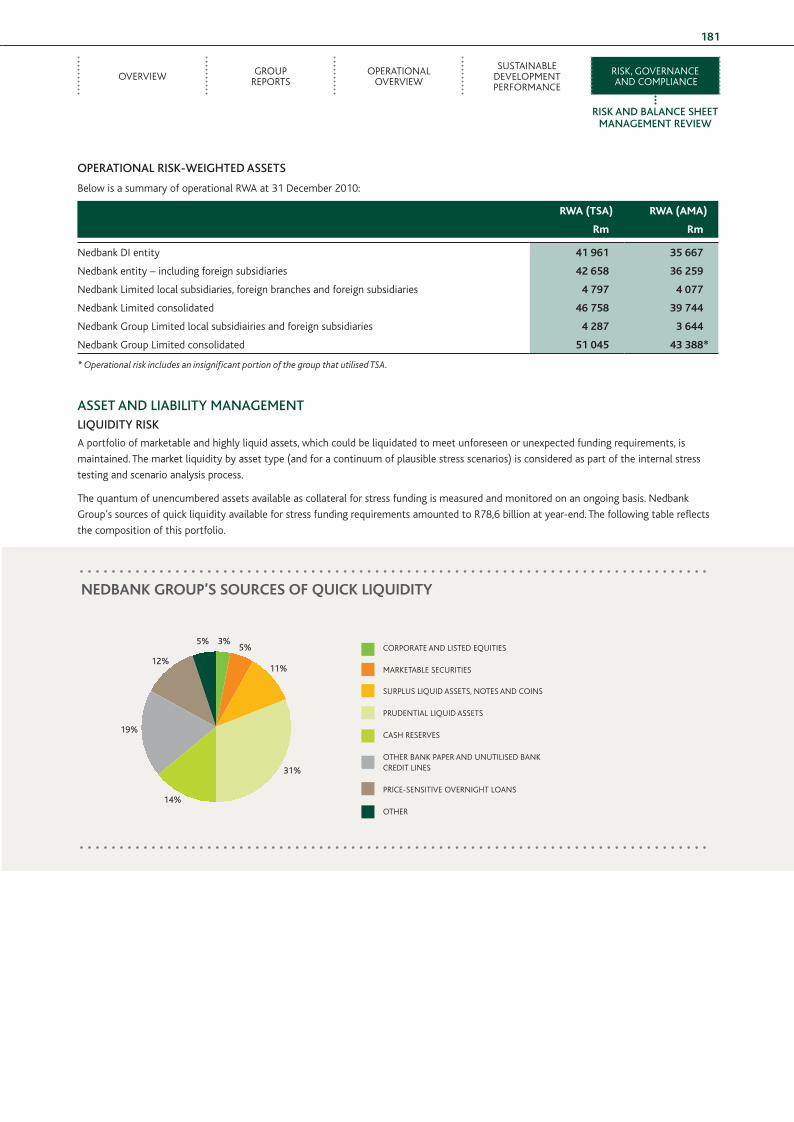
ovERvIEw GRouP REPoRTs
oPERATIoNAl ovERvIEw
susTAINABlE dEvEloPMENT PERFoRMANCE
RIsk, GovERNANCE ANd CoMPlIANCE
rISk AND bAlANCE SHEEt MANAGEMENt rEVIEw
181
OPErAtIONAl rISk-wEIGHtED ASSEtS
Below is a summary of operational RwA at 31 december 2010:
RWA (TSA) RWA (AMA)
Rm Rm
Nedbank dI entity 41 961 35 667
Nedbank entity – including foreign subsidiaries 42 658 36 259
Nedbank limited local subsidiaries, foreign branches and foreign subsidiaries 4 797 4 077
Nedbank limited consolidated 46 758 39 744
Nedbank Group limited local subsidiairies and foreign subsidiaries 4 287 3 644
Nedbank Group limited consolidated 51 045 43 388*
* Operational risk includes an insignificant portion of the group that utilised TSA.
ASSEt AND lIAbIlItY MANAGEMENtlIQuIDItY rISk
A portfolio of marketable and highly liquid assets, which could be liquidated to meet unforeseen or unexpected funding requirements, is
maintained. The market liquidity by asset type (and for a continuum of plausible stress scenarios) is considered as part of the internal stress
testing and scenario analysis process.
The quantum of unencumbered assets available as collateral for stress funding is measured and monitored on an ongoing basis. Nedbank
Group’s sources of quick liquidity available for stress funding requirements amounted to R78,6 billion at year-end. The following table reflects
the composition of this portfolio.
nedbank GrOuP’S SOurceS OF quick liquidiTy
CoRPoRATE ANd lIsTEd EQuITIEs
MARkETABlE sECuRITIEs suRPlus lIQuId AssETs, NoTEs ANd CoINs
PRudENTIAl lIQuId AssETs
CAsh REsERvEs
oThER BANk PAPER ANd uNuTIlIsEd BANk CREdIT lINEs
PRICE-sENsITIvE ovERNIGhT loANs
oThER
5%5%
11%
31%
14%
19%
12%
3%
6 Nedbank Risk FA.indd 181 22/03/2011 12:07 PM
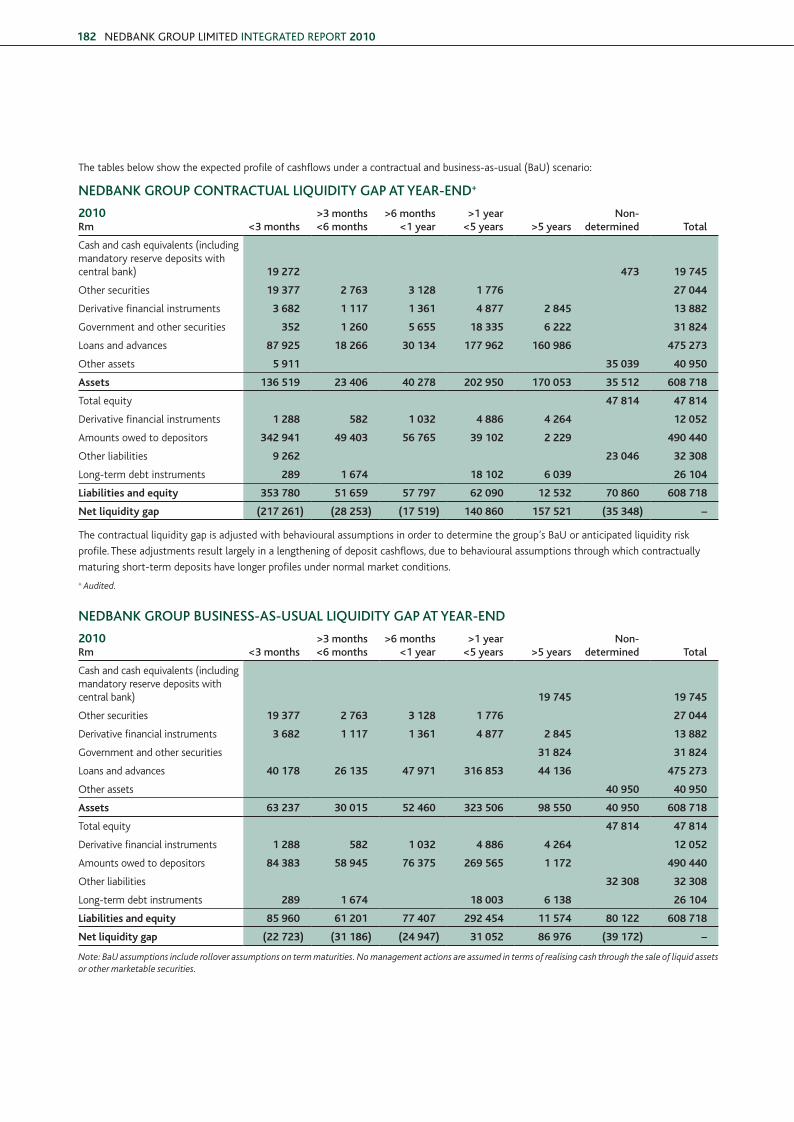
NEDBANK GROUP LimitED iNtEGRAtED REPORt 2010182
The tables below show the expected profile of cashflows under a contractual and business-as-usual (Bau) scenario:
NEDbANk GrOuP CONtrACtuAl lIQuIDItY GAP At YEAr-END+
2010rm <3 months
>3 months<6 months
>6 months<1 year
>1 year<5 years >5 years
Non-determined total
Cash and cash equivalents (including mandatory reserve deposits with central bank) 19 272 473 19 745
other securities 19 377 2 763 3 128 1 776 27 044
derivative financial instruments 3 682 1 117 1 361 4 877 2 845 13 882
Government and other securities 352 1 260 5 655 18 335 6 222 31 824
loans and advances 87 925 18 266 30 134 177 962 160 986 475 273
other assets 5 911 35 039 40 950
assets 136 519 23 406 40 278 202 950 170 053 35 512 608 718
Total equity 47 814 47 814
derivative financial instruments 1 288 582 1 032 4 886 4 264 12 052
Amounts owed to depositors 342 941 49 403 56 765 39 102 2 229 490 440
other liabilities 9 262 23 046 32 308
long-term debt instruments 289 1 674 18 102 6 039 26 104
liabilities and equity 353 780 51 659 57 797 62 090 12 532 70 860 608 718
net liquidity gap (217 261) (28 253) (17 519) 140 860 157 521 (35 348) –
The contractual liquidity gap is adjusted with behavioural assumptions in order to determine the group’s Bau or anticipated liquidity risk
profile. These adjustments result largely in a lengthening of deposit cashflows, due to behavioural assumptions through which contractually
maturing short-term deposits have longer profiles under normal market conditions.+ Audited.
NEDbANk GrOuP buSINESS-AS-uSuAl lIQuIDItY GAP At YEAr-END
2010rm <3 months
>3 months<6 months
>6 months<1 year
>1 year<5 years >5 years
Non-determined total
Cash and cash equivalents (including mandatory reserve deposits with central bank) 19 745 19 745
other securities 19 377 2 763 3 128 1 776 27 044
derivative financial instruments 3 682 1 117 1 361 4 877 2 845 13 882
Government and other securities 31 824 31 824
loans and advances 40 178 26 135 47 971 316 853 44 136 475 273
other assets 40 950 40 950
assets 63 237 30 015 52 460 323 506 98 550 40 950 608 718
Total equity 47 814 47 814
derivative financial instruments 1 288 582 1 032 4 886 4 264 12 052
Amounts owed to depositors 84 383 58 945 76 375 269 565 1 172 490 440
other liabilities 32 308 32 308
long-term debt instruments 289 1 674 18 003 6 138 26 104
liabilities and equity 85 960 61 201 77 407 292 454 11 574 80 122 608 718
net liquidity gap (22 723) (31 186) (24 947) 31 052 86 976 (39 172) –
Note: BaU assumptions include rollover assumptions on term maturities. No management actions are assumed in terms of realising cash through the sale of liquid assets or other marketable securities.
6 Nedbank Risk FA.indd 182 22/03/2011 12:07 PM
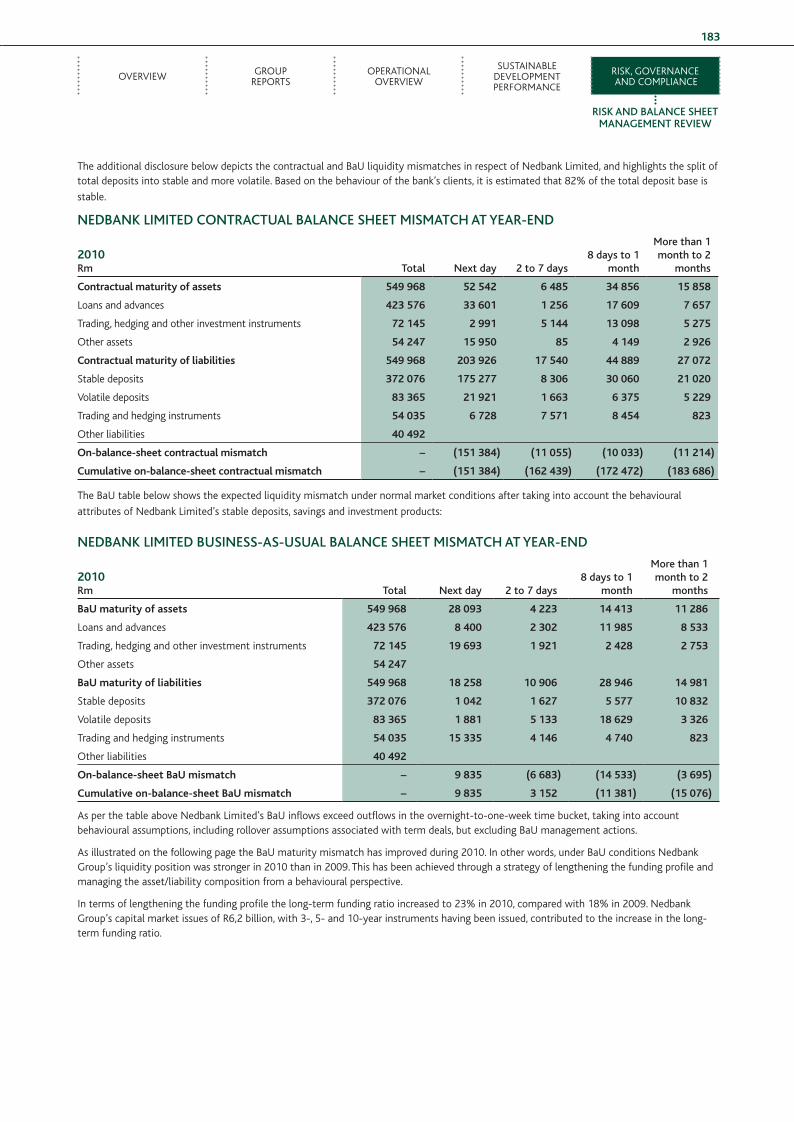
ovERvIEw GRouP REPoRTs
oPERATIoNAl ovERvIEw
susTAINABlE dEvEloPMENT PERFoRMANCE
RIsk, GovERNANCE ANd CoMPlIANCE
rISk AND bAlANCE SHEEt MANAGEMENt rEVIEw
183
The additional disclosure below depicts the contractual and Bau liquidity mismatches in respect of Nedbank limited, and highlights the split of total deposits into stable and more volatile. Based on the behaviour of the bank’s clients, it is estimated that 82% of the total deposit base is
stable.
NEDbANk lIMItED CONtrACtuAl bAlANCE SHEEt MISMAtCH At YEAr-END
2010 rm total Next day 2 to 7 days
8 days to 1month
More than 1month to 2
months
contractual maturity of assets 549 968 52 542 6 485 34 856 15 858
loans and advances 423 576 33 601 1 256 17 609 7 657
Trading, hedging and other investment instruments 72 145 2 991 5 144 13 098 5 275
other assets 54 247 15 950 85 4 149 2 926
contractual maturity of liabilities 549 968 203 926 17 540 44 889 27 072
stable deposits 372 076 175 277 8 306 30 060 21 020
volatile deposits 83 365 21 921 1 663 6 375 5 229
Trading and hedging instruments 54 035 6 728 7 571 8 454 823
other liabilities 40 492
On-balance-sheet contractual mismatch – (151 384) (11 055) (10 033) (11 214)
cumulative on-balance-sheet contractual mismatch – (151 384) (162 439) (172 472) (183 686)
The Bau table below shows the expected liquidity mismatch under normal market conditions after taking into account the behavioural
attributes of Nedbank limited’s stable deposits, savings and investment products:
NEDbANk lIMItED buSINESS-AS-uSuAl bAlANCE SHEEt MISMAtCH At YEAr-END
2010rm total Next day 2 to 7 days
8 days to 1month
More than 1month to 2
months
bau maturity of assets 549 968 28 093 4 223 14 413 11 286
loans and advances 423 576 8 400 2 302 11 985 8 533
Trading, hedging and other investment instruments 72 145 19 693 1 921 2 428 2 753
other assets 54 247
bau maturity of liabilities 549 968 18 258 10 906 28 946 14 981
stable deposits 372 076 1 042 1 627 5 577 10 832
volatile deposits 83 365 1 881 5 133 18 629 3 326
Trading and hedging instruments 54 035 15 335 4 146 4 740 823
other liabilities 40 492
On-balance-sheet bau mismatch – 9 835 (6 683) (14 533) (3 695)
cumulative on-balance-sheet bau mismatch – 9 835 3 152 (11 381) (15 076)
As per the table above Nedbank limited’s Bau inflows exceed outflows in the overnight-to-one-week time bucket, taking into account behavioural assumptions, including rollover assumptions associated with term deals, but excluding Bau management actions.
As illustrated on the following page the Bau maturity mismatch has improved during 2010. In other words, under Bau conditions Nedbank Group’s liquidity position was stronger in 2010 than in 2009. This has been achieved through a strategy of lengthening the funding profile and managing the asset/liability composition from a behavioural perspective.
In terms of lengthening the funding profile the long-term funding ratio increased to 23% in 2010, compared with 18% in 2009. Nedbank Group’s capital market issues of R6,2 billion, with 3-, 5- and 10-year instruments having been issued, contributed to the increase in the long-term funding ratio.
6 Nedbank Risk FA.indd 183 22/03/2011 12:07 PM
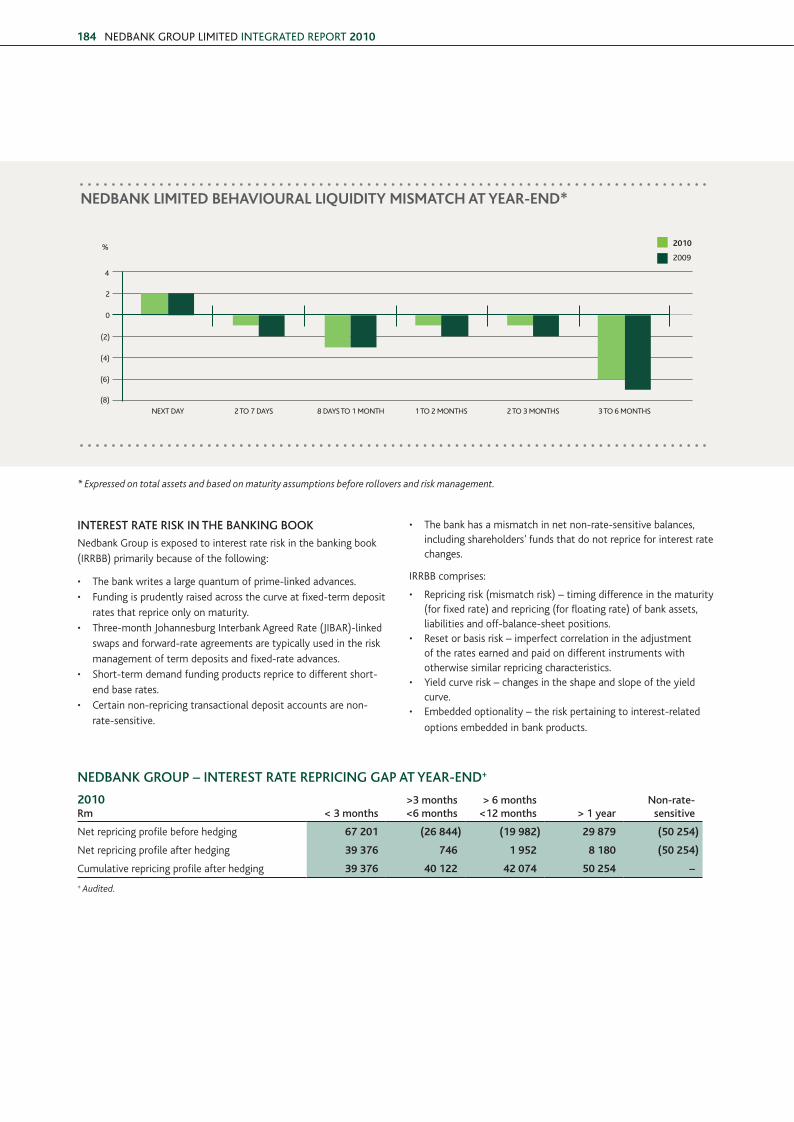
NEDBANK GROUP LimitED iNtEGRAtED REPORt 2010184
nedbank liMiTed behaViOural liquidiTy MiSMaTch aT year-end*
NExt DAY 2 tO 7 DAYs 8 DAYs tO 1 mONtH 1 tO 2 mONtHs 2 tO 3 mONtHs 3 tO 6 mONtHs
4
2
0
(2)
(4)
(6)
(8)
2010
2009%
* Expressed on total assets and based on maturity assumptions before rollovers and risk management.
INtErESt rAtE rISk IN tHE bANkING bOOk
Nedbank Group is exposed to interest rate risk in the banking book
(IRRBB) primarily because of the following:
• The bank writes a large quantum of prime-linked advances.
• Funding is prudently raised across the curve at fixed-term deposit
rates that reprice only on maturity.
• Three-month Johannesburg Interbank Agreed Rate (JIBAR)-linked
swaps and forward-rate agreements are typically used in the risk
management of term deposits and fixed-rate advances.
• short-term demand funding products reprice to different short-
end base rates.
• Certain non-repricing transactional deposit accounts are non-
rate-sensitive.
• The bank has a mismatch in net non-rate-sensitive balances, including shareholders’ funds that do not reprice for interest rate changes.
IRRBB comprises:
• Repricing risk (mismatch risk) – timing difference in the maturity (for fixed rate) and repricing (for floating rate) of bank assets, liabilities and off-balance-sheet positions.
• Reset or basis risk – imperfect correlation in the adjustment of the rates earned and paid on different instruments with otherwise similar repricing characteristics.
• yield curve risk – changes in the shape and slope of the yield curve.
• Embedded optionality – the risk pertaining to interest-related
options embedded in bank products.
NEDbANk GrOuP – INtErESt rAtE rEPrICING GAP At YEAr-END+
2010rm < 3 months
>3 months<6 months
> 6 months <12 months > 1 year
Non-rate-sensitive
Net repricing profile before hedging 67 201 (26 844) (19 982) 29 879 (50 254)
Net repricing profile after hedging 39 376 746 1 952 8 180 (50 254)
Cumulative repricing profile after hedging 39 376 40 122 42 074 50 254 –
+ Audited.
6 Nedbank Risk FA.indd 184 22/03/2011 12:07 PM
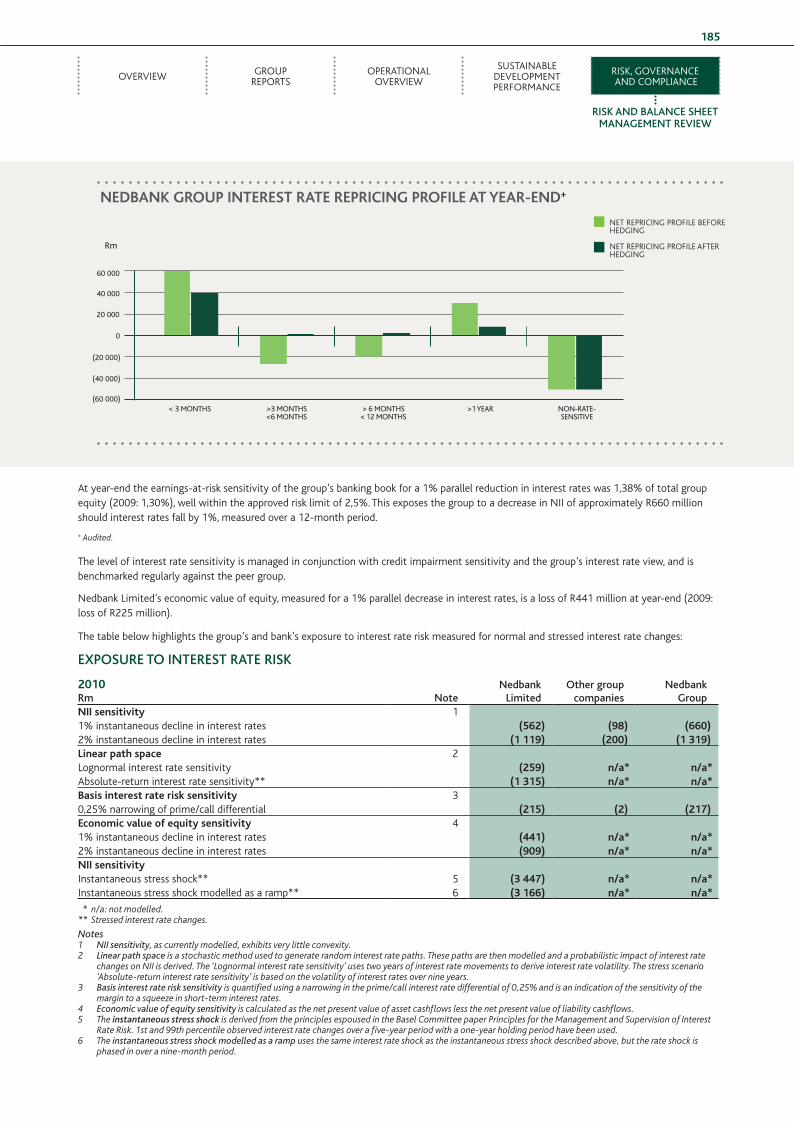
ovERvIEw GRouP REPoRTs
oPERATIoNAl ovERvIEw
susTAINABlE dEvEloPMENT PERFoRMANCE
RIsk, GovERNANCE ANd CoMPlIANCE
rISk AND bAlANCE SHEEt MANAGEMENt rEVIEw
185
nedbank GrOuP inTereST raTe rePricinG PrOFile aT year-end+
Rm
< 3 mONtHs >3 mONtHs<6 mONtHs
> 6 mONtHs< 12 mONtHs
>1 YEAR NON-RAtE- sENsitiVE
40 000
60 000
20 000
0
(20 000)
(40 000)
(60 000)
NET REPRICING PRoFIlE BEFoRE hEdGING
NET REPRICING PRoFIlE AFTER hEdGING
At year-end the earnings-at-risk sensitivity of the group’s banking book for a 1% parallel reduction in interest rates was 1,38% of total group equity (2009: 1,30%), well within the approved risk limit of 2,5%. This exposes the group to a decrease in NII of approximately R660 million should interest rates fall by 1%, measured over a 12-month period.
+ Audited.
The level of interest rate sensitivity is managed in conjunction with credit impairment sensitivity and the group’s interest rate view, and is benchmarked regularly against the peer group.
Nedbank limited’s economic value of equity, measured for a 1% parallel decrease in interest rates, is a loss of R441 million at year-end (2009: loss of R225 million).
The table below highlights the group’s and bank’s exposure to interest rate risk measured for normal and stressed interest rate changes:
EXPOSurE tO INtErESt rAtE rISk
2010rm Note
Nedbank limited
Other group companies
Nedbank Group
nii sensitivity 1 1% instantaneous decline in interest rates (562) (98) (660)2% instantaneous decline in interest rates (1 119) (200) (1 319)linear path space 2 lognormal interest rate sensitivity (259) n/a* n/a*Absolute-return interest rate sensitivity** (1 315) n/a* n/a*basis interest rate risk sensitivity 3 0,25% narrowing of prime/call differential (215) (2) (217)economic value of equity sensitivity 4 1% instantaneous decline in interest rates (441) n/a* n/a*2% instantaneous decline in interest rates (909) n/a* n/a*nii sensitivity Instantaneous stress shock** 5 (3 447) n/a* n/a*Instantaneous stress shock modelled as a ramp** 6 (3 166) n/a* n/a*
* n/a: not modelled. ** Stressed interest rate changes.
Notes1 NII sensitivity, as currently modelled, exhibits very little convexity. 2 Linear path space is a stochastic method used to generate random interest rate paths. These paths are then modelled and a probabilistic impact of interest rate
changes on NII is derived. The ‘Lognormal interest rate sensitivity’ uses two years of interest rate movements to derive interest rate volatility. The stress scenario ‘Absolute-return interest rate sensitivity’ is based on the volatility of interest rates over nine years.
3 Basis interest rate risk sensitivity is quantified using a narrowing in the prime/call interest rate differential of 0,25% and is an indication of the sensitivity of the margin to a squeeze in short-term interest rates.
4 Economic value of equity sensitivity is calculated as the net present value of asset cashflows less the net present value of liability cashflows. 5 The instantaneous stress shock is derived from the principles espoused in the Basel Committee paper Principles for the Management and Supervision of Interest
Rate Risk. 1st and 99th percentile observed interest rate changes over a five-year period with a one-year holding period have been used.6 The instantaneous stress shock modelled as a ramp uses the same interest rate shock as the instantaneous stress shock described above, but the rate shock is
phased in over a nine-month period.
6 Nedbank Risk FA.indd 185 22/03/2011 12:07 PM
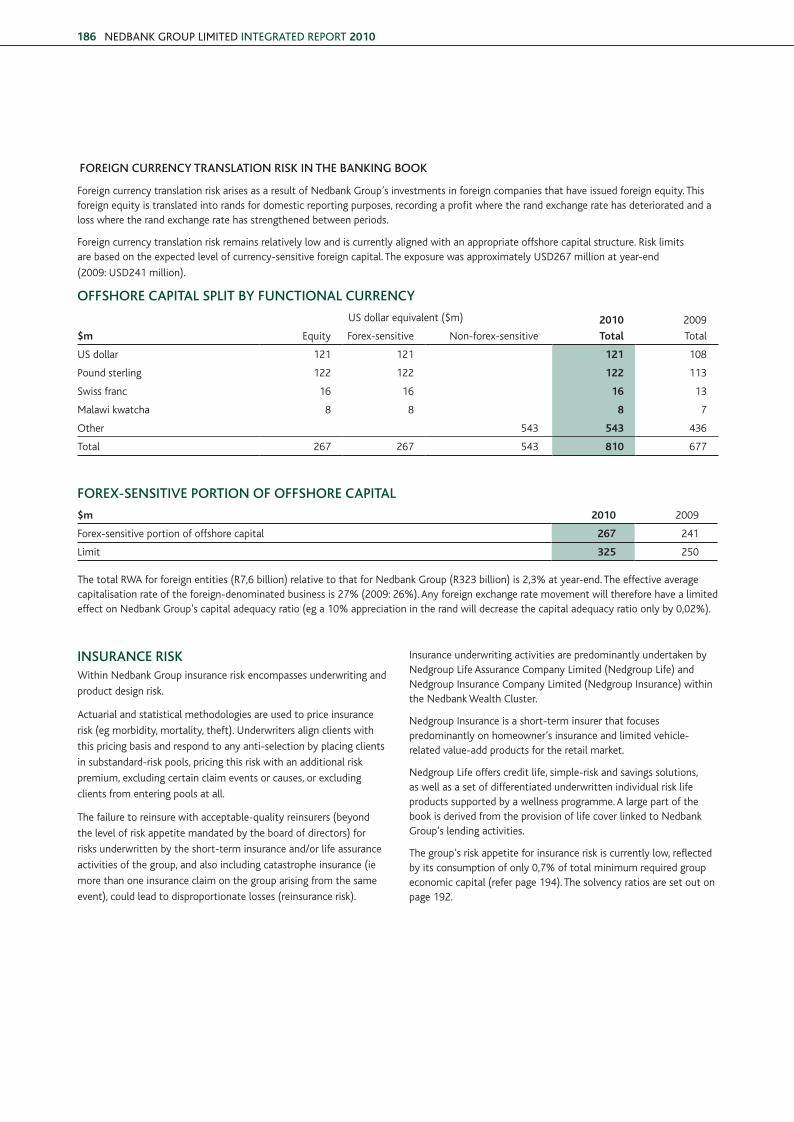
NEDBANK GROUP LimitED iNtEGRAtED REPORt 2010186
fOrEIGN CurrENCY trANSlAtION rISk IN tHE bANkING bOOk
Foreign currency translation risk arises as a result of Nedbank Group’s investments in foreign companies that have issued foreign equity. This foreign equity is translated into rands for domestic reporting purposes, recording a profit where the rand exchange rate has deteriorated and a loss where the rand exchange rate has strengthened between periods.
Foreign currency translation risk remains relatively low and is currently aligned with an appropriate offshore capital structure. Risk limits are based on the expected level of currency-sensitive foreign capital. The exposure was approximately usd267 million at year-end
(2009: usd241 million).
OffSHOrE CAPItAl SPlIt bY fuNCtIONAl CurrENCY
$m
us dollar equivalent ($m) 2010
Total
2009
TotalEquity Forex-sensitive Non-forex-sensitive
us dollar 121 121 121 108
Pound sterling 122 122 122 113
swiss franc 16 16 16 13
Malawi kwatcha 8 8 8 7
other 543 543 436
Total 267 267 543 810 677
fOrEX-SENSItIVE POrtION Of OffSHOrE CAPItAl
$m 2010 2009
Forex-sensitive portion of offshore capital 267 241
limit 325 250
The total RwA for foreign entities (R7,6 billion) relative to that for Nedbank Group (R323 billion) is 2,3% at year-end. The effective average capitalisation rate of the foreign-denominated business is 27% (2009: 26%). Any foreign exchange rate movement will therefore have a limited effect on Nedbank Group’s capital adequacy ratio (eg a 10% appreciation in the rand will decrease the capital adequacy ratio only by 0,02%).
INSurANCE rISkwithin Nedbank Group insurance risk encompasses underwriting and
product design risk.
Actuarial and statistical methodologies are used to price insurance
risk (eg morbidity, mortality, theft). underwriters align clients with
this pricing basis and respond to any anti-selection by placing clients
in substandard-risk pools, pricing this risk with an additional risk
premium, excluding certain claim events or causes, or excluding
clients from entering pools at all.
The failure to reinsure with acceptable-quality reinsurers (beyond
the level of risk appetite mandated by the board of directors) for
risks underwritten by the short-term insurance and/or life assurance
activities of the group, and also including catastrophe insurance (ie
more than one insurance claim on the group arising from the same
event), could lead to disproportionate losses (reinsurance risk).
Insurance underwriting activities are predominantly undertaken by Nedgroup life Assurance Company limited (Nedgroup life) and Nedgroup Insurance Company limited (Nedgroup Insurance) within the Nedbank wealth Cluster.
Nedgroup Insurance is a short-term insurer that focuses predominantly on homeowner’s insurance and limited vehicle-related value-add products for the retail market.
Nedgroup life offers credit life, simple-risk and savings solutions, as well as a set of differentiated underwritten individual risk life products supported by a wellness programme. A large part of the book is derived from the provision of life cover linked to Nedbank Group’s lending activities.
The group’s risk appetite for insurance risk is currently low, reflected by its consumption of only 0,7% of total minimum required group economic capital (refer page 194). The solvency ratios are set out on page 192.
6 Nedbank Risk FA.indd 186 22/03/2011 12:07 PM
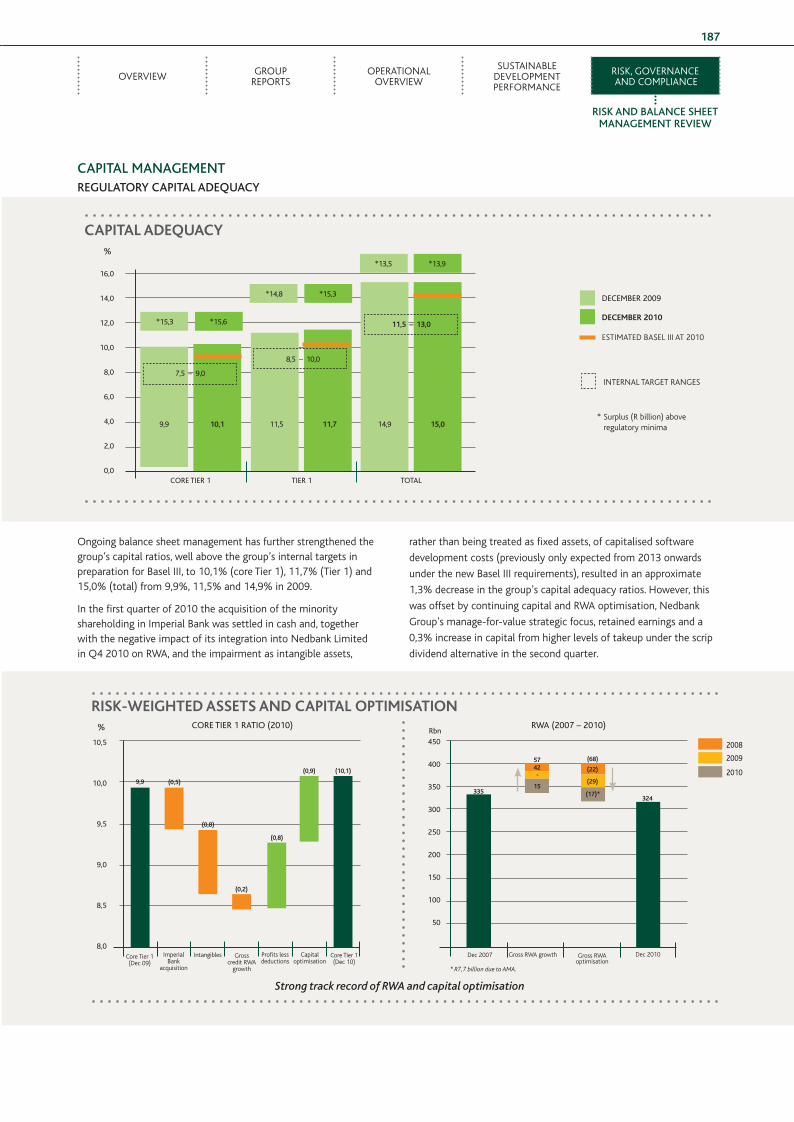
ovERvIEw GRouP REPoRTs
oPERATIoNAl ovERvIEw
susTAINABlE dEvEloPMENT PERFoRMANCE
RIsk, GovERNANCE ANd CoMPlIANCE
rISk AND bAlANCE SHEEt MANAGEMENt rEVIEw
187
CAPItAl MANAGEMENtrEGulAtOrY CAPItAl ADEQuACY
NEDbANk GrOuP rEGulAtOrY CAPItAl ADEQuACY
ongoing balance sheet management has further strengthened the group’s capital ratios, well above the group’s internal targets in preparation for Basel III, to 10,1% (core Tier 1), 11,7% (Tier 1) and 15,0% (total) from 9,9%, 11,5% and 14,9% in 2009.
In the first quarter of 2010 the acquisition of the minority shareholding in Imperial Bank was settled in cash and, together with the negative impact of its integration into Nedbank limited in Q4 2010 on RwA, and the impairment as intangible assets,
rather than being treated as fixed assets, of capitalised software
development costs (previously only expected from 2013 onwards
under the new Basel III requirements), resulted in an approximate
1,3% decrease in the group’s capital adequacy ratios. however, this
was offset by continuing capital and RwA optimisation, Nedbank
Group’s manage-for-value strategic focus, retained earnings and a
0,3% increase in capital from higher levels of takeup under the scrip
dividend alternative in the second quarter.
riSk-WeiGhTed aSSeTS and caPiTal OPTiMiSaTiOn
10,5
10,0
9,5
9,0
8,5
8,0
450
400
350
300
250
200
150
100
50
Core Tier 1 (dec 09)
Core Tier 1 (dec 10)
Imperial Bank
acquisition
Intangibles Gross credit RwA
growth
Profits less deductions
Capital optimisation
9,9 (0,5)
(0,8)
(0,8)
(0,9) (10,1)
(0,2)
% CORE tiER 1 RAtiO (2010) RWA (2007 – 2010)Rbn
dec 2007 dec 2010Gross RwA optimisation
Gross RwA growth
57
335324
(68)
(17)*
(29)-
(22)42
15
2008
2009
2010
Strong track record of RWA and capital optimisation
* R7,7 billion due to AMA.
caPiTal adequacy%
deceMber 2010
INTERNAl TARGET RANGEs
* surplus (R billion) above regulatory minima
DECEmBER 2009
11,711,5
8,5 – 10,0
15,0
11,5 – 13,0
14,9
EsTIMATEd BAsEl III AT 2010
10,19,9
7,5 – 9,0
*15,3 *15,6
*14,8 *15,3
*13,5 *13,9
CORE tiER 1 tiER 1 tOtAL
16,0
14,0
12,0
10,0
8,0
6,0
4,0
2,0
0,0
6 Nedbank Risk FA.indd 187 22/03/2011 12:07 PM
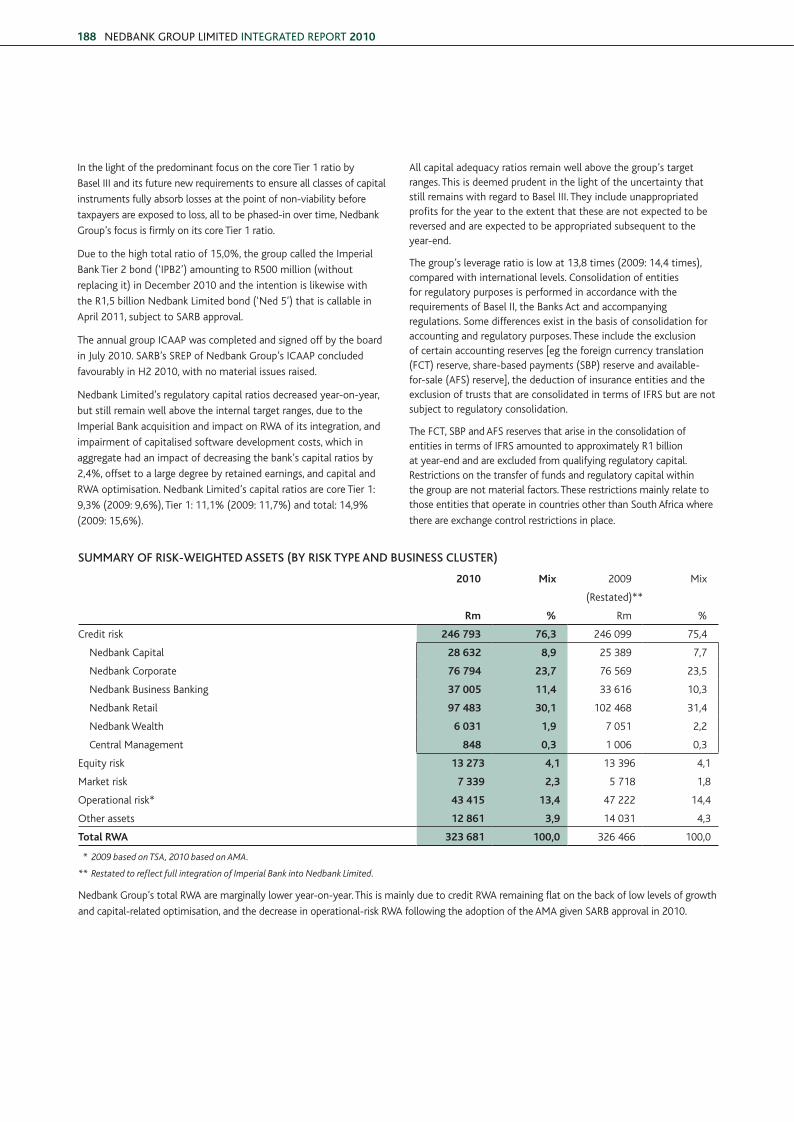
NEDBANK GROUP LimitED iNtEGRAtED REPORt 2010188
In the light of the predominant focus on the core Tier 1 ratio by
Basel III and its future new requirements to ensure all classes of capital
instruments fully absorb losses at the point of non-viability before
taxpayers are exposed to loss, all to be phased-in over time, Nedbank
Group’s focus is firmly on its core Tier 1 ratio.
due to the high total ratio of 15,0%, the group called the Imperial
Bank Tier 2 bond (‘IPB2’) amounting to R500 million (without
replacing it) in december 2010 and the intention is likewise with
the R1,5 billion Nedbank limited bond (‘Ned 5’) that is callable in
April 2011, subject to sARB approval.
The annual group ICAAP was completed and signed off by the board
in July 2010. sARB’s sREP of Nedbank Group’s ICAAP concluded
favourably in h2 2010, with no material issues raised.
Nedbank limited’s regulatory capital ratios decreased year-on-year,
but still remain well above the internal target ranges, due to the
Imperial Bank acquisition and impact on RwA of its integration, and
impairment of capitalised software development costs, which in
aggregate had an impact of decreasing the bank’s capital ratios by
2,4%, offset to a large degree by retained earnings, and capital and
RwA optimisation. Nedbank limited’s capital ratios are core Tier 1:
9,3% (2009: 9,6%), Tier 1: 11,1% (2009: 11,7%) and total: 14,9%
(2009: 15,6%).
All capital adequacy ratios remain well above the group’s target ranges. This is deemed prudent in the light of the uncertainty that still remains with regard to Basel III. They include unappropriated profits for the year to the extent that these are not expected to be reversed and are expected to be appropriated subsequent to the year-end.
The group’s leverage ratio is low at 13,8 times (2009: 14,4 times), compared with international levels. Consolidation of entities for regulatory purposes is performed in accordance with the requirements of Basel II, the Banks Act and accompanying regulations. some differences exist in the basis of consolidation for accounting and regulatory purposes. These include the exclusion of certain accounting reserves [eg the foreign currency translation (FCT) reserve, share-based payments (sBP) reserve and available-for-sale (AFs) reserve], the deduction of insurance entities and the exclusion of trusts that are consolidated in terms of IFRs but are not subject to regulatory consolidation.
The FCT, sBP and AFs reserves that arise in the consolidation of entities in terms of IFRs amounted to approximately R1 billion at year-end and are excluded from qualifying regulatory capital. Restrictions on the transfer of funds and regulatory capital within the group are not material factors. These restrictions mainly relate to those entities that operate in countries other than south Africa where
there are exchange control restrictions in place.
SuMMArY Of rISk-wEIGHtED ASSEtS (bY rISk tYPE AND buSINESS CluStEr)
2010 Mix 2009 Mix
(Restated)**
rm % Rm %
Credit risk 246 793 76,3 246 099 75,4
Nedbank Capital 28 632 8,9 25 389 7,7
Nedbank Corporate 76 794 23,7 76 569 23,5
Nedbank Business Banking 37 005 11,4 33 616 10,3
Nedbank Retail 97 483 30,1 102 468 31,4
Nedbank wealth 6 031 1,9 7 051 2,2
Central Management 848 0,3 1 006 0,3
Equity risk 13 273 4,1 13 396 4,1
Market risk 7 339 2,3 5 718 1,8
operational risk* 43 415 13,4 47 222 14,4
other assets 12 861 3,9 14 031 4,3
Total rWa 323 681 100,0 326 466 100,0
* 2009 based on TSA, 2010 based on AMA.
** Restated to reflect full integration of Imperial Bank into Nedbank Limited.
Nedbank Group’s total RwA are marginally lower year-on-year. This is mainly due to credit RwA remaining flat on the back of low levels of growth
and capital-related optimisation, and the decrease in operational-risk RwA following the adoption of the AMA given sARB approval in 2010.
6 Nedbank Risk FA.indd 188 22/03/2011 12:07 PM
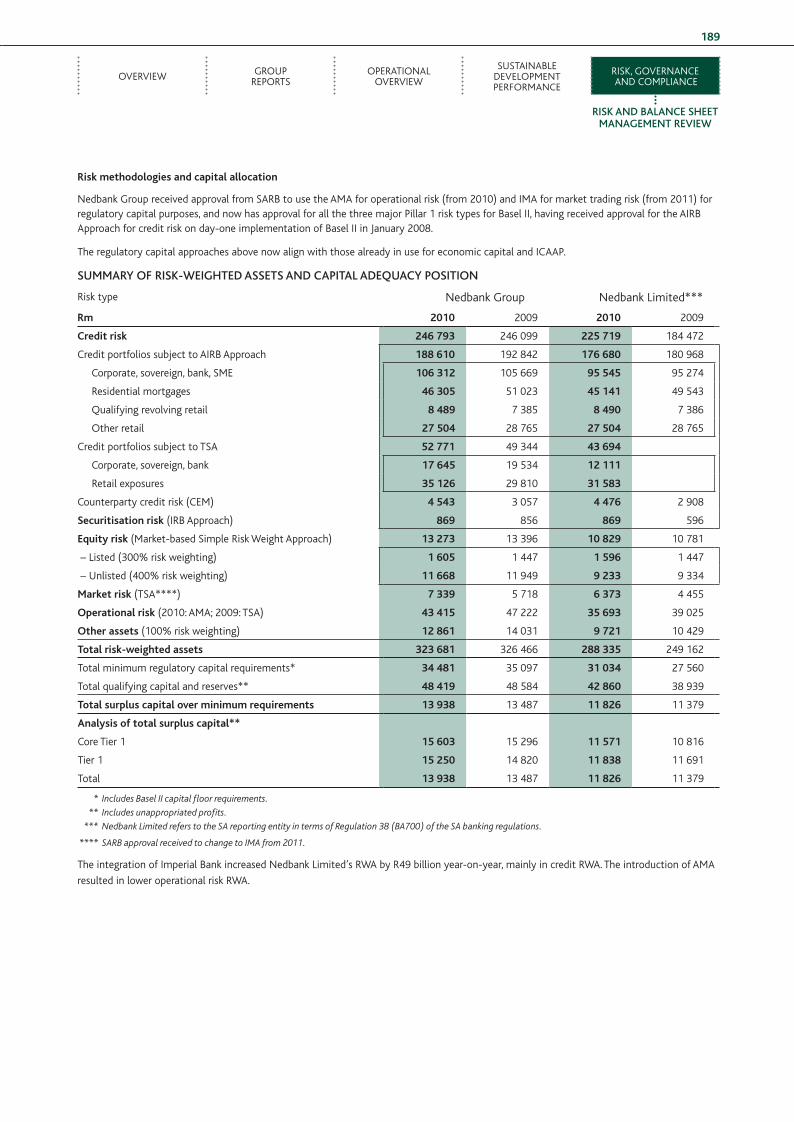
ovERvIEw GRouP REPoRTs
oPERATIoNAl ovERvIEw
susTAINABlE dEvEloPMENT PERFoRMANCE
RIsk, GovERNANCE ANd CoMPlIANCE
rISk AND bAlANCE SHEEt MANAGEMENt rEVIEw
189
risk methodologies and capital allocation
Nedbank Group received approval from sARB to use the AMA for operational risk (from 2010) and IMA for market trading risk (from 2011) for regulatory capital purposes, and now has approval for all the three major Pillar 1 risk types for Basel II, having received approval for the AIRB Approach for credit risk on day-one implementation of Basel II in January 2008.
The regulatory capital approaches above now align with those already in use for economic capital and ICAAP.
SuMMArY Of rISk-wEIGHtED ASSEtS AND CAPItAl ADEQuACY POSItION
Risk type
rm
Nedbank Group Nedbank limited***
2010 2009 2010 2009
credit risk 246 793 246 099 225 719 184 472
Credit portfolios subject to AIRB Approach 188 610 192 842 176 680 180 968
Corporate, sovereign, bank, sME 106 312 105 669 95 545 95 274
Residential mortgages 46 305 51 023 45 141 49 543
Qualifying revolving retail 8 489 7 385 8 490 7 386
other retail 27 504 28 765 27 504 28 765
Credit portfolios subject to TsA 52 771 49 344 43 694
Corporate, sovereign, bank 17 645 19 534 12 111
Retail exposures 35 126 29 810 31 583
Counterparty credit risk (CEM) 4 543 3 057 4 476 2 908
Securitisation risk (IRB Approach) 869 856 869 596
equity risk (Market-based simple Risk weight Approach) 13 273 13 396 10 829 10 781
– listed (300% risk weighting) 1 605 1 447 1 596 1 447
– unlisted (400% risk weighting) 11 668 11 949 9 233 9 334
Market risk (TsA****) 7 339 5 718 6 373 4 455
Operational risk (2010: AMA; 2009: TsA) 43 415 47 222 35 693 39 025
Other assets (100% risk weighting) 12 861 14 031 9 721 10 429
Total risk-weighted assets 323 681 326 466 288 335 249 162
Total minimum regulatory capital requirements* 34 481 35 097 31 034 27 560
Total qualifying capital and reserves** 48 419 48 584 42 860 38 939
Total surplus capital over minimum requirements 13 938 13 487 11 826 11 379
analysis of total surplus capital**
Core Tier 1 15 603 15 296 11 571 10 816
Tier 1 15 250 14 820 11 838 11 691
Total 13 938 13 487 11 826 11 379
* Includes Basel II capital floor requirements.
** Includes unappropriated profits.
*** Nedbank Limited refers to the SA reporting entity in terms of Regulation 38 (BA700) of the SA banking regulations.
**** SARB approval received to change to IMA from 2011.
The integration of Imperial Bank increased Nedbank limited’s RwA by R49 billion year-on-year, mainly in credit RwA. The introduction of AMA
resulted in lower operational risk RwA.
6 Nedbank Risk FA.indd 189 22/03/2011 12:07 PM
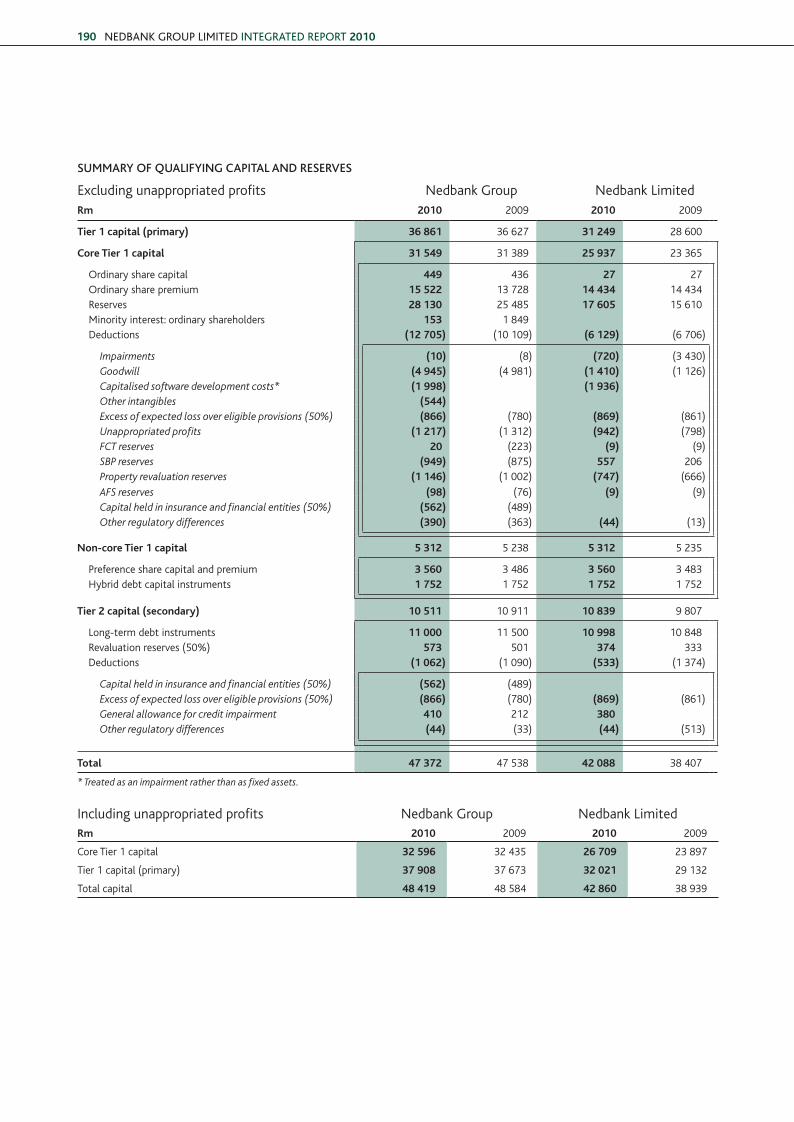
NEDBANK GROUP LimitED iNtEGRAtED REPORt 2010190
SuMMArY Of QuAlIfYING CAPItAl AND rESErVES
Excluding unappropriated profits Nedbank Group Nedbank limitedrm 2010 2009 2010 2009
Tier 1 capital (primary) 36 861 36 627 31 249 28 600
core Tier 1 capital 31 549 31 389 25 937 23 365
ordinary share capital 449 436 27 27 ordinary share premium 15 522 13 728 14 434 14 434 Reserves 28 130 25 485 17 605 15 610 Minority interest: ordinary shareholders 153 1 849 deductions (12 705) (10 109) (6 129) (6 706)
Impairments (10) (8) (720) (3 430)Goodwill (4 945) (4 981) (1 410) (1 126)Capitalised software development costs* (1 998) (1 936)Other intangibles (544)Excess of expected loss over eligible provisions (50%) (866) (780) (869) (861)Unappropriated profits (1 217) (1 312) (942) (798)FCT reserves 20 (223) (9) (9)SBP reserves (949) (875) 557 206 Property revaluation reserves (1 146) (1 002) (747) (666)
AFS reserves (98) (76) (9) (9)Capital held in insurance and financial entities (50%) (562) (489)Other regulatory differences (390) (363) (44) (13)
non-core Tier 1 capital 5 312 5 238 5 312 5 235
Preference share capital and premium 3 560 3 486 3 560 3 483 hybrid debt capital instruments 1 752 1 752 1 752 1 752
Tier 2 capital (secondary) 10 511 10 911 10 839 9 807
long-term debt instruments 11 000 11 500 10 998 10 848 Revaluation reserves (50%) 573 501 374 333 deductions (1 062) (1 090) (533) (1 374)
Capital held in insurance and financial entities (50%) (562) (489)Excess of expected loss over eligible provisions (50%) (866) (780) (869) (861)General allowance for credit impairment 410 212 380Other regulatory differences (44) (33) (44) (513)
Total 47 372 47 538 42 088 38 407
* Treated as an impairment rather than as fixed assets.
Including unappropriated profits Nedbank Group Nedbank limitedrm 2010 2009 2010 2009
Core Tier 1 capital 32 596 32 435 26 709 23 897
Tier 1 capital (primary) 37 908 37 673 32 021 29 132
Total capital 48 419 48 584 42 860 38 939
6 Nedbank Risk FA.indd 190 22/03/2011 12:07 PM
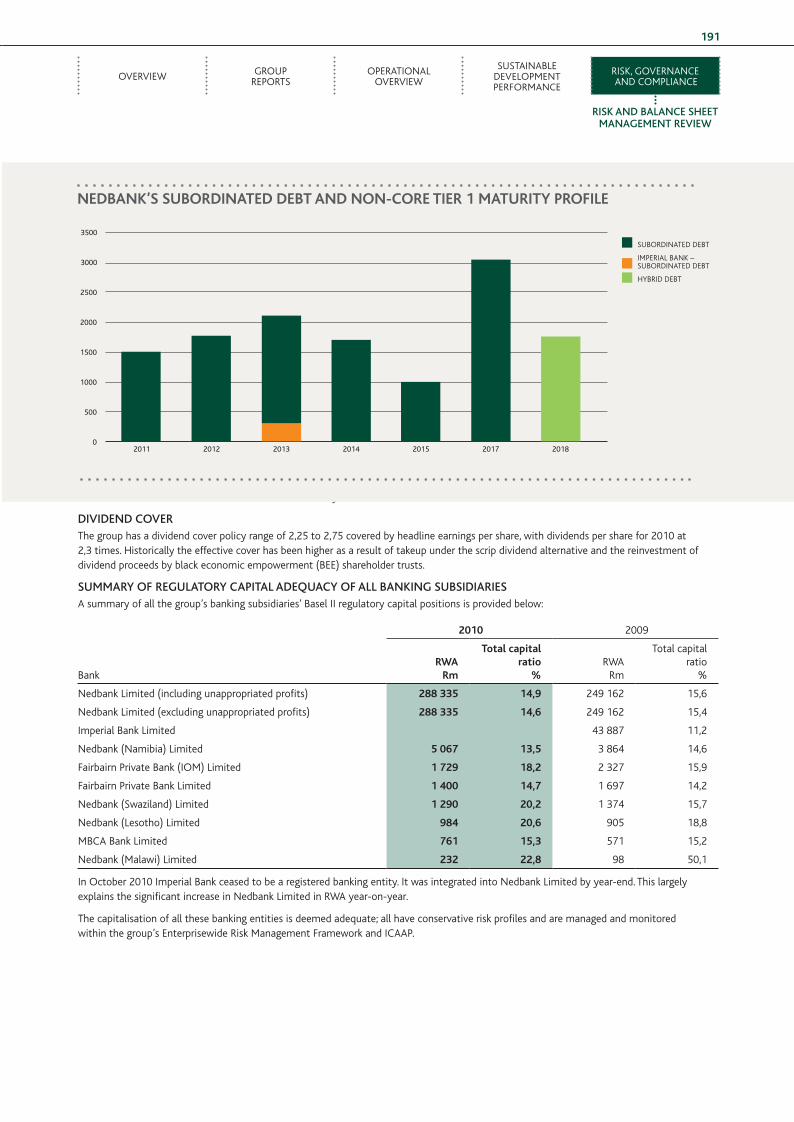
ovERvIEw GRouP REPoRTs
oPERATIoNAl ovERvIEw
susTAINABlE dEvEloPMENT PERFoRMANCE
RIsk, GovERNANCE ANd CoMPlIANCE
rISk AND bAlANCE SHEEt MANAGEMENt rEVIEw
191
Note: The subordinated debt is based on call dates not maturity.
DIVIDEND COVErThe group has a dividend cover policy range of 2,25 to 2,75 covered by headline earnings per share, with dividends per share for 2010 at 2,3 times. historically the effective cover has been higher as a result of takeup under the scrip dividend alternative and the reinvestment of dividend proceeds by black economic empowerment (BEE) shareholder trusts.
SuMMArY Of rEGulAtOrY CAPItAl ADEQuACY Of All bANkING SubSIDIArIESA summary of all the group’s banking subsidiaries’ Basel II regulatory capital positions is provided below:
2010 2009
Bank
rWarm
Total capital ratio
%RwA
Rm
Total capital ratio
%
Nedbank limited (including unappropriated profits) 288 335 14,9 249 162 15,6
Nedbank limited (excluding unappropriated profits) 288 335 14,6 249 162 15,4
Imperial Bank limited 43 887 11,2
Nedbank (Namibia) limited 5 067 13,5 3 864 14,6
Fairbairn Private Bank (IoM) limited 1 729 18,2 2 327 15,9
Fairbairn Private Bank limited 1 400 14,7 1 697 14,2
Nedbank (swaziland) limited 1 290 20,2 1 374 15,7
Nedbank (lesotho) limited 984 20,6 905 18,8
MBCA Bank limited 761 15,3 571 15,2
Nedbank (Malawi) limited 232 22,8 98 50,1
In october 2010 Imperial Bank ceased to be a registered banking entity. It was integrated into Nedbank limited by year-end. This largely explains the significant increase in Nedbank limited in RwA year-on-year.
The capitalisation of all these banking entities is deemed adequate; all have conservative risk profiles and are managed and monitored within the group’s Enterprisewide Risk Management Framework and ICAAP.
nedbank’S SubOrdinaTed debT and nOn-cOre Tier 1 MaTuriTy PrOFile
3000
3500
2500
2000
1500
1000
500
0
suBoRdINATEd dEBT
IMPERIAl BANk – suBoRdINATEd dEBT
hyBRId dEBT
2011 2012 2013 2014 2015 2017 2018
6 Nedbank Risk FA.indd 191 22/03/2011 12:07 PM
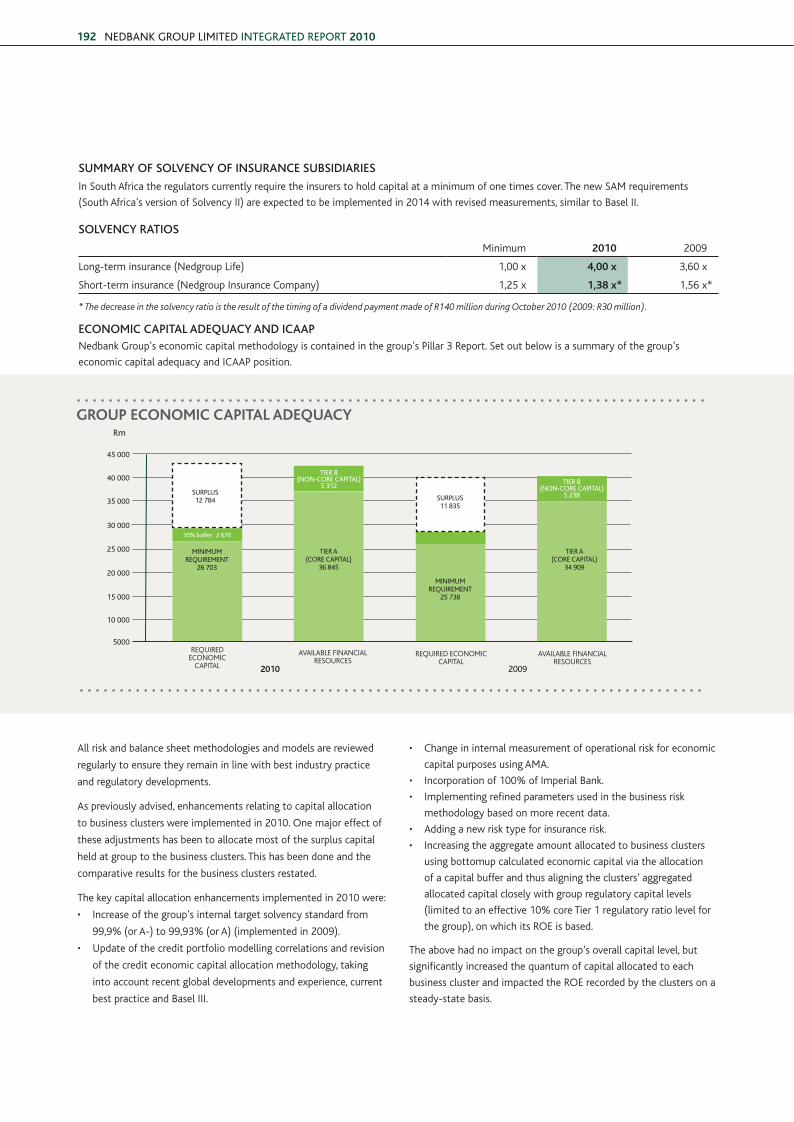
NEDBANK GROUP LimitED iNtEGRAtED REPORt 2010192
SuMMArY Of SOlVENCY Of INSurANCE SubSIDIArIES
In south Africa the regulators currently require the insurers to hold capital at a minimum of one times cover. The new sAM requirements
(south Africa’s version of solvency II) are expected to be implemented in 2014 with revised measurements, similar to Basel II.
SOlVENCY rAtIOS
Minimum 2010 2009
long-term insurance (Nedgroup life) 1,00 x 4,00 x 3,60 x
short-term insurance (Nedgroup Insurance Company) 1,25 x 1,38 x* 1,56 x*
* The decrease in the solvency ratio is the result of the timing of a dividend payment made of R140 million during October 2010 (2009: R30 million).
ECONOMIC CAPItAl ADEQuACY AND ICAAPNedbank Group’s economic capital methodology is contained in the group’s Pillar 3 Report. set out below is a summary of the group’s
economic capital adequacy and ICAAP position.
GrOuP ECONOMIC CAPItAl ADEQuACY
GrOuP ecOnOMic caPiTal adequacy
2010 2009
25 000
30 000
35 000
40 000
45 000
20 000
15 000
5000
10 000
Rm
sURPLUs 12 784
10% buffer 2 670
miNimUm REqUiREmENt
26 703
REQuIREd ECoNoMIC
CAPITAl
REQuIREd ECoNoMIC CAPITAl
AvAIlABlE FINANCIAl REsouRCEs
AvAIlABlE FINANCIAl REsouRCEs
miNimUm REqUiREmENt
25 738
tiER A (CORE CAPitAL)
36 845
tiER B (NON-CORE CAPitAL)
5 312tiER B
(NON-CORE CAPitAL) 5 238
tiER A (CORE CAPitAL)
34 909
sURPLUs 11 835
10% buffer 2 574
All risk and balance sheet methodologies and models are reviewed
regularly to ensure they remain in line with best industry practice
and regulatory developments.
As previously advised, enhancements relating to capital allocation
to business clusters were implemented in 2010. one major effect of
these adjustments has been to allocate most of the surplus capital
held at group to the business clusters. This has been done and the
comparative results for the business clusters restated.
The key capital allocation enhancements implemented in 2010 were:
• Increase of the group’s internal target solvency standard from
99,9% (or A-) to 99,93% (or A) (implemented in 2009).
• update of the credit portfolio modelling correlations and revision
of the credit economic capital allocation methodology, taking
into account recent global developments and experience, current
best practice and Basel III.
• Change in internal measurement of operational risk for economic
capital purposes using AMA.
• Incorporation of 100% of Imperial Bank.
• Implementing refined parameters used in the business risk
methodology based on more recent data.
• Adding a new risk type for insurance risk.
• Increasing the aggregate amount allocated to business clusters
using bottomup calculated economic capital via the allocation
of a capital buffer and thus aligning the clusters’ aggregated
allocated capital closely with group regulatory capital levels
(limited to an effective 10% core Tier 1 regulatory ratio level for
the group), on which its RoE is based.
The above had no impact on the group’s overall capital level, but
significantly increased the quantum of capital allocated to each
business cluster and impacted the RoE recorded by the clusters on a
steady-state basis.
6 Nedbank Risk FA.indd 192 22/03/2011 12:07 PM
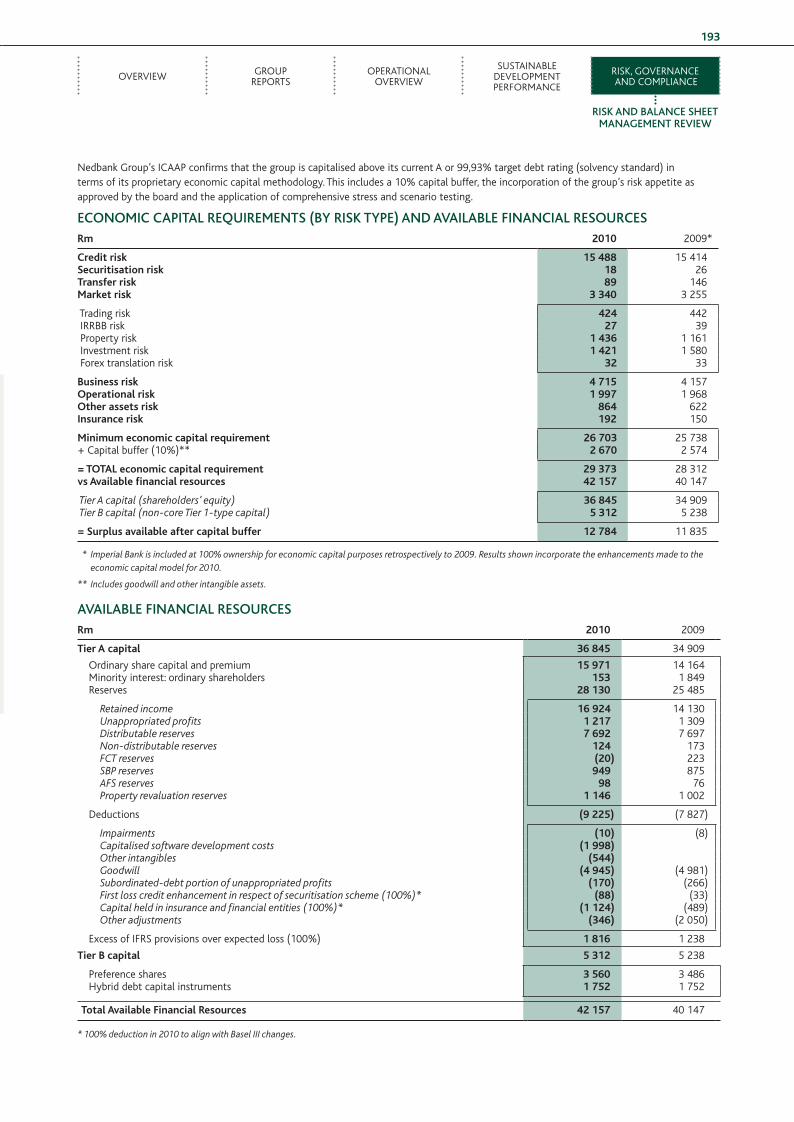
ovERvIEw GRouP REPoRTs
oPERATIoNAl ovERvIEw
susTAINABlE dEvEloPMENT PERFoRMANCE
RIsk, GovERNANCE ANd CoMPlIANCE
rISk AND bAlANCE SHEEt MANAGEMENt rEVIEw
193
Nedbank Group’s ICAAP confirms that the group is capitalised above its current A or 99,93% target debt rating (solvency standard) in terms of its proprietary economic capital methodology. This includes a 10% capital buffer, the incorporation of the group’s risk appetite as approved by the board and the application of comprehensive stress and scenario testing.
ECONOMIC CAPItAl rEQuIrEMENtS (bY rISk tYPE) AND AVAIlAblE fINANCIAl rESOurCESrm 2010 2009*
credit risk 15 488 15 414Securitisation risk 18 26Transfer risk 89 146Market risk 3 340 3 255
Trading risk 424 442 IRRBB risk 27 39 Property risk 1 436 1 161 Investment risk 1 421 1 580 Forex translation risk 32 33
business risk 4 715 4 157Operational risk 1 997 1 968Other assets risk 864 622insurance risk 192 150
Minimum economic capital requirement 26 703 25 738+ Capital buffer (10%)** 2 670 2 574
= TOTal economic capital requirement 29 373 28 312vs available financial resources 42 157 40 147
Tier A capital (shareholders’ equity) 36 845 34 909 Tier B capital (non-core Tier 1-type capital) 5 312 5 238
= Surplus available after capital buffer 12 784 11 835
* Imperial Bank is included at 100% ownership for economic capital purposes retrospectively to 2009. Results shown incorporate the enhancements made to the economic capital model for 2010.
** Includes goodwill and other intangible assets.
AVAIlAblE fINANCIAl rESOurCESrm 2010 2009
Tier a capital 36 845 34 909
ordinary share capital and premium 15 971 14 164 Minority interest: ordinary shareholders 153 1 849 Reserves 28 130 25 485
Retained income 16 924 14 130 Unappropriated profits 1 217 1 309 Distributable reserves 7 692 7 697 Non-distributable reserves 124 173 FCT reserves (20) 223 SBP reserves 949 875 AFS reserves 98 76 Property revaluation reserves 1 146 1 002
deductions (9 225) (7 827)
Impairments (10) (8)Capitalised software development costs (1 998) Other intangibles (544) Goodwill (4 945) (4 981)Subordinated-debt portion of unappropriated profits (170) (266)First loss credit enhancement in respect of securitisation scheme (100%)* (88) (33)Capital held in insurance and financial entities (100%)* (1 124) (489)Other adjustments (346) (2 050)
Excess of IFRs provisions over expected loss (100%) 1 816 1 238
Tier b capital 5 312 5 238
Preference shares 3 560 3 486 hybrid debt capital instruments 1 752 1 752
Total available Financial resources 42 157 40 147
* 100% deduction in 2010 to align with Basel III changes.
6 Nedbank Risk FA.indd 193 22/03/2011 12:07 PM
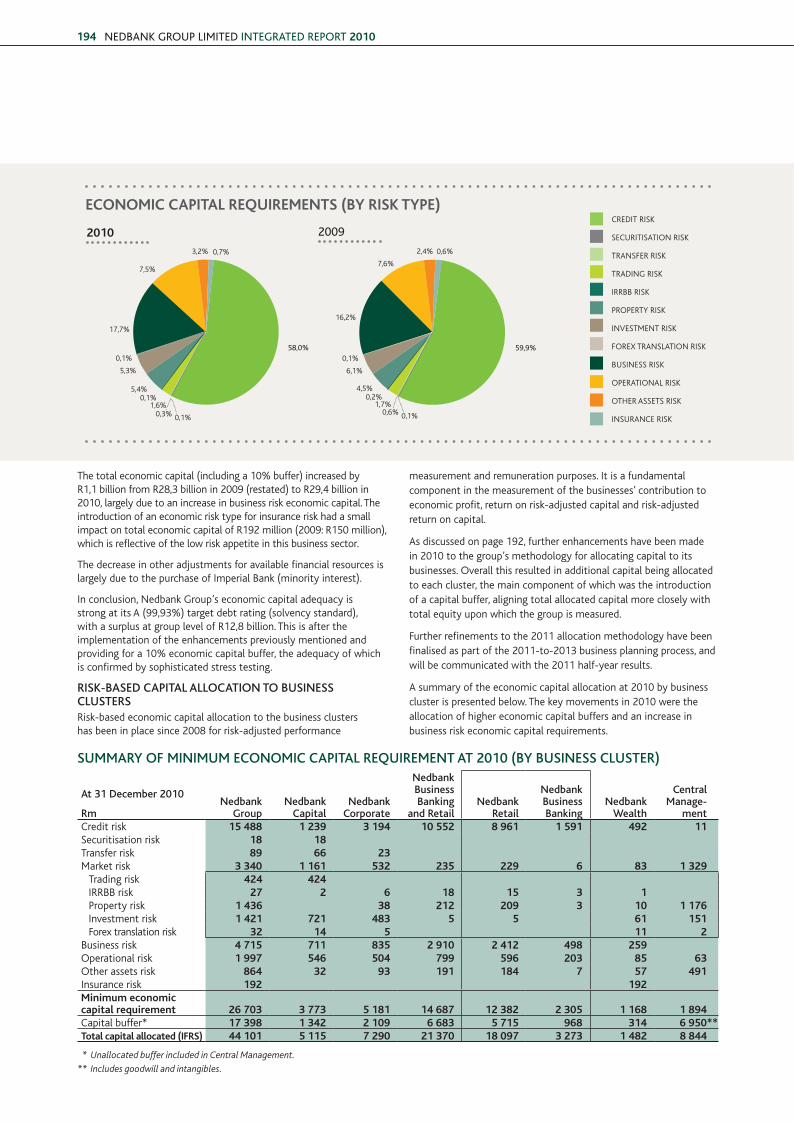
NEDBANK GROUP LimitED iNtEGRAtED REPORt 2010194
ecOnOMic caPiTal requireMenTS (by riSk TyPe)
2010 2009CREdIT RIsk
sECuRITIsATIoN RIsk
TRANsFER RIsk
TRAdING RIsk
IRRBB RIsk
PRoPERTy RIsk
INvEsTMENT RIsk
FoREx TRANslATIoN RIsk
BusINEss RIsk
oPERATIoNAl RIsk
oThER AssETs RIsk
INsuRANCE RIsk
17,7%
7,5%
5,3%
5,4%0,1%
1,6%
0,1%
3,2% 0,7%
58,0%
16,2%
7,6%
6,1%
4,5%
1,7%0,6% 0,1%
0,2%
0,1%
2,4% 0,6%
59,9%
0,3% 0,1%
The total economic capital (including a 10% buffer) increased by R1,1 billion from R28,3 billion in 2009 (restated) to R29,4 billion in 2010, largely due to an increase in business risk economic capital. The introduction of an economic risk type for insurance risk had a small impact on total economic capital of R192 million (2009: R150 million), which is reflective of the low risk appetite in this business sector.
The decrease in other adjustments for available financial resources is largely due to the purchase of Imperial Bank (minority interest).
In conclusion, Nedbank Group’s economic capital adequacy is strong at its A (99,93%) target debt rating (solvency standard), with a surplus at group level of R12,8 billion. This is after the implementation of the enhancements previously mentioned and providing for a 10% economic capital buffer, the adequacy of which is confirmed by sophisticated stress testing.
rISk-bASED CAPItAl AllOCAtION tO buSINESS CluStErSRisk-based economic capital allocation to the business clusters has been in place since 2008 for risk-adjusted performance
measurement and remuneration purposes. It is a fundamental component in the measurement of the businesses’ contribution to economic profit, return on risk-adjusted capital and risk-adjusted return on capital.
As discussed on page 192, further enhancements have been made in 2010 to the group’s methodology for allocating capital to its businesses. overall this resulted in additional capital being allocated to each cluster, the main component of which was the introduction of a capital buffer, aligning total allocated capital more closely with total equity upon which the group is measured.
Further refinements to the 2011 allocation methodology have been finalised as part of the 2011-to-2013 business planning process, and will be communicated with the 2011 half-year results.
A summary of the economic capital allocation at 2010 by business cluster is presented below. The key movements in 2010 were the allocation of higher economic capital buffers and an increase in business risk economic capital requirements.
SuMMArY Of MINIMuM ECONOMIC CAPItAl rEQuIrEMENt At 2010 (bY buSINESS CluStEr)
At 31 December 2010
rmNedbank
GroupNedbank
CapitalNedbank
Corporate
Nedbank business banking
and retailNedbank
retail
Nedbank business banking
Nedbank wealth
Central Manage-
mentCredit risk 15 488 1 239 3 194 10 552 8 961 1 591 492 11 securitisation risk 18 18 Transfer risk 89 66 23 Market risk 3 340 1 161 532 235 229 6 83 1 329
Trading risk 424 424 IRRBB risk 27 2 6 18 15 3 1 Property risk 1 436 38 212 209 3 10 1 176 Investment risk 1 421 721 483 5 5 61 151 Forex translation risk 32 14 5 11 2
Business risk 4 715 711 835 2 910 2 412 498 259 operational risk 1 997 546 504 799 596 203 85 63 other assets risk 864 32 93 191 184 7 57 491 Insurance risk 192 192 Minimum economic capital requirement 26 703 3 773 5 181 14 687 12 382 2 305 1 168 1 894 Capital buffer* 17 398 1 342 2 109 6 683 5 715 968 314 6 950** Total capital allocated (iFrS) 44 101 5 115 7 290 21 370 18 097 3 273 1 482 8 844
* Unallocated buffer included in Central Management.
** Includes goodwill and intangibles.
6 Nedbank Risk FA.indd 194 22/03/2011 12:07 PM
ovERvIEw GRouP REPoRTs
oPERATIoNAl ovERvIEw
susTAINABlE dEvEloPMENT PERFoRMANCE
RIsk, GovERNANCE ANd CoMPlIANCE
rISk AND bAlANCE SHEEt MANAGEMENt rEVIEw
195
SuMMArY Of MINIMuM ECONOMIC CAPItAl rEQuIrEMENt At 2009 (bY buSINESS CluStEr)
At 31 december 2009
RmNedbank
GroupNedbank
CapitalNedbank
Corporate
Nedbank Business Banking
and RetailNedbank
Retail
Nedbank Business Banking
Nedbank wealth
Central Manage-
mentCredit risk 15 414 1 051 3 544 10 240 8 556 1 684 549 30 securitisation risk 26 21 – 5 5 – – – Transfer risk 146 103 43 – – – – – Market risk 3 255 1 299 613 298 290 8 90 955
Trading risk 442 442 IRRBB risk 39 3 11 23 18 5 2 Property risk 1 161 37 270 267 3 1 853 Investment risk 1 580 842 561 5 5 72 100 Forex translation risk 33 12 4 15 2
Business risk 4 157 663 793 2 502 1 821 681 181 18 operational risk 1 968 535 506 801 603 198 56 70 other assets risk 622 19 52 193 190 3 26 332 Insurance risk 150 – – – – – 150 – Minimum economic capital requirement 25 738 3 691 5 551 14 039 11 465 2 574 1 052 1 405 Capital buffer* 13 911 1 065 1 814 5 361 4 602 759 315 5 356 Total capital allocated 39 649 4 756 7 365 19 400 16 067 3 333 1 367 6 761
* Unallocated buffer included in Central Management buffer.
COSt Of EQuItYFollowing a shift in the constituents of the cost of equity calculated using the Capital Asset Pricing Model, Nedbank Group revised its cost of equity to 13,00% at the beginning of 2011 (2010: 14,15%). The risk-free rate applied was the primary driver of this change with the 10-year point of the sA sovereign yield curve declining to 8,16% (2009: 9,17%) at 31 december 2010. The cost of equity is revised and updated on an annual basis but also reviewed quarterly.
EXtErNAl CrEDIt rAtINGSMOOdy’S inVeSTOrS SerViceMoody’s Investors service (Moody’s) has reaffirmed the ratings of Nedbank limited, the 100%-owned subsidiary of Nedbank Group limited (Nedbank Group) in July 2010:
MOODY’S INVEStOrS SErVICE NEDbANk lIMItED July 2010
Bank financial-strength rating C-outlook – financial-strength rating stableGlobal local currency – long-term deposits A2Global local currency – short-term deposits Prime-1Foreign currency – long-term bank deposits A3Foreign currency – short-term bank deposits Prime-2outlook – foreign currency deposit rating stableNational scale rating – long-term deposits Aa2.zaNational scale rating – short-term deposits Prime-1.zaoutlook – national scale rating stable
fItCH rAtINGSFitch Ratings (Fitch) affirmed its ratings for Nedbank Group and Nedbank limited. Below is the ratings-related outlook at July 2010.
FiTch raTinGS nedbank GrOuP nedbank liMiTedJuly 2010 July 2010
Individual C Csupport 2 2Foreign currencyshort-term F2 F2long-term BBB BBBlong-term rating outlook stable stablelocal currencylong-term senior BBB BBBlong-term rating outlook stable stablenationalshort-term F1+ (zaf) F1+ (zaf)long-term AA- (zaf) AA- (zaf)long-term rating outlook stable stable
6 Nedbank Risk FA.indd 195 22/03/2011 12:07 PM
NEDBANK GROUP LimitED iNtEGRAtED REPORt 2010196
ENTERPRISE GOVERNANCE AND COMPLIANCE
This governance framework entails far more than compliance with legislation, and has been developed with the aim of enabling Nedbank Group to attain a number of very clear objectives and goals, which include:
• Maximising efficiency and profitability within acceptable risk parameters.
• Implementing the group’s strategy within defined compliance requirements.
• Adhering to correct and proper corporate behaviours.
• Balancing, within a framework of effective accountability, the interests of shareholders and other stakeholders who may be affected by the conduct of directors or executives of the group.
• Minimising or avoiding conflicts of interest between the business interests of the group and personal interests of directors or executives.
• Disclosing matters that are material to the business of the group or the interests of stakeholders timeously and accurately.
• Balancing conformance with governance constraints and an entrepreneurial spirit appropriately.
• Achieving balanced and integrated economic, environmental, social and cultural performance (integrated sustainability) and implementing integrated sustainability across the business.
• Ensuring the efficient and effective functioning of the Enterprisewide Risk Management Framework.
• Complying in substance, not just in form, with the provisions of the Code of Corporate Practices and Conduct of the King III Report on Corporate Governance 2010 and the main acts and regulations affecting the financial services industry.
Adherence to King iiiIntegral to Nedbank Group’s commitment to good governance is compliance with recognised best-practice codes worldwide. King III is recognised as the definitive code for listed and unlisted companies in South Africa and is, therefore, the main code of conduct to which Nedbank Group and its subsidiaries subscribe.
Since the inception of King III in March 2010, Nedbank Group has endeavoured to apply the principles of King III and has reviewed its practices against these principles. Where King III practices or principles are not applied within the business, this is clearly explained to stakeholders and, where necessary, other controls put in place to ensure good governance.
In 2010 the board was satisfied with the group’s compliance with King III and its explanation of instances where alternative governance had been put in place. During 2010 the group implemented further enhanced compliance to King III in the following areas:
• A board ethics statement was introduced for review by the board on an annual basis. In addition awareness was created of the group’s Code of Conduct that incorporates the Code of Ethics and the Conflicts of Interest Policy.
• An integrated sustainability strategy and supporting business plans were submitted and approved by the Group Executive Committee, with the integrated report and the group’s support of the Equator Principles being examples of effective collaboration with stakeholders on integrated sustainability.
• A board continuity programme is in place that addresses the skills, experience and other qualities required for the effective functioning of the board, processes around the selection and appointment of directors, induction and ongoing training of directors, evaluation of directors’ performance, and directors’ succession planning. Succession planning for non-executive directors is discussed and monitored by the Group Directors’ Affairs Committee on an ongoing basis.
• With regards to board composition, at 31 December 2010 altogether 14 of the 17 boardmembers were non-executives, with eight of these being independent (57%).
• Board evaluations are completed and charters reviewed annually.
The Nedbank Risk Appetite Policy takes a ‘zero tolerance’ approach to compliance risk. The Compliance Policy takes this stance even further by mandating compliance with all regulatory requirements. Compliance is monitored via the Group Directors’ Affairs Committee, a board committee established in terms of the Banks Act, 94 of 1990.
Group Audit Committee members are elected by shareholders and the board.
explAnAtion of non-Adherence with King iii And AlternAte governAnce Applied• The current Chairman is not independent as defined by the
governance codes as he also serves on the board of the group’s parent company, Old Mutual plc. The Chairman is also a shareholder and director of Aka Capital, one of the partners
AS PART OF ITS COMMITMENT TO SuSTAINABLE OPERATIONS AT EvERy LEvEL, NEDBANK GROuP OPERATES WIThIN A CLEARLy DEFINED GOvERNANCE FRAMEWORK ThAT DEFINES ALL GOvERNANCE AND COMPLIANCE ASPECTS OF ThE ORGANISATION. ThIS FRAMEWORK INCLuDES GOvERNANCE STRuCTuRES ThAT ARE STRATEGICALLy LINKED TO ENTERPRISEWIDE PERFORMANCE MANAGEMENT, ThEREBy ENCOuRAGING AND ENABLING CLuSTERS AND BuSINESS uNITS TO FOCuS ON KEy REquIREMENTS.
7 Nedbank EG&C FA.indd 196 22/03/2011 12:07 PM

OvERvIEW GROuP REPORTS
OPERATIONAL OvERvIEW
SuSTAINABLE DEvELOPMENT PERFORMANCE
RISK, GOvERNANCE AND COMPLIANCE
197
in the Nedbank Eyethu black economic empowerment (BEE) transaction. Recognising and responding to this aspect of non-adherence, an independent director, Chris Ball, was appointed to fulfil the role of lead independent director in 2007.
• The board of directors has deliberated over the King III requirement that non-executive remuneration should comprise a base fee and an attendance fee per meeting. The board is of the view that this requirement is less pertinent to non-executive directors of Nedbank Group due to the responsibilities associated with being a director of a bank and the requirement for boardmembers to provide input on an ongoing basis, over and above attendance of board meetings.
UK combined codeNedbank Group is listed as a SA company on JSE Limited, however, the group is required to apply codes and practices applicable to its parent company, Old Mutual plc. Old Mutal plc subscribes to the uK Combined Code and, as its subsidiary, Nedbank Group strives to adhere to this code. Below are the current main areas of non-compliance:
• As stated previously, the group Chairman, Reuel Khoza, is a non-executive director but not independent. Recognising that the Chairman is not an independent director, and in line with the recommendations of the uK Combined Code, the position of senior independent director was created in 2007, with this position currently being held by Chris Ball. however, Mr Ball sits on more than one committee, which is also not in line with the code. The board is of the opinion that it is both efficient and effective
for the same independent director to be a member of most boardcommittees in order to assist the committees in avoiding any duplication of their activities and ensure that important issues are not overlooked.
• The uK Combined Code recommends that half of the board, excluding the Chairman, should be independent to provide the necessary checks and balances and to ensure that the bank operates in a safe and sound manner. At 31 December 2010 the Nedbank Group board consisted of eight independent directors out of 17 directors (excluding the Chairman). A vacancy exists and will be filled when an appropriate candidate is secured.
• The uK Combined Code identifies crossdirectorships as relationships that could appear to affect the independence of directors. The following crossdirectorships exist within the Nedbank Group board that affect the independent directors:
Director Additional directorship
Mustaq Enus-Brey Life healthcare Group holdings Limited
Joel Netshitenzhe Life healthcare Group holdings Limited
independence of directorsThe board is of the view that the non-executive directors all have a high degree of integrity and credibility, and the strong independent composition of the board provides for independent and objective input into the decisionmaking process, thereby ensuring that no one director holds unfettered decisionmaking powers.
7 Nedbank EG&C FA.indd 197 22/03/2011 12:07 PM

NEDBANK GROUP LimitED iNtEGRAtED REPORt 2010198
The Commonwealth Business Council (CBC)-African Business Awards is the key annual event for the African business world and its accolades are much sought after by Africa’s leading companies and entrepreneurs. Organised by African Business magazine and the CBC, it is a platform to celebrate excellence and best practices in African business and recognises those who are driving Africa’s rapidly transforming economy. The aim of the awards is to recognise business leaders and companies that have excelled in Africa over the past year. The winners will have made an outstanding contribution to the development of the continent, the economic aspirations of its citizens and the transformation of Africa’s image in international markets. high profile business and industry representatives, entrepreneurs, government officials and diplomats from Africa, Asia, Europe and the united States gather once a year at the CBC-African Business Awards to honour the achievements of the business community in Africa. Nedbank Group has won the award for ‘Best Corporate Governance’ at the African Business Awards 2010 after the group had submitted its first entry for corporate governance in April 2010.
bEST CORPORATE GOvERNANCE
During 2010 the board formally assessed the status of the Nedbank Group independent non-executive directors and satisfied itself that these boardmembers met the criteria of independent directors in terms of King III. The directors come from diverse backgrounds and bring to the board a wide range of experience in commerce, industry and banking. The directors have access to management whenever required.
boArd Appointments And evAlUAtionsBoard appointments and evaluations are conducted in a formal and transparent manner, in line with the board appointment policy. This process is undertaken by the board as a whole, assisted by the Group Directors’ Affairs Committee.
Any appointments to the Nedbank Group board are made with due cognisance of the need to ensure that the board comprises a diverse range of skills, knowledge and expertise, the requisite independence, appropriate demographic representation, and a relevant balance between skills and expertise and the professional and industry knowledge necessary to meet the group’s strategic objectives. Directors are given no fixed term of appointment, while executive directors are subject to short-term notice periods. An executive director is required to retire from the board at age 60, while a non-executive director is required to retire at age 70, unless otherwise agreed.
Reappointment of non-executive directors is not automatic. Executive directors are discouraged from holding a large number of directorships outside the group. An independent appraisal of the boards of Nedbank Group Limited and Nedbank Limited was undertaken in 2010. The appraisal included an evaluation of the effectiveness of the board committees, and evaluations of the
Chairman as well as other boardmembers individually. These were all conducted on a questionnaire basis and the boards have received full feedback, which will inform their actions regarding areas for further improvement. An assessment of the board’s performance by management was included in the process.
The Chief Executive’s performance is also evaluated according to his performance scorecard, which is approved annually by the Group Remuneration Committee, with the input of the Group Chairman and Old Mutual plc. The feedback from this board evaluation process contributes to the production of the Regulation 39(18) Report addressing the state of corporate governance in the organisation.
the boArd of directorsROLE AND cOmPOsitiONIn line with the recommendations of King III Nedbank Group has a unitary board structure. At 31 December 2010 the Nedbank Group board comprised 17 directors as follows:
iNDEPENDENt NON-ExEcUtivE DiREctORs (8)• Chris Ball• Thenjiwe Chikane• Prof Brian Figaji• Alan Knott-Craig• Wendy Lucas-Bull• Nomavuso Mnxasana• Joel Netshitenzhe• Malcolm Wyman
NON-ExEcUtivE DiREctORs (6)• Tom Boardman• Mustaq Enus-Brey• Don hope• Dr Reuel Khoza (Chairman)• Julian Roberts• Gloria Serobe
ExEcUtivE DiREctORs (3)
• Mike Brown (Chief Executive)• Graham Dempster (Chief Operating Officer)• Raisibe Morathi (Chief Financial Officer)
chAiRmAN AND chiEf ExEcUtivEIn line with best practice the roles of Chairman and Chief Executive are separate. The Chairman, Reuel Khoza, leads the board and the executive management of the group is the responsibility of the Chief Executive, Mike Brown. This ensures a balance of authority and power, so that no one individual has unrestricted decisionmaking powers. At the same time the board and executive management work closely together in determining the strategic objectives of the group.
cOmPANy sEcREtARy AND DiREctOR DEvELOPmENtAll directors have access to the advice and services of the Company Secretary, the Chief Governance and Compliance Officer and the Chief Risk Officer, who are responsible for ensuring that board procedures and applicable rules and regulations are fully observed. Further to this the board has an established procedure in the furtherance of its duties, whereby directors may obtain independent professional advice at the group’s cost.
New directors are informed of their duties and responsibilities by way of induction courses, which are presented by the Company Secretary
7 Nedbank EG&C FA.indd 198 22/03/2011 12:07 PM
OvERvIEW GROuP REPORTS
OPERATIONAL OvERvIEW
SuSTAINABLE DEvELOPMENT PERFORMANCE
RISK, GOvERNANCE AND COMPLIANCE
199
and other experts on board effectiveness, corporate governance, risk management, banking and other technical subjects.
A formal, ongoing director development programme focuses on keeping all members of the board and board committees up to date with local and international industry developments, technology issues, risk management and corporate governance best practice. All business cluster heads also undertake regular presentations to update the board on progress and key issues in their businesses.
In accordance with board policy, as well as the South African Reserve Bank requirement that all directors should continue with formal and informal development, the directors have participated in training initiatives, internally and externally.
sUccEssiON PLANNiNGSuccession planning is an important focus area at board, executive and senior management level. Detailed and intensive planning is conducted through the Chairman’s Office in consultation with the Group Directors’ Affairs and Group Remuneration Committees. The Chief Executive is required to report regularly to the board on the group’s management development and employment equity programmes.
BOARD mEEtiNGsThe Nedbank Group board met 10 times in 2010. The record of attendance at all 2010 board and board committee meetings for Nedbank Group Limited and Nedbank Limited is included at the end of this Enterprise Governance and Compliance Report on page 202.
BOARD chARtERThe board has a formal written charter that is reviewed on an annual basis. In terms of this charter the main functions of the board are as follows:
• Determining the overall objectives for the group.
• Developing strategies to meet those objectives in conjunction with management.
• Formulating company policies.
• Rating the group’s own performance.
• Assuming overall responsibility for risk management.
• Appointing a chief executive for the group.
• Evaluating the performance of the group’s directors.
The charter also formalises policies regarding board membership and composition, board procedures, the conduct of directors, risk management, remuneration, board evaluation and induction.
BOARD cOmmittEEsThe board committee structure is designed to assist the board in the discharge of its duties and responsibilities, and was largely unchanged during 2010. Each board committee has formal written terms of reference that are reviewed on an annual basis and effectively delegated in respect of certain of the board’s responsibilities. The board monitors these responsibilities to ensure effective coverage of, and control over, the operations of the group.
The directors confirm that the committees functioned in accordance with these terms of reference during the financial year under review. With the exception of the Group Directors’ Affairs and Group Finance and Oversight Committees, there are several relevant group executive management committees that support, and are aligned with, the board committees.
Except for the Executive Credit Committee that is chaired by an independent non-executive director, Ms Wendy Lucas-Bull, as required by banking regulation, all group executive committees are chaired by members of Group Executive Committee (Exco).
During 2010 the following board committees operated within Nedbank Group:
The Group Information Technology (IT) CommitteeThe Group IT Committee has the broad responsibility to monitor all issues pertaining to IT, both operational and strategic, and aims to ensure alignment of IT development spend and investment with overall group strategy and direction.
Group Audit Committee (GAC)The GAC assists the board in its evaluation and review of the adequacy and efficiency of the internal control systems, accounting practices, information systems and auditing processes applied within Nedbank Group, and introduce measures to enhance the credibility and objectivity of financial statements and reports prepared.
Group Credit Committee (GCC)The GCC is tasked with the approval of the group’s credit philosophy and policies, the setting of credit limits and guidelines, confirmation of procedures to manage, control and price credit risk, approval of the adequacy of interim and year-end provisions impairments and monitoring of credit risk information, processes and disclosure. The Large-exposure Approval Committee approves large credit exposures as defined by banking legislation.
Group Directors’ Affairs Committee (DAC)The DAC considers, monitors and reports to the board on reputational and compliance risk, compliance with King III and the corporate governance provisions of the Banks Act. It also acts as the nominations committee for board appointments.
Group Finance and Oversight Committee (GFOC)The chairmen of the GAC, GCC, Group Risk and Capital Management Committee (GRCMC) and IT Committee, as well as Don hope, are members of this committee, with the Chief Risk Officer attending by invitation. Its primary function is to provide a board discussion forum for the consideration of risks within the group, and to ensure that the board and the various board committees address those risks effectively.
Group Remuneration Committee (GRC)This committee consists of non-executive directors only and is chaired by an independent non-executive director. The GRC is authorised to approve aggregate adjustments to remuneration of employees below executive director and managing executive levels. The committee also recommends adjustments to the total remuneration of members of Group Exco. The board, following recommendations made by the Group Remuneration Committee, approves the Group Executive Committee members’ total remuneration. This committee is also charged with the supervision of the Nedbank Group Employee Incentive Scheme.
GRCMCIn terms of the Banks Act a risk committee is required to assist the board of directors in:
• Evaluating the adequacy and efficiency of risk policies, procedures, practices and controls.
• Identifying the buildup and concentration of risk.
enterprise governAnce And compliAnce
7 Nedbank EG&C FA.indd 199 22/03/2011 12:07 PM
NEDBANK GROUP LimitED iNtEGRAtED REPORt 2010200
• Developing risk mitigation techniques.
• Ensuring formal risk assessment.
• Identifying and monitoring key risks.
• Facilitating and promoting communication through reporting
structures.
• Ensuring the establishment of an independent risk management
function and other related functions.
The GRCMC complies with these requirements and oversees
the group’s risk management policies and procedures to ensure
compliance with Basel II, which became fully effective in 2008. The
GRCMC is tasked with groupwide risk monitoring, focusing primarily
on the management and assessment of risk, including:
• market and trading risks;
• asset and liability management risks;
• processes and functions of the Group Asset and Liability and
Executive Risk Committee;
• investment exposures; and
• risks related to the underwriting of share issues.
Group Transformation and Sustainability Committee (GTSC)
The GTSC has broad responsibility to monitor all issues pertaining
to the integrated economic, environmental, social and cultural
sustainability of the group. The committee also monitors progress
made against the performance contracts with black business
partners in terms of the Eyethu BEE transaction and assists the board
in ensuring that the group proactively addresses the requirements
and/or recommendations for integrated sustainability reporting as
set out in King III and the Global Reporting Initiative.
iNtERNAL AUDit
Group Internal Audit (GIA) is a centralised independent assurance
function, the purpose, authority and responsibility of which are
formally defined in a charter approved by the board in line with
stipulations of the Institute of Internal Auditors. GIA reports on
its assessment of the adequacy and effectiveness of the group’s
risk management, internal controls and governance processes at
meetings of GAC and other board committees charged with risk
monitoring.
The chief internal auditor reports functionally to the Chairman of
the Audit Committee and administratively to the Chief Executive.
GIA also works closely with Group Risk and Enterprise Governance
and Compliance to ensure that audit issues of a risk management,
ethical or governance nature are made known and are appropriately
resolved.
GIA has dedicated teams that perform internal audits in the group’s
various business operations, subsidiaries and joint ventures. Audits
are conducted according to a risk-based approach, and the audit plan
is approved by GAC and updated quarterly to reflect any changes in
the risk profile of the group.
A TALE OF EThICS AND ACCOuNTABILITy
At Nedbank Group we recognise that the employment of a new
staffmember, manager or director is more than a contract – it
represents a significant fiduciary relationship. In return for agreed
compensation and benefits the Nedbank Group employee promises
to render appropriate services in good faith and in a way that helps
to build a relationship of trust.
To this end Nedbank Group requires all its employees to uphold high
ethical standards, which not only serve the interests of the bank and
its clients, but also build its reputation as an organisation that always
does the right thing.
Over the past five years the Enterprise Governance and Compliance
Division has applied itself to establishing a solid ethical foundation
across the group, including the revision of the Nedbank Board Ethics
Statement, the creation of a userfriendly Nedbank Code of Conduct,
and the development of a Nedbank Pledge for agreement by all
staffmembers and directors.
Considerable work has also gone into mentoring and guiding more
than 10 000 employees in adopting and applying ethical business
practices as well as the development of dedicated channels to
reinforce positive, values-driven behaviour.
There is no right way to do the wrong thing
This simple, but undeniable truth lies at the heart of the ethics
culture across Nedbank Group and has resulted, often directly, in
many measureable achievements, possibly the most important of
which are employees who:
• feel empowered to identify and report instances of fraud and
misconduct;
• think before they act – thereby steadily decreasing instances of
misconduct;
• have a passion for caring for communities and conserving the
environment; and
• share their employer’s vision of becoming the most admired
bank in Africa and are committed to realising this vision through
integrity and accountability.
buIlDING AFRICA’S MOST ADMIRED BANK
7 Nedbank EG&C FA.indd 200 22/03/2011 12:07 PM
OvERvIEW GROuP REPORTS
OPERATIONAL OvERvIEW
SuSTAINABLE DEvELOPMENT PERFORMANCE
RISK, GOvERNANCE AND COMPLIANCE
201
other committees thAt Are vitAl to the ApplicAtion of soUnd governAnce principles within nedbAnK groUp
The Executive Information Technology Committee
Assists Group Exco in ensuring that Nedbank Group has a well-coordinated, efficient, effective and properly resourced IT strategy that enables the organisation to remain highly competitive.
The Group Asset and Liability and Executive Risk Committee
Responsible for ensuring effective management of the following:• Liquidity risk.• Capital management risk.• Interest rate risk, both local and foreign.• Investment risk.• Market risk, including – – currency translation risk; and – trading market risk and financial instruments used for purposes other than trading (eg balance sheet hedges and investments).
The Mergers and Acquisitions Steering Committee
Ensures proper corporate governance, oversight and control of corporate actions taken by the group.
The Executive Transformation and human Resources Committee
Tasked with: • Statutory compliance in respect of labour legislation.• Monitoring of transformation progress and the implementation of the Financial Sector Charter and Department
of Trade and Industry requirements• Nedbank Group employee recruitment, selection, remuneration, performance management, maintenance, training, development and, where necessary, termination.
The Executive Taxation Committee
Monitors tax compliance and tax policy and ensures the management of tax risk throughout the group in accordance with Nedbank Group’s tax policy.
The Nedbank Capital Investment Committee
Considers private equity and mezzanine equity investments and the underwriting of share issues, including initial approval, periodic reviews and any material changes.
The Nedbank Corporate Property Investment Committee
Considers private equity investments in client-driven property ventures and strategic investments in the listed-property sector and allied service companies, including initial approval, periodic reviews and any material changes.
The Business Risk Management Forum
Provides leadership in assessing the impact of any new regulatory requirements and legislation across Nedbank Group and promoting, directing and overseeing the successful implementation thereof.
The Executive Credit Committee
Approves and monitors all material aspects of the group’s Advanced Internal Ratings-based credit system, and receives regular reporting thereon. This committee also reviews and approves any changes to the bank’s AIRB Credit Framework and policies.
The Nedbank Brand Committee
Assists Group Exco in: • Monitoring and reporting on brand health and the repositioning of the Nedbank brand.• Revising and amending the master brand repositioning plan in the context of group strategy.• Approving strategies for key brand-building campaigns, programmes or initiatives.
The Nedbank Brand Committee (continued)
• Performing strategic reviews of competitor positioning and marketing initiatives.• Ensuring alignment and coordination of groupwide marketing activities in respect of business and brand strategy.• Optimising groupwide marketing spend, including monitoring and reporting on investment and making strategic recommendations on optimal investment.• Ensuring consistency in the application of marketing policies and processes.
Group Operational Risk Committee
Main aims include:• Providing a group executive governance structure for the oversight of the implementation of the Operational
Risk Management Framework and to recommend any changes for approval to the GRCMC.• Ensuring senior management oversight for any changes to operational risk capital requirements and recommend
any changes to Group Exco and to GRCMC for approval.
The Group Sustainability Committee
The Group Sustainability Committee has been establised for:• Providing assurance to the Group Executive Committee and GTSC that the group’s integrated sustainability
strategy is being successfully implemented.• Facilitating integrated sustainability coordination, alignment and innovation.• Serving as custodians of the group’s sustainability brand and strategy.
Nedbank Group subscribes to the Code of Banking Practice of The
Banking Association South Africa, which governs all relationships
with authorities, clients, competitors, employees, shareholders,
local communities and other primary stakeholders. Appropriate
procedures and mechanisms are in place to ensure full adherence
to the code and the group works with the Banking Ombudsman’s
Office to ensure that client complaints are resolved appropriately
and timeously.
wORkING TOGEThER FOR ThE BENEFIT OF ALL
enterprise governAnce And compliAnce
7 Nedbank EG&C FA.indd 201 22/03/2011 12:07 PM
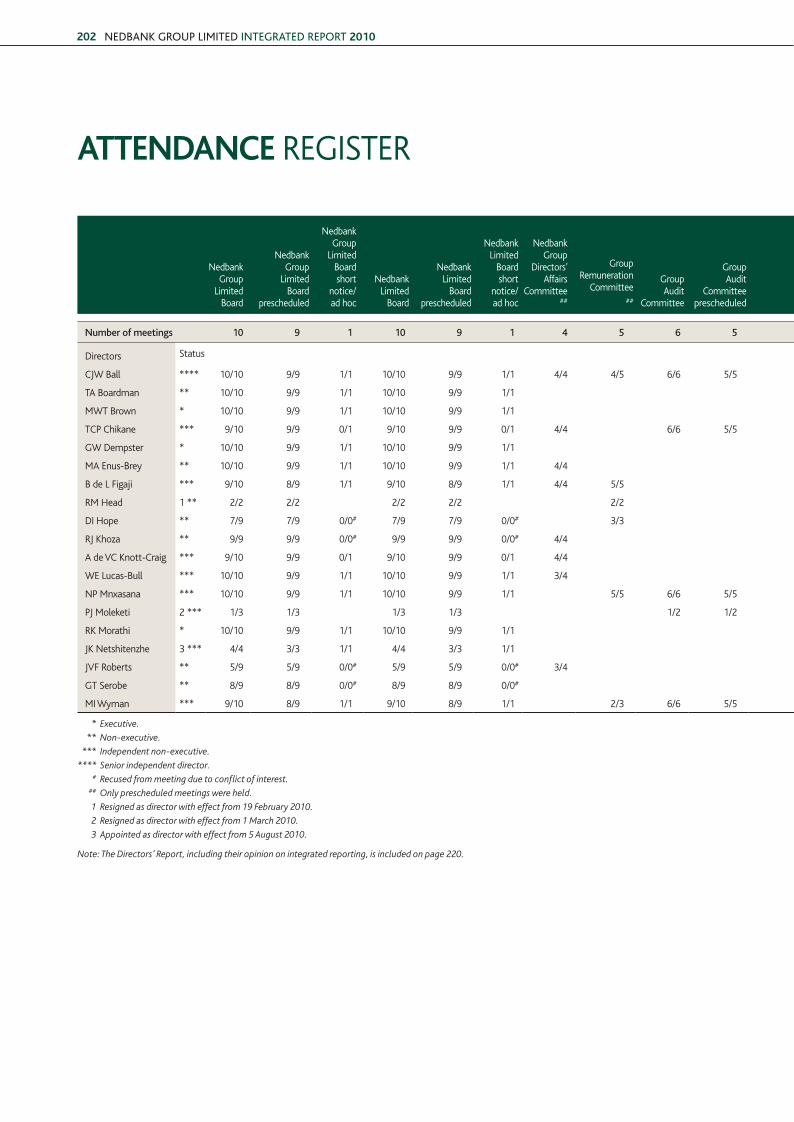
NEDBANK GROUP LimitED iNtEGRAtED REPORt 2010202
ATTENDANCE REGISTER
NedbankGroup
LimitedBoard
Nedbank Group
Limited Board
prescheduled
Nedbank Group
Limited Boardshort
notice/ad hoc
NedbankLimited
Board
Nedbank Limited
Boardprescheduled
NedbankLimited
Boardshort
notice/ad hoc
NedbankGroup
Directors’ Affairs
Committee##
Group Remuneration
Committee##
Group Audit
Committee
Group Audit
Committee prescheduled
Group Audit Committeeshort notice
Group ITCommittee
##
GroupCredit
Committee# #
Large-exposureApproval
Committeeshort notice/
ad hoc
Nedbank Group
Risk and Capital
ManagementCommittee
Nedbank Group
Risk and Capital
Management Committee
prescheduled
Nedbank Group Risk and Capital
Management Committee
short notice/ad hoc
GroupTransformation
and Sustainability
Committee
GroupTransformation
and Sustainability
Committeeprescheduled
GroupTransformation
and Sustainability
Committeeshort notice/
ad hoc
Group Finance and
Oversight Committee
##
number of meetings 10 9 1 10 9 1 4 5 6 5 1 4 4 4 5 4 1 5 4 1 4
Directors Status
CJW Ball **** 10/10 9/9 1/1 10/10 9/9 1/1 4/4 4/5 6/6 5/5 1/1 4/4 4/4 2/4 5/5 4/4 1/1 4/5 4/4 0/1 4/4
TA Boardman ** 10/10 9/9 1/1 10/10 9/9 1/1 3/4 3/3 3/4
MWT Brown * 10/10 9/9 1/1 10/10 9/9 1/1 4/4
TCP Chikane *** 9/10 9/9 0/1 9/10 9/9 0/1 4/4 6/6 5/5 1/1 4/4 5/5 4/4 1/1
GW Dempster * 10/10 9/9 1/1 10/10 9/9 1/1
MA Enus-Brey ** 10/10 9/9 1/1 10/10 9/9 1/1 4/4 4/4 4/4 5/5 4/4 1/1 4/4
B de L Figaji *** 9/10 8/9 1/1 9/10 8/9 1/1 4/4 5/5 3/4 2/4 5/5 4/4 1/1
RM head 1 ** 2/2 2/2 2/2 2/2 2/2 1/1 1/1 1/1
DI hope ** 7/9 7/9 0/0# 7/9 7/9 0/0# 3/3 5/5 4/4 1/1 4/4
RJ Khoza ** 9/9 9/9 0/0# 9/9 9/9 0/0# 4/4
A de vC Knott-Craig *** 9/10 9/9 0/1 9/10 9/9 0/1 4/4 4/4 5/5 4/4 1/1 4/4
WE Lucas-Bull *** 10/10 9/9 1/1 10/10 9/9 1/1 3/4 3/4 2/3# 3/5 3/4 0/1 3/4
NP Mnxasana *** 10/10 9/9 1/1 10/10 9/9 1/1 5/5 6/6 5/5 1/1 5/5 4/4 1/1
PJ Moleketi 2 *** 1/3 1/3 1/3 1/3 1/2 1/2 0/1 0/1 0/1
RK Morathi * 10/10 9/9 1/1 10/10 9/9 1/1 3/4
JK Netshitenzhe 3 *** 4/4 3/3 1/1 4/4 3/3 1/1
JvF Roberts ** 5/9 5/9 0/0# 5/9 5/9 0/0# 3/4
GT Serobe ** 8/9 8/9 0/0# 8/9 8/9 0/0# 4/4 1/4 5/5 4/4 1/1
MI Wyman *** 9/10 8/9 1/1 9/10 8/9 1/1 2/3 6/6 5/5 1/1
* Executive.
** Non-executive.
*** Independent non-executive.
**** Senior independent director.
# Recused from meeting due to conflict of interest.
## Only prescheduled meetings were held.
1 Resigned as director with effect from 19 February 2010.
2 Resigned as director with effect from 1 March 2010.
3 Appointed as director with effect from 5 August 2010.
Note: The Directors’ Report, including their opinion on integrated reporting, is included on page 220.
7 Nedbank EG&C FA.indd 202 22/03/2011 12:07 PM
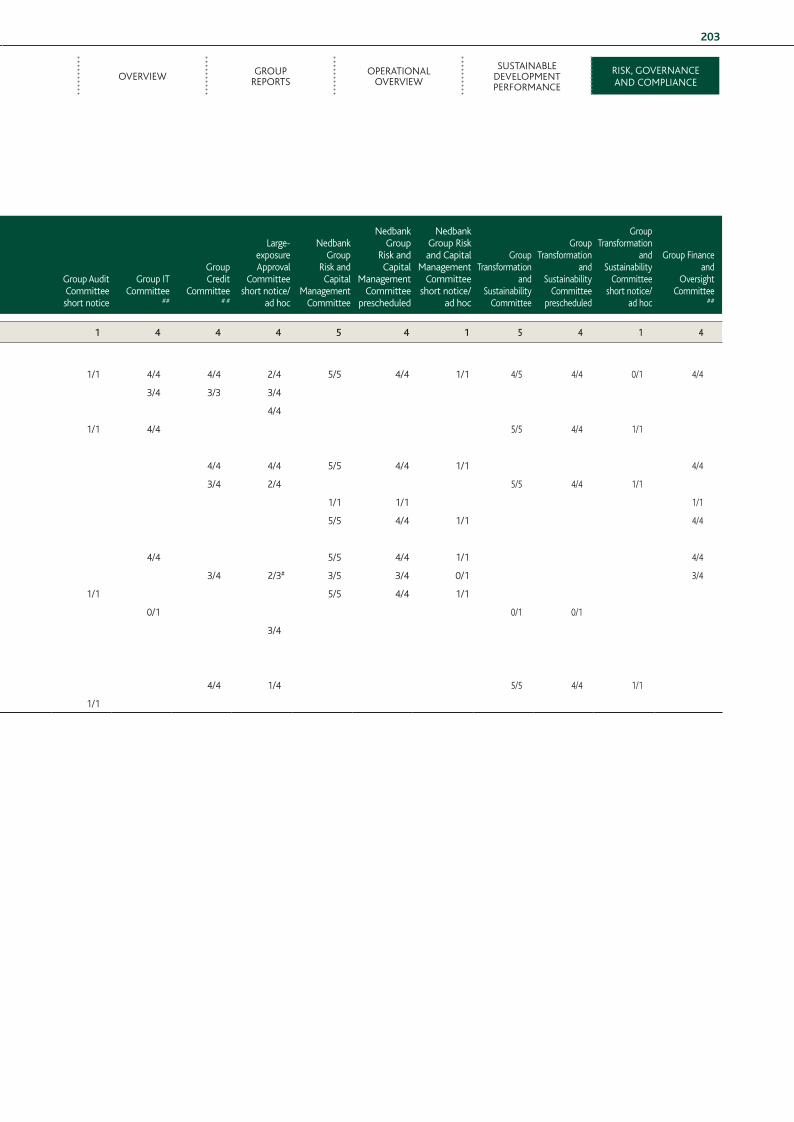
OvERvIEW GROuP REPORTS
OPERATIONAL OvERvIEW
SuSTAINABLE DEvELOPMENT PERFORMANCE
RISK, GOvERNANCE AND COMPLIANCE
203
NedbankGroup
LimitedBoard
Nedbank Group
Limited Board
prescheduled
Nedbank Group
Limited Boardshort
notice/ad hoc
NedbankLimited
Board
Nedbank Limited
Boardprescheduled
NedbankLimited
Boardshort
notice/ad hoc
NedbankGroup
Directors’ Affairs
Committee##
Group Remuneration
Committee##
Group Audit
Committee
Group Audit
Committee prescheduled
Group Audit Committeeshort notice
Group ITCommittee
##
GroupCredit
Committee# #
Large-exposureApproval
Committeeshort notice/
ad hoc
Nedbank Group
Risk and Capital
ManagementCommittee
Nedbank Group
Risk and Capital
Management Committee
prescheduled
Nedbank Group Risk and Capital
Management Committee
short notice/ad hoc
GroupTransformation
and Sustainability
Committee
GroupTransformation
and Sustainability
Committeeprescheduled
GroupTransformation
and Sustainability
Committeeshort notice/
ad hoc
Group Finance and
Oversight Committee
##
number of meetings 10 9 1 10 9 1 4 5 6 5 1 4 4 4 5 4 1 5 4 1 4
Directors Status
CJW Ball **** 10/10 9/9 1/1 10/10 9/9 1/1 4/4 4/5 6/6 5/5 1/1 4/4 4/4 2/4 5/5 4/4 1/1 4/5 4/4 0/1 4/4
TA Boardman ** 10/10 9/9 1/1 10/10 9/9 1/1 3/4 3/3 3/4
MWT Brown * 10/10 9/9 1/1 10/10 9/9 1/1 4/4
TCP Chikane *** 9/10 9/9 0/1 9/10 9/9 0/1 4/4 6/6 5/5 1/1 4/4 5/5 4/4 1/1
GW Dempster * 10/10 9/9 1/1 10/10 9/9 1/1
MA Enus-Brey ** 10/10 9/9 1/1 10/10 9/9 1/1 4/4 4/4 4/4 5/5 4/4 1/1 4/4
B de L Figaji *** 9/10 8/9 1/1 9/10 8/9 1/1 4/4 5/5 3/4 2/4 5/5 4/4 1/1
RM head 1 ** 2/2 2/2 2/2 2/2 2/2 1/1 1/1 1/1
DI hope ** 7/9 7/9 0/0# 7/9 7/9 0/0# 3/3 5/5 4/4 1/1 4/4
RJ Khoza ** 9/9 9/9 0/0# 9/9 9/9 0/0# 4/4
A de vC Knott-Craig *** 9/10 9/9 0/1 9/10 9/9 0/1 4/4 4/4 5/5 4/4 1/1 4/4
WE Lucas-Bull *** 10/10 9/9 1/1 10/10 9/9 1/1 3/4 3/4 2/3# 3/5 3/4 0/1 3/4
NP Mnxasana *** 10/10 9/9 1/1 10/10 9/9 1/1 5/5 6/6 5/5 1/1 5/5 4/4 1/1
PJ Moleketi 2 *** 1/3 1/3 1/3 1/3 1/2 1/2 0/1 0/1 0/1
RK Morathi * 10/10 9/9 1/1 10/10 9/9 1/1 3/4
JK Netshitenzhe 3 *** 4/4 3/3 1/1 4/4 3/3 1/1
JvF Roberts ** 5/9 5/9 0/0# 5/9 5/9 0/0# 3/4
GT Serobe ** 8/9 8/9 0/0# 8/9 8/9 0/0# 4/4 1/4 5/5 4/4 1/1
MI Wyman *** 9/10 8/9 1/1 9/10 8/9 1/1 2/3 6/6 5/5 1/1
* Executive.
** Non-executive.
*** Independent non-executive.
**** Senior independent director.
# Recused from meeting due to conflict of interest.
## Only prescheduled meetings were held.
1 Resigned as director with effect from 19 February 2010.
2 Resigned as director with effect from 1 March 2010.
3 Appointed as director with effect from 5 August 2010.
Note: The Directors’ Report, including their opinion on integrated reporting, is included on page 220.
7 Nedbank EG&C FA.indd 203 22/03/2011 12:07 PM
NEDBANK GROUP LimitED iNtEGRAtED REPORt 2010204
NichOLAs ANDREw (39)Nedbank Wealth
Executive head: Asset Management 13 years’ service
GRAEmE AUREt (41)Nedbank Corporate
Managing Executive: Corporate Banking 7 years’ service
fRANK BERKELEy (54)Nedbank Corporate
Managing Executive: Property Finance 16 years’ service
sAm BhEmBE (42)Nedbank Corporate
Managing Executive: Nedbank Africa 5 years’ service
LUiGi BiANcO (42)Group Finance
General Manager: Planning, Measurement and Control 18 years’ service
LANcE BLUmERis (39)Nedbank Wealth
Chief Operating Officer: Life Insurance 13 years’ service
JAN BOsch (38)Nedbank Business Banking
Executive head: Specialist Services 13 years’ service
ANEL BOsmAN (44)Nedbank Capital
Executive head: Strategic Projects 9 years’ service
viNcE BOULLE (46)Nedbank Wealth
Executive head: Wealth Management (Local) 7 years’ service
AyN BROwN (45)Nedbank Business Banking
Executive head: human Resources 19 years’ service
michAEL BURNELL (59)Group Human Resources
hR Executive: Office of the Group Executive
40 years’ service
BRiGittE BURNEtt (43)Enterprise Governance and Compliance
head: Sustainability
11 years’ service
JOhN chEmALy (46)Nedbank Capital
Executive head: Global Markets 11 years’ service
BRENDA chEtty (36)Enterprise Governance and Compliance
head: Client Facing Clusters, FAIS and Special Projects 13 years’ service
RiAN cLOEtE (37)Group Finance
General Manager: Group Tax 7 years’ service
ANthONy cOstA (39)Business Performance Executive
9 years’ service
DAviD cREwE-BROwN (42)Nedbank Retail
Executive head: Finance, Projects and Strategy 16 years’ service
smit cROUsE (34)Ecobank Nedbank Alliance
Executive head: Ecobank Nedbank Strategic Business Alliance 2 years’ service
ANDREw cULBERt (48)Nedbank Wealth
Executive head: Insurance 24 years’ service
GiNA DAviDsON (35)Group Human Resources
hR Executive: Talent Management 10 years’ service
michAEL DAvis (39)Balance Sheet Management
Executive head: Group Asset, Liability and Capital Management 14 years’ service
hERmANUs DE KOcK (37)Nedbank Business Banking
Divisional Executive: Northern Business unit 8 years’ service
ANtON DE wEt (44)Nedbank Retail
Managing Executive: Personal Banking and Client value Management 13 years’ service
BEDREsh DhANJEE (40) Nedbank Business Banking
Executive head: Risk 21 years’ service
LiONEL DiAKANyO (35)Group Finance
Executive head: Risk and Compliance
9 years’ service
sicELwEsihLE DLAmiNi (42)Enterprise Governance and Compliance
head: Governance and Compliance Shared Services 8 years’ service
NhLAmULO DLOmU (34)Group Human Resources
hR Executive: Organisational Development 1 year service
BRiAN DUGUiD (49)Nedbank Retail
Managing Executive: Retail Banking Services 29 years’ service
ADRiAAN DU PLEssis (51)Nedbank Corporate
Executive head: Transactional Banking 19 years’ service
sAREL DU PLEssis (50)Group Human Resources
hR Executive: Rewards Management 17 years’ service
DENNis DyKEs (50)Strategic Planning and Economics
Group Chief Economist 27 years’ service
cRAiG EvANs (45)Nedbank Business Banking
Divisional Executive: Coastal and Inland Business unit 17 years’ service
ALAN fABER (46)Balance Sheet Management
Executive head: Strategic Projects and Execution 13 years’ service
PAUL fiNLAysON (42)Nedbank Wealth
Executive head: BoE Private Clients 13 years’ service
ANNEttE fRANcKE (36)Nedbank Business Banking
Executive head: Strategy, Marketing and Communication 5 years’ service
iAN fULLER (55)Group Finance
General Manager: Group Shared Services Centre 13 years’ service
GREGORy GARDEN (54)Marketing, Communications and Corporate Affairs
Group Brand Executive 12 years’ service
syDNEy GERicKE (52)Nedbank Retail
Managing Executive: Retail Card 22 years’ service
KERshiNi GOvENDER (37)Marketing, Communications and Corporate Affairs
Divisional Executive: Strategy and Alignment 8 years’ service
KONEhALi GUGUshE (35)Marketing, Communications and Corporate Affairs
Divisional Executive: Corporate Social Responsibility 3 years’ service
DhiREN hARiPERsAD (32)Balance Sheet Management
Executive head: Group value-based Management <1 year service
GREG hORtON (54)Nedbank Wealth
Executive head: Wealth Management (International) 16 years’ service
GLyNis hUNziKER (39)Group Risk
Chief Internal Auditor 15 years’ service
KEith hUtchiNsON (52)Nedbank Retail
Managing Executive: Retail Secured Lending 24 years’ service
NicK JAcOBs (45)Group Risk
General Manager: Group Risk Services 17 years’ service
BERtUs JANsE vAN RENsBURG (36)Nedbank Wealth
Acting Chief Risk Officer: Nedbank Wealth 5 years’ service
LOUis JANsE vAN vUUREN (52)Nedbank Wealth
Acting Executive head: Trust and Fiduciary (Local) 34 years’ service
ANthONy JOhNsON (33)Balance Sheet Management
Executive head: Group Credit Portfolio Management 6 years’ service
PAtiswA JUmBA (38)Nedbank Wealth
Executive head: human Resources 2 years’ service
CluSTER MANAGEMENT
7 Nedbank EG&C FA.indd 204 22/03/2011 12:07 PM
OvERvIEW GROuP REPORTS
OPERATIONAL OvERvIEW
SuSTAINABLE DEvELOPMENT PERFORMANCE
RISK, GOvERNANCE AND COMPLIANCE
205
GOOLAm KADER (44)Nedbank Business Banking
Divisional Executive: Cape Business unit
12 years’ service
GRANt KELLy (38)Nedbank Corporate
Executive head: Risk
6 years’ service
wiLLEm KRüGER (59)Group Risk
General Manager: Group Legal
36 years’ service
PEtER LANE (54)Nedbank Capital
Group Treasurer
21 years’ service
miLLicENt LEchABA (43)Nedbank Retail
Executive head: human Resources
5 years’ service
thABANG LEGAE (40)Group Technology
Divisional Executive: Retail Product Technology
3 years’ service
sUsAN LE ROUx (54)Nedbank Wealth
Executive head: Financial Planning
7 years’ service
DOUGLAs LiNEs (39)Nedbank Business Banking
Divisional Executive: Gauteng Business unit
10 years’ service
ANDREw LODGE (53)Nedbank Wealth
Executive head: Trust and Fiduciary (International)
15 years’ service
thANDO LUKhELE (37)Group Technology
Divisional Executive: Governance and Compliance
6 years’ service
shAmELLE mAhARAJ (38)Nedbank Corporate
Executive head : human Resources
13 years’ service
PAtRiciA mAqEtUKA (51)Group Technology
Divisional Executive: Wholesale Banking Technology
18 years’ service
wALtER mARtE (34)Nedbank Wealth
Chief Financial Officer: Nedbank Wealth
6 years’ service
BRADLEy mAxwELL (36)Nedbank Capital
Executive head: Investment Banking 9 years’ service
wAyNE mcADAm (50)Strategic Planning and Economics
head: Group Strategy 18 years’ service
DARRyL mcmULLEN (51)Group Finance
General Manager: Group Financial Control 23 years’ service
mOsEs mOchiNE (43)Group Human Resources
hR Executive: Industrial Relations, Transformation and Compliance 4 years’ service
shERALEE mORLAND (46)Group Risk
General Manager: Enterprisewide Risk Management 5 years’ service
ANDy mOthiBi (47)Group Risk
General Manager: Group Operational Risk Management 4 years’ service
mARyNA mOUtON (40)Enterprise Governance and Compliance
head: Governance and Ethics 15 years’ service
mAKhOsAzANA mPUNGOsE (32) Group Risk
Executive head: Group Risk human Resources5 years’ service
RAy NAicKER (34)Group Technology
Divisional Executive: Group Technology 10 years’ service
PRiyABAshNi NAiDOO (37)Nedbank Corporate
Executive head: Finance Strategy and Brand 10 years’ service
sEshAmURthi NAiDU (55)Nedbank Business Banking
Executive head: Innovation, Process and Project Integration 32 years’ service
DiON NAiR (35)Nedbank Wealth
Chief Operating Officer: Insurance Brokers 5 years’ service
siBONGisENi NGUNDzE (41)Nedbank Retail
Managing Executive: Retail Relationship Banking
7 years’ service
GAwiE NiENABER (59)Group Company Secretary
31 years’ service
ANNy PAchyANNis-ALmAN (55)Group Risk
General Manager: Group Market Risk Monitoring
14 years’ service
GAviN PAyNE (48)Nedbank Retail
Executive head: Retail Risk
27 years’ service
wiLLEm PREtORiUs (47)Balance Sheet Management
Executive head: Group Regulatory Reporting
27 years’ service
mEshAcK qAchA (47)Group Finance
human Resources Executive
17 years’ service
EUREKA REDELiNGhUys (51)Nedbank Capital
Executive head: Finance
6 years’ service
DEAN REtiEf (36)Group Human Resources
hR Executive: People Development
11 years’ service
mARK ROcK-PERRiNG (43)Marketing, Communications and Corporate Affairs
Divisional Executive: Market and Client Insights
12 years’ service
sAREL RUDD (55)Nedbank Retail
Managing Executive: Personal Loans
8 years’ service
iOLANDA RUGGiERO (39)Nedbank Wealth
Chief Operating Officer: Nedbank Wealth
9 years’ service
ANDREw sEmAtimBA (43)Group Technology
Divisional Executive: Africa Technology
9 years’ service
GLENN smith (52)Group TechnologyDivisional Executive: Retail Channel and Card Technology 14 years’ servicemURRAy stOcKs (44)Nedbank Corporate
Executive head: Corporate Shared Services 19 years’ serviceAshLEy sUttON-PRycE (57)Nedbank Retail and Business Banking Executive head human Resources: Retail and Business Banking 37 years’ serviceshENDRiK swANEPOEL (48)Group TechnologyDivisional Executive: Risk and Information Services 17 years’ servicesKANDis swANEPOEL (45)Nedbank Business BankingDivisional Executive: Strategic Business unit 14 years’ serviceJOhAN thERON (41)Group RiskChief Credit Officer 12 years’ servicetABBy tsENGiwE (39)Marketing, Communications and Corporate AffairsDivisional Executive: Group Communications 3 years’ serviceRENE vAN wyK (54)Nedbank Capital Executive head: Risk 11 years’ serviceANEEs vAzEER (41)Nedbank WealthChief Operating Officer: Short-term Insurance 4 years’ servicehEiNz wEiLERt (47)Nedbank Retail and Business BankingExecutive head: Innovation and Synergy Projects 9 years’ servicemARK wEstON (47)Nedbank CapitaluK Country head 20 years’ servicecOLiN whEAtER (57)Group TechnologyDivisional Executive: Information Technology Infrastructure and Operations 20 years’ serviceDANiEL zULU (47)Nedbank CapitalExecutive head: Information Technology, Projects and human Resources13 years’ service
7 Nedbank EG&C FA.indd 205 22/03/2011 12:07 PM
NEDBANK GROUP LimitED iNtEGRAtED REPORt 2010206
GlObAl REPORTING INITIATIVE FINANCIAL SERvICES SECTOR SuPPLEMENTgri fsss* topic pAge description
FS1 Description of policies with specific environmental and social components applied to business lines
66
95, 103, 105120136146196
Operational reviews: Nedbank Capital – Responsible-lending commitment ensures sustainable success for all.Sustainability development performance:• Environmental sustainability.• Social sustainability.• Cultural sustainability.Risk and balance sheet management review Enterprise governance and compliance
FS2 Description of procedures for assessing and screening environmental and social risks in business lines
66
95120136146196
Operational reviews: Nedbank Capital – Responsible-lending commitment ensures sustainable success for all.Sustainability development performance:• Environmental sustainability.• Social sustainability.• Cultural sustainability.Risk and balance sheet management review Enterprise governance and compliance
FS3 Description of processes for monitoring clients’ implementation of and compliance with environmental and social requirements included in agreements or transactions
96103113116117133
Sustainability development performance:• Stakeholder engagement.• Social and environmental risk management.• Leading through collaboration.• Greening the group’s supply chain.• Facilitating sustainability through products and services.• Preferential procurement.
FS4 Description of processes for improving staff competency to implement the environmental and social policies and procedures as applied to business lines
111112
177
200
Sustainability development performance:• Staff communication, training and engagement.• Training and related policy acknowledgements.Risk and balance sheet management review:Money-laundering, terrorist-financing and sanctions risk management, and fraud risk management.Enterprise governance and compliance: • Ethics case study.
FS5 Interactions with clients/investors/business partners regarding environmental and social risk and opportunities
96113126
Sustainability development performance: • Stakeholder engagement.• Leading through collaboration.• Consumer and sustainability education.
FS6 Percentage of the portfolio for business lines by specific region, size and sector
3
23
24
29
Performance highlights
Company structures
business profile
Operational footprint
Nedbank Group limited seven-year financial, environmental, social and cultural review – statistics and ratios
FS7 Monetary value of products and services designed to deliver a specific social benefit for each business
104117
130
2010 black Economic Empowerment (bEE) ReportSustainability development performance: • Environmental sustainability – Driving carbon reduction. – Facilitating sustainability through products and services. – Nedbank Affinity Programme review for 2010.• Social sustainability – Beyond compliance.
* Global Reporting Initiative Financial Services Sector Supplement.
7 Nedbank EG&C FA.indd 206 22/03/2011 12:07 PM
OvERvIEW GROuP REPORTS
OPERATIONAL OvERvIEW
SuSTAINABLE DEvELOPMENT PERFORMANCE
RISK, GOvERNANCE AND COMPLIANCE
207
gri fsss* topic pAge description
FS8 Monetary value of products and services designed to deliver a specific environmental benefit for each business line, broken down by purpose
104117113
Sustainability development performance: • Environmental sustainability – Driving carbon reduction – carbon credits for integrated sustainability. – Facilitating sustainability through products and services. – Leading through collaboration – The Green Trust.
FS9 Coverage and frequency of audits to assess implementation of environmental and social policies and risk assessment procedures
210 Independent assurance statement to the directors and management of Nedbank Group Limited.
Group Internal Audit: 2010 Sustainability review – report issued to management.
FS10 Percentage and number of companies held in the institution’s portfolio with which the reporting organisation has interacted on environmental and social issues
2329
Company structuresOperational footprint
FS11 Percentage of assets subject to positive and negative environmental and social screening 103
108116133
Sustainability development performance:• Social and environmental risk management.• Carbon footprint measurement.• Greening the group’s supply chain.• Preferential procurement.
FS12 voting policies applied to environmental and social issues for shares over which the reporting organisation holds the right to vote shares or advises on voting
Not applicable.
No organisations over which Nedbank holds the right to vote shares or advises on voting.
FS13 Access points in the low-populated or economically disadvantaged areas by type 77
130
Operational reviews:Nedbank Retail – delivering banking benefits through innovation and partnerships.Sustainability development performance:• Social sustainability – Beyond compliance.2010 bEE Report
FS14 Initiatives to improve access to financial services for disadvantaged people 113
117130
Sustainability development performance: • Leading through collaboration – external engagements and
environmental sustainability initiatives.• Facilitating sustainability through products and services.• Social sustainability – Beyond compliance.2010 bEE Report
FS15 Policies for the fair design and the sale of financial products and services. 177
177178178176
202
Risk and balance sheet management review:• Compliance and regulatory risk.• Money-laundering, terrorist-financing and sanctions risk management.• Information and technology risk.• People risk.• Financial crime.
Enterprise governance and compliance:• Ethics case study.
FS16 Initiatives to enhance financial literacy by type of beneficiary
126
Sustainability Development Performance:• Social sustainability – Consumer and sustainability education.2010 bEE Report
7 Nedbank EG&C FA.indd 207 22/03/2011 12:07 PM
NEDBANK GROUP LimitED iNtEGRAtED REPORt 2010208
INDEPENDENT ASSuRANCE REPORT TO ThE DIRECTORS OF NEDBANK LIMITED fOR thE yEAR ENDED 31 DEcEmBER
scope of oUr engAgements
PARt A
We have completed our independent reasonable assurance
engagement to enable us to express our reasonable assurance
conclusion on whether the following key performance indicators
(‘specified KPIs’) contained in the Nedbank Group Limited Integrated
Report’s Sustainable Development section (‘the Report’) for the
year ended 31 December 2010 have been prepared, in all material
respects, in accordance with the basis of preparation as described on
page 5 as part of the section headed ‘Independent assessment and
Global Reporting Initiative indices’ (‘management’s sustainability
criteria’):
1 The total rand value of donations paid by Nedbank Group
employees via deductions from their monthly salaries to the
South African Children’s Charity Trust for the 12 months ended
31 December 2010 as disclosed in the table headed ‘Payroll
Giving programme’ within the table row ‘2010 staff donations’
on page 124.
2 The total tonnes of paper used (purchased) by Nedbank Group
for the 12 months ended 31 December 2010 as disclosed in the
table headed ‘Nedbank South Africa performance targets’ under
the ‘Paper’ section of the table within the table row ‘Tonnes
used’ on page 110.
3 The total electricity consumed by the Nedbank campus sites in
kilowatt hours for the 12 months ended 31 December 2010 as
disclosed directly under the table headed ‘Nedbank South Africa
performance targets’ and preceded by an asterisk on page 110.
4 The total water consumed by the Nedbank campus sites in
kilolitres for the 12 months ended 31 December 2010 as
disclosed on page 106 as part of the section headed ‘Water’.
5 The total number of incidents raised by Nedbank Group
employees and handled by the Nedbank Group Internal
Ombudsman for the 12 months ended 31 December 2010 as
disclosed on page 138 as part of the section headed ‘Internal
Ombudsman’.
6 The total rand value of unexpected medical costs paid to
Nedbank Group employees from the holsboer Benefit Fund for
the 12 months ended 31 December 2010 as disclosed as part of
bullet number four of the bulleted list on page 140.
7 The total electricity consumed by the Nedbank Retail
branch sites in kilowatt hours for the 12 months ended
31 December 2010 as disclosed directly under the table headed
‘Nedbank South Africa performance targets’ and preceded by an
asterisk on page 110.
8 The total rand value of the donations made by Nedbank
Group to The Green Trust, from a selection of qualifying
Nedbank products, as a result of client use of these products
for the 12 months ended 31 December 2010 as disclosed
on page 113 as part of the section headed ‘Nedbank Green
Affinity and The Green Trust’.
9 The total rand value of the donations made by Nedbank Group
to the Nelson Mandela Children’s Fund, from a selection of
qualifying Nedbank products, as a result of client use of these
products for the 12 months ended 31 December 2010 as
disclosed directly under the bulleted list in the section headed
‘Examples of NMCF-supported projects include’ on page 127.
10 The total rand value of the donations made by Nedbank Group
to The Sports Trust, from a selection of qualifying Nedbank
products, as a result of client use of these products for the
12 months ended 31 December 2010 as disclosed directly under
the bulleted list in the section headed ‘The Nedbank Sport
Affinity and The Sports Trust’ on page 127.
11 The total rand value of the donations made by Nedbank Group
to the Arts & Culture Trust, from a selection of qualifying
Nedbank products, as a result of client use of these products for
the 12 months ended 31 December 2010 as disclosed directly
under the bulleted list in the section headed ‘The Nedbank Arts
Affinity and the Arts & Culture Trust’ on page 126.
12 The total rand value of corporate social investment spend by the
Nedbank Foundation for the 12 months ended 31 December 2010
as disclosed directly above the graph headed ‘Nedbank Foundation
CSI spend 2010 – by focus area’ and preceded by an asterisk on
page 120.
13 The total rand value of payment requisitions loaded for payment
to small and medium enterprises (SMEs) within seven days of
Nedbank Group receiving the invoice from the SMEs for the
12 months ended 31 December 2010 as disclosed on page 133
as part of the section headed ‘Preferential procurement’.
14 The total rand value of training spend on black Nedbank Group
employees (excluding contractors) for the 12 months ended
31 December 2010 as disclosed on page 143 as part of the
section headed ‘Training spend’.
15 The total number of qualifying bursaries awarded to Nedbank
Group employees from the External Bursaries Fund and managed
by the National Student Financial Aid Scheme for the 12 months
ended 31 December 2010 as disclosed on page 143 as part of
the section headed ‘Nedbank Bursary Scheme’.
7 Nedbank EG&C FA.indd 208 22/03/2011 12:07 PM
OvERvIEW GROuP REPORTS
OPERATIONAL OvERvIEW
SuSTAINABLE DEvELOPMENT PERFORMANCE
RISK, GOvERNANCE AND COMPLIANCE
209
16 The total rand value and total number of study grants provided to
Nedbank Group employees from the Study Grant Fund for the
12 months ended 31 December 2010 as disclosed on page 143 as
part of the section headed ‘Nedbank Bursary Scheme’.
17 The total rand value of internal bursaries awarded to Nedbank
Group employees from the Internal Bursary Fund for the
12 months ended 31 December 2010 as disclosed on page 143
as part of the section headed ‘Nedbank Bursary Scheme’.
PARt B
We have completed our independent limited assurance engagement
to enable us to express our limited assurance conclusion on whether
anything has come to our attention that causes us to believe that
the following specified KPIs contained in the Report for the year
ended 31 December 2010 have not been prepared, in all material
respects, in accordance with management’s sustainability criteria
as described on page 5 as part of the section headed ‘Independent
assessment and Global Reporting Initiative indices’:
1 The total scope 1, 2 and 3 emissions of Nedbank Group in
tonnes of carbon dioxide equivalent for the 12 months ended
31 December 2010 as disclosed in the table headed ‘Nedbank
Group GhG emissions inventory’ within the table row ‘Total
Nedbank Group emissions CO2e (tonnes)’ on page 109.
2 The total tonnes of paper collected for recycling from Nedbank
campus sites for the 12 months ended 31 December 2010 as
disclosed on page 106 as part of the section headed ‘Paper’.
3 The total water consumed by the Nedbank Retail branch sites
in kilolitres for the 12 months ended 31 December 2010 as
disclosed on page 106 as part of the section headed ‘Water’.
4 The total number of tipoffs received by Nedbank Group as a
result of the Nedbank Tip-Off Anonymous initiative for the
12 months ended 31 December 2010 as disclosed on page 177
in the paragraph headed ‘Internal and external whistleblowing
reporting lines’.
5 The total number of client complaints as recorded by the
Nedbank Group Client Compliant Tracker System for the
12 months ended 31 December 2010 as disclosed in the table
headed ‘Clients’ within the table row ‘Improve service levels to
worldclass standards’ on page 14.
6 The total rand value of donations paid by Nedbank Group
in accordance with its AskOnce Promise to Nedbank
Group-designated charities for the 12 months ended
31 December 2010 as disclosed in the section headed ‘AskOnce
Promise – drives service’ on page 77.
7 The total tonnes of general (domestic) waste collected from
Nedbank campus sites to be disposed of in landfills for the
12 months ended 31 December 2010 as disclosed on page 107
as part of the section headed ‘Waste and recycling’.
8 The total number, category and value (in uS dollars) of
Nedbank Group deals that qualify under the Equator Principles
and had their first drawdown for the 12 months ended
31 December 2010 as disclosed in the table headed ‘Total
Equator deals 2007 – 2010’ on page 67 and the information
indicated in bold green preceding the table.
PARt c
We have completed our independent limited assurance engagement
to enable us to express our limited assurance conclusion on
whether anything has come to our attention that causes us to
believe that the Report for the year ended 31 December 2010
has not been prepared, in all material respects, in accordance with
the self-declared Global Reporting Initiative G3 Guidelines A+
application level using the principles of materiality, completeness
and sustainability and in accordance with AccountAbility’s
AA1000APS (2008) using the principles of inclusivity, materiality and
responsiveness.
The specified KPIs noted in Part A and Part B have been emphasised
for identification purposes in the Report in bold green.
Our responsibility in performing our independent reasonable and
limited assurance engagements is to Nedbank Limited only and in
accordance with the terms of reference for these engagements as
agreed with it. To the fullest extent permitted by law we do not
accept or assume responsibility to anyone other than Nedbank
Limited for our work, for this report, or for the conclusions we have
reached.
Nedbank Limited has elected to prepare:
• The specified KPIs in accordance with management’s
sustainability criteria, of which a full copy can be obtained
as described on page 5 of the Report as part of the section
headed ‘Independent assessment and Global Reporting Initiative
indices’.
• The Report in accordance with the principles of the G3
guidelines published by the Global Reporting Initiative, of which
a full copy can be obtained from the Global Reporting Initiative
website.
• The Report in accordance with the principles of AA1000APS
(2008) published by AccountAbility, of which a full copy can be
obtained from the AccountAbility website.
7 Nedbank EG&C FA.indd 209 22/03/2011 12:07 PM
NEDBANK GROUP LimitED iNtEGRAtED REPORt 2010210
directors’ responsibilityThe directors are responsible for implementing a stakeholder
engagement process to identify all relevant stakeholders, to identify
key issues, to respond appropriately to key issues identified, to
determine those key performance indicators that may be relevant
and material to the identified stakeholders, and to design and apply
appropriate sustainability reporting policies. The directors are also
responsible for the preparation and presentation of the Report
and the information and assessments contained in the Report in
accordance with the relevant criteria. This responsibility includes
designing, implementing and maintaining appropriate performance
management and systems to record, monitor and improve the
accuracy, completeness and reliability of the sustainability data,
and to ensure that the information and data reported meet the
requirements of the relevant criteria and contain all relevant
disclosures that could materially affect any of the conclusions drawn.
AssUrAnce provider’s responsibilityOur responsibility is to express our assurance conclusions on the
Report and the specified KPIs in accordance with the scope of our
engagements, based on our independent reasonable and limited
assurance engagements. Our independent assurance engagements
were performed in accordance with the International Federation
of Accountants’ International Standard on Assurance Engagements
(ISAE) 3000 Assurance Engagements Other Than Audits or Reviews of
historical Financial Information. This standard requires us to comply
with ethical requirements and to plan and perform our engagements
to obtain the assurance required by the scope of our engagements,
as expressed in this report.
bAsis of worK And limitAtionsThe procedures selected depend on our judgement, including
the assessment of the risks of material misstatement of the
subject matter and the purpose of our engagement. In making
these assessments we have considered internal control relevant
to the entity’s preparation and presentation of the Report and
the information contained therein in order to design procedures
appropriate for gathering sufficient appropriate assurance evidence
to determine that the information in the Report is not materially
misstated or misleading, as set out in the summary of work
performed below. Our assessment of relevant internal control is not
for the purpose of expressing a conclusion on the effectiveness of
the entity’s internal controls.
We planned and performed our work to obtain all the information
and explanations that we considered necessary to provide a basis for
our assurance conclusions pertaining to the Report and the specified
KPIs, as expressed below.
Where a limited-assurance conclusion is expressed, our evidence-
gathering procedures are more limited than for a reasonable-
assurance engagement, and therefore less assurance is obtained than
in a reasonable-assurance engagement.
Our report does not extend to providing assurance on historical data,
unless specified in this report.
sUmmAry of worK performedSet out below is a summary of the procedures performed pertaining
to the Report and the specified KPIs that were included in the scope
of our assurance engagements:
• We obtained an understanding of –
− the entity and its environment;
− entity-level controls;
− the stakeholder dialogue process;
− the selection and application of sustainability reporting
policies;
− how management has applied the principle of materiality in
preparing the Report and the specified KPIs; and
− the significant reporting processes, including how
information is initiated, recorded, processed and reported
and how incorrect information is corrected, as well as the
policies and procedures within the reporting processes.
• We made such enquiries from management, employees and
those responsible for the preparation of the Report and the
specified KPIs as we considered necessary.
• We inspected relevant supporting documentation and obtained
such external confirmations and management representations as
we considered necessary for the purposes of our engagement.
• We performed analytical procedures and limited tests of detail
responsive to our risk assessment and the level of assurance
required, including comparison of judgementally selected
information to the underlying source documentation from which
the information has been derived.
Further to the above, below follows a summary of the procedures
performed as part of our limited-assurance engagement as set out
in Part C:
• We considered whether Nedbank Limited has applied the Global
Reporting Initiative G3 Guidelines to a level described on page 206.
• We considered whether Nedbank Limited has applied the
AA1000 principles of inclusivity, materiality and responsiveness.
We believe that the evidence obtained as part of our assurance
engagements is sufficient and appropriate to provide a basis for our
findings and our assurance conclusions expressed below.
7 Nedbank EG&C FA.indd 210 22/03/2011 12:07 PM
OvERvIEW GROuP REPORTS
OPERATIONAL OvERvIEW
SuSTAINABLE DEvELOPMENT PERFORMANCE
RISK, GOvERNANCE AND COMPLIANCE
211
bAsis for qUAlified opinion
PARt A
The company’s records reflect estimated electricity use and were
not updated to reflect actual electricity use (specified KPI 7). The
company’s records did not permit the application of alternative
assurance procedures. Consequently we did not obtain sufficient
appropriate assurance evidence regarding the accuracy and
completeness of the specified KPI.
We were unable to obtain the supporting documentation considered
necessary with respect to the accuracy and completeness of
specified KPIs 8 – 11 and 18. Consequently we did not obtain
sufficient appropriate assurance evidence regarding the accuracy and
completeness of the specified KPIs.
bAsis for qUAlified conclUsion
PARt B
The company’s records reflect estimated electricity use and were
not updated to reflect actual electricity use (Part A, KPI 7). Electricity
use is also a material component of the company’s green house gas
calculation (specified KPI 1). The company’s records did not permit
the application of alternative assurance procedures. Consequently we
did not obtain sufficient appropriate assurance evidence regarding
the accuracy and completeness of the specified KPI.
The company’s records reflect estimated water use and were not
updated to reflect actual water use (specified KPI 3). The company’s
records did not permit the application of alternative assurance
procedures. Consequently we did not obtain sufficient appropriate
assurance evidence regarding the accuracy and completeness of the
specified KPI.
opinion
PARt A
Based on the work performed and subject to the limitations
described above, except for the possible effects of the matters
described above in the ‘Basis for qualified opinion’ paragraphs, in our
opinion the specified KPIs are prepared, in all material respects, in
accordance with management’s sustainability criteria.
conclUsions
PARt B
Based on the work performed and subject to the limitations
described above, except for the possible effects of the matters
described above in the ‘Basis for qualified conclusion’ paragraphs,
nothing has come to our attention that causes us to believe that
the specified KPIs have not been prepared, in all material respects, in
accordance with management’s sustainability criteria.
PARt c
Based on the work performed and subject to the limitations
described above, nothing has come to our attention that causes
us to believe that the Report has not been prepared, in all material
respects, in accordance with the self-declared Global Reporting
Initiative G3 Guidelines A+ application level using the principles
of materiality, completeness and sustainability and in accordance
with AccountAbility’s AA1000APS (2008) using the principles of
inclusivity, materiality and responsiveness.
Ernst & Young Inc
Director – Jeremy Grist
Registered Auditor
Chartered Accountant (SA)
Wanderers Office Park
52 Corlett Drive
Illovo
Johannesburg
11 March 2011
independent AssUrAnce report
7 Nedbank EG&C FA.indd 211 22/03/2011 12:07 PM
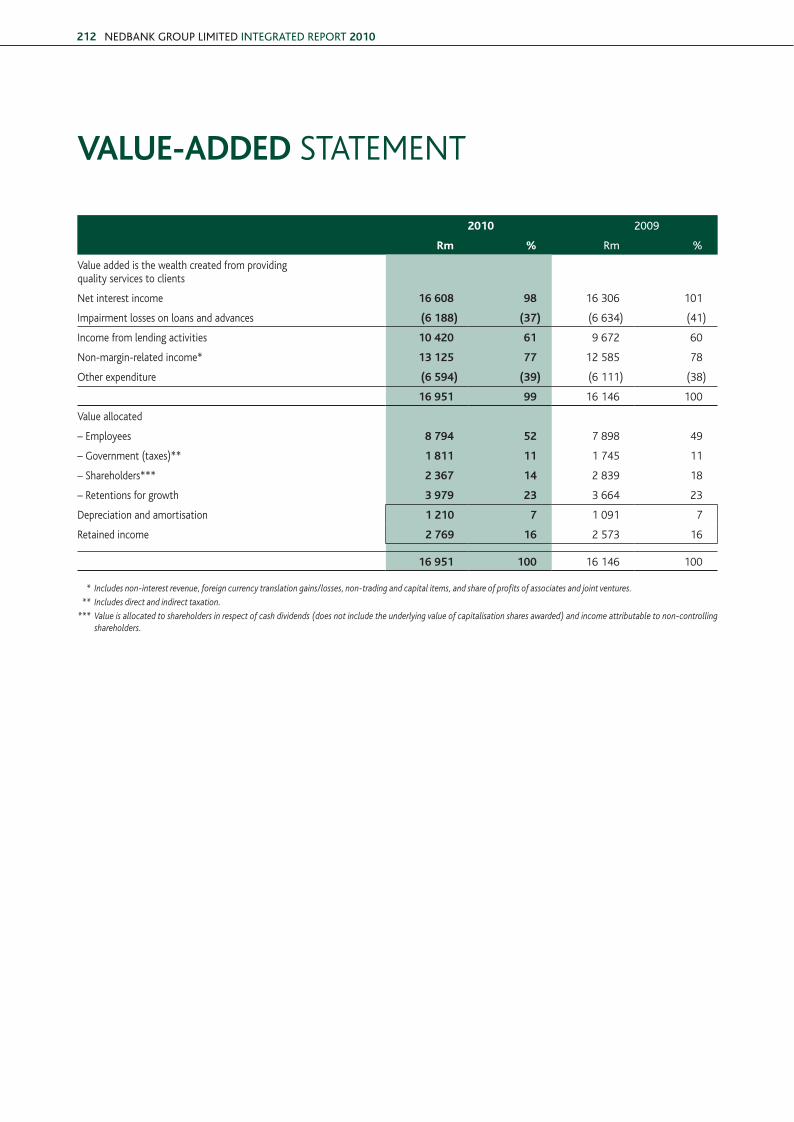
NEDBANK GROUP LimitED iNtEGRAtED REPORt 2010212
VAluE-ADDED STATEMENT
2010 2009
Rm % Rm %
value added is the wealth created from providing quality services to clients
Net interest income 16 608 98 16 306 101
Impairment losses on loans and advances (6 188) (37) (6 634) (41)
Income from lending activities 10 420 61 9 672 60
Non-margin-related income* 13 125 77 12 585 78
Other expenditure (6 594) (39) (6 111) (38)
16 951 99 16 146 100
value allocated
– Employees 8 794 52 7 898 49
– Government (taxes)** 1 811 11 1 745 11
– Shareholders*** 2 367 14 2 839 18
– Retentions for growth 3 979 23 3 664 23
Depreciation and amortisation 1 210 7 1 091 7
Retained income 2 769 16 2 573 16
16 951 100 16 146 100
* Includes non-interest revenue, foreign currency translation gains/losses, non-trading and capital items, and share of profits of associates and joint ventures.
** Includes direct and indirect taxation.
*** Value is allocated to shareholders in respect of cash dividends (does not include the underlying value of capitalisation shares awarded) and income attributable to non-controlling shareholders.
7 Nedbank EG&C FA.indd 212 22/03/2011 12:07 PM
OvERvIEW GROuP REPORTS
OPERATIONAL OvERvIEW
SuSTAINABLE DEvELOPMENT PERFORMANCE
RISK, GOvERNANCE AND COMPLIANCE
213
CONTACT DETAILS
AboUt this reportThis report is printed on Sappi Triple Green – a paper grade manufactured according to three environmental pillars: a minimum of 60% of the pulp used in the production of this paper is sugar cane fibre, which is the material remaining after raw sugar has been extracted from sugar cane; the bleaching process is elemental chlorine-free; and the remaining pulp used in the production process comprises wood fibre, which is obtained from sustainable and internationally certified afforestation, using independently audited chains of custody.
Continental Printing Inks complies with environmental protection, and the offset inks are classified pursuant to the AG directive 88/379/ECC and supplements. All its printing inks consist exclusively of materials that are based on renewable raw materials:
• Modified rosin resins produced out of wood resin.• Alkyd resins originating from esterification of vegetable oils.• unchanged vegetable oils like linseed oil/and or soy bean and chemically modified vegetable oils as so-called alkyl esters of fatty acids, eg rape oil fatty acid methylester.
The inks contain no binders based on mineral oil and no complete synthetic resins.
The inks of Continental Printing Inks are chemically and physiologically inert and for this reason they can be classified as harmless. The inks are manufactured by using carefully tested raw materials, which are subject to permanent quality control.
The carbon emissions generated through the production of this report have been included in the calculation of Nedbank Group’s total 2010 carbon footprint that will be offset during 2011.
nedbAnK groUp limitedIncorporated in the Republic of South Africa Reg No 1966/010630/06
BUsiNEss ADDREss AND REGistERED OfficENedbank Sandton 135 Rivonia Road Sandown, Sandton, 2196 South Africa
POstAL ADDREssPO Box 1144 Johannesburg, 2000 South Africa Tel: 27 (0)11 294 4444 Fax: +27 (0)11 294 6540 Website: www.nedbankgroup.co.za
nedbAnK groUp limited integrAted report 2010Should you require a copy of this report, please email your address details to Nedbank Group Investor Relations at [email protected] or send a fax to +27 (0)11 294 6549. It is also available on the enclosed CD or online at www.nedbankgroup.co.za.
investor relAtionsThe investor relations and financial media functions at Nedbank Group are outsourced. For investor-related information please contact:
tiER 1 iNvEstOR RELAtiONs (Pty) LimitEDGrapevine house Silverwood Close Steenberg Office Park, Tokai Cape Town, 7945 South Africa Tel: +27 (0)21 702 3102 Fax: +27 (0)21 702 3107 Email: [email protected]
compAny secretAryGS Nienaber: Group Company Secretary Tel: +27 (0)11 294 9106 Fax: +27 (0)11 295 9106 Email: [email protected]
sUstAinAbility qUeriesBrigitte Burnetthead: SustainabilityTel: +27 (0)11 294 3692 Fax: +27 (0)11 295 3692 Email: [email protected]
trAnsfer secretAriessOUth AfRicA:cOmPUtERshARE iNvEstOR sERvicEs (Pty) LimitEDbusiness address70 Marshall Street Johannesburg, 2001 South Africa
Postal addressPO Box 61051 Marshalltown, 2107 South Africa Tel: +27 (0)11 370 5000 Fax: +27 (0)11 688 5228
NAmiBiAtRANsfER sEcREtARiEs (Pty) LimitEDbusiness addressShop 8, Kaiserkrone Centre Post Street Mall Windhoek, Namibia
Postal addressPO Box 2401 Windhoek Namibia Tel: +264 (0)61 227 647 Fax: +264 (0)61 248 531
AUditorsDELOittE & tOUchEPostal addressPrivate Bag X6 Gallo Manor, 2052 South Africa Tel: +27 (0)11 806 5000 Fax: +27 (0)11 806 5003
KPmG iNcPostal addressPrivate Bag X9 Parkview, 2122 South Africa Tel: +27 (0)11 647 7111 Fax: +27 (0)11 647 8000
7 Nedbank EG&C FA.indd 213 22/03/2011 12:07 PM