Embed Size (px)
Citation preview
Instructions for use
Title Risk assessment of ozone impact on Fagus crenata in Japan: consideration of atmospheric nitrogendeposition
Author(s) Watanabe, Makoto; Yamaguchi, Masahiro; Matsumura, Hideyuki; Kohno, Yoshihisa; Izuta, Takeshi
Citation European Journal of Forest Research, 131(2): 475-484
Issue Date 2012-03
Doc URL http://hdl.handle.net/2115/52300
Type article (author version)
File Information EJFOR2012_for_HUSCAP(Watanabe).pdf
Hokkaido University Collection of Scholarly and Academic Papers : HUSCAP
Title
Risk assessment of ozone impact on Fagus crenata
in Japan: Consideration of atmospheric nitrogen
deposition
Names of authors
Makoto WATANABE1, Masahiro YAMAGUCHI
2, Hideyuki MATSUMURA
3,
Yoshihisa KOHNO3 and Takeshi IZUTA
4*
Affiliations and addresses
1 JSPS Research Fellow, Faculty of Agriculture, Hokkaido University, Sapporo
060-8589, Japan
2 Faculty of Agriculture, Tokyo University of Agriculture and Technology, Fuchu,
Tokyo 183-8509, Japan.
3 Environmental Science Research Laboratory, Central Research Institute of Electric
Power Industry, Abiko, Chiba 270-1194, Japan.
4 Institute of Agriculture, Tokyo University of Agriculture and Technology, Fuchu,
Tokyo 183-8509, Japan.
Corresponding author
Takeshi IZUTA
Tel. & Fax.: +81-42-367-5728, E-mail: [email protected]
Fuchu, Tokyo 183-8509, Japan.
Abstract
Tropospheric ozone (O3) is considered to be the air pollutiant relating to the
decline of Fagus crenata forest in Japan. In the present study, we assessed a risk of
O3 impact on the growth of F. crenata in Japan, giving consideration to the effects
associated with atmospheric nitrogen (N) deposition based on the experimental study,
national monitoring data for oxidant concentration and atmospheric N deposition,
and a national vegetation survey. The average and maximum O3-induced relative
growth reduction (RGred) of F. crenata across Japan were estimated to be 3.2% and
9.7%, respectively. Current levels of atmospheric N deposition were found to
significantly affect the sensitivity of F. crenata to O3. When the N deposition was
assumed as zero, the estimated average and maximum RGred were 2.3% and 5.7%,
respectively. The inclusion of atmospheric N deposition data thus increased the
estimated values for average and maximum RGred (by 38% and 71%, respectively).
Our results demonstrate that a change in the sensitivity to O3 associated with
atmospheric N deposition is an important consideration in the risk assessment of O3
impact on the growth of F. crenata in Japan.
Keywords
Ozone, Nitrogen deposition, Risk assessment, Fagus crenata, Growth reduction
1. Introduction
Tropospheric ozone (O3) is recognized as a widespread phytotoxic gaseous
air pollutant, and the concentration has been increasing in the Northern Hemisphere
(Akimoto 2003; Matyssek and Sandermann 2003; ADORC 2006). In Japan,
relatively high concentrations of O3 (above 100 nmol mol–1
) have been frequently
recorded not only in the suburbs of big cities such as Tokyo and Osaka, but also in
several mountainous areas (Wakamatsu et al. 1998; Yoshikado 2004; Network Center
for EANET 2007; Takeda and Aihara 2007). In Europe, the risk assessment of O3
impact on forest tree species has been conducted based on the concept of critical
level, which was evaluated from experimental studies (Kärenlampi and Skärby 1996;
Mills 2004; Simpson et al. 2007). On the other hand, although the current levels of
O3 in Japan could adversely affect forest tree species, risk assessments of O3 impact
were limited (Kohno et al. 2005; Watanabe et al. 2010).
The atmospheric deposition of nitrogen (N) to terrestrial ecosystems has
been increasing in line with elevated anthropogenic emissions of N (Ohara et al.
2007; Galloway et al. 2008). Several researchers reported relatively high amount of
N deposition at 10 to 20 kg N ha-1
year-1
by wet N deposition (bulk precipitation) and
10 to 50 kg N ha-1
year-1
by throughfall and stemflow in the forested areas of Japan
(Baba and Okazaki, 1998; Baba et al., 2001; Okochi and Igawa, 2001; Sase et al.
2008; Kimura et al. 2009).
In East Asia, emission of air pollutants such as N compounds and precursors
of O3 has been increased rapidly since 1980s owing to the increased energy demands
due to rapid economic growth, industrialization and urbanization (Ohara et al. 2007;
International Energy Agency 2008). Several researchers have implicated
transboundary air pollution (O3 and NOX) from East Asian countries other than Japan
as contributing to the recent increases in the concentration of O3 and atmospheric N
deposition in Japan, especially in the areas along the Sea of Japan (Holloway et al.
2002; Ministry of the Environment 2004; Tanimoto et al. 2005; Yamaji et al. 2006;
Han et al. 2007). In fact, the annual average daytime O3 concentration has been
increased at a rate of 0.27 nmol mol–1
year–1
between 1985 and 2007, whereas the
emissions of precursors in Japan has been decreased during the same period (Ohara
2011). The median value of the annual wet N deposition (sum of NO3– and NH4
+) at
20 monitoring stations throughout Japan has been increased at a rate of 0.11 kg ha-1
year-1
between 1991 and 2007 (Ministry of the Environment 2009). Furthermore,
continuous increase in the emission of air pollutants in the near future are predicted
in East Asian countries (Ohara et al. 2007; International Energy Agency 2008).
Therefore, tropospheric O3 concentration and atmospheric N deposition in Japan will
increase through the transboundary air pollution if emissions of air pollutants will not
be strictly controlled (Yamaji et al. 2008).
Since the increases in the O3 concentration and atmospheric N deposition
are spatially correlated in general (Holland et al. 1997; Ollinger et al. 2002), we
should consider interactive effects of atmospheric N deposition and O3 on forest tree
species. There have been several experimental studies on the combined effects of O3
and the supply of N to the soil on the growth of various tree species. Utriainen and
Holopainen (2001b) and Yamaguchi et al. (2007) reported that the supply of N to the
soil increased the growth sensitivity of Pinus sylvestris and Fagus crenata seedlings
to O3, respectively. However, opposite responses were reported for seedlings of Larix
kaempferi and Populus tremula × Populus tremuloides (Watanabe et al. 2006; Häikiö
et al. 2007). The effect of N supply on the sensitivity to O3 has not found to be
significant for Picea abies seedlings (Utriainen and Holopainen 2001a; Thomas et al.
2005). These results indicate that atmospheric N deposition must be taken into
account when we conduct a risk assessment of O3 impact on forest tree species
whose sensitivity to O3 is affected by changes in the supply of N to the soil.
Fagus crenata is the most common and widely distributed deciduous
broad-leaved tree species in the cool temperate forests of Japan (Nakashizuka and
Iida 1995). F. crenata is an important tree species in Japan because its forests help to
conserve forest soil and to maintain biodiversity, and is planted for afforestation as
well as for ceremonial plantations (Murai et al. 1991; Nakashizuka 2004; Terazawa
and Koyama 2008). Virgin natural forests of F. crenata on the Shirakami Mountains
(northeast Japan) were registered by UNESCO as a World Natural Heritage sites in
December 1993. Several researchers have implicated O3 as an important factor in the
decline and dieback of F. crenata forests in Japan (Yonekura et al. 2001; Takeda and
Aihara 2007; Kume et al. 2009). As discussed, the growth sensitivity of F. crenata
seedling to O3 was found to be directly related to increases in the supply of N to the
soil (Yamaguchi et al. 2007; Yamaguchi et al. 2010a). Therefore, the increase in the
atmospheric N deposition in Japan may correspondingly increase the sensitivity of F.
crenata to O3, thereby negatively affecting the growth of this tree species. However,
a risk assessment of O3 impact on the growth of F. crenata in which atmospheric N
deposition-induced changes in the sensitivity to O3 are considered has not been
conducted. We addressed this in the present study, assessing the risk of O3 impact on
the growth of F. crenata in Japan, giving consideration to the effects associated with
atmospheric N deposition based on the experimental study, national monitoring data
for oxidant concentration and atmospheric N deposition, and a national vegetation
survey.
2. Methods
2.1 The estimation of O3-induced growth reduction of Fagus crenata
Our methods for estimating the effects of O3 on the growth of F. crenata
were based on the results of Yamaguchi et al. (2007). In this study, the seedlings of F.
crenata were grown under 12 experimental treatment conditions, as determined by
the combination of 4 gas treatments (charcoal-filtered air and 3 levels of O3 at 1.0,
1.5 and 2.0 times the ambient concentration) and 3 soil N treatments with NH4NO3
[0 (N0), 20 (N20) and 50 kg N ha–1
year–1
(N50)] in open-top chambers during the 2
growing seasons. The whole-plant dry mass increment for a single growing season
(WDMinc) was calculated as the difference in the whole-plant dry mass of the
seedlings between the ends of the first and second growing seasons. We measured the
atmospheric concentration of O3 in the open-top chambers during the second
growing season to calculate AOT40 (accumulated exposure over a threshold of 40
nmol mol–1
, in μmol mol–1
h) of O3 over 12 h periods (0600–1800 hours) between
April and September. The AOT40 is the sum of the differences between the hourly
mean O3 concentration and 40 nmol mol-1
for each hour when the O3 concentration
exceeded 40 nmol mol-1
(Kärenlampi and Skärby 1996)
The analysis of the O3 exposure-response relationships for the WDMinc was
performed according to Watanabe et al. (2007) as described below. A regression line
was obtained from the relationship between AOT40 and the WDMinc. The theoretical
WDMinc at zero AOT40 was determined to be the y-axis intercept of the regression
line, and was used as a reference (100%) to calculate the relative WDMinc for each
gas treatment. The slope and coefficient of determination values (R2) were calculated
from the regression line between AOT40 and the relative WDMinc. Because the
sensitivity to O3 of F. crenata is reported to increase with an increase in N supply to
the soil (Yamaguchi et al. 2007), this procedure was conducted separately for each N
treatment. We regarded the absolute value of slope in the regression line as the
O3-induecd relative growth reduction (RGred, %) per unit AOT40 for each N
treatment. The relationship between the amount of N supply and the RGred per unit
AOT40 was analysed to estimate the RGred per unit AOT40 in the area with different
depositions of N. We calculated the RGred in each F. crenata habitat as a product of
RGred per unit AOT40 and AOT40.
2.2 Estimation of AOT40 of O3 in Japan
The concentrations of photochemical oxidants are officially monitored at
approximately 1200 monitoring stations throughout Japan. Originally, photochemical
oxidants have been measured by absorption spectrophotometry using a neutral
potassium iodide solution (AS-NPI). The atmospheric concentration of O3 can be
tabulated as that of photochemical oxidants under the Air Pollution Control Law
Enforcement Regulations in Japan from 1996, because of following reasons: a) the
concentration of peroxi-acetyl nitrate (PAN), main component of photochemical
oxidant without O3, was very low and b) the sensitivity of AS-NPI to PAN
concentration was low (Ministry of the Environment 1996). In fact, the 1-year field
measurement indicated that the little difference between the concentrations of O3
measured by UV absorption photometry and chemiluminescence method and that of
photochemical oxidant measured by AS-NPI (Ministry of the Environment 1996). In
the present study, therefore, the concentration of photochemical oxidants was
regarded as that of O3.
The number of hours in which the concentration of O3 is above either 0.06
μmol mol–1
(Num60) or 0.12 μmol mol–1
(Num120) is recorded by all of the monitoring
stations in Japan and made available by the National Institute for Environmental
Studies. However, hourly data concerning O3 concentrations were available in
approximately 40% of prefectures. Ishii et al. (2007) reported a high correlation (r =
0.97) between the sum of Num60 and Num120 and the AOT40 over 12 h periods
(0600–1800 hours) based on the monthly data between April and September, as
calculated from available hourly O3 concentration data. Therefore, we use the
method of Ishii et al. (2007) to estimate the AOT40 for all of the monitoring stations
in Japan from 1999 to 2001.
The map of spatial distribution of AOT40 in Japan was created using the
Geostatistical Analyst Extension of the ArcGIS 9.0 software (ESRI inc. USA). The
kriging interpolation was applied for the estimation of AOT40 among the monitoring
stations. The cell size in the kriging interpolation was set as 0.05º. The Gaussian
model was used as a semivariogram model in the kriging interpolation because the
kriging variance was lower than that of the other semivariogram models (Spherical,
Circular, Exponential and Linear).
2.3 Estimation of atmospheric N deposition in Japan
In general, atmospheric N deposition is classified into wet deposition and
dry deposition. We obtained wet deposition data for NO3- and NH4
+ from the
Ministry of the Environment and Environmental Laboratories Association of Japan,
which had monitoring station numbers of 97, 98 and 98 in 1999, 2000 and 2001,
respectively (Environmental Laboratories Association 2003; Ministry of the
Environment 2004). The distribution of wet deposition of N in Japan was estimated
from these data. Flux of wet deposition of N (Fw) was calculated from the
concentration of N in precipitation (Cp) and the amount of precipitation (P) as
follows:
Fw = Cp · P. (1)
Our method for estimating the dry deposition of N was based on that of
Fujita (2004). The flux of dry deposition of N (Fd) was calculated as the product of
dry deposition velocity (Vd) and atmospheric N concentration (Ca):
Fd = Vd · Ca . (2)
Puxbaum and Gregori (1998) reported the Vd of N compounds for several forests
based on inferential models, and the average values across these forests were used in
our calculations. The average Vd of gaseous HNO3, gaseous NH3, and particulate
matter with NO3– and NH4
+ were 2.72, 0.74, and 0.18 cm s
–1, respectively. Cp was
considered as proportional to Ca, and Formula 1 can be rewritten as follows:
Fw = K · Ca · P (3)
where K is the ratio of Cp to Ca (washout ratio). From Formulas 2 and 3, Fd can be
described follows:
Fd = Vd · Fw/(K · P). (4)
The dry deposition flux of N can thus be estimated by determining K. Ca values for
gaseous HNO3 and NH3, and for NO3– and NH4
+ originating from particulate matter,
were obtained alongside measurements of Cp values for NO3– and NH4
+ made by the
24–27 monitoring stations of the Environmental Laboratories Association of Japan
between 1999 and 2001 (Environmental Laboratories Association 2003). K values
were estimated from these data as the ratio of Cp to the sum of Ca values for gaseous
and particulate forms. Extremely high K values were observed at several monitoring
stations. To avoid any spurious results potentially associated with their inclusion, we
averaged K values across the frequency distribution from the 10th to 90th percentile.
This resulted in K values that were averaged for each month (Fig. 1). For monitoring
stations where Ca was not measured, its value was used. The commonly-used ratio of
gaseous form Ca to particulate forms Ca (Gas/Particle) was estimated from data
provided by the Environmental Laboratories Association (2003). Extremely high
Gas/Particle values were observed at several monitoring stations, and, as for K values,
we used Gas/Particle values that were averaged across the frequency distribution
from the 10th to 90th percentile. The Fd for all monitoring stations was estimated
using Formula 2, and in to which Vd from Puxbaum and Gregori (1998) and
measured or estimated Ca values were entered. To avoid change in Ca and Cp
associated with the eruption of the Miyake volcano in August 2000, data from this
month were omitted from the analyses.
The inverse distance weighted (IDW) method was applied for the estimation
of values of wet and dry deposition of N among the monitoring stations. Cell size in
the IDW interpolation was set as 0.2º. Total N deposition (TNdep) was calculated as
sum of the wet and dry depositions of N in the GIS software.
2.4 Habitats of Fagus crenata in Japan
The habitats of F. crenata in Japan were determined from vegetation raster
data (45" × 30" per mesh) of the National Survey on the Natural Environment,
conducted by the Ministry of the Environment. These data were obtained from the
Japan Integrated Biodiversity Information System
(http://www.biodic.go.jp/J-IBIS.html). Geographical meshes containing the
vegetation code for F. crenata were taken to be F. crenata habitats. Figure 2 shows
the habitats of F. crenata across various geographical regions of Japan. The AOT40
and TNdep for each F. crenata habitat were extracted from the above-mentioned
AOT40 and TNdep map and were used to the calculation.
3. Results
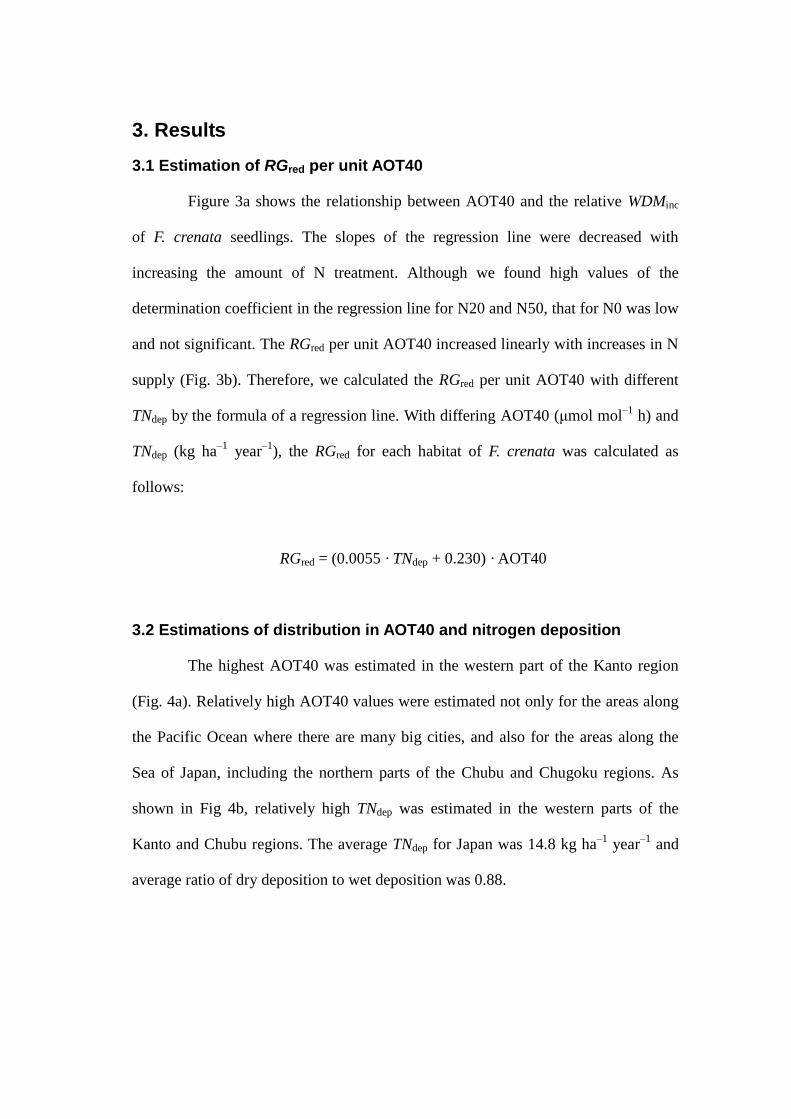
3.1 Estimation of RGred per unit AOT40
Figure 3a shows the relationship between AOT40 and the relative WDMinc
of F. crenata seedlings. The slopes of the regression line were decreased with
increasing the amount of N treatment. Although we found high values of the
determination coefficient in the regression line for N20 and N50, that for N0 was low
and not significant. The RGred per unit AOT40 increased linearly with increases in N
supply (Fig. 3b). Therefore, we calculated the RGred per unit AOT40 with different
TNdep by the formula of a regression line. With differing AOT40 (μmol mol–1
h) and
TNdep (kg ha–1
year–1
), the RGred for each habitat of F. crenata was calculated as
follows:
RGred = (0.0055 · TNdep + 0.230) · AOT40
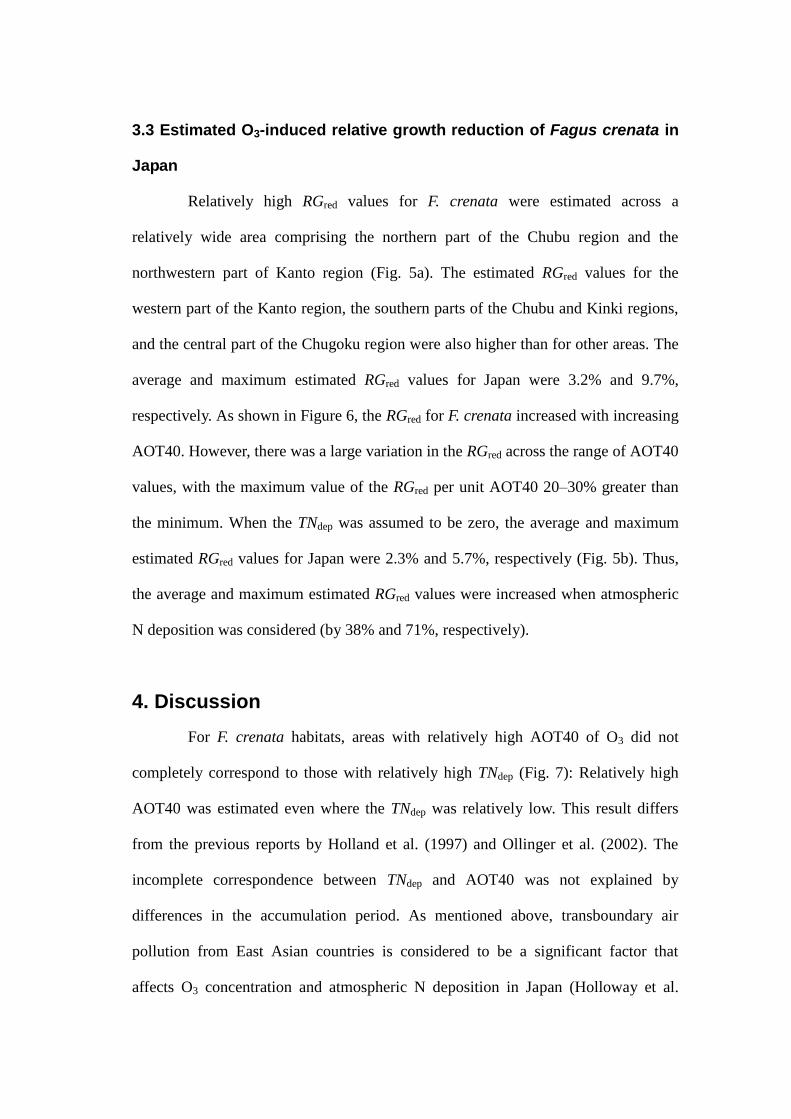
3.2 Estimations of distribution in AOT40 and nitrogen deposition
The highest AOT40 was estimated in the western part of the Kanto region
(Fig. 4a). Relatively high AOT40 values were estimated not only for the areas along
the Pacific Ocean where there are many big cities, and also for the areas along the
Sea of Japan, including the northern parts of the Chubu and Chugoku regions. As
shown in Fig 4b, relatively high TNdep was estimated in the western parts of the
Kanto and Chubu regions. The average TNdep for Japan was 14.8 kg ha–1
year–1
and
average ratio of dry deposition to wet deposition was 0.88.
3.3 Estimated O3-induced relative growth reduction of Fagus crenata in
Japan
Relatively high RGred values for F. crenata were estimated across a
relatively wide area comprising the northern part of the Chubu region and the
northwestern part of Kanto region (Fig. 5a). The estimated RGred values for the
western part of the Kanto region, the southern parts of the Chubu and Kinki regions,
and the central part of the Chugoku region were also higher than for other areas. The
average and maximum estimated RGred values for Japan were 3.2% and 9.7%,
respectively. As shown in Figure 6, the RGred for F. crenata increased with increasing
AOT40. However, there was a large variation in the RGred across the range of AOT40
values, with the maximum value of the RGred per unit AOT40 20–30% greater than
the minimum. When the TNdep was assumed to be zero, the average and maximum
estimated RGred values for Japan were 2.3% and 5.7%, respectively (Fig. 5b). Thus,
the average and maximum estimated RGred values were increased when atmospheric
N deposition was considered (by 38% and 71%, respectively).
4. Discussion
For F. crenata habitats, areas with relatively high AOT40 of O3 did not
completely correspond to those with relatively high TNdep (Fig. 7): Relatively high
AOT40 was estimated even where the TNdep was relatively low. This result differs
from the previous reports by Holland et al. (1997) and Ollinger et al. (2002). The
incomplete correspondence between TNdep and AOT40 was not explained by
differences in the accumulation period. As mentioned above, transboundary air
pollution from East Asian countries is considered to be a significant factor that
affects O3 concentration and atmospheric N deposition in Japan (Holloway et al.
2002; Ministry of the Environment 2004; Tanimoto et al. 2005; Yamaji et al. 2006;
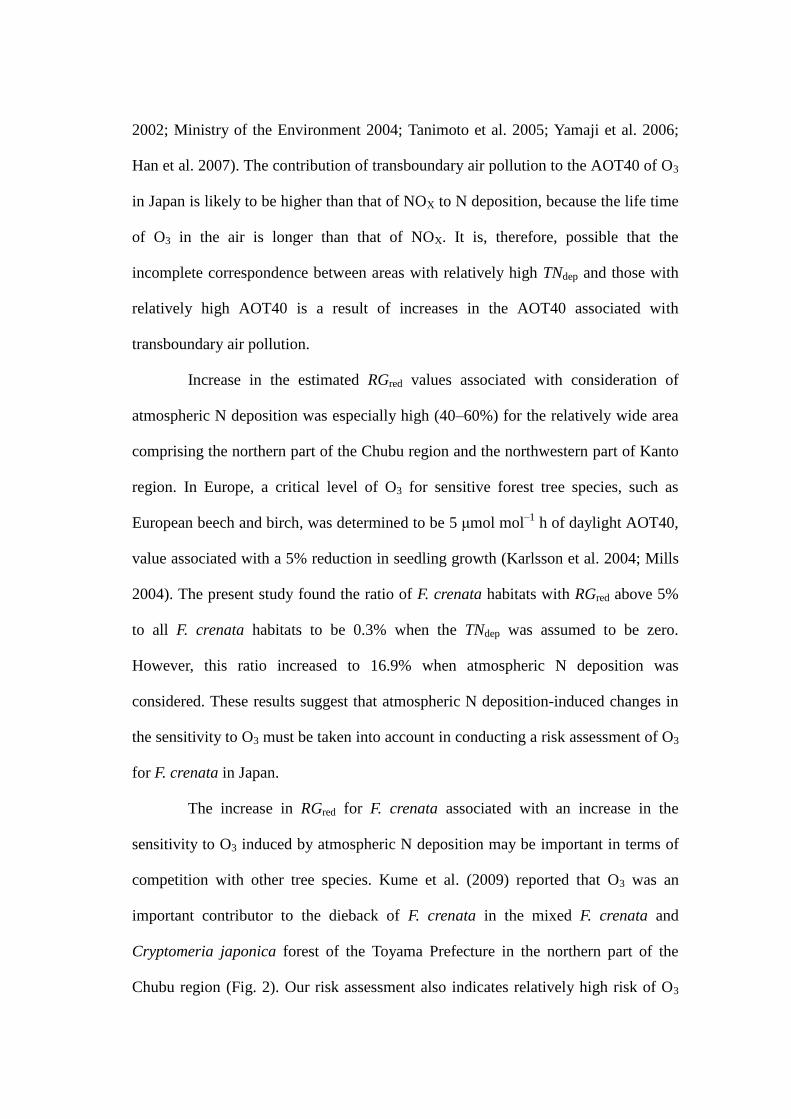
Han et al. 2007). The contribution of transboundary air pollution to the AOT40 of O3
in Japan is likely to be higher than that of NOX to N deposition, because the life time
of O3 in the air is longer than that of NOX. It is, therefore, possible that the
incomplete correspondence between areas with relatively high TNdep and those with
relatively high AOT40 is a result of increases in the AOT40 associated with
transboundary air pollution.
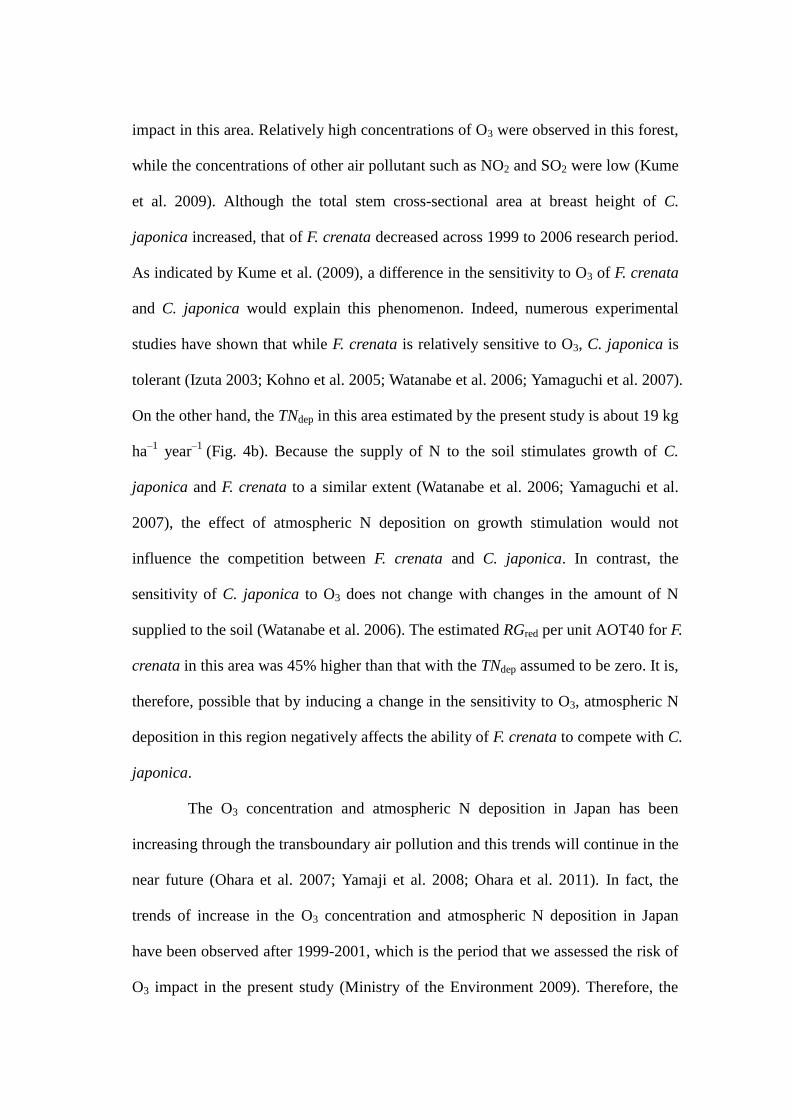
Increase in the estimated RGred values associated with consideration of
atmospheric N deposition was especially high (40–60%) for the relatively wide area
comprising the northern part of the Chubu region and the northwestern part of Kanto
region. In Europe, a critical level of O3 for sensitive forest tree species, such as
European beech and birch, was determined to be 5 μmol mol–1
h of daylight AOT40,
value associated with a 5% reduction in seedling growth (Karlsson et al. 2004; Mills
2004). The present study found the ratio of F. crenata habitats with RGred above 5%
to all F. crenata habitats to be 0.3% when the TNdep was assumed to be zero.
However, this ratio increased to 16.9% when atmospheric N deposition was
considered. These results suggest that atmospheric N deposition-induced changes in
the sensitivity to O3 must be taken into account in conducting a risk assessment of O3
for F. crenata in Japan.
The increase in RGred for F. crenata associated with an increase in the
sensitivity to O3 induced by atmospheric N deposition may be important in terms of
competition with other tree species. Kume et al. (2009) reported that O3 was an
important contributor to the dieback of F. crenata in the mixed F. crenata and
Cryptomeria japonica forest of the Toyama Prefecture in the northern part of the
Chubu region (Fig. 2). Our risk assessment also indicates relatively high risk of O3
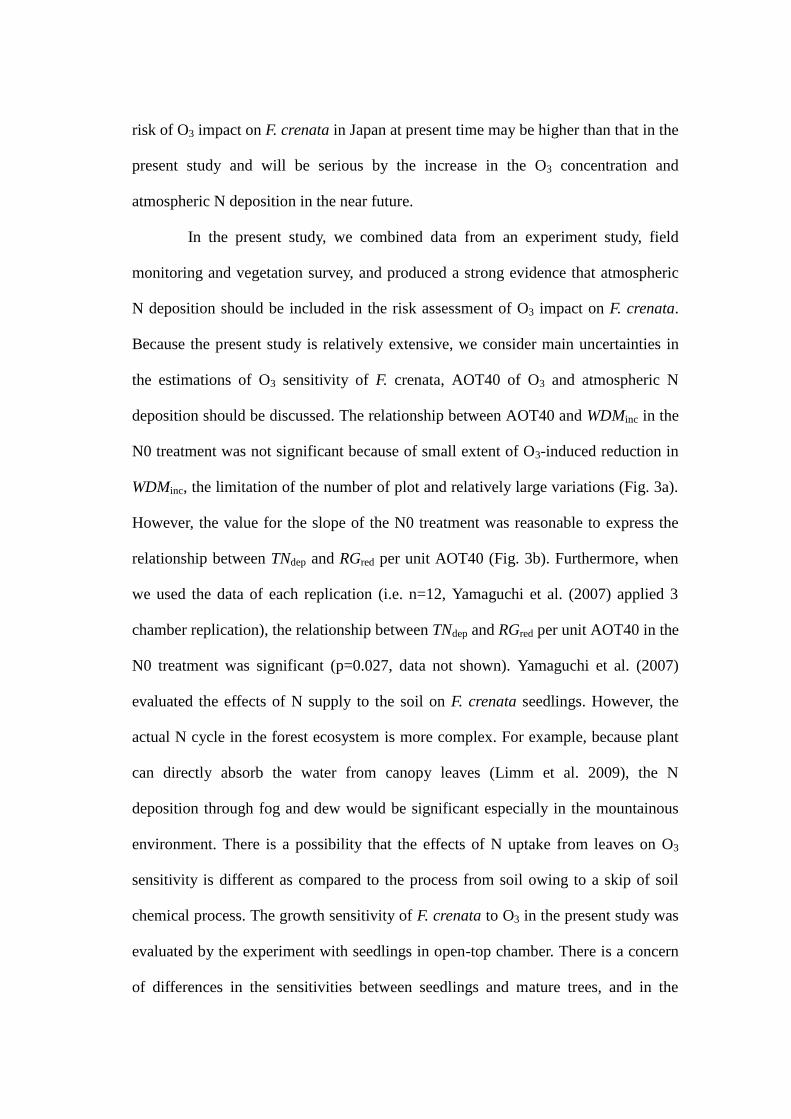
impact in this area. Relatively high concentrations of O3 were observed in this forest,
while the concentrations of other air pollutant such as NO2 and SO2 were low (Kume
et al. 2009). Although the total stem cross-sectional area at breast height of C.
japonica increased, that of F. crenata decreased across 1999 to 2006 research period.
As indicated by Kume et al. (2009), a difference in the sensitivity to O3 of F. crenata
and C. japonica would explain this phenomenon. Indeed, numerous experimental
studies have shown that while F. crenata is relatively sensitive to O3, C. japonica is
tolerant (Izuta 2003; Kohno et al. 2005; Watanabe et al. 2006; Yamaguchi et al. 2007).
On the other hand, the TNdep in this area estimated by the present study is about 19 kg
ha–1
year–1
(Fig. 4b). Because the supply of N to the soil stimulates growth of C.
japonica and F. crenata to a similar extent (Watanabe et al. 2006; Yamaguchi et al.
2007), the effect of atmospheric N deposition on growth stimulation would not
influence the competition between F. crenata and C. japonica. In contrast, the
sensitivity of C. japonica to O3 does not change with changes in the amount of N
supplied to the soil (Watanabe et al. 2006). The estimated RGred per unit AOT40 for F.
crenata in this area was 45% higher than that with the TNdep assumed to be zero. It is,
therefore, possible that by inducing a change in the sensitivity to O3, atmospheric N
deposition in this region negatively affects the ability of F. crenata to compete with C.
japonica.
The O3 concentration and atmospheric N deposition in Japan has been
increasing through the transboundary air pollution and this trends will continue in the
near future (Ohara et al. 2007; Yamaji et al. 2008; Ohara et al. 2011). In fact, the
trends of increase in the O3 concentration and atmospheric N deposition in Japan
have been observed after 1999-2001, which is the period that we assessed the risk of
O3 impact in the present study (Ministry of the Environment 2009). Therefore, the
risk of O3 impact on F. crenata in Japan at present time may be higher than that in the
present study and will be serious by the increase in the O3 concentration and
atmospheric N deposition in the near future.
In the present study, we combined data from an experiment study, field
monitoring and vegetation survey, and produced a strong evidence that atmospheric
N deposition should be included in the risk assessment of O3 impact on F. crenata.
Because the present study is relatively extensive, we consider main uncertainties in
the estimations of O3 sensitivity of F. crenata, AOT40 of O3 and atmospheric N
deposition should be discussed. The relationship between AOT40 and WDMinc in the
N0 treatment was not significant because of small extent of O3-induced reduction in
WDMinc, the limitation of the number of plot and relatively large variations (Fig. 3a).
However, the value for the slope of the N0 treatment was reasonable to express the
relationship between TNdep and RGred per unit AOT40 (Fig. 3b). Furthermore, when
we used the data of each replication (i.e. n=12, Yamaguchi et al. (2007) applied 3
chamber replication), the relationship between TNdep and RGred per unit AOT40 in the
N0 treatment was significant (p=0.027, data not shown). Yamaguchi et al. (2007)
evaluated the effects of N supply to the soil on F. crenata seedlings. However, the
actual N cycle in the forest ecosystem is more complex. For example, because plant
can directly absorb the water from canopy leaves (Limm et al. 2009), the N
deposition through fog and dew would be significant especially in the mountainous
environment. There is a possibility that the effects of N uptake from leaves on O3
sensitivity is different as compared to the process from soil owing to a skip of soil
chemical process. The growth sensitivity of F. crenata to O3 in the present study was
evaluated by the experiment with seedlings in open-top chamber. There is a concern
of differences in the sensitivities between seedlings and mature trees, and in the
environmental conditions between open-top chamber and field (Karnosky et al. 2003;
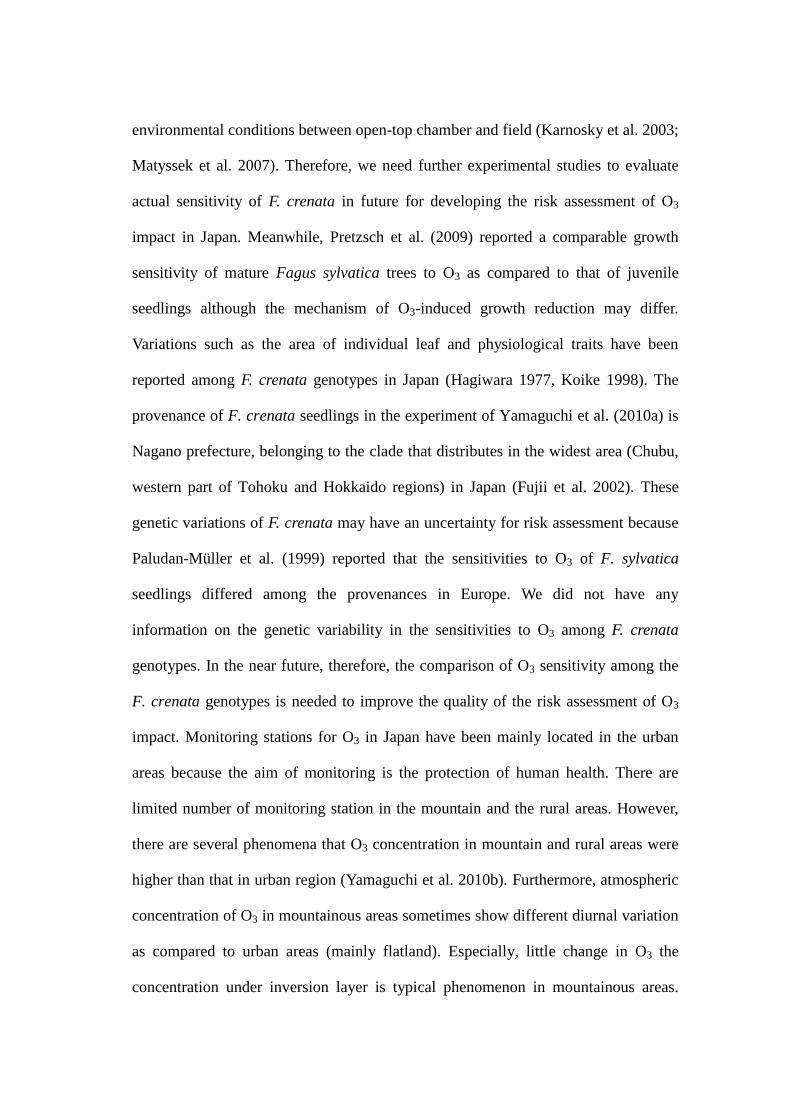
Matyssek et al. 2007). Therefore, we need further experimental studies to evaluate
actual sensitivity of F. crenata in future for developing the risk assessment of O3
impact in Japan. Meanwhile, Pretzsch et al. (2009) reported a comparable growth
sensitivity of mature Fagus sylvatica trees to O3 as compared to that of juvenile
seedlings although the mechanism of O3-induced growth reduction may differ.
Variations such as the area of individual leaf and physiological traits have been
reported among F. crenata genotypes in Japan (Hagiwara 1977, Koike 1998). The
provenance of F. crenata seedlings in the experiment of Yamaguchi et al. (2010a) is
Nagano prefecture, belonging to the clade that distributes in the widest area (Chubu,
western part of Tohoku and Hokkaido regions) in Japan (Fujii et al. 2002). These
genetic variations of F. crenata may have an uncertainty for risk assessment because
Paludan-Müller et al. (1999) reported that the sensitivities to O3 of F. sylvatica
seedlings differed among the provenances in Europe. We did not have any
information on the genetic variability in the sensitivities to O3 among F. crenata
genotypes. In the near future, therefore, the comparison of O3 sensitivity among the
F. crenata genotypes is needed to improve the quality of the risk assessment of O3
impact. Monitoring stations for O3 in Japan have been mainly located in the urban
areas because the aim of monitoring is the protection of human health. There are
limited number of monitoring station in the mountain and the rural areas. However,
there are several phenomena that O3 concentration in mountain and rural areas were
higher than that in urban region (Yamaguchi et al. 2010b). Furthermore, atmospheric
concentration of O3 in mountainous areas sometimes show different diurnal variation
as compared to urban areas (mainly flatland). Especially, little change in O3 the
concentration under inversion layer is typical phenomenon in mountainous areas.
This phenomenon make a concern when we estimate AOT40 based on the Num60 and
Num120 according to Ishii et al. (2007). For example, two constant O3 concentrations
at 70 and 100 nmol mol-1
show the same Num60 and Num120, but different AOT40.
Reconsidering of the location of monitoring station for O3 and availability of hourly
data are needed for accurate assessment of O3 impact on forest trees in Japan. At the
present time, rutine method for measuring dry deposition of gases and particles has
not yet established, while wet deposition continuously monitored throughout Japan.
We needed the information on atmospheric dry deposition of N in large-scale
because our aim is to clarify the extent of atmospheric N deposition-induced change
in O3 risk for F. crenata throughout Japan. In the present study, therefore, we applied
simple method for estimating atmospheric dry deposition of several N compounds
with the data obtained from nationwide researches and constant value of Vd
(Puxbaum and Gregori 1998; Environmental Laboratories Association 2003; Fujita
2004; Ministry of the Environment 2004). As a results, we clarified the importance of
the change in the sensitivity to O3 associated with atmospheric N depsotion. In
addition, similar amount of total dry N deposition as compared to that of total wet N
deposition in the present estimation partly supports the validity of our estimation
(Matsuda et al. 2001). The applied Vd values for gaseous HNO3 and particulate
matter with NO3– and NH4
+ (2.72 and 0.18 cm s
–1, respectively) are relatively lower
than those in other studies, whereas the Vd for gaseous NH3 (0.74 cm s–1
) is similar
(Hanson and Lindberg 1991; Endo et al. 2011). Therefore, there is a possibility that
actual dry deposition of N is higher than our estimation. Although the estimation of
parameters for dry deposition of N in Japan is difficult owing to the complex
geography with monsoonal climate, the development of ideal method for estimating
dry deposition of N that apply to nation wide scale is needed.
5. Conclusion
The results of the present study lead us to conclude that the current level of
atmospheric N deposition-induced change in the sensitivity to O3 is an important
factor in the risk assessment of O3 impact on F. crenata in Japan. The average and
maximum estimated RGred values increased when atmospheric N deposition was
considered (by 38% and 71%, respectively). Increases in the estimated RGred values
were especially high, ranging from 40% to 60%, in the wide areas comprising the
northern part of the Chubu region and the northwestern part of Kanto region.
As reported previously, there are several tree species for which changes in
the supply of N to the soil alters their sensitivity to O3 (Utriainen and Holopainen
2001b; Watanabe et al. 2006; Häikiö et al. 2007). For protecting these tree species,
future risk assessments of O3 impact must be conducted with consideration of
atmospheric N deposition.
Acknowledgments
This study was partly supported by the Ministry of the Environment, Japan
through the program of Global Environmental Research Fund and by Japan Society
for the Promotion of Science Research Fellowships for Young Scientists. The authors
are greatly indebted to M. Iwasaki, J. Naba, N. Matsuo, C. Tabe, R. Yamashita, Y.
Shinozaki and M. Tanaka (Tokyo University of Agriculture and Technology), and
staff of CERES Inc. for their technical support and discussion. We use the data file of
photochemical oxidant from “Numerical database for environment” of National
Institute for Environmental Studies.
Reference
ADORC (Acid deposition and oxidant research center) (2006) Tropospheric ozone a
growing threat. ADORC, Niigata, p 26
Akimoto H (2003) Global air quality and pollution. Science 302:1716–1719
Baba M, Okazaki M (1998) Acidification in nitrogen-saturated forested catchment.
Soil Sci Plant Nutr 44: 513–525
Baba M, Suzuki Y, Sasaki H, Matano K, Sugiura T, Kobayashi H (2001) Nitrogen
retention in Japanese cedar stands in northern Honshu, with high nitrogen
deposition. Water Air Soil Pollut 130: 1103–1108
Endo T, Yagoh H, Sato K, Matsuda K, Hayashi K, Noguchi I, Sawada K (2011)
Regional characteristics of dry deposition of sulfur and nitrogen compounds
at EANET sites in Japan from 2003 to 2008. Atmos Environ 45: 1259–1267
Environmental Laboratories Association (2003) The third report of the acid rain
monitoring in Japan. Journal of Environmental Laboratories Association 28:
126–185 (In Japanese)
Fujii N, Tomaru N, Okuyama K, Koike T, Mikami T, Ueda K (2002) Chloroplast
DNA phylogeography of Fagus crenata (Fagaceae) in Japan. Plant Syst Evol
232:21–33
Fujita S (2004) Study on the deposition of gaseous and particulate substances in East
Asia. Journal of Japan Society for Atmospheric Environment 39: 107–118 (In
Japanese with English summary)
Galloway JN, Townsend AR, Erisman JW, Bekunda M, Cai Z, Freney JR, Martinelli
LA, Seitzinger SP, Sutton MA (2008) Transformation of the nitrogen cycle:
Recent trends, questions, and potential solutions. Science 320: 889–892
Hagiwara S (1977) Cline of leaf area in Fagus crenata. Plant Species Biol 1: 39–51
(In Japanese)
Häikiö E, Freiwald V, Silfver T, Beuker E, Holopainen T, Oksanen E (2007) Impacts
of elevated ozone and nitrogen on growth and photosynthesis of European
aspen (Populus tremula) and hybrid aspen (P. tremula × Populus tremuloides)
clones. Can J For Res 37: 2326–2336
Han Z, Ueda H, Hozumi Y, Sakurai T (2007) Modeling study of long-range transport
of SO2, NOX and O3 over Northeast Asia in March 2002. Water Air Soil
Pollut 178: 195–205
Hanson PJ, Lindberg SE (1991) Dry deposition of reactive nitrogen compounds: a
review of leaf, canopy and non-foliar measurements. Atmos Environ 25A:
1615–1634
Holland EA, Braswell BH, Lamarque J-F, Townsend A, Sulzman J, Müller J-F,
Dentener F, Brasseur G, Levy II H, Penner JE, Roelofs G-J (1997) Variations
in the predicted spatial distribution of atmospheric nitrogen deposition and
their impact on carbon uptake by terrestrial ecosystems. J Geophys Res 102:
15849–15866
Holloway T, Levy II H, Carmichael G (2002) Transfer of reactive nitrogen in Asia:
development and evaluation of a source-receptor model. Atmos Environ 36:
4251–4264
International Energy Agency (2008) World Energy Outlook 2008. International
Energy Agency, Paris. http://www.worldenergyoutlook.org/2008.asp
Accessed 2 February 2011
Ishii T, Matsumura H, Hayami H, Kohno Y (2007) Relationship between
oxidant-based AOT40 and forest environmental conditions of damaged
Japanese cedars in the Kanto plains. J Glob Environ Eng 12:51–62
Izuta T. (2003) Air pollution impacts on vegetation in Japan. In: Emberson L,
Ashmore M, Murray F. (Eds) Air Pollution Impacts on Crops and Forests A
Global Assessment, Imperial College Press, London, pp 89–101
Kärenlampi L, Skärby L (1996) Critical levels for ozone in Europe: testing and
finalizing the concepts, UN-ECE workshop reports. Department of Ecology
and Environmental Science, University of Kuopio, Finland, p 363
Karlsson PE, Uddling J, Braun S, Broadmeadow M, Elvira S, Gimeno BS, Le Thiec
D, Oksanen E, Vandermeiren K, Wilkinson M, Emberson L (2004) New
critical levels for ozone effects on young trees based on AOT40 and
simulated cumulative leaf uptake of ozone. Atmos Environ 38: 2283–2294
Karnosky DF, Zak DR, Pregitzer KS, Awmack CS, Bockheim JG, Dickson RE,
Hendrey GR, Host GE, King JS, Kopper BJ, Kruger EL, Kubiske ME,
Lindroth RL, Mattson WJ, McDonald EP, Noormets A, Oksanen E, Parsons
WFJ, Percy KE, Podila GK, Riemenschneider DE, Sharma P, Thakur R,
Sôber A, Sôber J, Jones WS, Anttonen S, Vapaavuori E, Mankovska B,
Heilman W, Isebrands JG. (2003) Tropospheric O3 moderates responses of
temperate hardwood forests to elevated CO2: a synthesis of molecular to
ecosystem results from the Aspen FACE project. Funct Ecol 17: 289–304
Kimura SD, Saito M, Hara H, Xu YH, Okazaki M (2009) Comparison of nitrogen
dry deposition on cedar and oak leaves in the Tama Hills using foliar rinsing
method. Water Air Soil Pollut 202: 369–377
Kohno Y, Matsumura H, Ishii T, Izuta T (2005) Establishing critical levels of air
pollutants for protecting East Asian vegetation - A challenge. In: Omasa K,
Nouchi I, De Kok LJ (eds) Plant responses to air pollution and global change.
Springer-Verlag, Tokyo, pp 243–250
Koike T (1998) Comparative ecophysiology of the leaf photosynthetic traits in
Japanese beech grown in provenances facing the Pacific Ocean and the Sea of
Japan. Journal of phytogeography and taxonomy 46: 23–28 (In Japanese)
Kume A, Numata S, Watanabe K, Honoki H, Nakajima H, Ishida M (2009) Influence
of air pollution on the mountain forests along the Tateyama–Kurobe Alpine
route. Ecol Res 24: 821–830
Limm EB, Simonin KA, Bothman AG (2009) Foliar water uptake: a common water
acquisition strategy for plants of the redwood forest. Oecologia, 161:
449–459
Matsuda K, Fukuzaki N, Maeda M (2001) A case study on estimation of dry
deposition of sulphur and nitrogen compounds by inferential method. Water
Air Pollut 130: 553–558
Matyssek R, Sandermann H (2003) Impact of ozone on trees: an ecophysiological
perspective. In: Esser K, Lüttge U, Beyschlag W, Hellwig F (eds) Progress in
Botany 64. Springer-Verlage, Berlin Heidelberg: pp 349–404
Matyssek R, Bahnweg G, Ceulemans R, Fabian P, Grill D, Hanke DE, Kraigher H,
Oßwald W, Rennenberg H, Sandermann H, Tausz M, Wieser G (2007)
Synopsis of the CASIROZ case study: Carbon sink strength of Fagus
sylvatica L. in a changing environment - Experimental risk assessment of
mitigation by chronic ozone impact. Plant Biol 9: 163–180
Mills G (2004) Mapping Manual 2004, Chapter III Mapping Critical Levels for
Vegetation p 52.
http://www.rivm.nl/en/themasites/icpmm/manual-and-downloads/index.html
Accessed 2 February 2011
Ministry of the Environment (1996) About revision of the method for measuring the
air pollutants such as sulfur dioxide in the atmosphere. Transmittal from
Ministry Environment. http://www.env.go.jp/hourei/syousai.php?id=01000052
Accessed 2 February 2011 (In Japanese)
Ministry of the Environment (2004) Comprehensive report on acid deposition survey.
Ministry of the Environment, Tokyo, p 432 (In Japanese)
Ministry of the Environment (2009) Report on long term acid deposition monitoring
(fiscal 2003–2007). Ministry of the Environment, Tokyo, p191 (In Japanese)
Murai H, Yamatani K, Kataoka Y, Yui M (1991) Natural environment and its
conservation on Buna (Fagus crenata) forest. Soft science, Inc., Tokyo, p 399
(In Japanese)
Nakashizuka T, Iida S (1995) Composition, dynamics and disturbance regime of
temperate deciduous forests in Monsoon Asia. Vegetatio 121: 23–30
Nakashizuka T (2004) Story of forest trees and Japan. Tokai University Press, Hatano,
p 252 (In Japanese)
Network Center for EANET (ed) (2007) Data report 2006. Network Center for
EANET. http://www.eanet.cc/product.html Accessed 2 February 2011
Ohara T, Akimoto H, Kurokawa J, Horii N, Yamaji K, Yan X, Hatasaka T (2007) An
Asian emission inventory of anthropogenic emission sources for the period
1980-2020. Atmos Chem Phys 7:4419–4444
Ohara T (2011) Why is the increase of tropospheric ozone concentration in mountain
and island regions in Japan? Japanese Journal of Ecology 60 (Accepted, In
Japanese)
Okochi H, Igawa M (2001) Elevational patterns of acid deposition into a forest and
nitrogen saturation on Mt. Oyama, Japan. Water Air Soil Pollut 130:
1091–1096
Ollinger SV, Aber JD, Reich PB, Freuder RJ (2002) Interactive effects of nitrogen
deposition, tropospheric ozone, elevated CO2 and land use history on the
carbon dynamics of northern hardwood forests. Glob Chang Biol 8: 545–562
Paludan-Müller G, Saxe H, Leverenz JW (1999) Responses to ozone in 12
provenances of European beech (Fagus sylvatica): genotypic variation and
chamber effects on photosynthesis and dry-matter partitioning. New Phytol
144:261-273
Pretzsch H, Dieler J, Matyssek R, Wipfler P (2009) Tree and stand growth of mature
Norway spruce and European beech under long-term ozone fumigation.
Environ Pollut 158: 1061–1070
Puxbaum H, Gregori M (1998) Seasonal and annual deposition rates of sulphur,
nitrogen and chloride species to an oak forest in north-eastern Austria
(Wolkersdorf, 240 m A.S.L). Atmos Environ 32: 3557–3568
Sase H, Takahashi A, Sato M, Kobayashi H, Nakata M, Totsuka T (2008) Seasonal
variation in the atmospheric deposition of inorganic constituents and canopy
interactions in a Japanese cedar forest. Environ Pollut 152: 1–10
Simpson D, Ashmore MR, Emberson L, Tuovinen J-P (2007) A comparison of two
different approaches for mapping potential ozone damage to vegetation. A
model study. Environ Pollut 146:715–725
Takeda M, Aihara K (2007) Effects of ambient ozone concentrations on Beech
(Fagus crenanta) seedlings in the Tanzawa Mountains, Kanagawa Prefecture,
Japan. J Jpn Soc Atmos Environ 42: 107–117 (In Japanese with English
summary)
Tanimoto H, Sawa Y, Matsueda H, Uno I, Ohara T, Yamaji K, Kurokawa J,
Yonemura S. (2005) Significant latitudinal gradient in the surface ozone
spring maximum over East Asia. Geophys Res Lett 32:L21805
Terazawa K, Koyama H (2008) Applied ecology for restoration of beech forests.
Bun-ichi Sogo Shuppan Co., Tokyo, p 310 (In Japanese)
Thomas VFD, Braun S, Flückiger W (2005) Effects of simultaneous ozone exposure
and nitrogen loads on carbohydrate concentrations, biomass, and growth of
young spruce trees (Picea abies). Environ Pollut 137: 507–516
Utriainen J, Holopainen T (2001a) Influence of nitrogen and phosphorus availability
and ozone stress on Norway spruce seedlings. Tree Physiol 21: 447–456
Utriainen J, Holopainen T (2001b) Nitrogen availability modifies the ozone
responses of Scots pine seedlings exposed in an open-field system. Tree
Physiol 21: 1205–1213
Wakamatsu S, Uno I, Ohara T (1998) Springtime photochemical air pollution in
Osaka: Field observation. J Appl Meteorol 37: 1100–1106
Watanabe M, Yamaguchi M, Iwasaki M, Matsuo N, Naba J, Tabe C, Matsumura H,
Kohno Y, Izuta T (2006) Effects of ozone and/or nitrogen load on the growth
of Larix kaempferi, Pinus densiflora and Cryptomeria japonica seedlings. J
Jpn Soc Atmos Environ 41:320–334.
Watanabe M, Yamaguchi M, Tabe C, Iwasaki M, Yamashita R, Funada R, Fukami M,
Matsumura H, Kohno Y, Izuta T (2007) Influences of nitrogen load on the
growth and photosynthetic responses of Quercus serrata seedlings to O3.
Trees 21:421–432
Watanabe M, Matsuo N, Yamaguchi M, Matsumura H, Kohno Y, Izuta T (2010) Risk
assessment of ozone impact on the carbon absorption of Japanese
representative conifers. Eur J Forest Res 129: 421–430
Yamaguchi M, Watanabe M, Iwasaki M, Tabe C, Matsumura H, Kohno Y, Izuta T
(2007) Growth and photosynthetic responses of Fagus crenata seedlings to O3
under different nitrogen loads. Trees 21: 707–718
Yamaguchi M, Watanabe M, Matsumura H, Kohno Y, Izuta T (2010a) Effects of
ozone on nitrogen metabolism in the leaves of Fagus crenata seedlings under
different soil nitrogen loads. Trees 24: 175–184
Yamaguchi T, Noguchi I, Eguchi M. (2010b) Ambient ozone concentration around
Lake Mashu, Hokkaido, Japan. Transactions of the meeting in Hokkaido
branch of the Japanese forest society 58: 123–124 (In Japanese)
Yamaji K, Ohara T, Uno I, Tanimoto H, Kurokawa J, Akimoto H (2006) Analysis of
the seasonal variation of ozone in the boundary layer in East Asia using the
Community Multi-scale Air Quality model: What controls surface ozone
levels over Japan? Atmos Environ 40: 1856–1868
Yamaji K, Ohara T, Uno I, Kurokawa J, Pochanart P, Akimoto H (2008) Future
prediction of surface ozone over east Asia using Models-3 Community
Multiscale Air Quality Modeling System and Regional Emission Inventory in
Asia. J Geophys Res 113: D08306
Yonekura T, Honda Y, Oksanen E, Yoshidome M, Watanabe M, Funada R, Koike T,
Izuta T (2001) The influences of ozone and soil water stress, singly and in
combination, on leaf gas exchange rates, leaf ultrastructural characteristics
and annual ring width of Fagus crenata seedlings. J Jpn Soc Atmos Environ
36:333–351
Yoshikado H (2004) One possible factor causing recent trend of photochemical
oxidants. J Jpn Soc Atmos Environ 39: 188–199 (In Japanese with English
summary)
Captions of figures
Fig. 1 Monthly variations of estimated K value (the ratio of concentration in the
precipitation to that in the atmosphere) of NOX and NHY. Each value is the mean of
the data in 1999, 2000 and 2001, and the standard deviation is shown by vertical bars
Fig. 2 The habitats of Fagus crenata and classification of the regions in Japan
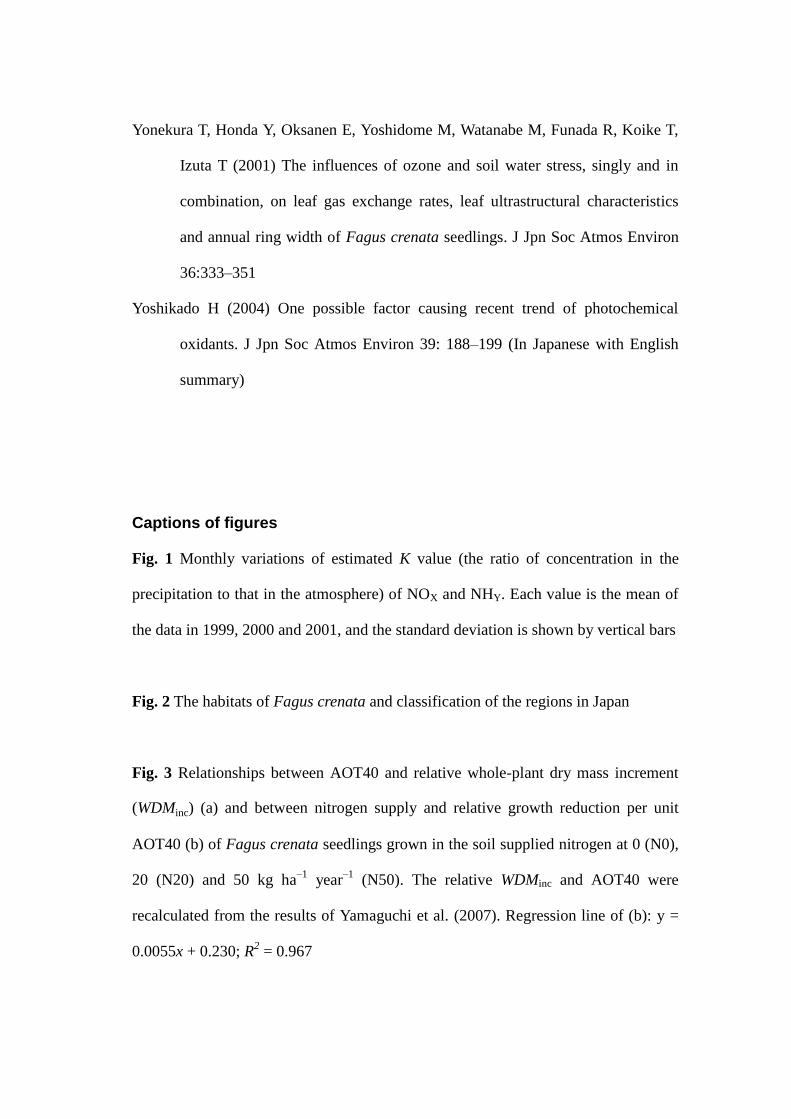
Fig. 3 Relationships between AOT40 and relative whole-plant dry mass increment
(WDMinc) (a) and between nitrogen supply and relative growth reduction per unit
AOT40 (b) of Fagus crenata seedlings grown in the soil supplied nitrogen at 0 (N0),
20 (N20) and 50 kg ha–1
year–1
(N50). The relative WDMinc and AOT40 were
recalculated from the results of Yamaguchi et al. (2007). Regression line of (b): y =
0.0055x + 0.230; R2 = 0.967
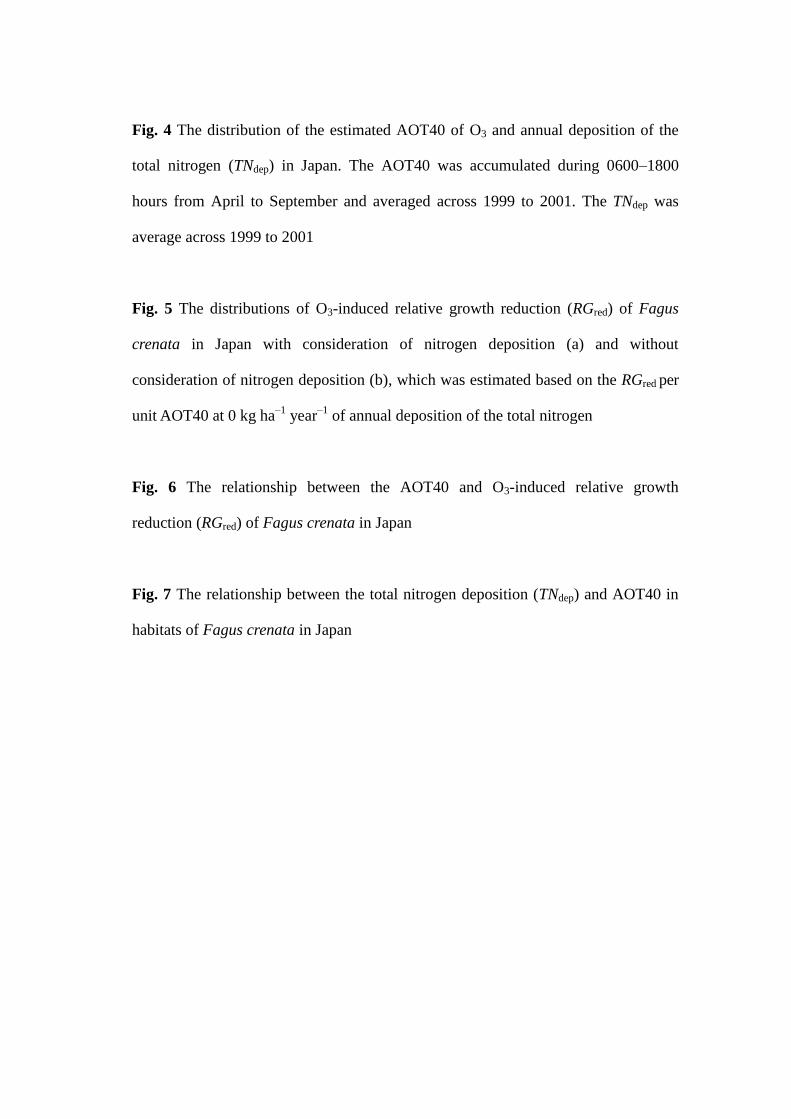
Fig. 4 The distribution of the estimated AOT40 of O3 and annual deposition of the
total nitrogen (TNdep) in Japan. The AOT40 was accumulated during 0600–1800
hours from April to September and averaged across 1999 to 2001. The TNdep was
average across 1999 to 2001
Fig. 5 The distributions of O3-induced relative growth reduction (RGred) of Fagus
crenata in Japan with consideration of nitrogen deposition (a) and without
consideration of nitrogen deposition (b), which was estimated based on the RGred per
unit AOT40 at 0 kg ha–1
year–1
of annual deposition of the total nitrogen
Fig. 6 The relationship between the AOT40 and O3-induced relative growth
reduction (RGred) of Fagus crenata in Japan
Fig. 7 The relationship between the total nitrogen deposition (TNdep) and AOT40 in
habitats of Fagus crenata in Japan
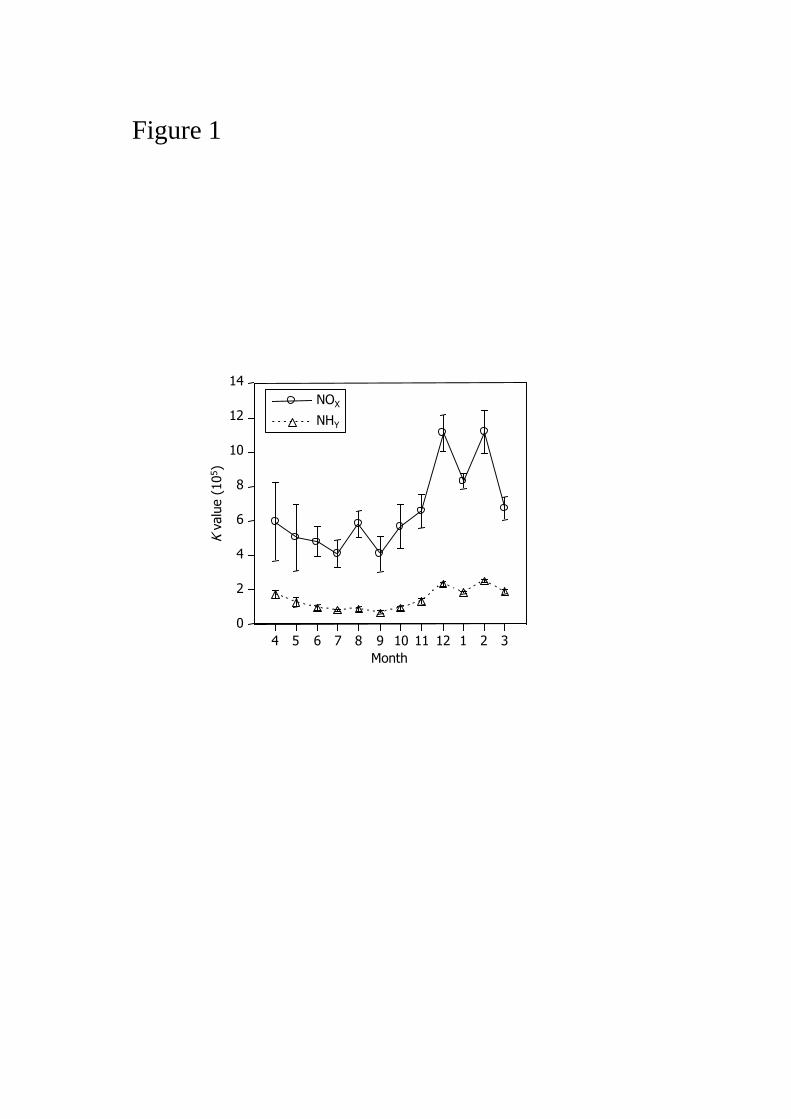
Figure 1
0
200000
400000
600000
800000
1000000
1200000
1400000
1 2 3 4 5 6 7 8 9 1011121314
NOx
NHy
Kvalu
e (
10
5)
Month
4 5 6 7 8 9 10 11 12 1 2 3
14
12
10
8
6
4
2
0
NOX
NHY
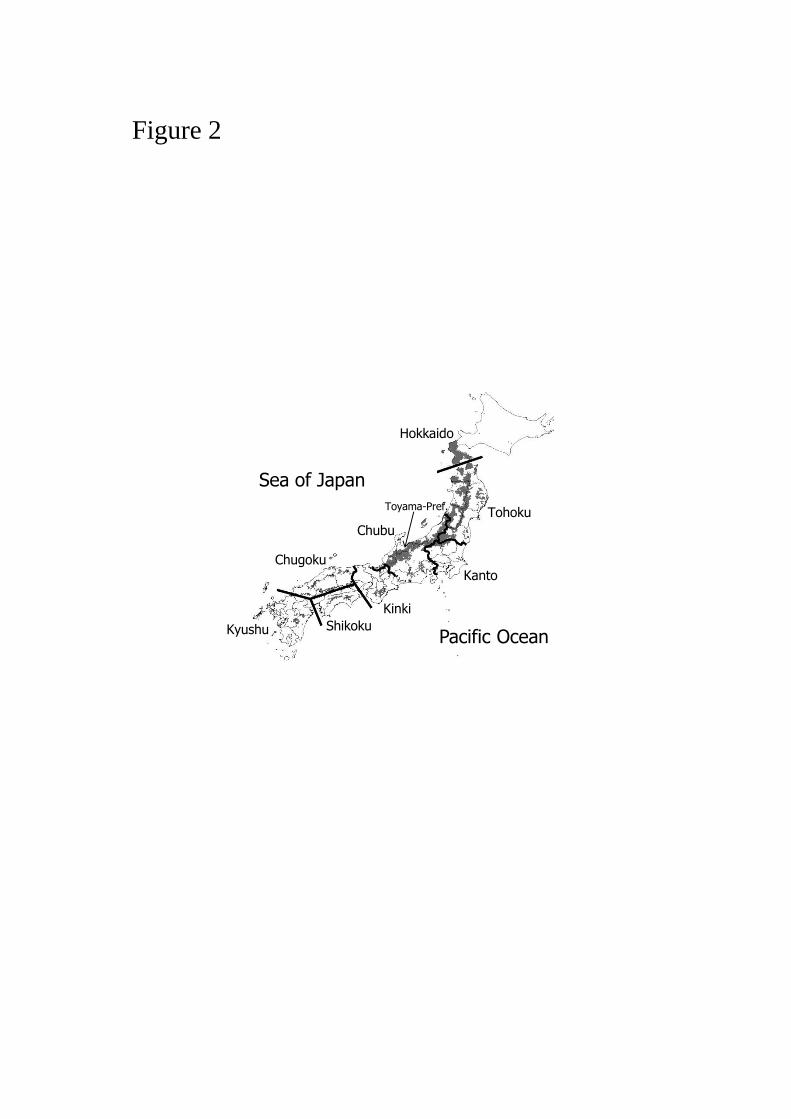
Figure 2
Hokkaido
Tohoku
Kanto
Chubu
Kinki
Chugoku
ShikokuKyushu
Sea of Japan
Pacific Ocean
Toyama-Pref.
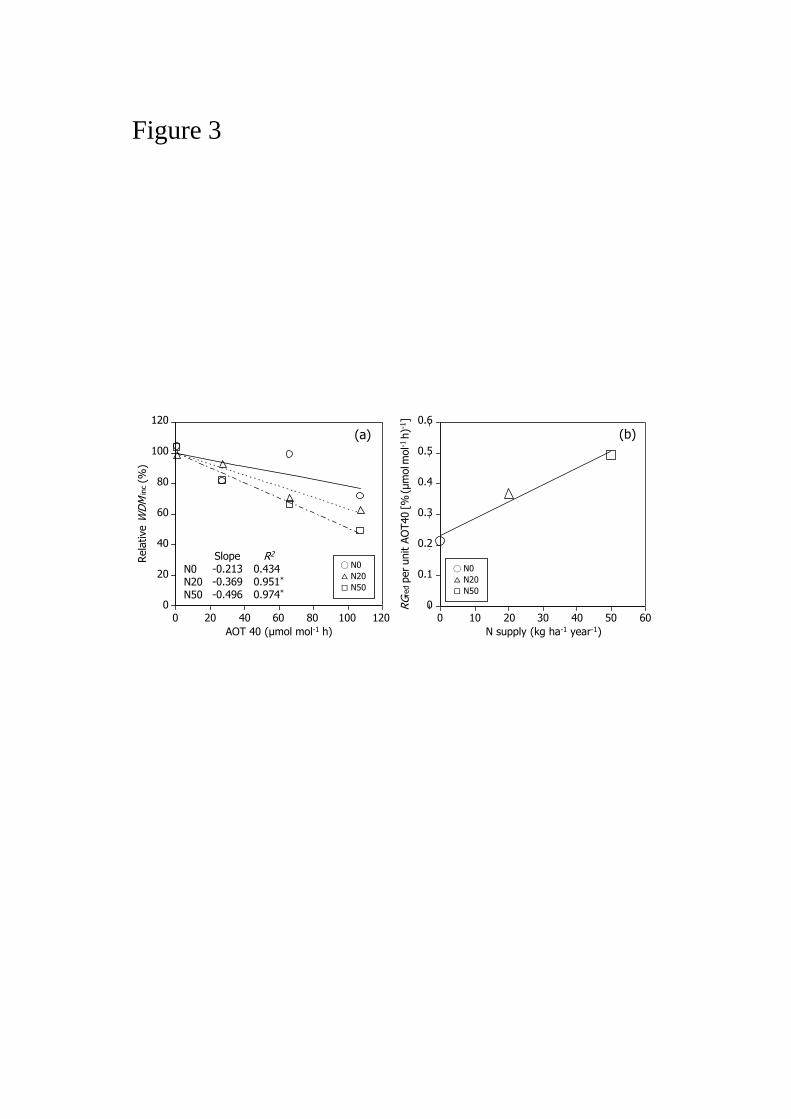
Figure 3
0 20 40 60 80 100 1200
20
40
60
80
100
120
0 20 40 60 80 100 120
AOT40 (μmol mol-1
h)
Rel
ativ
e W
DM
inc
(%)
Rela
tive W
DM
inc (%
)
AOT 40 (μmol mol-1 h)
120
100
80
60
40
20
0
◯ N0
△ N20
□ N50
Slope-0.213-0.369-0.496
R2
0.434*
0.951*
0.974*
N0N20N50
0
0.1
0.2
0.3
0.4
0.5
0.6
0 10 20 30 40 50 60
N load (kg ha-1 year-1)
Rel
ativ
e re
duct
ion p
er u
nit
AO
T40[%
(ppm
h)-
1]
RG
red
perunit A
OT40
[%(μ
molm
ol-1
h)-
1]
N supply (kg ha-1 year-1)
0 10 20 30 40 50 60
0.6
0.5
0.4
0.3
0.2
0.1
0
◯ N0
△ N20
□ N50
(a) (b)
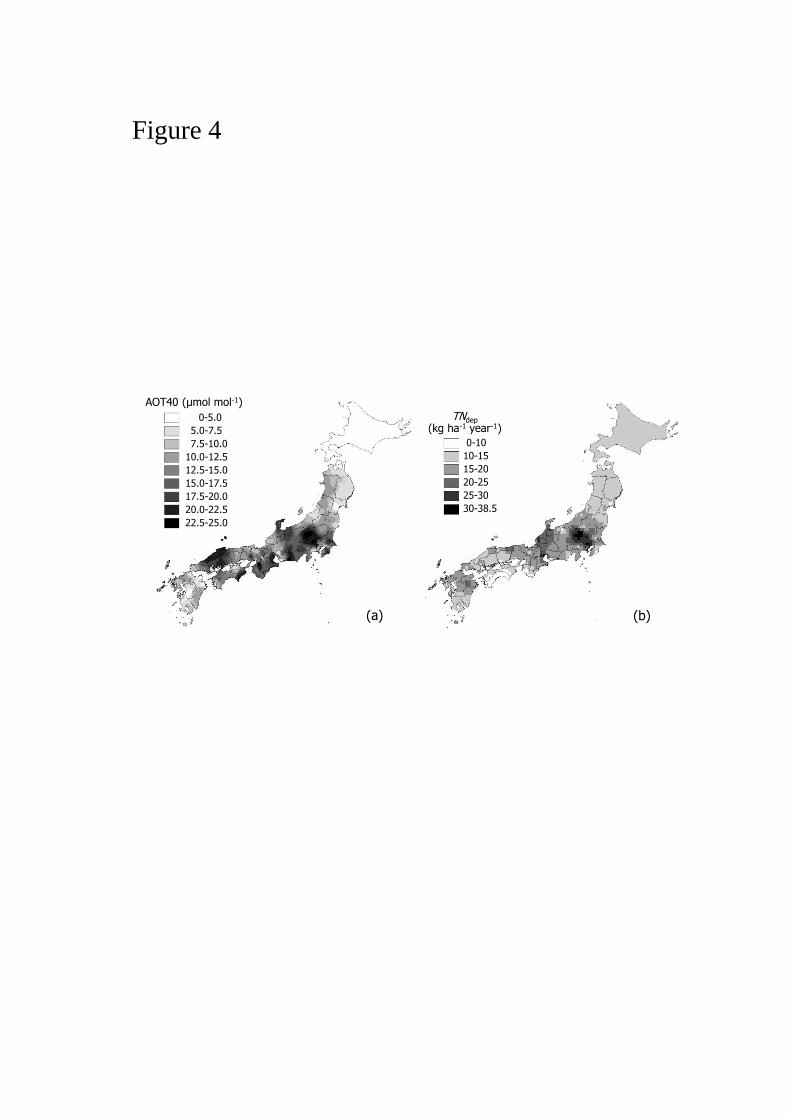
Figure 4
0-5.0
5.0-7.5
7.5-10.0
10.0-12.5
12.5-15.0
15.0-17.5
17.5-20.0
20.0-22.5
22.5-25.0
AOT40 (μmol mol-1)
0-10
10-15
15-20
20-25
25-30
30-38.5
TNdep
(kg ha-1 year-1)
(a) (b)
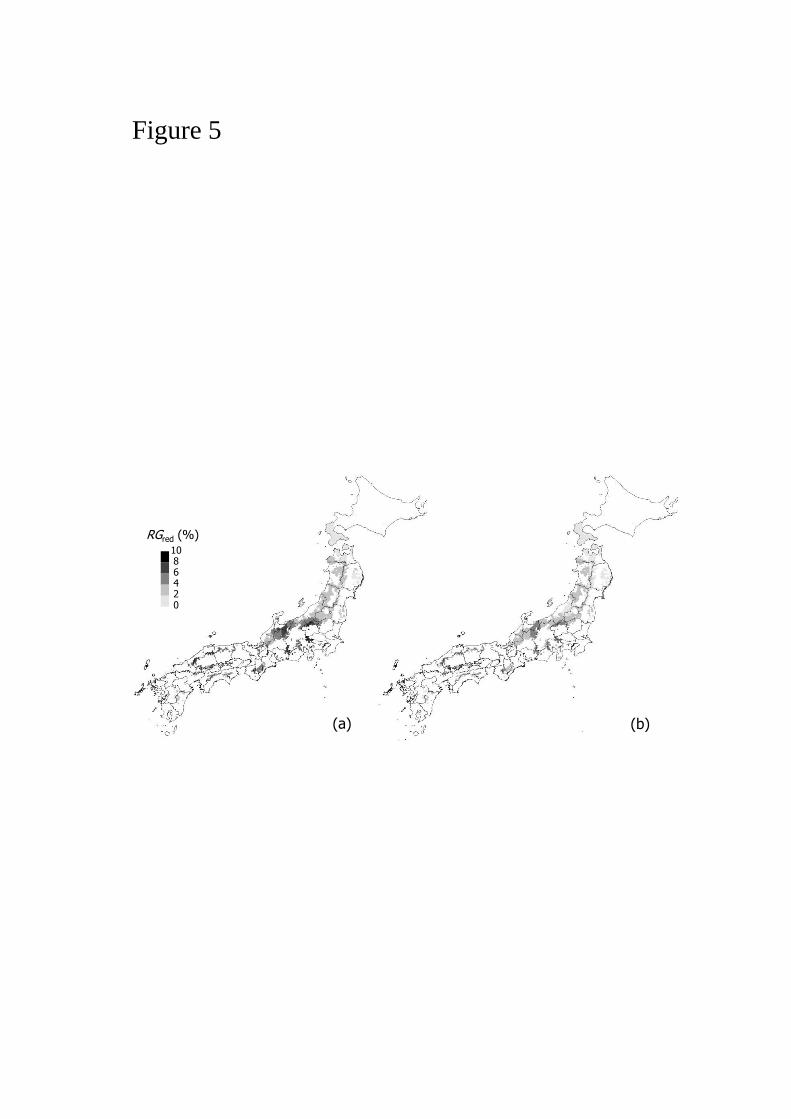
Figure 5
1086420
RGred (%)
(a) (b)
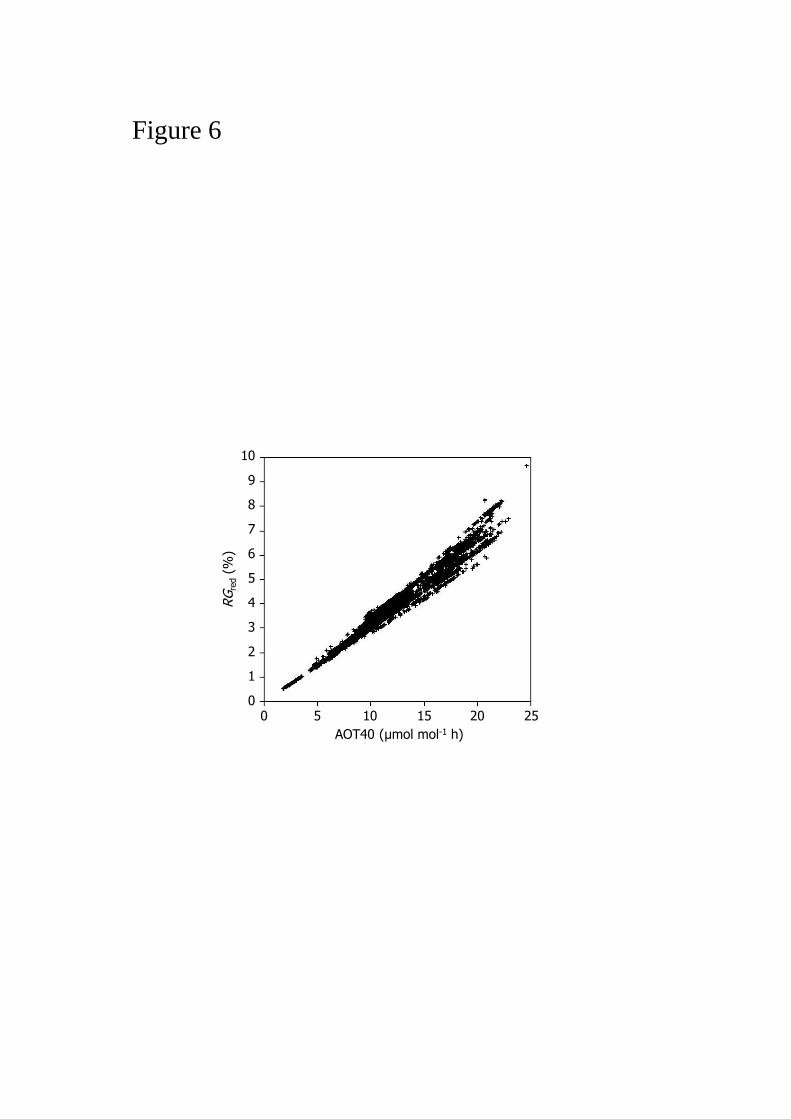
Figure 6
RG
red
(%)
AOT40 (μmol mol-1 h)
10
9
8
7
6
5
4
3
2
1
00 5 10 15 20 25
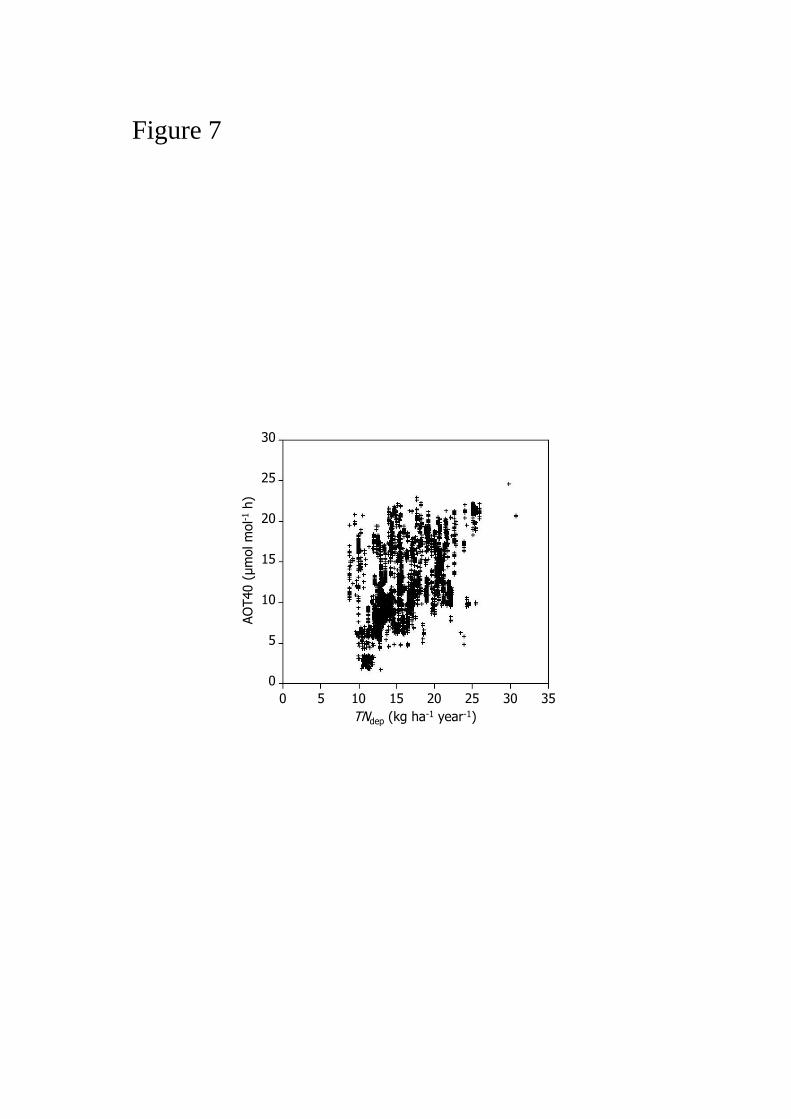
Figure 7
AO
T40 (
μm
ol m
ol-1
h)
TNdep (kg ha-1 year-1)
0 5 10 15 20 25 30 35
30
25
20
15
10
5
0