Embed Size (px)
Citation preview
1SINTEF Energy Research
Risk based distribution system asset management -looking ahead
Kjell Sand, SINTEF Energy Research
CIGRE Seminario Internacional on Asset Management Regente Palace Hotel
Buenos Aires – 23 al 24 de Oct. de 2006
2SINTEF Energy Research
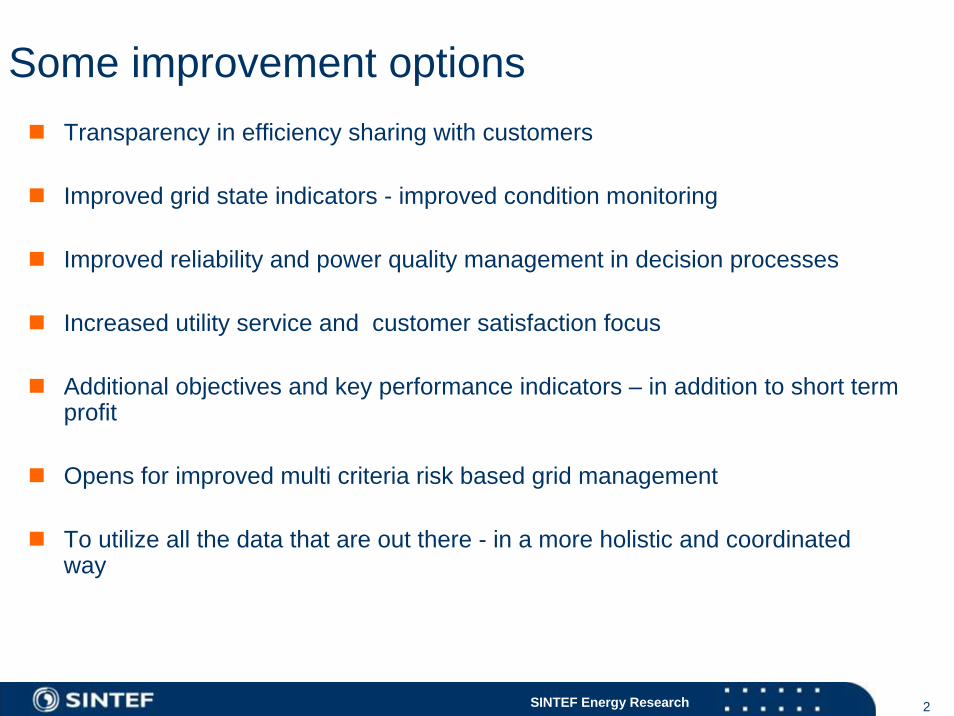
Some improvement optionsTransparency in efficiency sharing with customers
Improved grid state indicators - improved condition monitoring
Improved reliability and power quality management in decision processes
Increased utility service and customer satisfaction focus
Additional objectives and key performance indicators – in addition to short term profit
Opens for improved multi criteria risk based grid management
To utilize all the data that are out there - in a more holistic and coordinated way
3SINTEF Energy Research
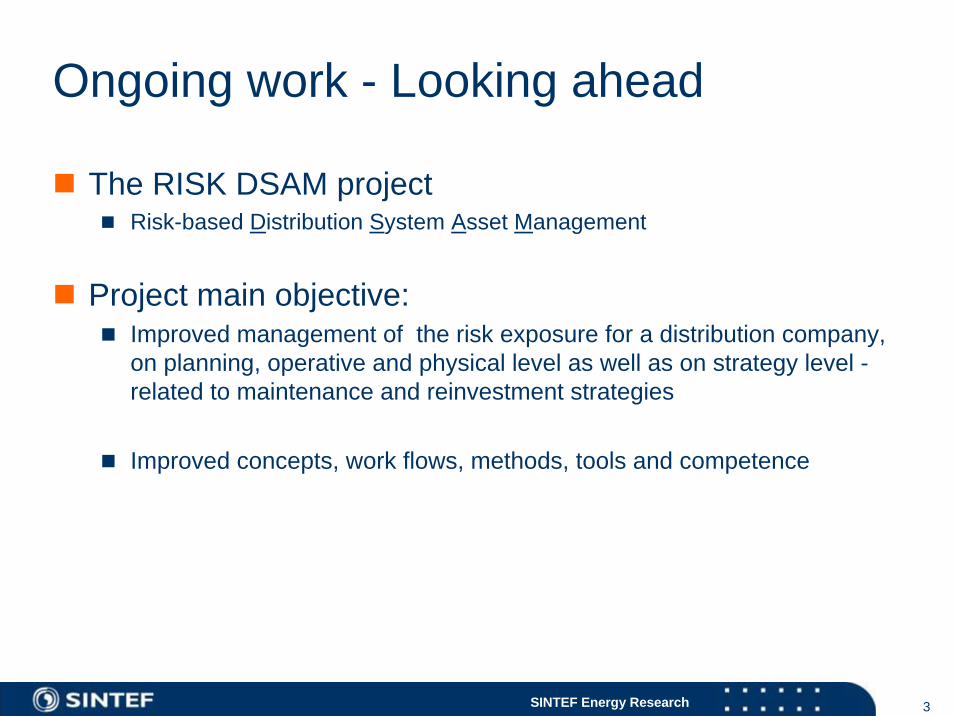
Ongoing work - Looking ahead
The RISK DSAM projectRisk-based Distribution System Asset Management
Project main objective:Improved management of the risk exposure for a distribution company, on planning, operative and physical level as well as on strategy level -related to maintenance and reinvestment strategies
Improved concepts, work flows, methods, tools and competence
4SINTEF Energy Research
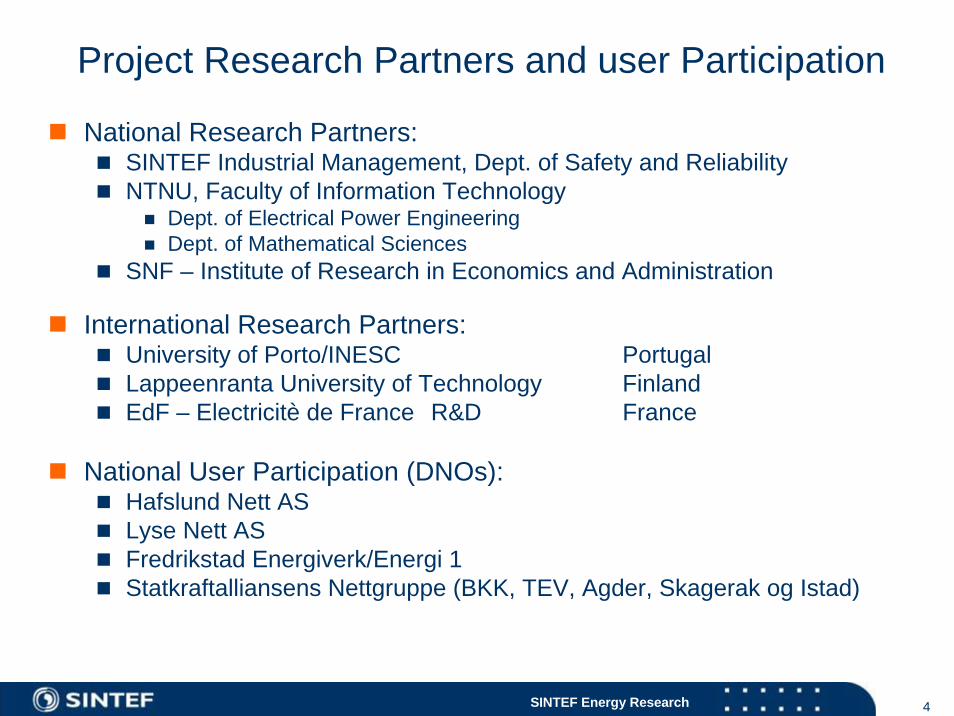
Project Research Partners and user Participation
National Research Partners:SINTEF Industrial Management, Dept. of Safety and ReliabilityNTNU, Faculty of Information Technology
Dept. of Electrical Power EngineeringDept. of Mathematical Sciences
SNF – Institute of Research in Economics and Administration
International Research Partners:University of Porto/INESC PortugalLappeenranta University of Technology FinlandEdF – Electricitè de France R&D France
National User Participation (DNOs):Hafslund Nett ASLyse Nett ASFredrikstad Energiverk/Energi 1Statkraftalliansens Nettgruppe (BKK, TEV, Agder, Skagerak og Istad)
5SINTEF Energy Research
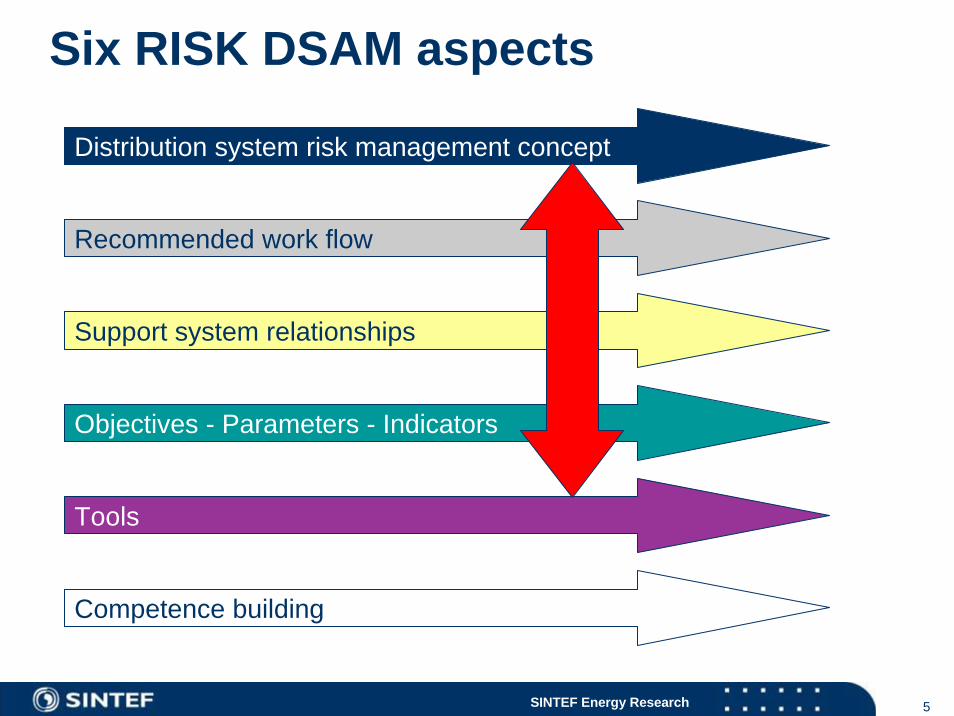
Six RISK DSAM aspects
Recommended work flow
Support system relationships
Distribution system risk management concept
Objectives - Parameters - Indicators
Tools
Competence building
6SINTEF Energy Research
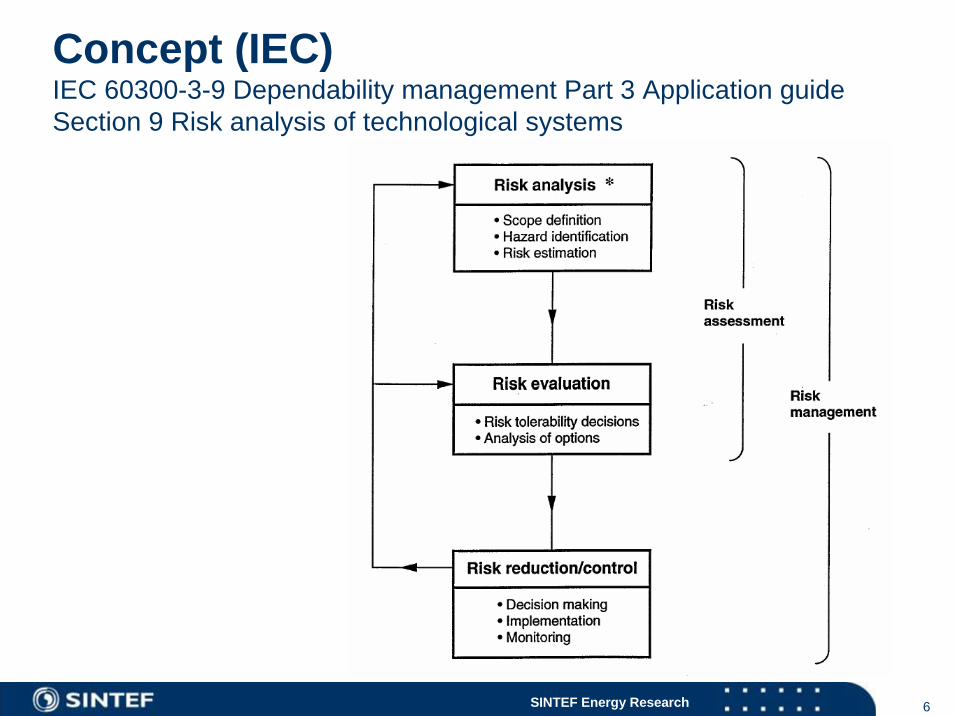
Concept (IEC)IEC 60300-3-9 Dependability management Part 3 Application guide Section 9 Risk analysis of technological systems
7SINTEF Energy Research
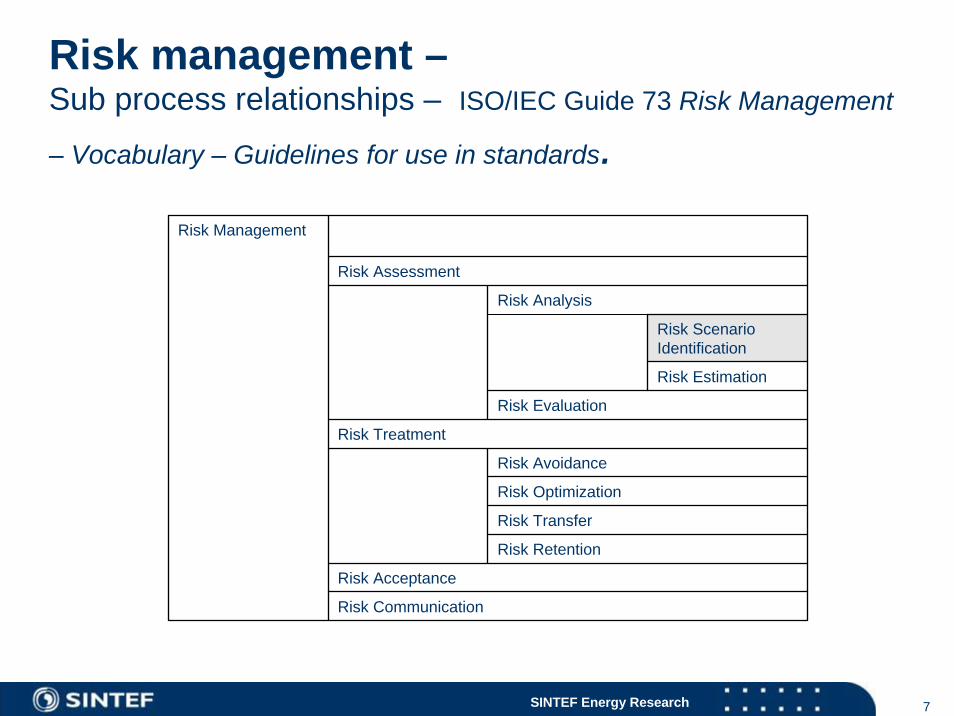
Risk management –Sub process relationships – ISO/IEC Guide 73 Risk Management
– Vocabulary – Guidelines for use in standards.
Risk Assessment
Risk Analysis
Risk Scenario Identification
Risk Estimation
Risk Evaluation
Risk Treatment
Risk Avoidance
Risk Optimization
Risk Transfer
Risk Retention
Risk Acceptance
Risk Communication
Risk Management
8SINTEF Energy Research
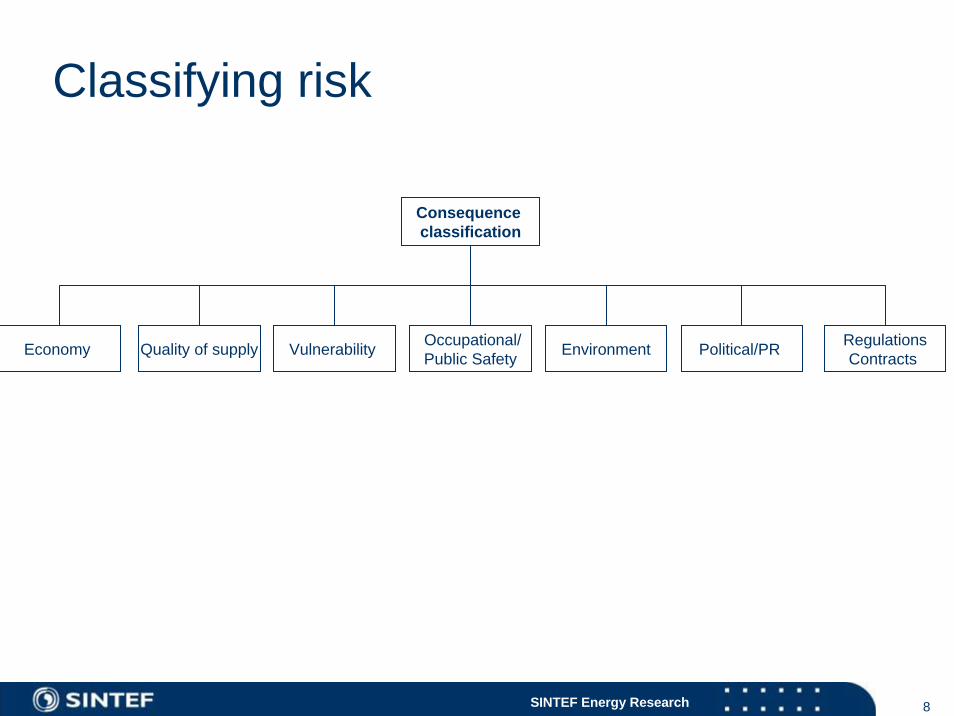
Consequence classification
Economy Quality of supply Occupational/Public Safety Environment Political/PR Vulnerability Regulations
Contracts
Classifying risk
9SINTEF Energy Research
Con
cept
/wor
kflo
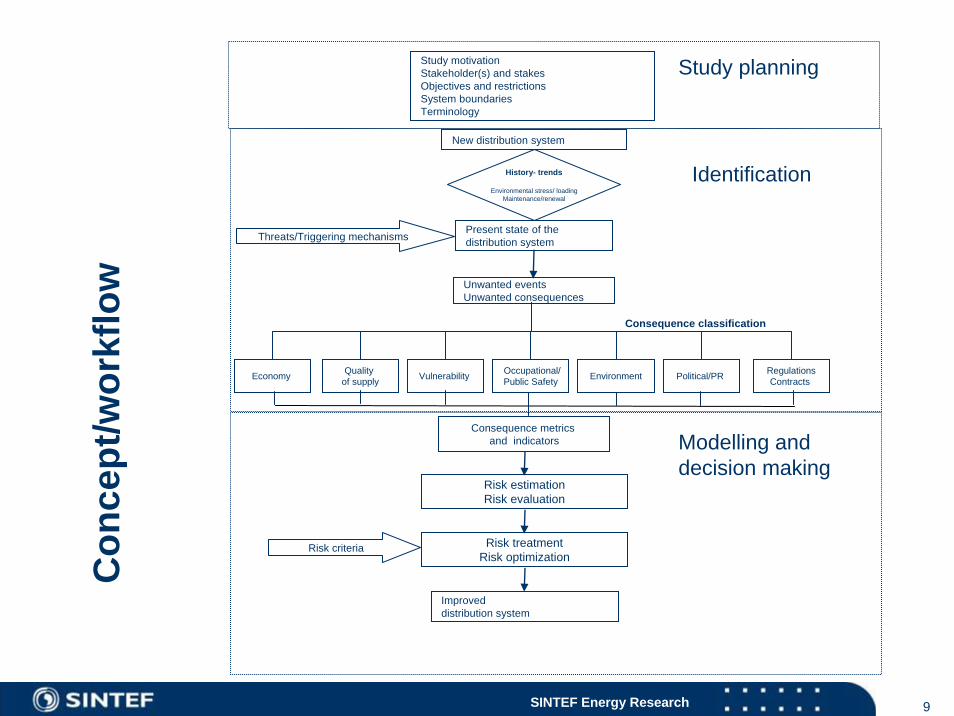
wNew distribution system
History- trends
Environmental stress/ loadingMaintenance/renewal
Present state of the distribution systemThreats/Triggering mechanisms
Unwanted eventsUnwanted consequences
Consequence classification
Consequence metrics and indicators
Risk estimationRisk evaluation
Risk treatmentRisk optimization
Risk criteria
Improveddistribution system
Identification
Modelling and decision making
Study planningStudy motivationStakeholder(s) and stakesObjectives and restrictionsSystem boundariesTerminology
Economy Quality of supply
Occupational/Public Safety Environment Political/PR Vulnerability Regulations
Contracts
10SINTEF Energy Research
Ongoing work:Key Performance Indicators
11SINTEF Energy Research
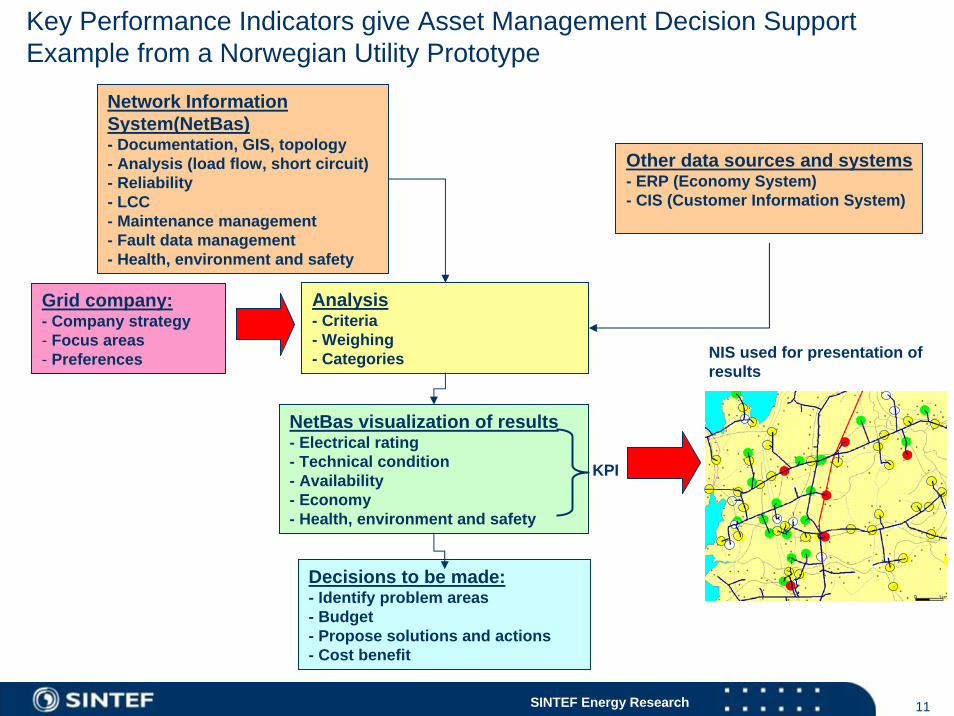
Network Information System(NetBas)- Documentation, GIS, topology - Analysis (load flow, short circuit)- Reliability- LCC- Maintenance management- Fault data management- Health, environment and safety
Analysis - Criteria- Weighing- Categories
Other data sources and systems- ERP (Economy System)- CIS (Customer Information System)
NetBas visualization of results- Electrical rating- Technical condition- Availability- Economy- Health, environment and safety
Decisions to be made:- Identify problem areas- Budget- Propose solutions and actions- Cost benefit
KPI
NIS used for presentation of results
Grid company:- Company strategy- Focus areas- Preferences
Key Performance Indicators give Asset Management Decision Support Example from a Norwegian Utility Prototype
12SINTEF Energy Research
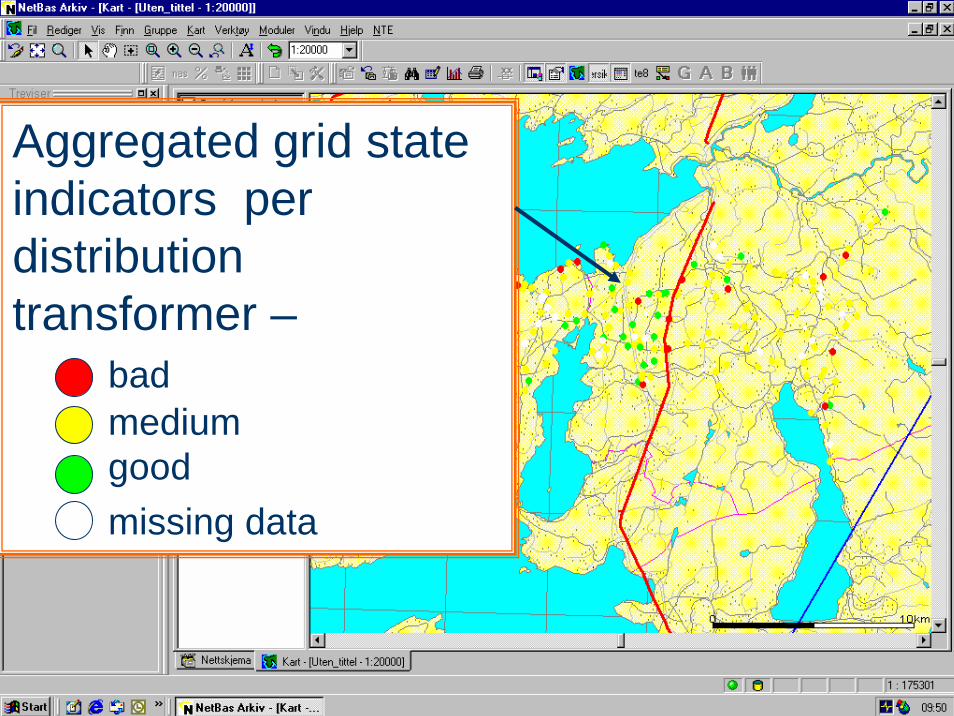
Aggregated grid stateindicators per distributiontransformer –
badmediumgoodmissing data
13SINTEF Energy Research
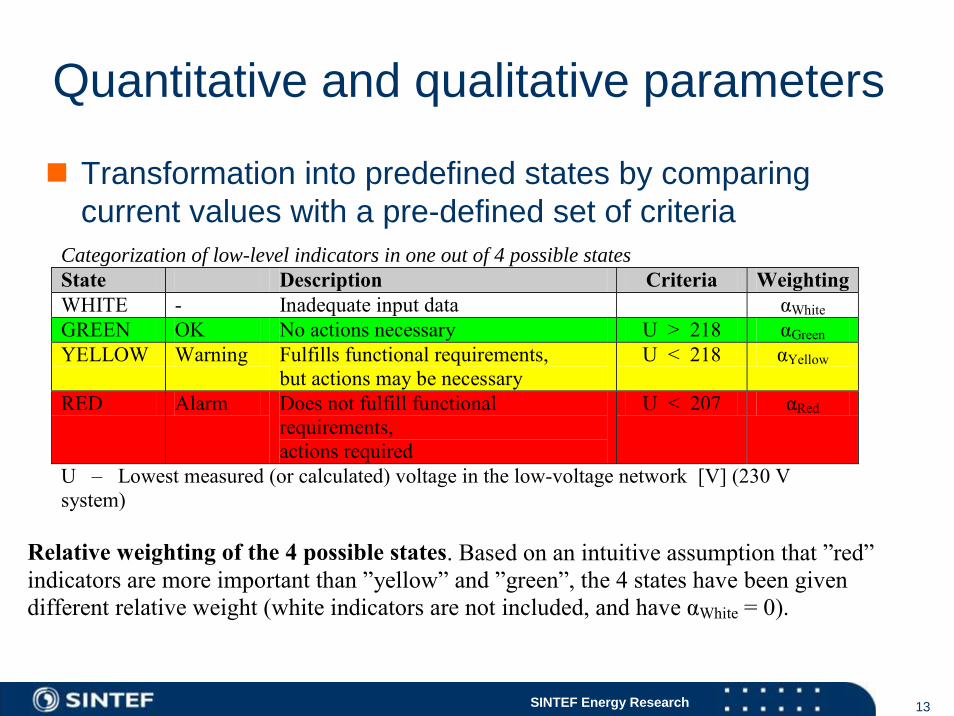
Quantitative and qualitative parameters
Transformation into predefined states by comparing current values with a pre-defined set of criteria
Categorization of low-level indicators in one out of 4 possible states State Description Criteria WeightingWHITE - Inadequate input data αWhite GREEN OK No actions necessary U > 218 αGreen YELLOW Warning Fulfills functional requirements,
but actions may be necessary U < 218 αYellow
RED Alarm Does not fulfill functional requirements, actions required
U < 207 αRed
U – Lowest measured (or calculated) voltage in the low-voltage network [V] (230 V system)
Relative weighting of the 4 possible states. Based on an intuitive assumption that ”red” indicators are more important than ”yellow” and ”green”, the 4 states have been given different relative weight (white indicators are not included, and have αWhite = 0).
14SINTEF Energy Research
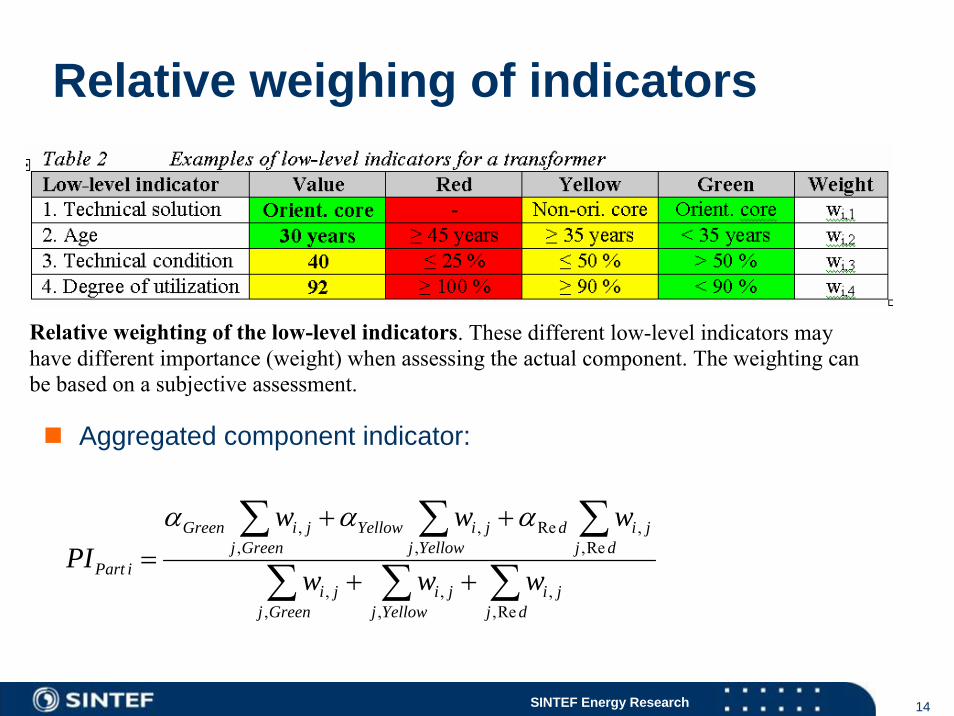
Relative weighing of indicators
Aggregated component indicator:
Relative weighting of the low-level indicators. These different low-level indicators may have different importance (weight) when assessing the actual component. The weighting can be based on a subjective assessment.
∑∑∑∑∑∑
++
++=
djji
Yellowjji
Greenjji
djjid
YellowjjiYellow
GreenjjiGreen
iPart www
wwwPI
Re,,
,,
,,
Re,,Re
,,
,, ααα
15SINTEF Energy Research
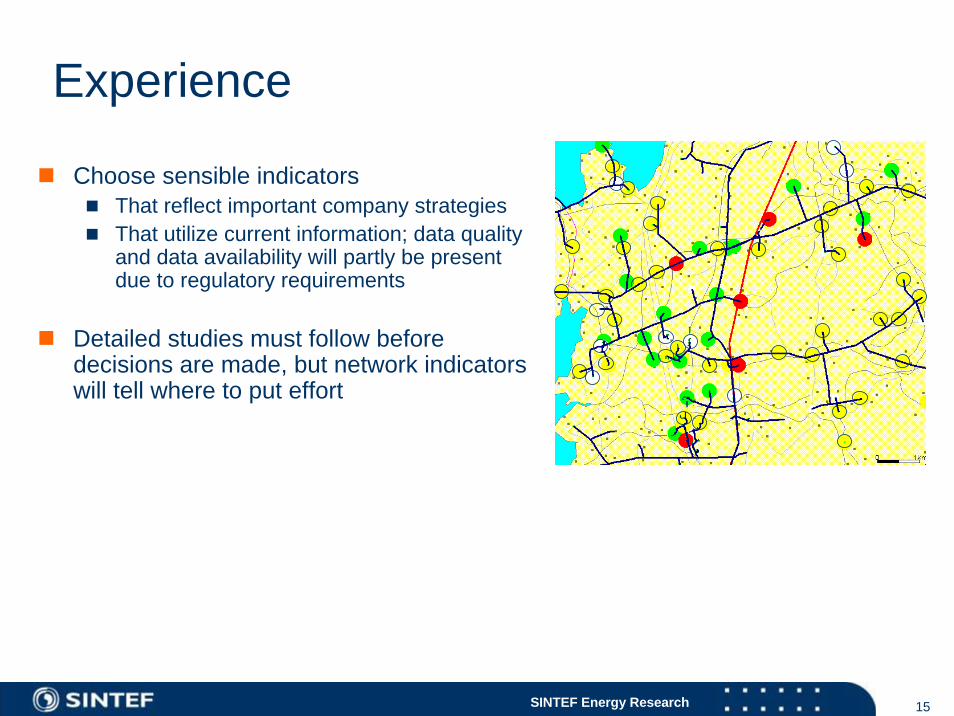
Experience
Choose sensible indicatorsThat reflect important company strategiesThat utilize current information; data quality and data availability will partly be present due to regulatory requirements
Detailed studies must follow before decisions are made, but network indicators will tell where to put effort
16SINTEF Energy Research
Ongoing work:Life time models - Failure models for network components as a basis for asset management
17SINTEF Energy Research
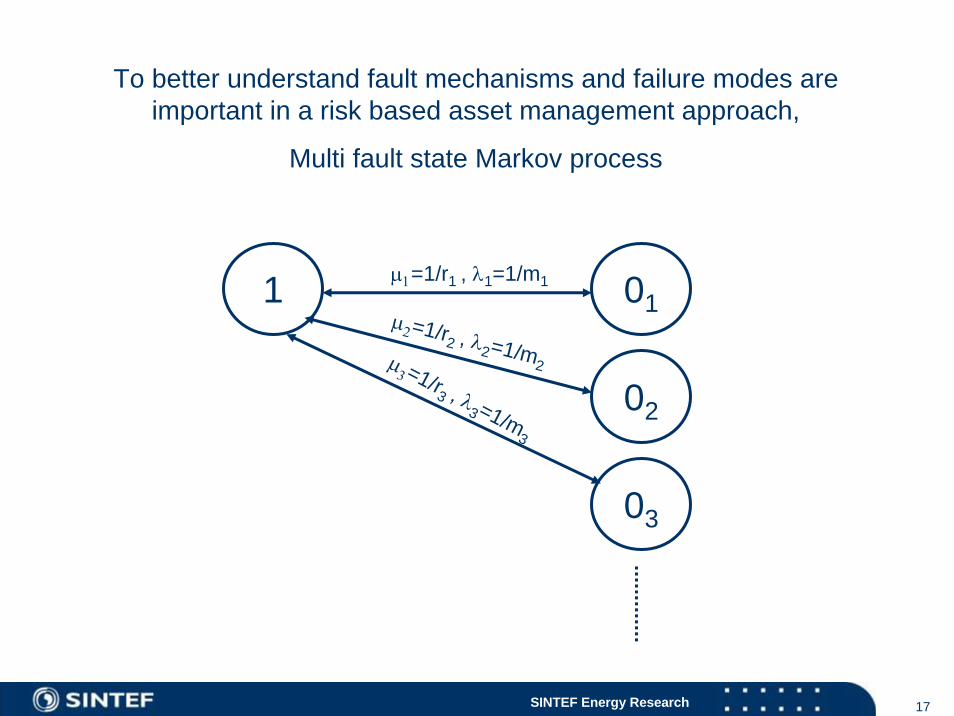
To better understand fault mechanisms and failure modes are important in a risk based asset management approach,
Multi fault state Markov process
μ1=1/r1 , λ1=1/m11 01
02
03
μ2=1/r2 , λ2=1/m2μ3=1/r3 , λ
3=1/m3
18SINTEF Energy Research
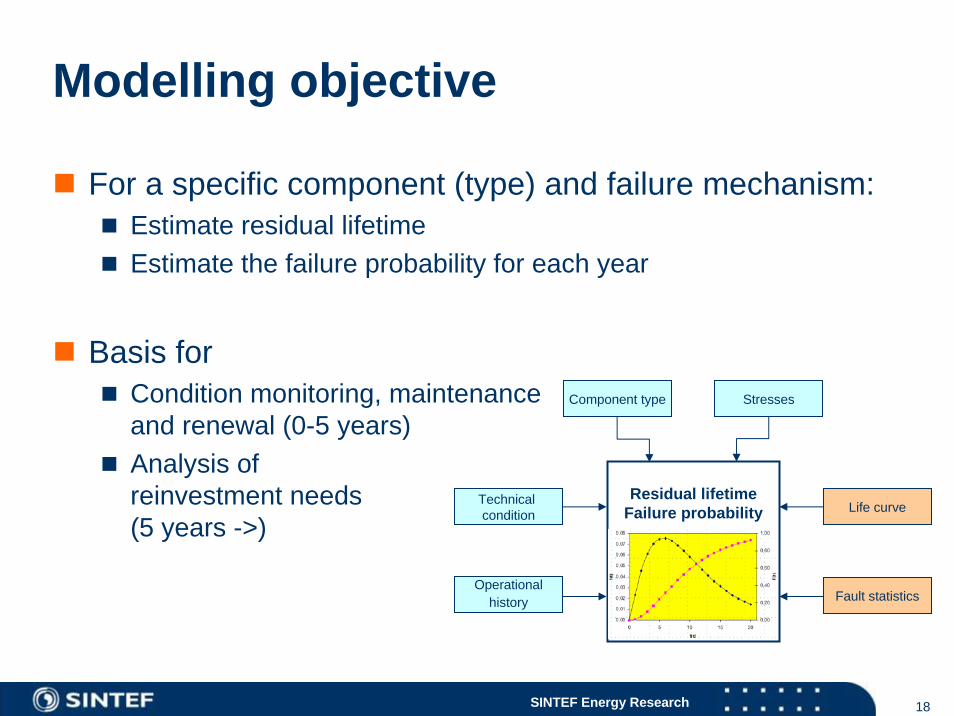
Modelling objective
For a specific component (type) and failure mechanism:Estimate residual lifetimeEstimate the failure probability for each year
Basis for Condition monitoring, maintenanceand renewal (0-5 years)Analysis ofreinvestment needs(5 years ->)
Technicalcondition
Fault statistics
Life curve
StressesComponent type
Operational history
Residual lifetimeFailure probability
19SINTEF Energy Research
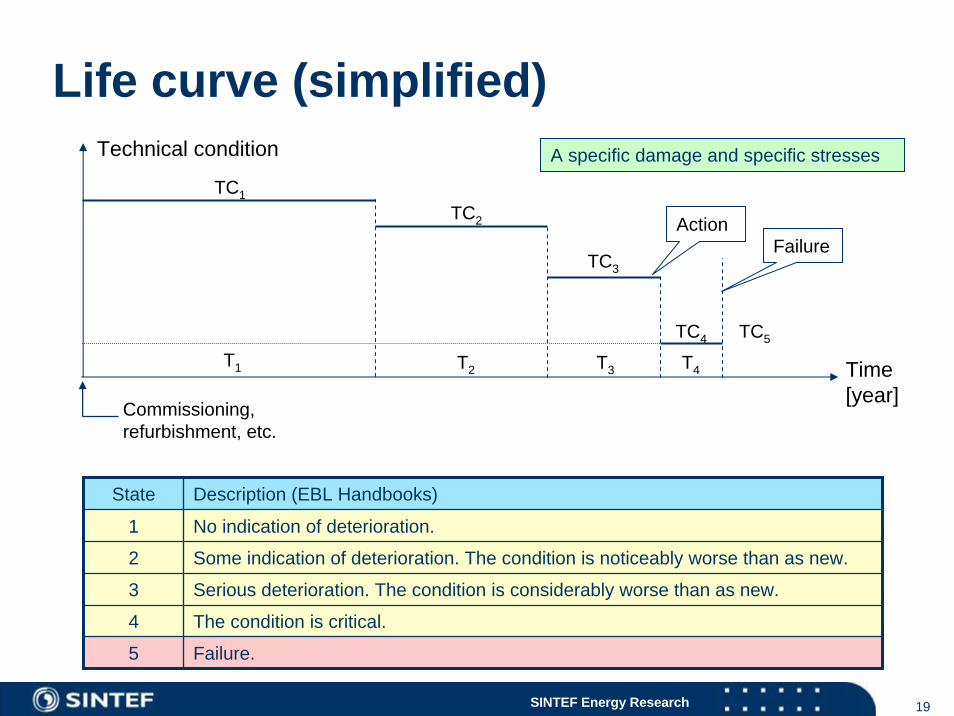
Life curve (simplified)
State Description (EBL Handbooks)
1 No indication of deterioration.
2 Some indication of deterioration. The condition is noticeably worse than as new.
3 Serious deterioration. The condition is considerably worse than as new.
4 The condition is critical.
5 Failure.
Time[year]
Technical condition
Commissioning,refurbishment, etc.
T1 T2 T3 T4
TC1
TC2
TC3
TC4 TC5
FailureAction
A specific damage and specific stresses
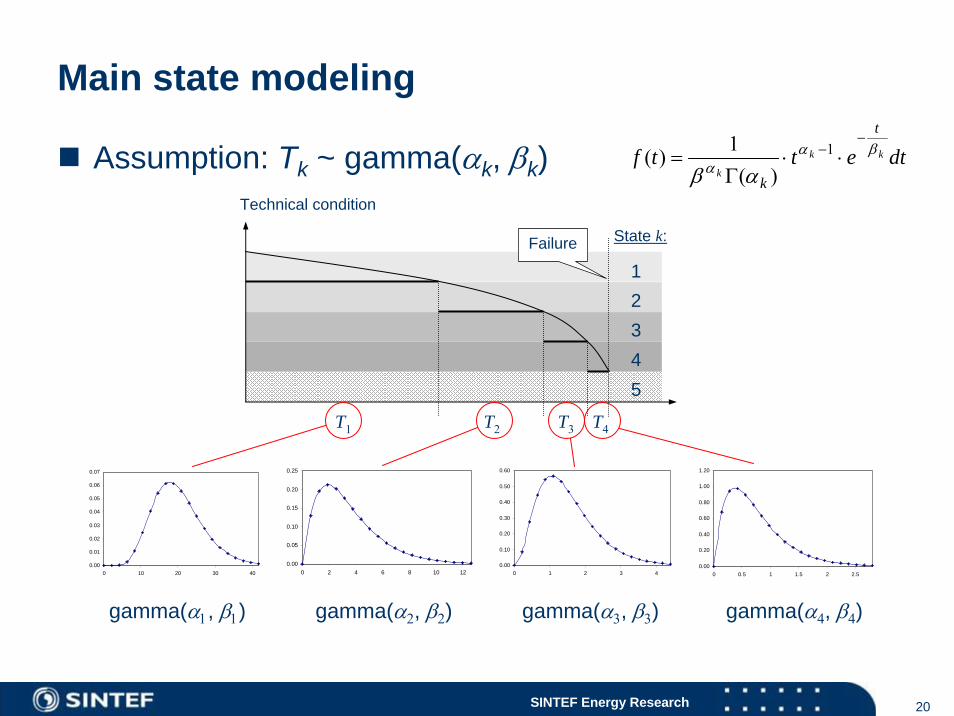
20SINTEF Energy Research
T3T1 T2 T4
Failure
12345
State k:
Technical condition
Assumption: Tk ~ gamma(αk, βk) dtettf kk
k
t
k
βαα αβ
−− ⋅⋅
Γ= 1
)(1)(
0.00
0.01
0.02
0.03
0.04
0.05
0.06
0.07
0 10 20 30 40
()
gamma(α1, β1)
0.00
0.05
0.10
0.15
0.20
0.25
0 2 4 6 8 10 12
gamma(α2, β2)
0.00
0.10
0.20
0.30
0.40
0.50
0.60
0 1 2 3 4
gamma(α3, β3)
0.00
0.20
0.40
0.60
0.80
1.00
1.20
0 0.5 1 1.5 2 2.5
gamma(α4, β4)
Main state modeling
21SINTEF Energy Research
0.00
0.20
0.40
0.60
0.80
1.00
1.20
0 0.5 1 1.5 2 2.50.00
0.10
0.20
0.30
0.40
0.50
0.60
0 1 2 3 4
0.00
0.05
0.10
0.15
0.20
0.25
0 2 4 6 8 10 120.00
0.01
0.02
0.03
0.04
0.05
0.06
0.07
0 10 20 30 40
()
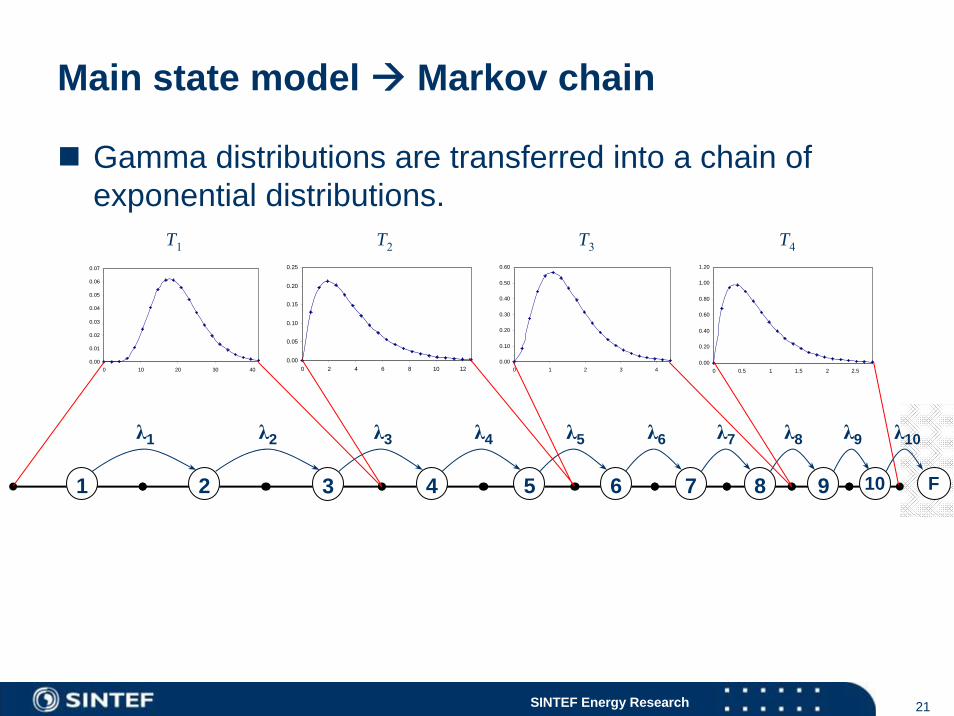
λ1 λ2 λ3 λ4 λ5 λ6 λ7 λ8 λ9
32 41 5 6 7 8 9 10 F
λ10
T3T1 T2 T4
Main state model Markov chain
Gamma distributions are transferred into a chain of exponential distributions.
22SINTEF Energy Research
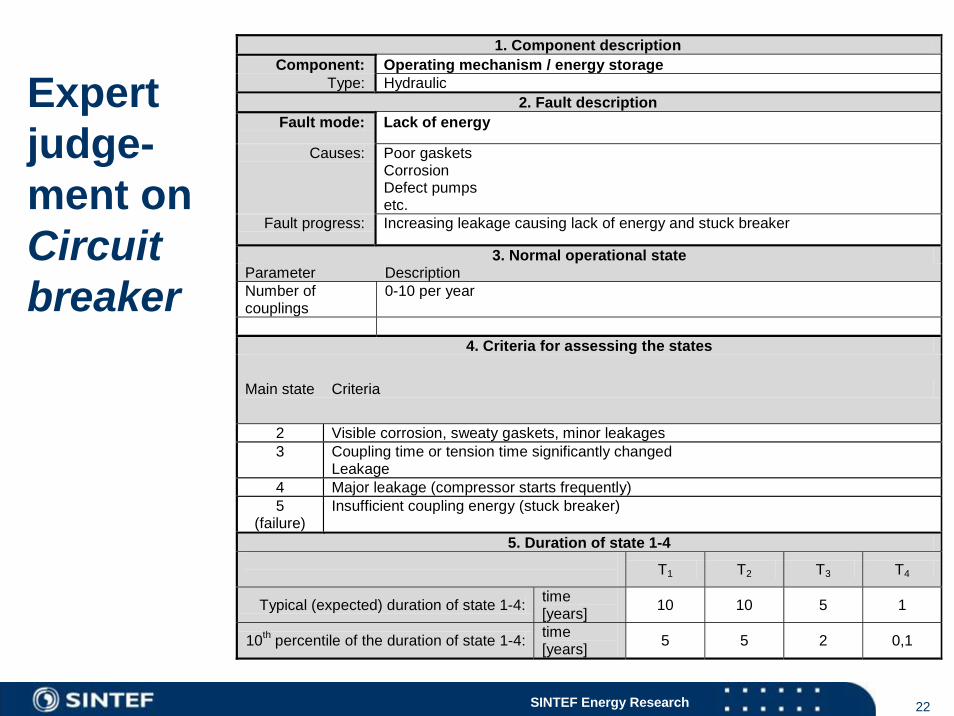
1. Component description Component: Operating mechanism / energy storage
Type: Hydraulic 2. Fault description
Fault mode: Lack of energy
Causes: Poor gaskets Corrosion Defect pumps etc.
Fault progress: Increasing leakage causing lack of energy and stuck breaker
3. Normal operational state Parameter Description Number of couplings
0-10 per year
4. Criteria for assessing the states
Main state Criteria
2 Visible corrosion, sweaty gaskets, minor leakages 3 Coupling time or tension time significantly changed
Leakage 4 Major leakage (compressor starts frequently) 5
(failure) Insufficient coupling energy (stuck breaker)
5. Duration of state 1-4 T1 T2 T3 T4
Typical (expected) duration of state 1-4: time [years] 10 10 5 1
10th percentile of the duration of state 1-4: time [years] 5 5 2 0,1
Expertjudge-ment onCircuitbreaker
23SINTEF Energy Research
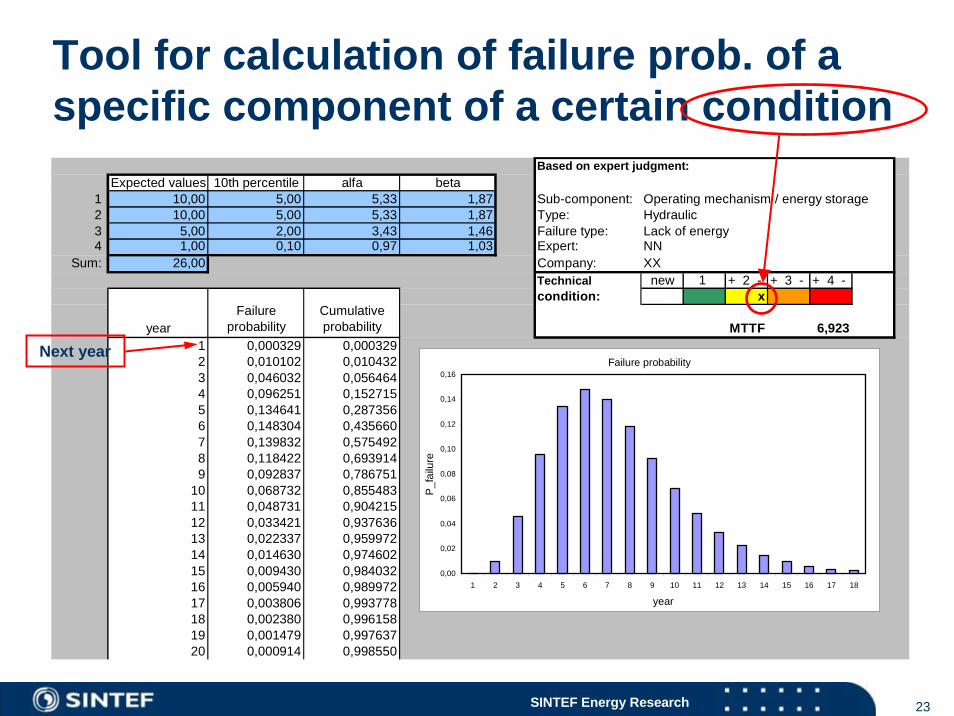
Tool for calculation of failure prob. of a specific component of a certain condition
Based on expert judgment:Expected values 10th percentile alfa beta
1 10,00 5,00 5,33 1,87 Sub-component: Operating mechanism / energy storage2 10,00 5,00 5,33 1,87 Type:3 5,00 2,00 3,43 1,46 Failure type: Lack of energy4 1,00 0,10 0,97 1,03 Expert: NN
Sum: 26,00 Company: XXTechnical new 1 + 2 - + 3 - + 4 -condition: x
yearFailure
probabilityCumulativeprobability MTTF 6,923
1 0,000329 0,0003292 0,010102 0,0104323 0,046032 0,0564644 0,096251 0,1527155 0,134641 0,2873566 0,148304 0,4356607 0,139832 0,5754928 0,118422 0,6939149 0,092837 0,786751
10 0,068732 0,85548311 0,048731 0,90421512 0,033421 0,93763613 0,022337 0,95997214 0,014630 0,97460215 0,009430 0,98403216 0,005940 0,98997217 0,003806 0,99377818 0,002380 0,99615819 0,001479 0,99763720 0,000914 0,998550
Hydraulic
Failure probability
0,00
0,02
0,04
0,06
0,08
0,10
0,12
0,14
0,16
1 2 3 4 5 6 7 8 9 10 11 12 13 14 15 16 17 18
year
P_f
ailu
re
Next year
24SINTEF Energy Research
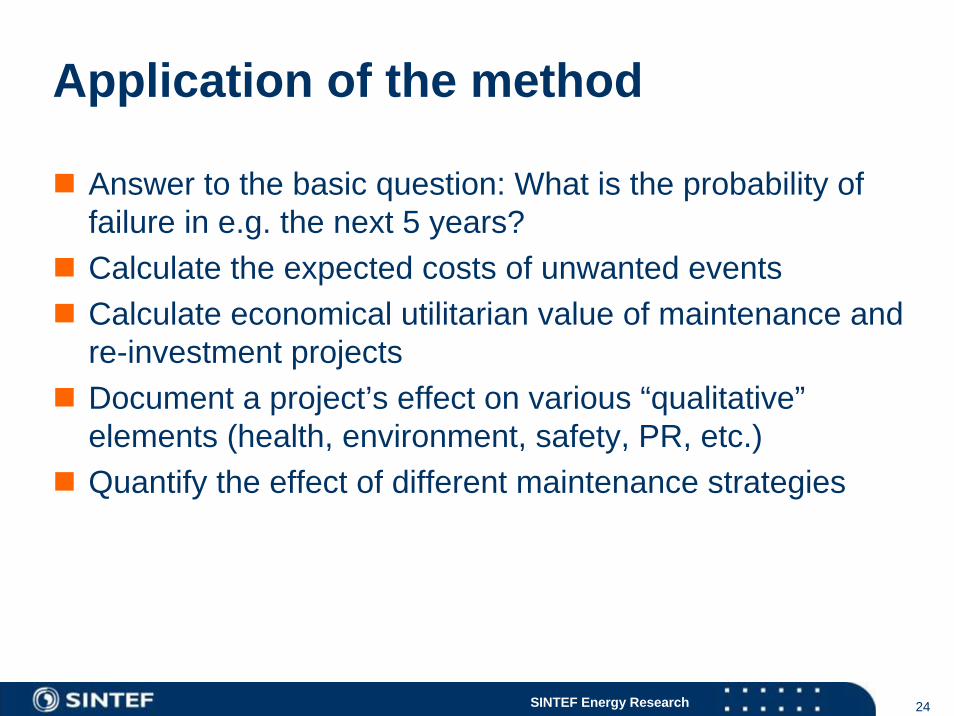
Application of the method
Answer to the basic question: What is the probability of failure in e.g. the next 5 years?Calculate the expected costs of unwanted eventsCalculate economical utilitarian value of maintenance and re-investment projectsDocument a project’s effect on various “qualitative”elements (health, environment, safety, PR, etc.)Quantify the effect of different maintenance strategies
25SINTEF Energy Research
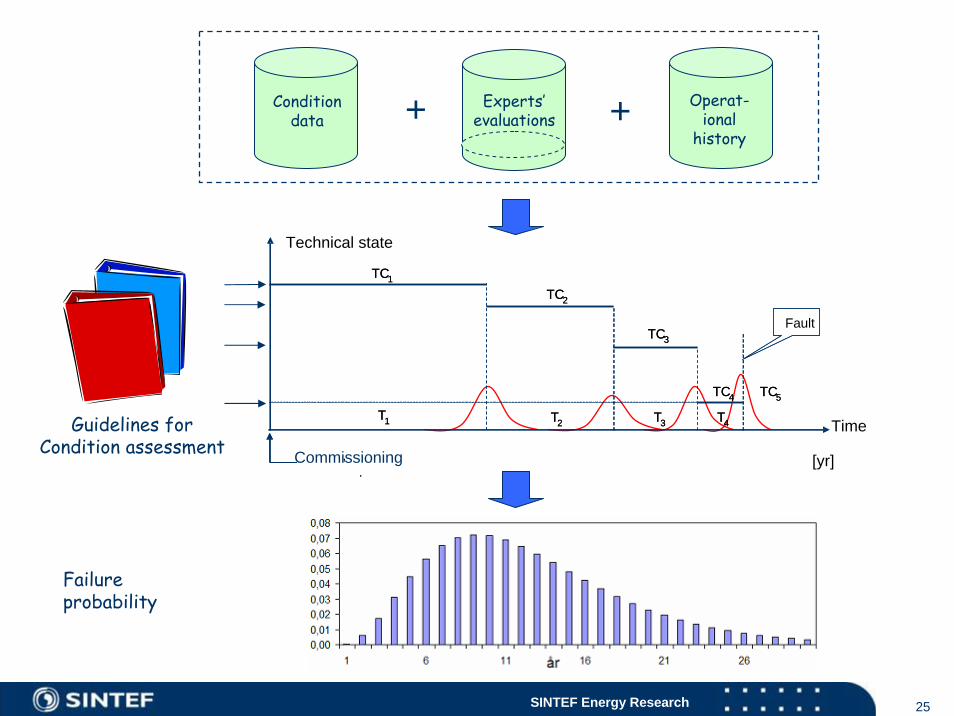
Guidelines forCondition assessment
Conditiondata + Operat-
ionalhistory
+Experts’evaluations
Failureprobability
[yr]
Technical state
Commissioning
T1 T2 T3 T4
TC1
TC2
TC3
TC4 TC5
Fault
Time
,.
T1 T2 T3 T4
TC1
TC2
TC3
TC4 TC5
26SINTEF Energy Research
To protect against acts ofGod - still a challenge, but…
27SINTEF Energy Research
the distributionsystem will be usefulfor many years….