Embed Size (px)
Citation preview
The Egyptian Journal of Radiology and Nuclear Medicine 47 (2016) 1373–1384
Contents lists available at ScienceDirect
The Egyptian Journal of Radiology and Nuclear Medicine
journal homepage: www.sciencedirect .com/ locate /e j rnm
Original Article
Risk for malignancy of thyroid nodules: Comparative studybetween TIRADS and US based classification system
http://dx.doi.org/10.1016/j.ejrnm.2016.08.0210378-603X/� 2016 The Egyptian Society of Radiology and Nuclear Medicine. Production and hosting by Elsevier.This is an open access article under the CC BY-NC-ND license (http://creativecommons.org/licenses/by-nc-nd/4.0/).
Peer review under responsibility of The Egyptian Society of Radiology andNuclear Medicine.⇑ Corresponding author.
E-mail address: [email protected] (M.A. EL-Adalany).
Germeen Albair Ashamallah, Mohamed Ali EL-Adalany ⇑Department of Diagnostic Radiology, Faculty of Medicine, Mansoura University, Egypt
a r t i c l e i n f o a b s t r a c t
Article history:Received 27 June 2016Accepted 21 August 2016Available online 27 September 2016
Keywords:UltrasoundThyroidTumorMalignantBenignTIRADS
Purpose: To compare between TIRADS and thyroid ultrasound classification system pro-posed by Kim and his colleagues.Methods and materials: Prospective analysis of ultrasound and power Duplex images of 450patients with thyroid gland disease was conducted. The thyroid lesions were categorizedinto 5 groups: TIRADS 1, Normal thyroid gland; TIRADS 2, benign in aspects; TIRADS 3,probably benign aspects; TIRADS 4A, low suspicious aspects; TIRADS 4B & TIRADS 5, highsuspicious aspects. Next, the detected nodules in 350 patients were divided into solid andpartially cystic nodules and rated according to Kim et al., classification. The final diagnosiswas done by biopsy (n = 370) and clinical follow-up (n = 80). Statistical analysis in compar-ison with cytopathological findings was calculated.Results: The odds ratio (OR) was 7 for TIRADS 5, 2 for TIRADS 4B, 0.67 for TIRADS 4A, 0.2 forTIRADS 3 and 0.01 for TIRADS 1 & 2. The PPV of malignancy rises gradually from 0% forTIRADS 1 & 2 to 6.7% for TIRADS 3 & 4A to 20% for TIRADS 4B and reaches 67% forTIRADS 5. TIRADS 5 showed 100% sensitivity, 86% specificity and 89% accuracy.Conclusion: TIRADS classification is reliable, easier and simpler than other classificationsystem for reporting. It has higher sensitivity for prediction of thyroid malignancy.� 2016 The Egyptian Society of Radiology and Nuclear Medicine. Production and hosting byElsevier. This is an open access article under the CC BY-NC-ND license (http://creativecom-
mons.org/licenses/by-nc-nd/4.0/).
1. Introduction
Ultrasound criteria to differentiate between benign andmalignant nodules of thyroid gland have been the point ofresearch in many scientific papers; many of the publishedpapers proved that ultrasound is highly sensitive but lessspecific in detection of malignant thyroid nodules [9,10].
Ultrasound features for prediction of malignancyinclude hypoechogenicity, microcalcifications, taller thanwide shape, irregular or microlobulated margins andincreased intranodular vascularity [2,3].
Dubitable nodules will require fine-needle aspirationcytology (FNAC). Selection of nodules for FNAC is still con-fusing for clinicians and radiologists as the categorizationof the same thyroid nodule may be differed according tothe used ultrasound classification system [11].
A practical thyroid imaging reporting and data system(TIRADS) for thyroid nodules have been recently proposedto classify nodules of thyroid gland and to solve the prob-lem of nodule selection for FNAC [7].
TIRADS is a classification made by a multidisciplinaryteam, recently published in the JCEM (Journal of ClinicalEndocrinology & Metabolism) [3], and the original ideawas to adapt the BI-RADS concept (Breast Imaging Report-ing and Data System) from the ACR (American College ofRadiology) [1], to thyroid pathology.
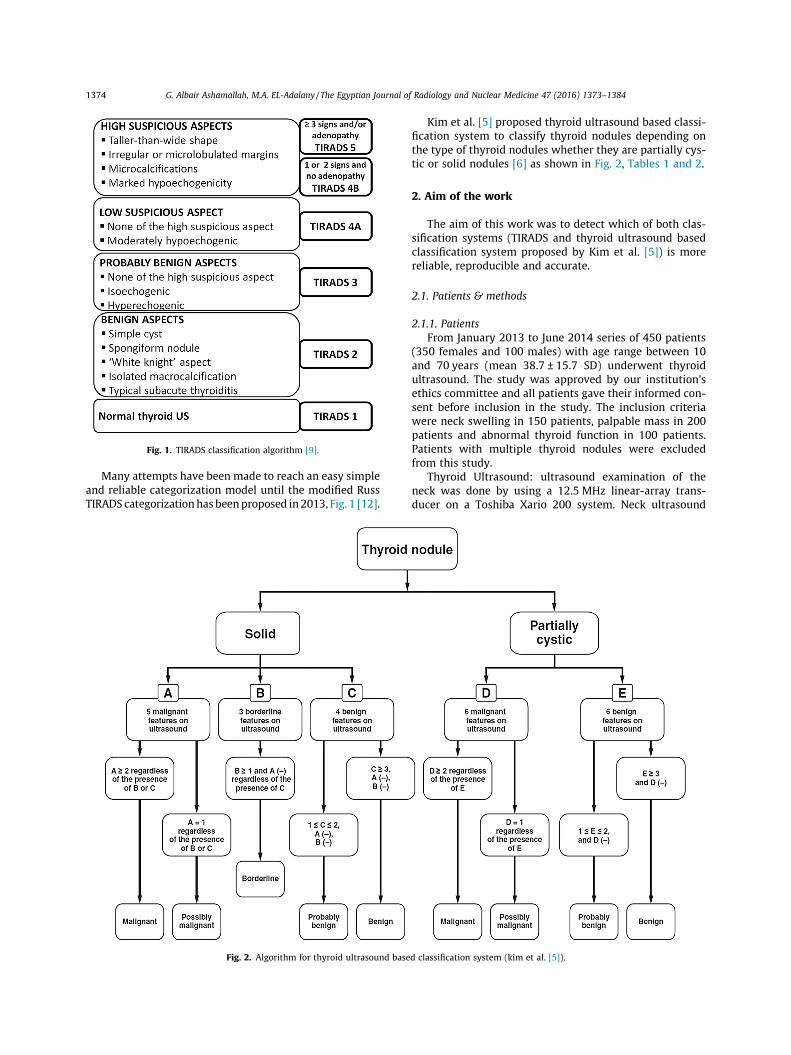
Fig. 1. TIRADS classification algorithm [9].
1374 G. Albair Ashamallah, M.A. EL-Adalany / The Egyptian Journal of Radiology and Nuclear Medicine 47 (2016) 1373–1384
Many attempts have been made to reach an easy simpleand reliable categorization model until the modified RussTIRADS categorizationhasbeenproposed in2013, Fig. 1 [12].
Fig. 2. Algorithm for thyroid ultrasound base
Kim et al. [5] proposed thyroid ultrasound based classi-fication system to classify thyroid nodules depending onthe type of thyroid nodules whether they are partially cys-tic or solid nodules [6] as shown in Fig. 2, Tables 1 and 2.
2. Aim of the work
The aim of this work was to detect which of both clas-sification systems (TIRADS and thyroid ultrasound basedclassification system proposed by Kim et al. [5]) is morereliable, reproducible and accurate.
2.1. Patients & methods
2.1.1. PatientsFrom January 2013 to June 2014 series of 450 patients
(350 females and 100 males) with age range between 10and 70 years (mean 38.7 ± 15.7 SD) underwent thyroidultrasound. The study was approved by our institution’sethics committee and all patients gave their informed con-sent before inclusion in the study. The inclusion criteriawere neck swelling in 150 patients, palpable mass in 200patients and abnormal thyroid function in 100 patients.Patients with multiple thyroid nodules were excludedfrom this study.
Thyroid Ultrasound: ultrasound examination of theneck was done by using a 12.5 MHz linear-array trans-ducer on a Toshiba Xario 200 system. Neck ultrasound
d classification system (kim et al. [5]).
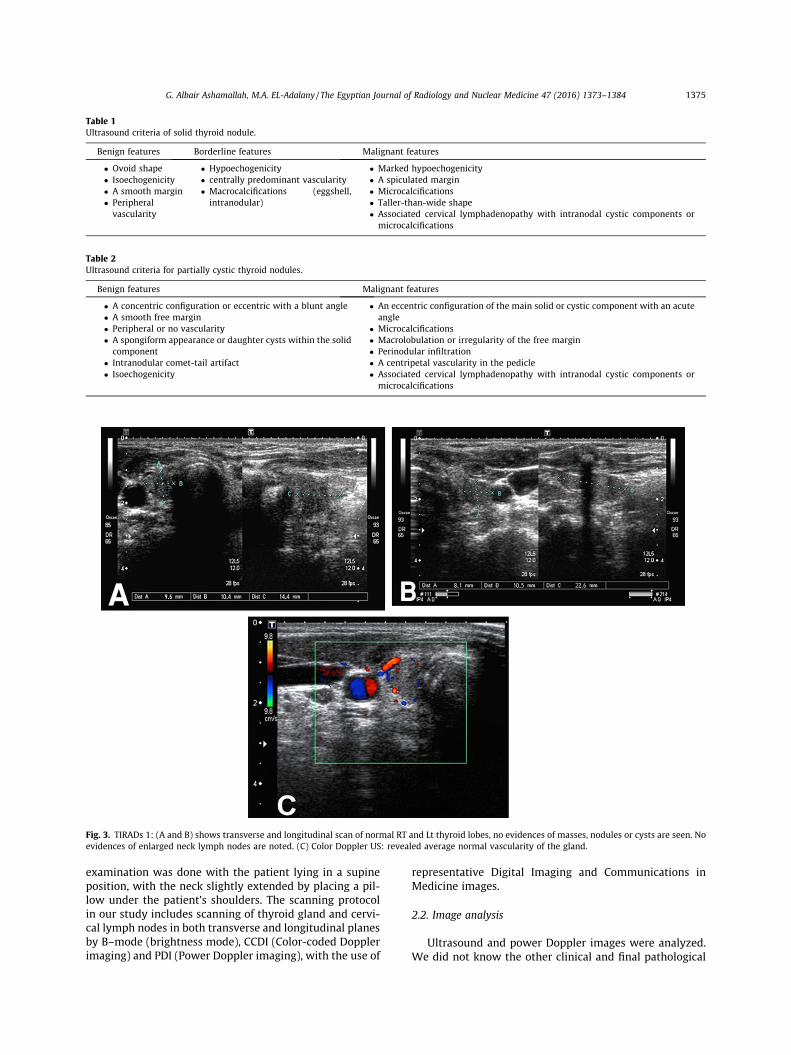
Table 1Ultrasound criteria of solid thyroid nodule.
Benign features Borderline features Malignant features
� Ovoid shape� Isoechogenicity� A smooth margin� Peripheralvascularity
� Hypoechogenicity� centrally predominant vascularity� Macrocalcifications (eggshell,intranodular)
� Marked hypoechogenicity� A spiculated margin� Microcalcifications� Taller-than-wide shape� Associated cervical lymphadenopathy with intranodal cystic components ormicrocalcifications
Table 2Ultrasound criteria for partially cystic thyroid nodules.
Benign features Malignant features
� A concentric configuration or eccentric with a blunt angle� A smooth free margin� Peripheral or no vascularity� A spongiform appearance or daughter cysts within the solidcomponent
� Intranodular comet-tail artifact� Isoechogenicity
� An eccentric configuration of the main solid or cystic component with an acuteangle
� Microcalcifications� Macrolobulation or irregularity of the free margin� Perinodular infiltration� A centripetal vascularity in the pedicle� Associated cervical lymphadenopathy with intranodal cystic components ormicrocalcifications
Fig. 3. TIRADs 1: (A and B) shows transverse and longitudinal scan of normal RT and Lt thyroid lobes, no evidences of masses, nodules or cysts are seen. Noevidences of enlarged neck lymph nodes are noted. (C) Color Doppler US: revealed average normal vascularity of the gland.
G. Albair Ashamallah, M.A. EL-Adalany / The Egyptian Journal of Radiology and Nuclear Medicine 47 (2016) 1373–1384 1375
examination was done with the patient lying in a supineposition, with the neck slightly extended by placing a pil-low under the patient’s shoulders. The scanning protocolin our study includes scanning of thyroid gland and cervi-cal lymph nodes in both transverse and longitudinal planesby B–mode (brightness mode), CCDI (Color-coded Dopplerimaging) and PDI (Power Doppler imaging), with the use of
representative Digital Imaging and Communications inMedicine images.
2.2. Image analysis
Ultrasound and power Doppler images were analyzed.We did not know the other clinical and final pathological
1376 G. Albair Ashamallah, M.A. EL-Adalany / The Egyptian Journal of Radiology and Nuclear Medicine 47 (2016) 1373–1384
reports. The thyroid nodules detected in this study wereanalyzed according to their type (solid, cystic or mixed),echogenicity, margins, shape and evidence of calcifications.The margin of the nodules may be circumscribed and alsonodules may have lobulated or irregular margins. Accord-ing to the echogenicity, nodules may be ‘‘hyperechoic”,‘‘isoechoic”, ‘‘hypoechoic” and ‘‘marked hypoechoic”.When calcifications were present they were classified asmicrocalcifications (<3 mm) and macrocalcifications (Cal-cific foci more than 3 mm with acoustic shadowing).According to the shape, nodules were divided into ‘‘tallerthan wide” and ‘‘wider than tall”. For mixed nodule, thesolid component was classified as concentric, eccentricwith blunt angle or acute angle. Vascularity was classifiedas absent, peripheral or central. When enlarged cervicallymph nodes were present they were categorized asbenign or malignant according to their shape and hilum.
Categorization of each nodule to a TIRADS was from 1 to5: TIRADS1 normal thyroid gland; TIRADS 2 thyroid gland
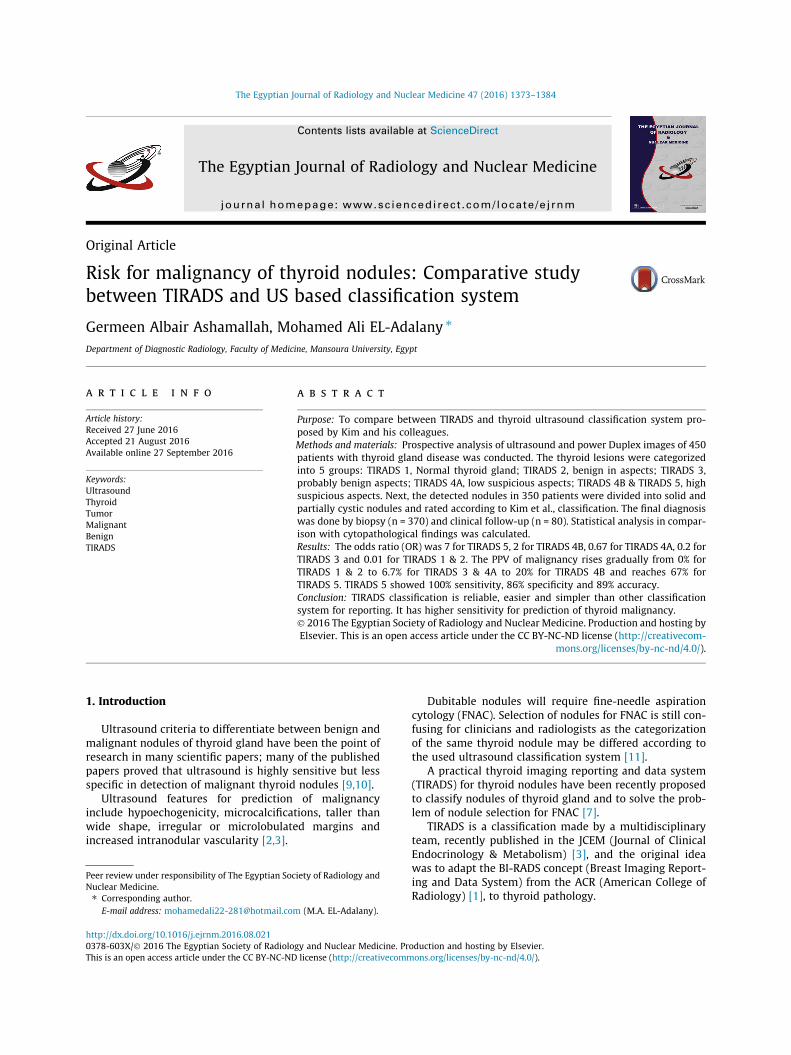
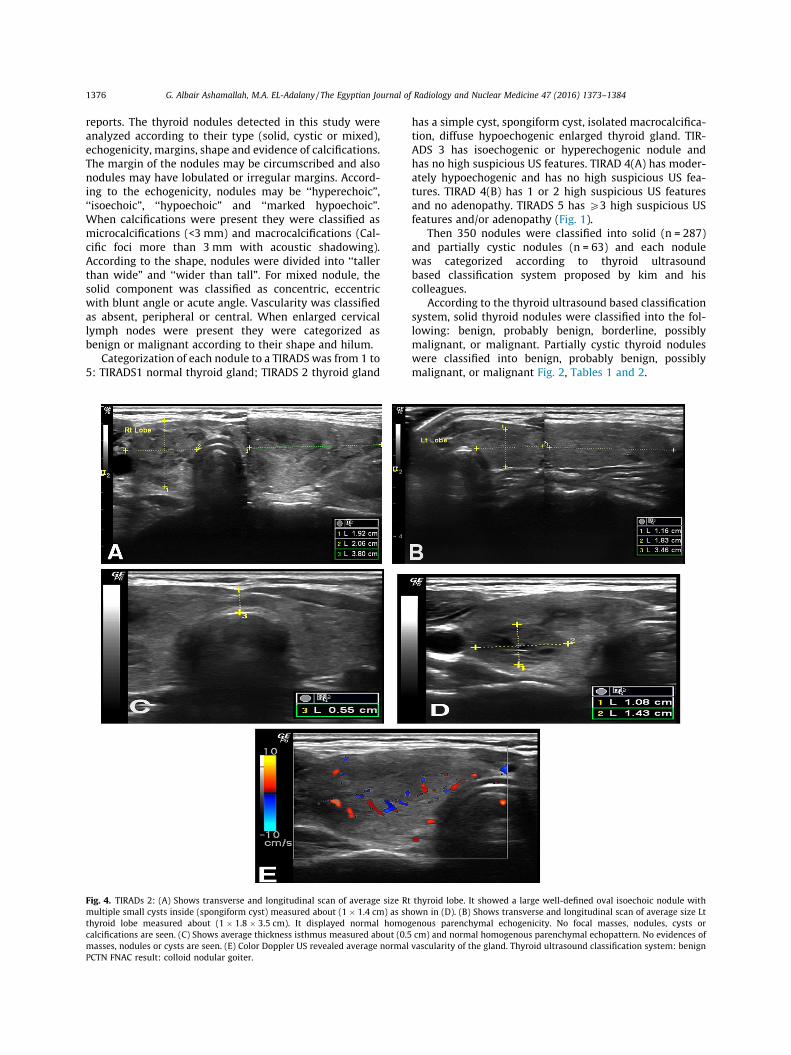
Fig. 4. TIRADs 2: (A) Shows transverse and longitudinal scan of average size Rtmultiple small cysts inside (spongiform cyst) measured about (1 � 1.4 cm) as shthyroid lobe measured about (1 � 1.8 � 3.5 cm). It displayed normal homogcalcifications are seen. (C) Shows average thickness isthmus measured about (0.5masses, nodules or cysts are seen. (E) Color Doppler US revealed average normalPCTN FNAC result: colloid nodular goiter.
has a simple cyst, spongiform cyst, isolated macrocalcifica-tion, diffuse hypoechogenic enlarged thyroid gland. TIR-ADS 3 has isoechogenic or hyperechogenic nodule andhas no high suspicious US features. TIRAD 4(A) has moder-ately hypoechogenic and has no high suspicious US fea-tures. TIRAD 4(B) has 1 or 2 high suspicious US featuresand no adenopathy. TIRADS 5 has P3 high suspicious USfeatures and/or adenopathy (Fig. 1).
Then 350 nodules were classified into solid (n = 287)and partially cystic nodules (n = 63) and each nodulewas categorized according to thyroid ultrasoundbased classification system proposed by kim and hiscolleagues.
According to the thyroid ultrasound based classificationsystem, solid thyroid nodules were classified into the fol-lowing: benign, probably benign, borderline, possiblymalignant, or malignant. Partially cystic thyroid noduleswere classified into benign, probably benign, possiblymalignant, or malignant Fig. 2, Tables 1 and 2.
thyroid lobe. It showed a large well-defined oval isoechoic nodule withown in (D). (B) Shows transverse and longitudinal scan of average size Ltenous parenchymal echogenicity. No focal masses, nodules, cysts orcm) and normal homogenous parenchymal echopattern. No evidences ofvascularity of the gland. Thyroid ultrasound classification system: benign
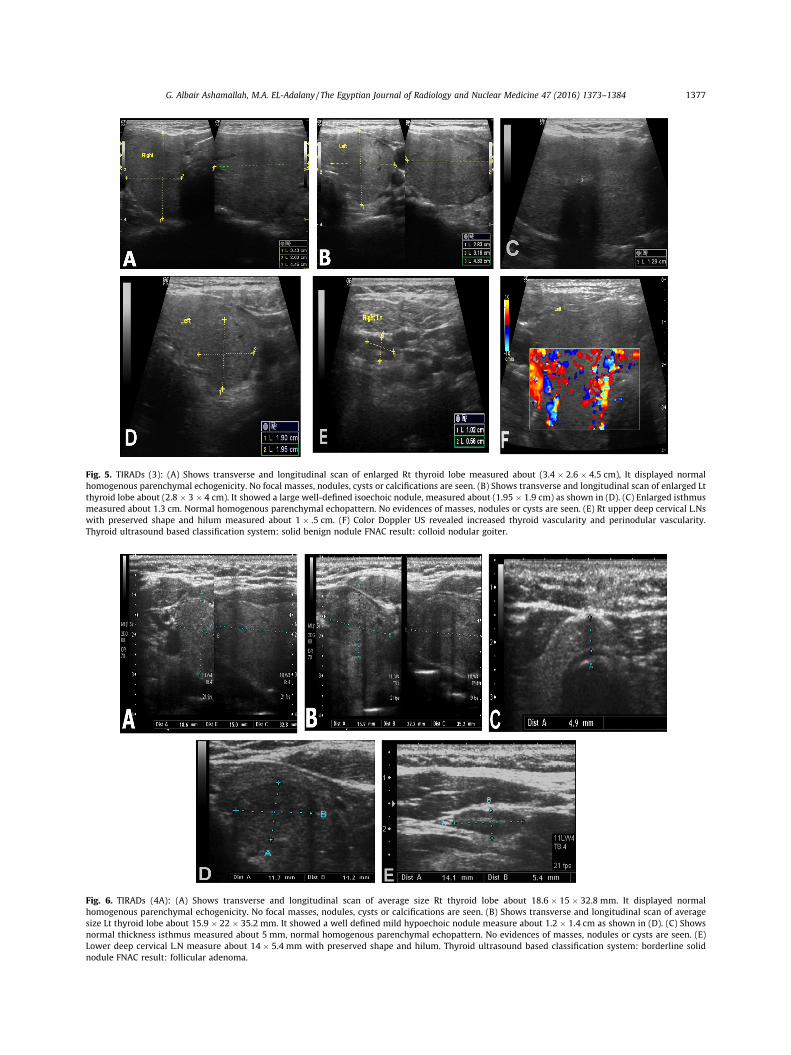
Fig. 5. TIRADs (3): (A) Shows transverse and longitudinal scan of enlarged Rt thyroid lobe measured about (3.4 � 2.6 � 4.5 cm), It displayed normalhomogenous parenchymal echogenicity. No focal masses, nodules, cysts or calcifications are seen. (B) Shows transverse and longitudinal scan of enlarged Ltthyroid lobe about (2.8 � 3 � 4 cm). It showed a large well-defined isoechoic nodule, measured about (1.95 � 1.9 cm) as shown in (D). (C) Enlarged isthmusmeasured about 1.3 cm. Normal homogenous parenchymal echopattern. No evidences of masses, nodules or cysts are seen. (E) Rt upper deep cervical L.Nswith preserved shape and hilum measured about 1 � .5 cm. (F) Color Doppler US revealed increased thyroid vascularity and perinodular vascularity.Thyroid ultrasound based classification system: solid benign nodule FNAC result: colloid nodular goiter.
Fig. 6. TIRADs (4A): (A) Shows transverse and longitudinal scan of average size Rt thyroid lobe about 18.6 � 15 � 32.8 mm. It displayed normalhomogenous parenchymal echogenicity. No focal masses, nodules, cysts or calcifications are seen. (B) Shows transverse and longitudinal scan of averagesize Lt thyroid lobe about 15.9 � 22 � 35.2 mm. It showed a well defined mild hypoechoic nodule measure about 1.2 � 1.4 cm as shown in (D). (C) Showsnormal thickness isthmus measured about 5 mm, normal homogenous parenchymal echopattern. No evidences of masses, nodules or cysts are seen. (E)Lower deep cervical L.N measure about 14 � 5.4 mm with preserved shape and hilum. Thyroid ultrasound based classification system: borderline solidnodule FNAC result: follicular adenoma.
G. Albair Ashamallah, M.A. EL-Adalany / The Egyptian Journal of Radiology and Nuclear Medicine 47 (2016) 1373–1384 1377
1378 G. Albair Ashamallah, M.A. EL-Adalany / The Egyptian Journal of Radiology and Nuclear Medicine 47 (2016) 1373–1384
2.2.1. US-guided FNACUS guided FNAC was done by using a 20 gauge needle
attached to a 10 ml disposable plastic syringe and thenthe aspirated tissue was sent for pathological evaluation.
Multiple FNACs were obtained from the same thyroidnodule and were sent for pathological evaluation. Thiswas done to be sure from the results of FNAC.
The final diagnosis was done by FNAC in 273 cases,excisional biopsy in 97 patients and follow-up in 80 cases.
2.3. Statistical analysis
The statistical analysis of data was done by using SPSSprogram (Statistical package for social science version20). Univariate analysis was used to calculate the Oddsratios (ORs) with 95% confidence intervals (CIs) of eachTIRADS were calculated. All ORs were standardized tomake the scores approach an integral. The lowest valuewas 0, and this means that TIRADS type could not referringto the malignancy. The sensitivity, specificity, accuracypositive and negative predictive values of TIRADS systemwere calculated. OR, sensitivity, specificity, positive andnegative predictive values of thyroid ultrasound based
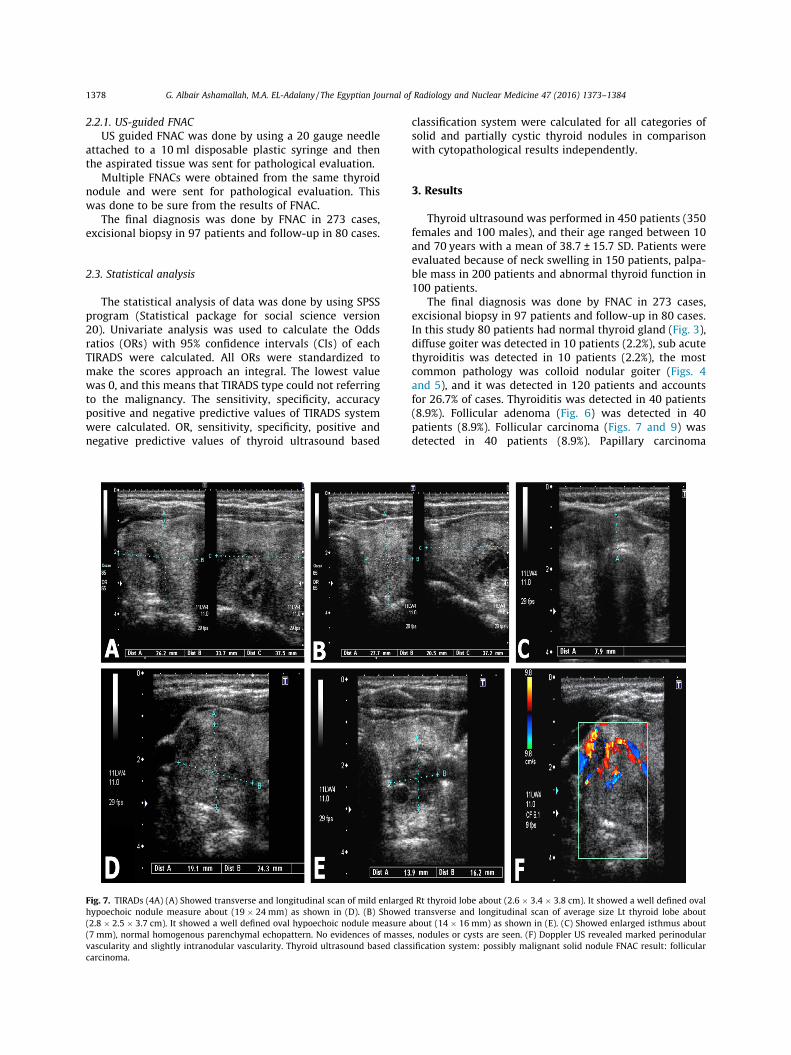
Fig. 7. TIRADs (4A) (A) Showed transverse and longitudinal scan of mild enlargehypoechoic nodule measure about (19 � 24 mm) as shown in (D). (B) Showed(2.8 � 2.5 � 3.7 cm). It showed a well defined oval hypoechoic nodule measure(7 mm), normal homogenous parenchymal echopattern. No evidences of massevascularity and slightly intranodular vascularity. Thyroid ultrasound based clascarcinoma.
classification system were calculated for all categories ofsolid and partially cystic thyroid nodules in comparisonwith cytopathological results independently.
3. Results
Thyroid ultrasound was performed in 450 patients (350females and 100 males), and their age ranged between 10and 70 years with a mean of 38.7 ± 15.7 SD. Patients wereevaluated because of neck swelling in 150 patients, palpa-ble mass in 200 patients and abnormal thyroid function in100 patients.
The final diagnosis was done by FNAC in 273 cases,excisional biopsy in 97 patients and follow-up in 80 cases.In this study 80 patients had normal thyroid gland (Fig. 3),diffuse goiter was detected in 10 patients (2.2%), sub acutethyroiditis was detected in 10 patients (2.2%), the mostcommon pathology was colloid nodular goiter (Figs. 4and 5), and it was detected in 120 patients and accountsfor 26.7% of cases. Thyroiditis was detected in 40 patients(8.9%). Follicular adenoma (Fig. 6) was detected in 40patients (8.9%). Follicular carcinoma (Figs. 7 and 9) wasdetected in 40 patients (8.9%). Papillary carcinoma
d Rt thyroid lobe about (2.6 � 3.4 � 3.8 cm). It showed a well defined ovaltransverse and longitudinal scan of average size Lt thyroid lobe about
about (14 � 16 mm) as shown in (E). (C) Showed enlarged isthmus abouts, nodules or cysts are seen. (F) Doppler US revealed marked perinodularsification system: possibly malignant solid nodule FNAC result: follicular
G. Albair Ashamallah, M.A. EL-Adalany / The Egyptian Journal of Radiology and Nuclear Medicine 47 (2016) 1373–1384 1379
(Fig. 8) was detected in 90 patients (20%). Medullary carci-noma was detected in 10 patients (2.2%). Poorly differenti-ated carcinoma was detected in 10 patients (2.2%)(Table 3).
The detected thyroid nodules were assessed accordingto their composition, echogenicity, shape, margins andthe presence of calcifications. In this study, we detected287 solid thyroid nodules, 173 of them were benign and114 were malignant. 63 nodules were mixed, 26 of themwere benign and 37 were malignant. According to theechogenicity of the nodules, we detect 129 hyperechoicnodules, 100 out of them were benign and remaining 29were malignant. 80 nodules were isoechoic, 66 out of themwere benign and the remaining 14 nodules were malig-nant. 63 nodules were hypoechoic, 28 of them were benignand 35 were malignant. Also we detected 78 markedlyhypoechoic nodules, 5 out of them were benign and theremaining 73 nodules were malignant. According to theshape of the nodules, we had 175 nodules with their shapewas taller than wider, 73 out of them were benign and theremaining 102 nodules were malignant. Another 175 weredetected with their shape was wider than taller, 126 werebenign and 49 were malignant. According to the margins,167 nodules with well defined margins were detected,145 were benign and the remaining 22 nodules weremalignant. 105 nodules were with irregular border, 21out of them were benign and the remaining 84 noduleswere malignant. 78 nodules with lobulated margins weredetected, 33 out of them were benign and the remaining45 nodules were malignant. According to the presence ofcalcification, micocalcific foci were seen in 92 nodules, 38
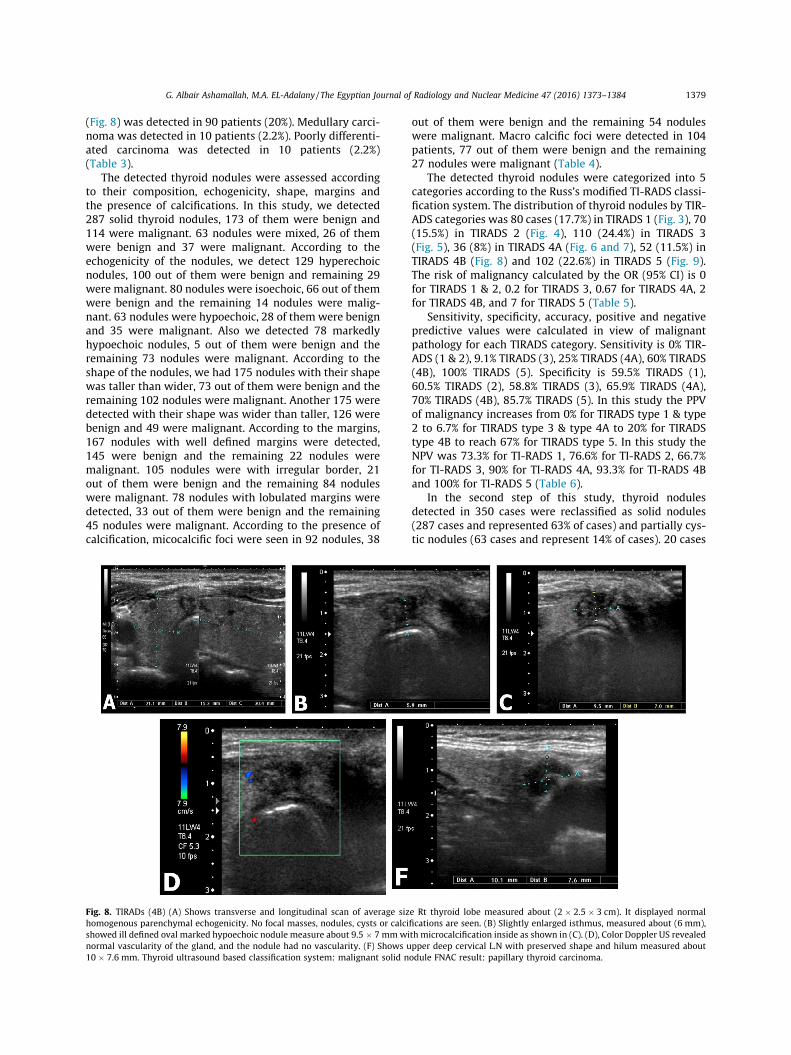
Fig. 8. TIRADs (4B) (A) Shows transverse and longitudinal scan of average sizhomogenous parenchymal echogenicity. No focal masses, nodules, cysts or calcishowed ill defined oval marked hypoechoic nodule measure about 9.5 � 7 mmwinormal vascularity of the gland, and the nodule had no vascularity. (F) Shows u10 � 7.6 mm. Thyroid ultrasound based classification system: malignant solid n
out of them were benign and the remaining 54 noduleswere malignant. Macro calcific foci were detected in 104patients, 77 out of them were benign and the remaining27 nodules were malignant (Table 4).
The detected thyroid nodules were categorized into 5categories according to the Russ’s modified TI-RADS classi-fication system. The distribution of thyroid nodules by TIR-ADS categories was 80 cases (17.7%) in TIRADS 1 (Fig. 3), 70(15.5%) in TIRADS 2 (Fig. 4), 110 (24.4%) in TIRADS 3(Fig. 5), 36 (8%) in TIRADS 4A (Fig. 6 and 7), 52 (11.5%) inTIRADS 4B (Fig. 8) and 102 (22.6%) in TIRADS 5 (Fig. 9).The risk of malignancy calculated by the OR (95% CI) is 0for TIRADS 1 & 2, 0.2 for TIRADS 3, 0.67 for TIRADS 4A, 2for TIRADS 4B, and 7 for TIRADS 5 (Table 5).
Sensitivity, specificity, accuracy, positive and negativepredictive values were calculated in view of malignantpathology for each TIRADS category. Sensitivity is 0% TIR-ADS (1 & 2), 9.1% TIRADS (3), 25% TIRADS (4A), 60% TIRADS(4B), 100% TIRADS (5). Specificity is 59.5% TIRADS (1),60.5% TIRADS (2), 58.8% TIRADS (3), 65.9% TIRADS (4A),70% TIRADS (4B), 85.7% TIRADS (5). In this study the PPVof malignancy increases from 0% for TIRADS type 1 & type2 to 6.7% for TIRADS type 3 & type 4A to 20% for TIRADStype 4B to reach 67% for TIRADS type 5. In this study theNPV was 73.3% for TI-RADS 1, 76.6% for TI-RADS 2, 66.7%for TI-RADS 3, 90% for TI-RADS 4A, 93.3% for TI-RADS 4Band 100% for TI-RADS 5 (Table 6).
In the second step of this study, thyroid nodulesdetected in 350 cases were reclassified as solid nodules(287 cases and represented 63% of cases) and partially cys-tic nodules (63 cases and represent 14% of cases). 20 cases
e Rt thyroid lobe measured about (2 � 2.5 � 3 cm). It displayed normalfications are seen. (B) Slightly enlarged isthmus, measured about (6 mm),th microcalcification inside as shown in (C). (D), Color Doppler US revealedpper deep cervical L.N with preserved shape and hilum measured aboutodule FNAC result: papillary thyroid carcinoma.
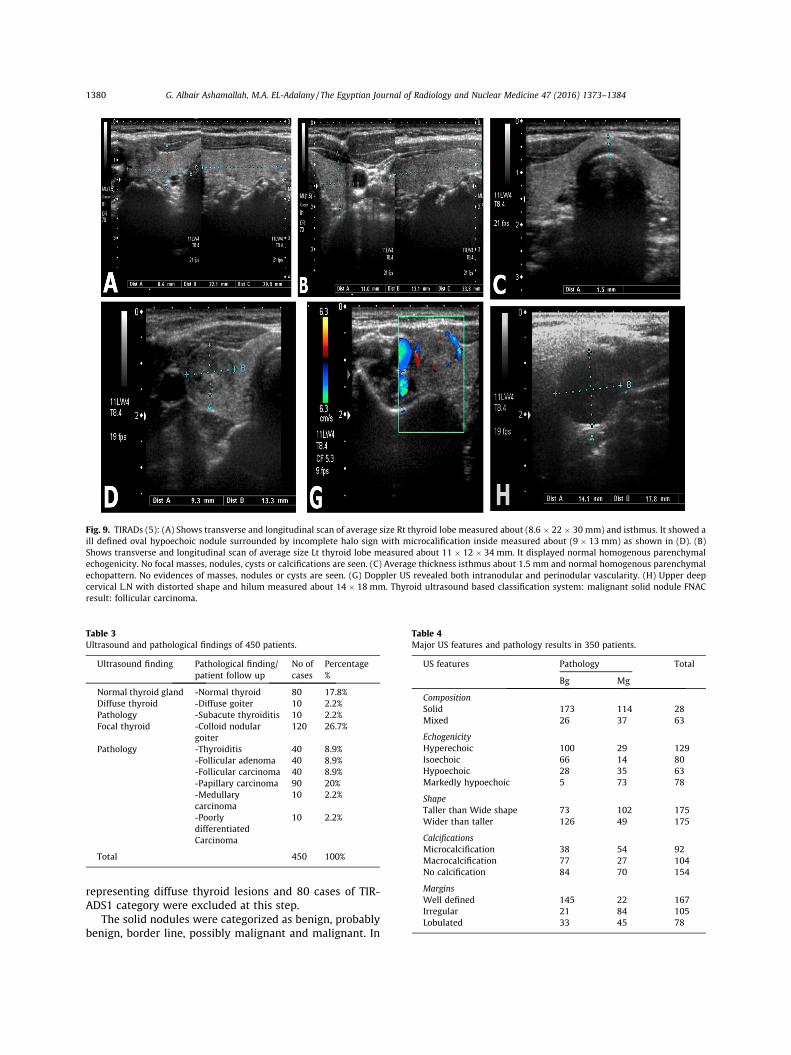
Fig. 9. TIRADs (5): (A) Shows transverse and longitudinal scan of average size Rt thyroid lobe measured about (8.6 � 22 � 30 mm) and isthmus. It showed aill defined oval hypoechoic nodule surrounded by incomplete halo sign with microcalification inside measured about (9 � 13 mm) as shown in (D). (B)Shows transverse and longitudinal scan of average size Lt thyroid lobe measured about 11 � 12 � 34 mm. It displayed normal homogenous parenchymalechogenicity. No focal masses, nodules, cysts or calcifications are seen. (C) Average thickness isthmus about 1.5 mm and normal homogenous parenchymalechopattern. No evidences of masses, nodules or cysts are seen. (G) Doppler US revealed both intranodular and perinodular vascularity. (H) Upper deepcervical L.N with distorted shape and hilum measured about 14 � 18 mm. Thyroid ultrasound based classification system: malignant solid nodule FNACresult: follicular carcinoma.
Table 3Ultrasound and pathological findings of 450 patients.
Ultrasound finding Pathological finding/patient follow up
No ofcases
Percentage%
Normal thyroid gland -Normal thyroid 80 17.8%Diffuse thyroid -Diffuse goiter 10 2.2%Pathology -Subacute thyroiditis 10 2.2%Focal thyroid -Colloid nodular
goiter120 26.7%
Pathology -Thyroiditis 40 8.9%-Follicular adenoma 40 8.9%-Follicular carcinoma 40 8.9%-Papillary carcinoma 90 20%-Medullarycarcinoma
10 2.2%
-Poorlydifferentiated
10 2.2%
Carcinoma
Total 450 100%
Table 4Major US features and pathology results in 350 patients.
US features Pathology Total
Bg Mg
CompositionSolid 173 114 28Mixed 26 37 63
EchogenicityHyperechoic 100 29 129Isoechoic 66 14 80Hypoechoic 28 35 63Markedly hypoechoic 5 73 78
ShapeTaller than Wide shape 73 102 175Wider than taller 126 49 175
CalcificationsMicrocalcification 38 54 92Macrocalcification 77 27 104No calcification 84 70 154
MarginsWell defined 145 22 167Irregular 21 84 105Lobulated 33 45 78
1380 G. Albair Ashamallah, M.A. EL-Adalany / The Egyptian Journal of Radiology and Nuclear Medicine 47 (2016) 1373–1384
representing diffuse thyroid lesions and 80 cases of TIR-ADS1 category were excluded at this step.
The solid nodules were categorized as benign, probablybenign, border line, possibly malignant and malignant. In
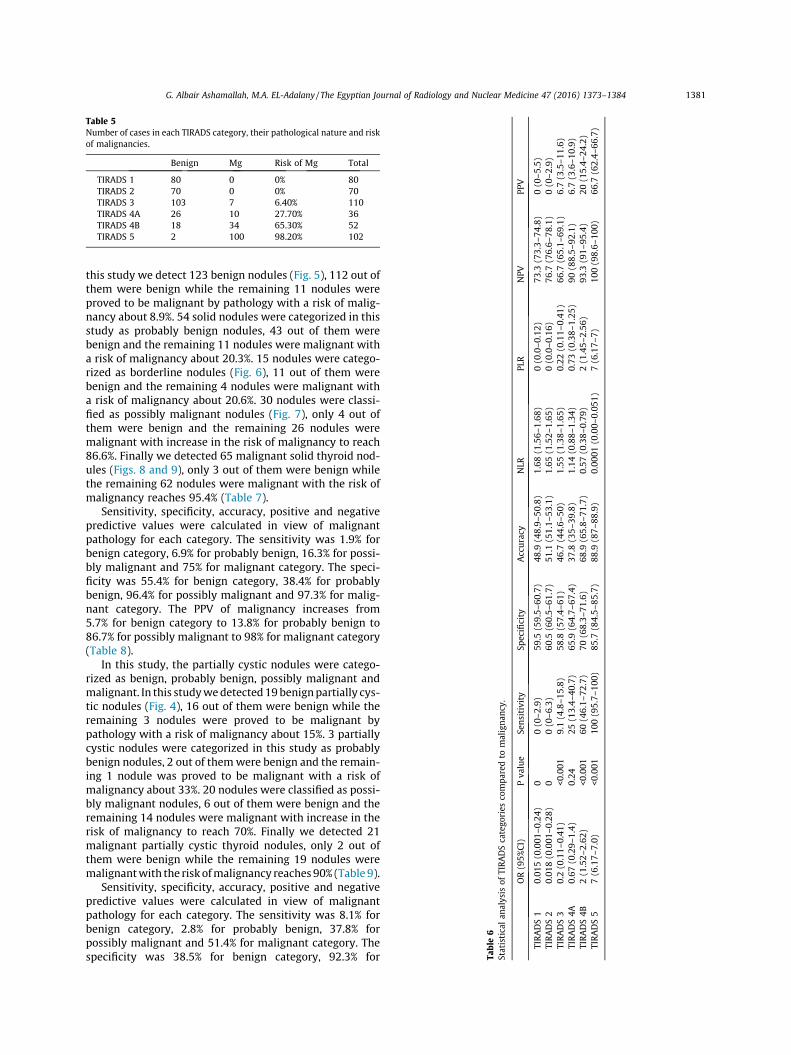
Table 5Number of cases in each TIRADS category, their pathological nature and riskof malignancies.
Benign Mg Risk of Mg Total
TIRADS 1 80 0 0% 80TIRADS 2 70 0 0% 70TIRADS 3 103 7 6.40% 110TIRADS 4A 26 10 27.70% 36TIRADS 4B 18 34 65.30% 52TIRADS 5 2 100 98.20% 102
Table6
Statisticalan
alysis
ofTIRA
DScatego
ries
compa
redto
maligna
ncy.
OR(95%
CI)
Pva
lue
Sensitivity
Specificity
Accuracy
NLR
PLR
NPV
PPV
TIRADS1
0.01
5(0.001
–0.24)
00(0–2
.9)
59.5
(59.5–
60.7)
48.9
(48.9–
50.8)
1.68
(1.56–
1.68
)0(0.0–0
.12)
73.3
(73.3–
74.8)
0(0–5
.5)
TIRADS2
0.01
8(0.001
–0.28)
00(0–6
.3)
60.5
(60.5–
61.7)
51.1
(51.1–
53.1)
1.65
(1.52–
1.65
)0(0.0–0
.16)
76.7
(76.6–
78.1)
0(0–2
.9)
TIRADS3
0.2(0.11–
0.41
)<0
.001
9.1(4.8–1
5.8)
58.8
(57.4–
61)
46.7
(44.6–
50)
1.55
(1.38–
1.65
)0.22
(0.11–
0.41
)66
.7(65.1–
69.1)
6.7(3.5–1
1.6)
TIRADS4A
0.67
(0.29–
1.4)
0.24
25(13.4–
40.7)
65.9
(64.7–
67.4)
37.8
(35–
39.8)
1.14
(0.88–
1.34
)0.73
(0.38–
1.25
)90
(88.5–
92.1)
6.7(3.6–1
0.9)
TIRADS4B
2(1.52–
2.62
)<0
.001
60(46.1–
72.7)
70(68.3–
71.6)
68.9
(65.8–
71.7)
0.57
(0.38–
0.79
)2(1.45–
2.56
)93
.3(91–
95.4)
20(15.4–
24.2)
TIRADS5
7(6.17–
7.0)
<0.001
100(95.7–
100)
85.7
(84.5–
85.7)
88.9
(87–
88.9)
0.00
01(0.00–
0.05
1)7(6.17–
7)10
0(98.6–
100)
66.7
(62.4–
66.7)
G. Albair Ashamallah, M.A. EL-Adalany / The Egyptian Journal of Radiology and Nuclear Medicine 47 (2016) 1373–1384 1381
this study we detect 123 benign nodules (Fig. 5), 112 out ofthem were benign while the remaining 11 nodules wereproved to be malignant by pathology with a risk of malig-nancy about 8.9%. 54 solid nodules were categorized in thisstudy as probably benign nodules, 43 out of them werebenign and the remaining 11 nodules were malignant witha risk of malignancy about 20.3%. 15 nodules were catego-rized as borderline nodules (Fig. 6), 11 out of them werebenign and the remaining 4 nodules were malignant witha risk of malignancy about 20.6%. 30 nodules were classi-fied as possibly malignant nodules (Fig. 7), only 4 out ofthem were benign and the remaining 26 nodules weremalignant with increase in the risk of malignancy to reach86.6%. Finally we detected 65 malignant solid thyroid nod-ules (Figs. 8 and 9), only 3 out of them were benign whilethe remaining 62 nodules were malignant with the risk ofmalignancy reaches 95.4% (Table 7).
Sensitivity, specificity, accuracy, positive and negativepredictive values were calculated in view of malignantpathology for each category. The sensitivity was 1.9% forbenign category, 6.9% for probably benign, 16.3% for possi-bly malignant and 75% for malignant category. The speci-ficity was 55.4% for benign category, 38.4% for probablybenign, 96.4% for possibly malignant and 97.3% for malig-nant category. The PPV of malignancy increases from5.7% for benign category to 13.8% for probably benign to86.7% for possibly malignant to 98% for malignant category(Table 8).
In this study, the partially cystic nodules were catego-rized as benign, probably benign, possibly malignant andmalignant. In this studywedetected19benignpartially cys-tic nodules (Fig. 4), 16 out of them were benign while theremaining 3 nodules were proved to be malignant bypathology with a risk of malignancy about 15%. 3 partiallycystic nodules were categorized in this study as probablybenign nodules, 2 out of themwere benign and the remain-ing 1 nodule was proved to be malignant with a risk ofmalignancy about 33%. 20 nodules were classified as possi-bly malignant nodules, 6 out of them were benign and theremaining 14 nodules were malignant with increase in therisk of malignancy to reach 70%. Finally we detected 21malignant partially cystic thyroid nodules, only 2 out ofthem were benign while the remaining 19 nodules weremalignantwith the risk ofmalignancy reaches90% (Table 9).
Sensitivity, specificity, accuracy, positive and negativepredictive values were calculated in view of malignantpathology for each category. The sensitivity was 8.1% forbenign category, 2.8% for probably benign, 37.8% forpossibly malignant and 51.4% for malignant category. Thespecificity was 38.5% for benign category, 92.3% for
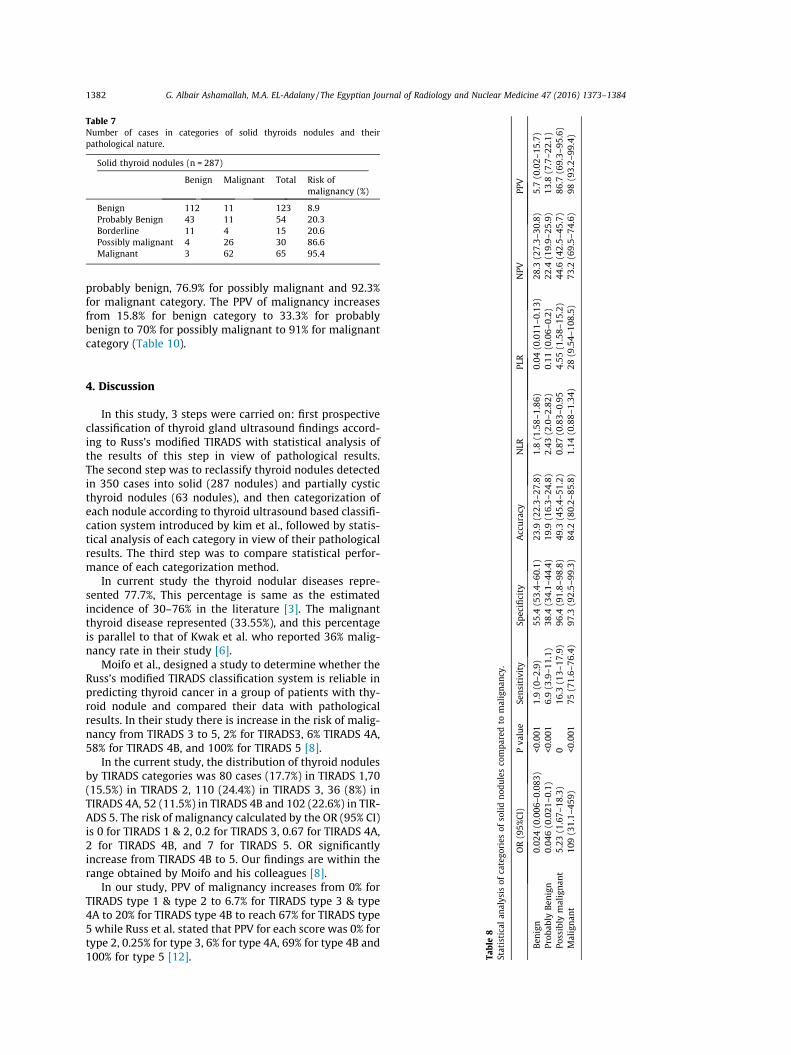
Table 7Number of cases in categories of solid thyroids nodules and theirpathological nature.
Solid thyroid nodules (n = 287)
Benign Malignant Total Risk ofmalignancy (%)
Benign 112 11 123 8.9Probably Benign 43 11 54 20.3Borderline 11 4 15 20.6Possibly malignant 4 26 30 86.6Malignant 3 62 65 95.4
NPV
PPV
(0.011
–0.13)
28.3
(27.3–
30.8)
5.7(0.02–
15.7)
(0.06–
0.2)
22.4
(19.9–
25.9)
13.8
(7.7–2
2.1)
(1.58–
15.2)
44.6
(42.5–
45.7)
86.7
(69.3–
95.6)
9.54
–108
.5)
73.2
(69.5–
74.6)
98(93.2–
99.4)
1382 G. Albair Ashamallah, M.A. EL-Adalany / The Egyptian Journal of Radiology and Nuclear Medicine 47 (2016) 1373–1384
probably benign, 76.9% for possibly malignant and 92.3%for malignant category. The PPV of malignancy increasesfrom 15.8% for benign category to 33.3% for probablybenign to 70% for possibly malignant to 91% for malignantcategory (Table 10).
Table8
Statisticalan
alysis
ofcatego
ries
ofso
lidno
dulesco
mpa
redto
maligna
ncy.
OR(95%
CI)
Pva
lue
Sensitivity
Specificity
Accuracy
NLR
PLR
Ben
ign
0.02
4(0.006
–0.083
)<0
.001
1.9(0–2
.9)
55.4
(53.4–
60.1)
23.9
(22.3–
27.8)
1.8(1.58–
1.86
)0.04
Prob
ably
Ben
ign
0.04
6(0.021
–0.1)
<0.001
6.9(3.9–1
1.1)
38.4
(34.1–
44.4)
19.9
(16.3–
24.8)
2.43
(2.0–2
.82)
0.11
Possibly
malignan
t5.23
(1.67–
18.3)
016
.3(13–
17.9)
96.4
(91.8–
98.8)
49.3
(45.4–
51.2)
0.87
(0.83–
0.95
4.55
Malignan
t10
9(31.1–
459)
<0.001
75(71.6–
76.4)
97.3
(92.5–
99.3)
84.2
(80.2–
85.8)
1.14
(0.88–
1.34
)28
(
4. Discussion
In this study, 3 steps were carried on: first prospectiveclassification of thyroid gland ultrasound findings accord-ing to Russ’s modified TIRADS with statistical analysis ofthe results of this step in view of pathological results.The second step was to reclassify thyroid nodules detectedin 350 cases into solid (287 nodules) and partially cysticthyroid nodules (63 nodules), and then categorization ofeach nodule according to thyroid ultrasound based classifi-cation system introduced by kim et al., followed by statis-tical analysis of each category in view of their pathologicalresults. The third step was to compare statistical perfor-mance of each categorization method.
In current study the thyroid nodular diseases repre-sented 77.7%, This percentage is same as the estimatedincidence of 30–76% in the literature [3]. The malignantthyroid disease represented (33.55%), and this percentageis parallel to that of Kwak et al. who reported 36% malig-nancy rate in their study [6].
Moifo et al., designed a study to determine whether theRuss’s modified TIRADS classification system is reliable inpredicting thyroid cancer in a group of patients with thy-roid nodule and compared their data with pathologicalresults. In their study there is increase in the risk of malig-nancy from TIRADS 3 to 5, 2% for TIRADS3, 6% TIRADS 4A,58% for TIRADS 4B, and 100% for TIRADS 5 [8].
In the current study, the distribution of thyroid nodulesby TIRADS categories was 80 cases (17.7%) in TIRADS 1,70(15.5%) in TIRADS 2, 110 (24.4%) in TIRADS 3, 36 (8%) inTIRADS 4A, 52 (11.5%) in TIRADS 4B and 102 (22.6%) in TIR-ADS 5. The risk of malignancy calculated by the OR (95% CI)is 0 for TIRADS 1 & 2, 0.2 for TIRADS 3, 0.67 for TIRADS 4A,2 for TIRADS 4B, and 7 for TIRADS 5. OR significantlyincrease from TIRADS 4B to 5. Our findings are within therange obtained by Moifo and his colleagues [8].
In our study, PPV of malignancy increases from 0% forTIRADS type 1 & type 2 to 6.7% for TIRADS type 3 & type4A to 20% for TIRADS type 4B to reach 67% for TIRADS type5 while Russ et al. stated that PPV for each score was 0% fortype 2, 0.25% for type 3, 6% for type 4A, 69% for type 4B and100% for type 5 [12].
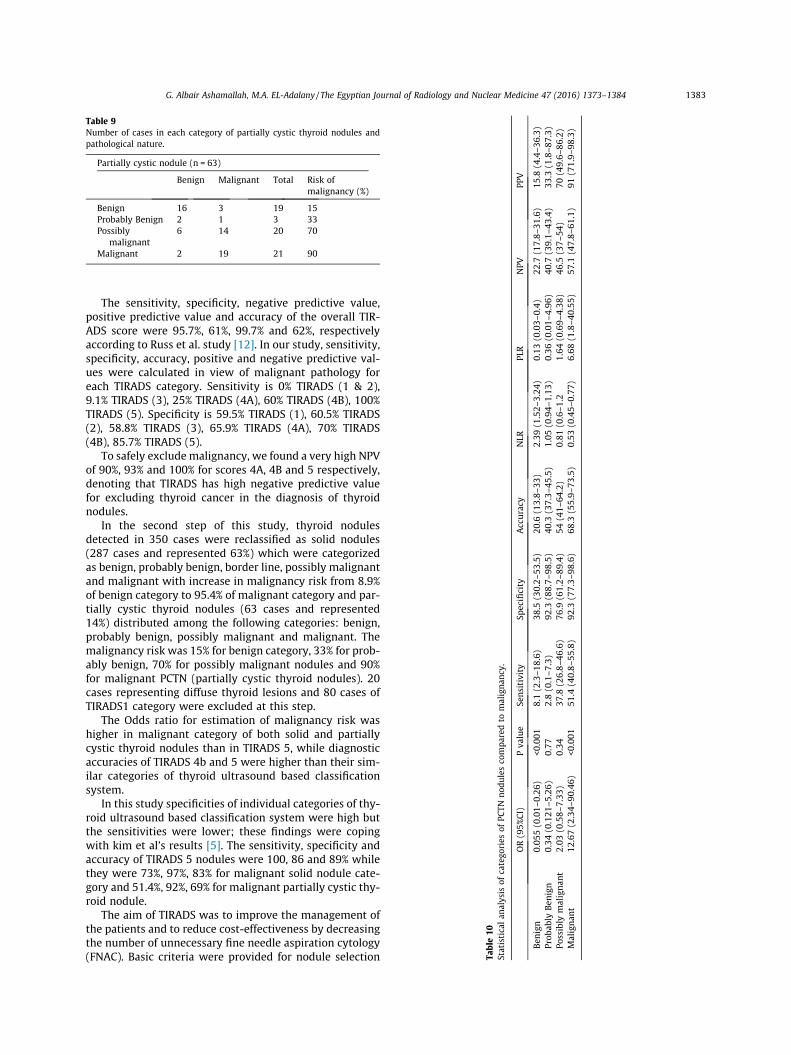
Table 9Number of cases in each category of partially cystic thyroid nodules andpathological nature.
Partially cystic nodule (n = 63)
Benign Malignant Total Risk ofmalignancy (%)
Benign 16 3 19 15Probably Benign 2 1 3 33Possibly
malignant6 14 20 70
Malignant 2 19 21 90
Table10
Statisticalan
alysis
ofcatego
ries
ofPC
TNno
dulesco
mpa
redto
maligna
ncy.
OR(95%
CI)
Pva
lue
Sensitivity
Specificity
Accuracy
NLR
PLR
NPV
PPV
Ben
ign
0.05
5(0.01–
0.26
)<0
.001
8.1(2.3–1
8.6)
38.5
(30.2–
53.5)
20.6
(13.8–
33)
2.39
(1.52–
3.24
)0.13
(0.03–
0.4)
22.7
(17.8–
31.6)
15.8
(4.4–3
6.3)
Prob
ably
Ben
ign
0.34
(0.121
–5.26)
0.77
2.8(0.1–7
.3)
92.3
(88.7–
98.5)
40.3
(37.3–
45.5)
1.05
(0.94–
1.13
)0.36
(0.01–
4.96
)40
.7(39.1–
43.4)
33.3
(1.8–8
7.3)
Possibly
malignan
t2.03
(0.58–
7.33
)0.34
37.8
(26.8–
46.6)
76.9
(61.2–
89.4)
54(41–
64.2)
0.81
(0.6–1
.21.64
(0.69–
4.38
)46
.5(37–
54)
70(49.6–
86.2)
Malignan
t12
.67(2.34–
90.46)
<0.001
51.4
(40.8–
55.8)
92.3
(77.3–
98.6)
68.3
(55.9–
73.5)
0.53
(0.45–
0.77
)6.68
(1.8–4
0.55
)57
.1(47.8–
61.1)
91(71.9–
98.3)
G. Albair Ashamallah, M.A. EL-Adalany / The Egyptian Journal of Radiology and Nuclear Medicine 47 (2016) 1373–1384 1383
The sensitivity, specificity, negative predictive value,positive predictive value and accuracy of the overall TIR-ADS score were 95.7%, 61%, 99.7% and 62%, respectivelyaccording to Russ et al. study [12]. In our study, sensitivity,specificity, accuracy, positive and negative predictive val-ues were calculated in view of malignant pathology foreach TIRADS category. Sensitivity is 0% TIRADS (1 & 2),9.1% TIRADS (3), 25% TIRADS (4A), 60% TIRADS (4B), 100%TIRADS (5). Specificity is 59.5% TIRADS (1), 60.5% TIRADS(2), 58.8% TIRADS (3), 65.9% TIRADS (4A), 70% TIRADS(4B), 85.7% TIRADS (5).
To safely excludemalignancy, we found a very high NPVof 90%, 93% and 100% for scores 4A, 4B and 5 respectively,denoting that TIRADS has high negative predictive valuefor excluding thyroid cancer in the diagnosis of thyroidnodules.
In the second step of this study, thyroid nodulesdetected in 350 cases were reclassified as solid nodules(287 cases and represented 63%) which were categorizedas benign, probably benign, border line, possibly malignantand malignant with increase in malignancy risk from 8.9%of benign category to 95.4% of malignant category and par-tially cystic thyroid nodules (63 cases and represented14%) distributed among the following categories: benign,probably benign, possibly malignant and malignant. Themalignancy risk was 15% for benign category, 33% for prob-ably benign, 70% for possibly malignant nodules and 90%for malignant PCTN (partially cystic thyroid nodules). 20cases representing diffuse thyroid lesions and 80 cases ofTIRADS1 category were excluded at this step.
The Odds ratio for estimation of malignancy risk washigher in malignant category of both solid and partiallycystic thyroid nodules than in TIRADS 5, while diagnosticaccuracies of TIRADS 4b and 5 were higher than their sim-ilar categories of thyroid ultrasound based classificationsystem.
In this study specificities of individual categories of thy-roid ultrasound based classification system were high butthe sensitivities were lower; these findings were copingwith kim et al’s results [5]. The sensitivity, specificity andaccuracy of TIRADS 5 nodules were 100, 86 and 89% whilethey were 73%, 97%, 83% for malignant solid nodule cate-gory and 51.4%, 92%, 69% for malignant partially cystic thy-roid nodule.
The aim of TIRADS was to improve the management ofthe patients and to reduce cost-effectiveness by decreasingthe number of unnecessary fine needle aspiration cytology(FNAC). Basic criteria were provided for nodule selection
1384 G. Albair Ashamallah, M.A. EL-Adalany / The Egyptian Journal of Radiology and Nuclear Medicine 47 (2016) 1373–1384
for FNAC for increasing benefits and decreasing costs. FNACis considered the best tool that helps in management ofthyroid nodules and to decide whether the detected thy-roid nodule requires surgery or follow-up. TIRADS andFNAC are considered as complementary procedures, andTIRADS is considered as the only tool used for selectionof high-risk nodules that require biopsy [4].
The use of TIRADS classification system allowed to min-imize the number of FNAC. Patients with TIRADS type 2nodules do not require aspiration, patients with TIRADS 3are followed up or biopsied according to surgeon’s decisionand guided by patient’s clinical state and history, whilepatients who have TIRADS type 4 and TIRADS type 5 nod-ules must be aspirated and are further operated on.
Thyroid ultrasound based classification systemincluded many items to memorize compared to TIRADS,and hence TIRADS is easier to apply in daily practice forthyroid ultrasound reporting as well as nodule selectionfor biopsy.
During characterization of thyroid nodules by US, TI-RADS is considered the way to go.
In comparing Russ’s modified TI-RADS with thyroidultrasound based classification system proposed by Kimet al., we conclude that TI-RADS was similar to and wasmore friendly than the thyroid ultrasound based classifica-tion system.
The field of ultrasound characterization of thyroid nod-ule needs further research with the emerging ultrasoundelastography techniques which may help in better charac-terization of borderline nodule and TIRADS 3 & 4A nodules.
5. Conclusion
TIRADS involves diffuse thyroid pathologies as well asfocal nodular pathologies while thyroid ultrasound basedclassification system concerns with thyroid nodules only.
� TIRADS system deals with thyroid nodule generallywhile ultrasound based classification system deals withsolid nodule and partially cystic thyroid nodule (PCTN)as separate categories.
� Statistical analysis of both systems is nearly the same.
� Ultrasound based classification systems have morememorized items than TIRADs system.
� TIRADS system is simpler and easier method used forthyroid ultrasound reporting.
� TIRADS gives surgeon an idea about the following step(follow-up/biopsy).
References
[1] American College of Radiology, ‘‘Breast Imaging Re-porting and DataSystem. Breast Imaging Atlas”, 4th Edi-tion, American College ofRadiology, Reston, 2003.
[2] Cooper DS, Doherty GM, Haugen BR, et al. American ThyroidAssociation (ATA) guidelines taskforce on thyroid nodules anddifferentiated thyroid cancer, Revised American ThyroidAssociation management guidelines for patients with thyroidnodules and differentiated thyroid cancer. Thyroid2009;19:1167–214.
[3] Gharib H, Papini R, Paschke R, et al. American Association of clinicalendocrinologists, and European thyroid association medicalguidelines for the diagnosis and management of thyroid nodules.Endocr Pract 2010;16:1–43.
[4] Horvath E, Majlis S, Rossi R, et al. An ultrasonogram reporting systemfor thyroid nodules stratifying cancer risk for clinical management. JClin Endocrinol Metab 2009;95(5):1748–51.
[5] Kim DW, Park JS, In HS, et al. Ultrasound-based classification forsolid and partially cystic thyroid nodules. Am J Neuroradio, l2012;33:1144–9.
[6] Kwak J, Jung I, Baek J, et al. Image reporting and characterizationsystem for ultrasound features of thyroid nodules: multicentricKorean retrospective study. Korean J Radiol 2013;14(1):110–7.
[7] Kwak JY, Han KH, Yoon JH, et al. Thyroid imaging reporting and datasystem for US features of nodules: a step in establishing betterstratification of cancer risk. Radiology 2011;260:892–9.
[8] Moifo B, Takoeta E, Tambe J, et al. Reliability of thyroid imagingreporting and data system (TIRADS) classification in differentiatingBegnin from Malignant thyroid Nodules. OJR 2013;3:103–7.
[9] Moon W, Baek J, Jung S, et al. Korean society of thyroid radiology;Korean society of Radiology. Ultrasonography and ultrasound basedmanagementof thyroid nodules:consensus statement andrecommendations. Korean J Radiol 2011;12:1–14.
[10] Morris L, Ragavendra N, Yeh M. Evidence- based assessment of therole of ultrasonography in the management of begnin thyroidnodules. World J Surg 2008;32:1253–63.
[11] Papini E, Guglielmi R, Bianchini A, et al. Risk of malignancyin nonpalpable thyroid nodules: predictive value of ultrasound and colorDoppler features. J Clin Endocrinol Metab 2002;87(5):1941–6.
[12] Russ G. Thyroid Imaging and Reporting Database Sys- tem; 2013.<www.tirads.com>.