Embed Size (px)
Citation preview

RISK MANAGAMENT OF INTERNATIONAL TRANSPORTATION OF INTEGRATED CIRCUIT PRODUCTS
Ya-Ling Yang Ph. D. Candidate Graduate School of Management National Kaoshiung First University of Science and Technology Instructor Department of Aviation & Maritime Transportation Management Chang Jung Christian University 396 Chang Jung Rd., Sec.1, Kway Jen, Tainan 711, Taiwan. Fax: +886-6-2785056
Wen-Hwa Shyu Associate Professor Department of Aviation & Maritime Transportation Management Chang Jung Christian University 396 Chang Jung Rd., Sec.1, Kway Jen, Tainan 711, Taiwan. Fax: +886-6-2785056 E-mail: [email protected]
E-mail: [email protected] Chao-Hsin Lin Assistant Professor Department of Risk Management and Insurance National Kaohsiung First University of Science and Technology 2, Juoyue Rd., Nantz District, Kaohsiung 811, Taiwan. Fax: +886-7-6011020 E-mail: [email protected]
Shuo-Fen Hsu Associate Professor Department of Risk Management and Insurance National Kaohsiung First University of Science and Technology 2, Juoyue Rd., Nantz District, Kaohsiung 811, Taiwan. Fax: +886-7-6011020 E-mail: [email protected]
Abstract: Integrated circuit (IC) products are small-volume, lightweight, and high-unit-price. The loss could be very high if the cargo had not arrived destination safely. We apply risk management techniques to analyze international transportation risks. The data of claim cases of year 2000 were collected, ex post casualty-loss analysis was used to identify, classify and assess risks. The conclusions of this research include: (1) the primary perils of international transportation are damage, theft and wetting. These perils consisted of 93.43%. (2) 90.57% of total claim cases can be attributed to human negligence directly. The causes of losses include damage, non-delivery, theft and shortage. (3) The claim cases can be classified into two clusters by SOM: high-loss cluster and low-loss cluster. (4) The characteristics of loss between different transportation modes are different. (5) The majority of claim cases can be attributed to human factors, therefore, risk prevention and mitigation is the most economic and effective strategy. Key Words: Integrated-circuit products, International transportation, Risk management 1. INTRODUCTION The economic development of Taiwan has been highly depending on international trades. In recent years, electronic products become the most important category both in imports and exports. In the year of 2003, according to the statistical data provided by the Bureau of Foreign Trade, 16.3% of Taiwan’s imports and exports came from integrated-circuit(IC) related products. Accompanied with the highly growing rate of Taiwan’s IC industry, the
Journal of the Eastern Asia Society for Transportation Studies, Vol. 6, pp. 3386 - 3400, 2005
3386
international transportation activities also grow in a very fast pace. The understanding of perils, which could happen to IC products in the transportation process, has become an important issue. IC products possess the properties of small-volume, lightweight, and high-unit-price; therefore, the price could be very high when losses occur during the transportation. Effective risk management strategies can reduce the unexpected losses in the process of transportation. That is why it is so important to identify and assess the risks, to evaluate the degree of risks, and to develop risk management strategies for carriers and IC products manufacturers. The ideas of “risk management” had been developed since the early 1950s. One of the earliest references about the concept of risk management appeared in the Harvard Business Review of 1956 (Gallagher, 1956). According to Gallagher, risk management is a scientific approach to deal with pure risks by anticipating possible accidental losses and designing and implementing procedures that minimize the occurrence of losses or the financial impacts of losses that do occur. There are two major techniques used by risk managers to deal with risks: risk control and risk financing. Risk control focuses on minimizing the risk of losses that the firm is exposed to; risk avoidance and risk reduction are the most common used techniques. Risk financing is concentrating on the arrangement of funds availability when losses happen. The tools of risk financing include retention and risk transfer. Risk management process can be divided into a series of individual steps: the determination of objectives, the identification of risks, the evaluation of the risks, the selection of risk treatment device, the implementation of the decision, and the evaluation and review. Identifying these individual steps helps to guarantee that important phases in the process will not be overlooked. (Vaughan and Vaughan, 2001) Risk analysis and risk management had been broadly applied in the business operations in recent years (Colquitt, 1999; Chiou, 2000; Loderer and Pichler, 2001; Brown, 2001; Atkinson, 2003; Russ, 2004; Anthony and Tony, 2004). The concept of transportation safety has been migrated from the traditional “non-accident announce” to risk management. Risk management is developed into a new field of transportation research (Tsai, 2000). Wang (1997) listed the possible hazards when goods are transferred by air, by sea, and by land. He proposed that cargo owners have to investigate the risks occurred for each type of goods and to obtain appropriate insurance policies. Wang did not investigate the severity and the frequency caused by individual factors. Chang (1999) investigated the risks faced by the transportation industries includes the air transportation industry, the maritime transportation industry and inland transportation industry. He proposed that the aviation carriers should implement risk control and risk financing measures, the maritime carriers should obtain suitable insurance policies, the railway carriers should improve risk control measures, and the inland carriers also should implement risk control and risk financing measures. Li and Cullinane (2003) defined the scope, concepts and methods of maritime risk management (MRM). They applied MRM to recognize and assess maritime liability hazards. The common liability hazards had been analyzed on a case-study basis. The measures of risk avoidance and risk reduction of maritime transportation had also been examined. Shiau (1996) investigated the perils of maritime transportation and liner transportation industry. He classified the perils of container transported by sea and analyzed the causes of perils in each operation phase. Shyu et al. (2000) collected data about losses during imports and exports processes, they analyzed the risk factors from the cargo owners’ point of view. The data of insured amount, incurred claim, and cargo category were analyzed to evaluate loss severity and loss frequency for different cargo types.
Journal of the Eastern Asia Society for Transportation Studies, Vol. 6, pp. 3386 - 3400, 2005
3387
Nyce (2002) combined both traditional and innovative risk management techniques into one semester-long group case study, The Delta Air Lines case study was divided into three segments to focus on three distinct objectives: identification of horizon risk, analysis of workers’ compensation claims, and estimating both total loss distributions and layers of loss due to airline crashes for potential capital market financing alternatives. Tsai et al. (1999) proposed a framework for aviation security management. He applied risk management concepts in designing procedures of aviation security management. The differences in the applications of risk management and insurance were clarified. Shyu et al. (2001) analyzed claim cases obtained from a Taiwan's insurance company. They identified the relationships between the causes of cargo damages and the frequency of accidents. Preventive measures were suggested for IC products to reduce the rate of damages during international transportation. O’Connell (2004) also proposed methods to secure the safe arrival of cargo transported by sea. In order to lower the loss of IC products owing to accidents when they are delivered, we will make an overall study to understand the risk factors during international transportation and the characteristics of risk factors of ICs products. The purpose of this paper is fourfold. First, we use Self Organization Map (SOM) to verify risk categories of IC products during international transportation. Second, we explore the characteristics of claim data by SOM. Third, we construct the model of risk measurement by collecting data. Fourth, we will propose risk management suggestions for carriers and IC products manufacturers. 2. METHODOLOGY We adopt the ex post Casualty-Loss Analysis method which is for the purpose of search improved methods in the future by past loss experience and claim characteristics. It let us know how and when the claim happened, how many casualties happen, and how much money lost by using this analysis method. Based on the results of the analysis, we can further assess the degrees of risks and draft the risk management plan.
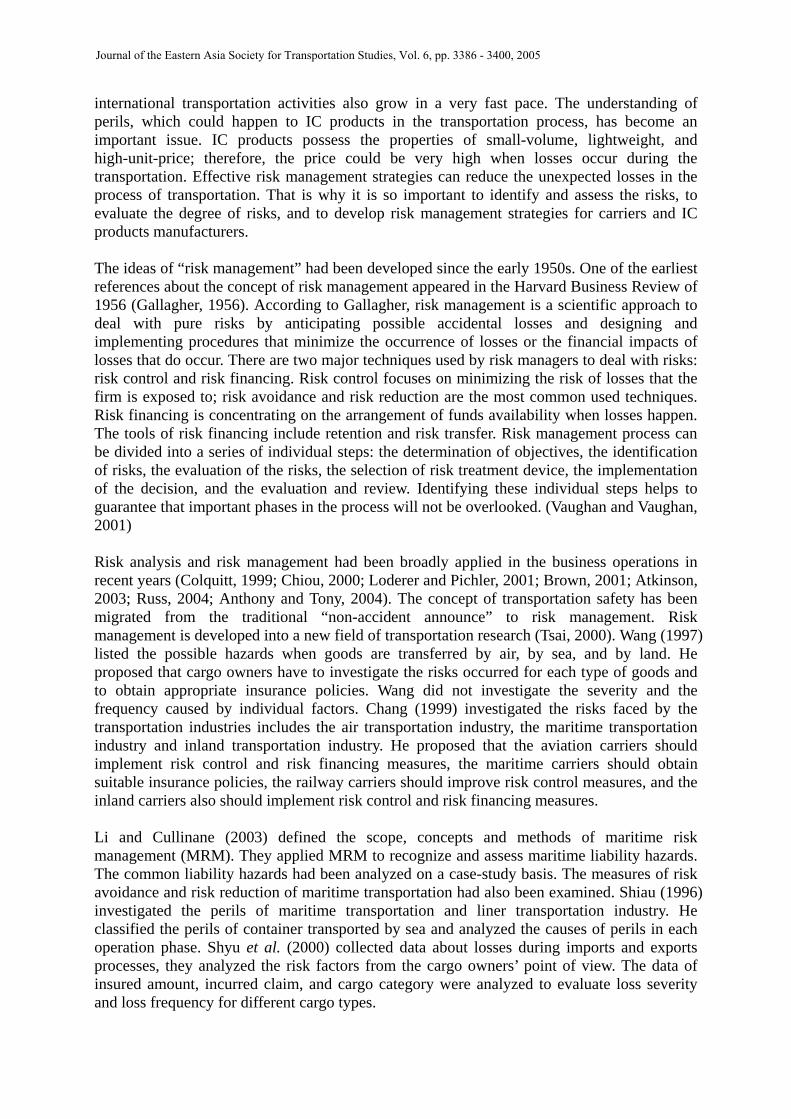
2.1 SOM Model A SOM network assumes a topological structure among the cluster units. There are m cluster units, arranged in a one- or two-dimensional array, and input signals are n-tuples [Kononen (1989)]. This network architecture can be visualized as shown in Figure 2.1.
The weight vector for a cluster unit serves as an exemplar of the patterns associated with that
Figure 2.1 SOM Network Architecture
Network weight vector oW
Two-dimensional topological array O
Input vector X
Journal of the Eastern Asia Society for Transportation Studies, Vol. 6, pp. 3386 - 3400, 2005
3388
cluster. During the self-organization process, the cluster unit whose weight vector matches the input pattern most closely (typically, the square of the minimum Euclidean denoted as show in equation (1)) is chosen as the winner denoted as in equation (2). The updating process is given by equation (3).
*O
[∑ −≡−i
Oioi WXWX 2] (1)
oiioi WXWX −≡− min* (2)
ooo factorRWXW _)( ⋅−⋅+=Δ η (3) Where is the vector of the th
iX i input pattern, is the weight vector. oW η refers to the learning rate and is a slowly decreasing function of time. refers to the topological neighborhood parameter and is set as follows in this paper.
ofactorR _
)/exp(_ RrfactorR oo −= (4) In which, R is the radius of topological neighborhood and is neighborhood distance
defined by or
2*2* )()( yyxx OOOO −+− .
It can be shown from equation (4) that if =0, then =1 and if , then =0. In other words, in the neighborhood area, the greater the neighborhood
distances, the smaller the neighborhood parameter and the smaller the update of the weight. Furthermore,
or ofactorR _ ∞=or
ofactorR _
R and η are updated through equations (5) and (6). RrateRR ⋅= _ (5) ηηη ⋅= rate_ (6)
Where and rateR _ rate_η are the updating factors. From equation (5) and equation (6) it can be seen that the neighborhood radius and the learning rate slowly decrease as the clustering process progresses. This is referred to as the convergence of SOM. 2.2 Data Our sampling data were obtained from a Taiwanese insurance company, which is one of the largest companies in the property insurance industry. The data include all 140 claims in the year 2000. The data items considered for analysis include insured amount, premium, incurred claim, imports or exports, destination, cause of loss and transportation mode. Based on the data collected, only pure risks were analyzed and their management strategies were proposed. Due to the value of incurred claim depends on the value of insured amount underwritten. To avoid the magnified influences from the absolute values of losses in analyzing the relationship between perils and risks, two relative measures for loss were used in the data mining processes to classify risks. A1 is the ratio of incurred claim and premium, which is defined as loss ratio. A2 is the ratio of incurred claim and insured amount, which is defined as claim ratio. Two other measures were introduced to count the effects from the cause of loss and the transportation mode. C1 represents the cause of loss. C2 represents the method of transportation. These four variables consist of the SOM input vectors, denoted by X = { Ad, Cd | d=1,2}. The natures of air transportation and marine transportation are different. It is helpful to investigate the relationship between the cause of loss and the transportation mode. Risk classification reveals the characteristics of the cause loss by different transportation method. Risk control measures could be developed for the carriers and the shipper when IC products
Journal of the Eastern Asia Society for Transportation Studies, Vol. 6, pp. 3386 - 3400, 2005
3389

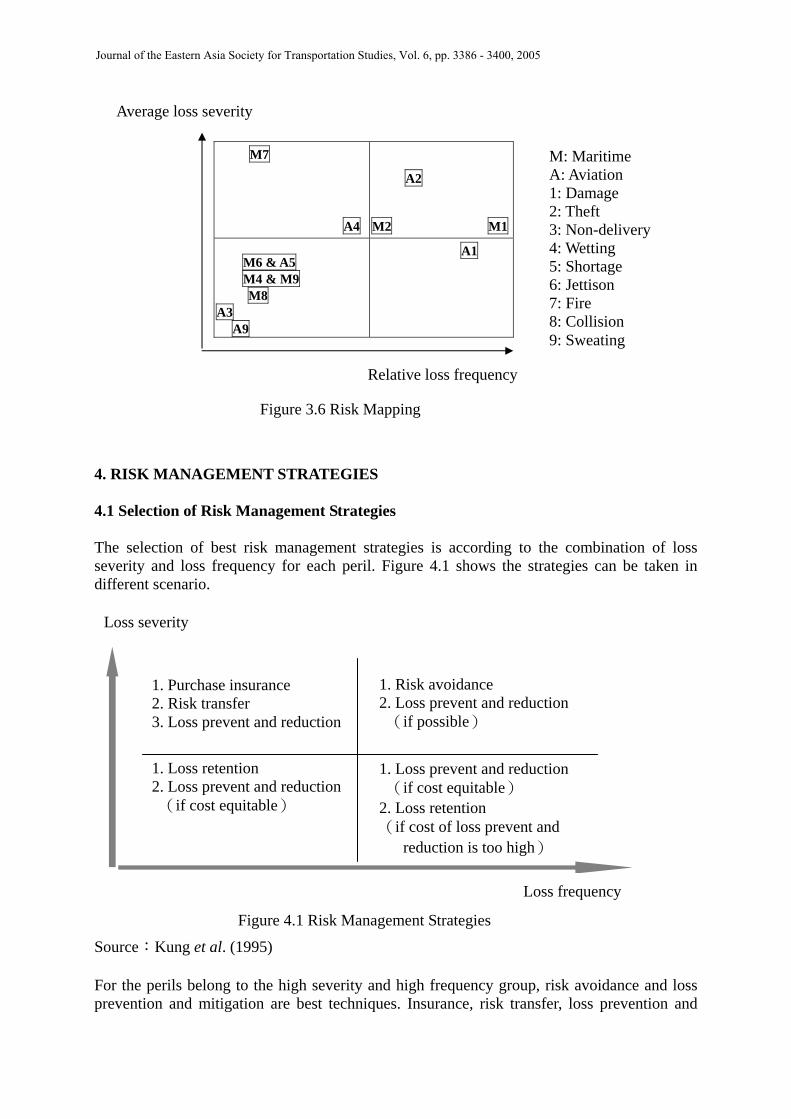
are transported to reduce the amplitude of loss. 3. EMPIRICAL RESULTS 3.1 The Analysis of Perils After reviewing and analyzing all the claim cases, the possible causes of loss during the imports and exports transportation processes for IC product can be classified into 9 categories. The perils are listed as in a descending order according to the number of claims of each peril. Figure 3.1 shows the relative frequency of each peril. They are: (1) Damage: abrasion, collision, dint, tear, cracking, scratching, bending etc. (2) Theft: whole or part of the cargo stolen. (3) Wetting: the damage caused by water. (4) Shortage: shortage of cargo upon arrival. (5) Non-delivery: the cargo undelivered for unknown reasons. (6) Jettison: When the vessel and the cargo on board are in the status of danger, part of cargo
is abandoned for the safety of other cargo. The cargo abandoned due to the defects of the cargo itself is not included.
(7) Fire: the cargo is damaged in the process of transportation due to fire directly or indirectly. (8) Collision: the cargo was damaged due to the collision of conveyance. (9) Sweating: the cargo was damaged due to the evaporation of other cargo or packaging
materials in the same vessel.
Figure 3.1 The Relative Frequency of Each Peril
sweating1%
collusion1%
jettison1%
nondelivery1%
shortage4%
wetting7%
theft18%
fire1%
damage66%
The most common peril to cause loss was goods damaged. There were 94 claim cases due to goods damaged. It occupied 67.14% of total claim cases. The causes for damages included unsuitable packaging, negligence during loading and unloading operations. The goods stolen or lost were second in the number of claim cases. There were 27 claim cases due to goods stolen or lost. It occupied 19.86% of total claim cases. The causes for goods stolen or lost included the complex composition of handling personnel during terminal operations, the qualification of carriers, and the qualification of forwarders. Wetting was the third largest peril. There were 10 claim cases due to wetting. The percentage was 7.14%. The causes for wetting included the loading and unloading in the rain, seawater overboard, and unsuitable packaging. Shortage is the number four peril of loss. There were 5 claim cases. The percentage is 3.57%. The causes for shortage when goods delivered included negligence and dishonesty. From the above analyses, we concluded that the majority of losses were from human errors.
Journal of the Eastern Asia Society for Transportation Studies, Vol. 6, pp. 3386 - 3400, 2005
3390
90.57 % of losses accounted were caused by human negligence directly. These perils included damage, theft, goods lost, and goods shortage. 9.43% of losses can be attributed to human negligence indirectly. These perils included wetting, jettison, fire, collision and sweating.
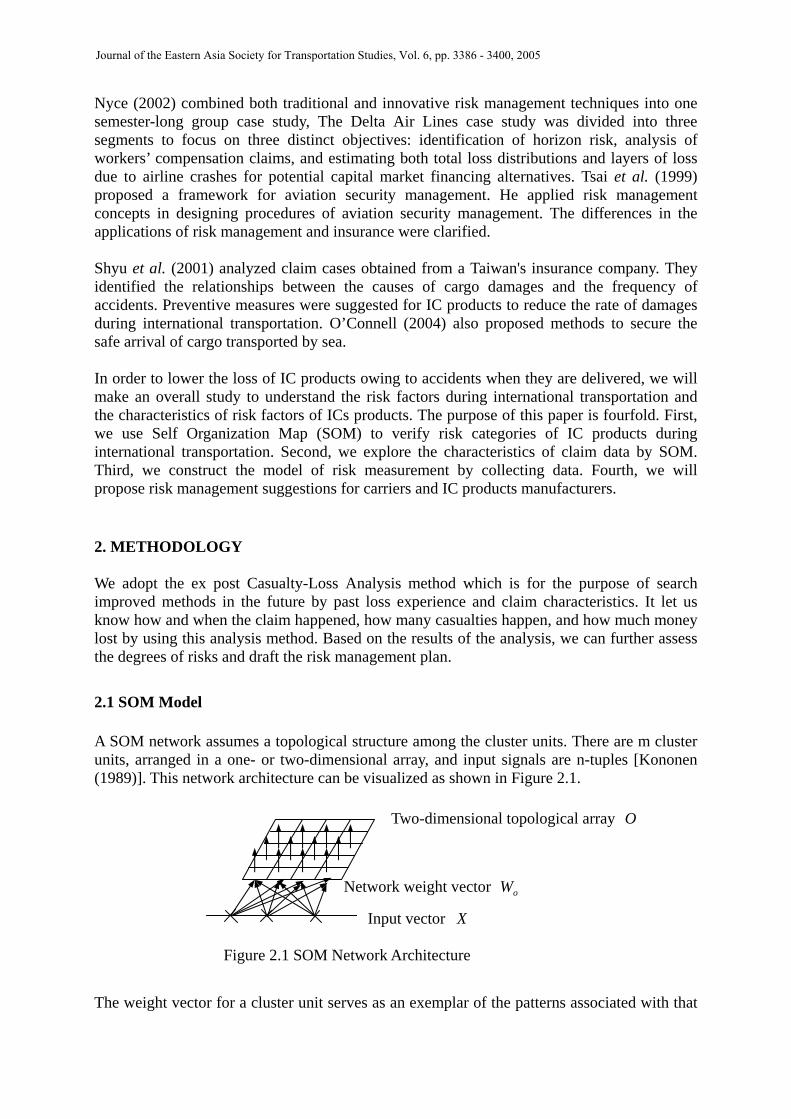
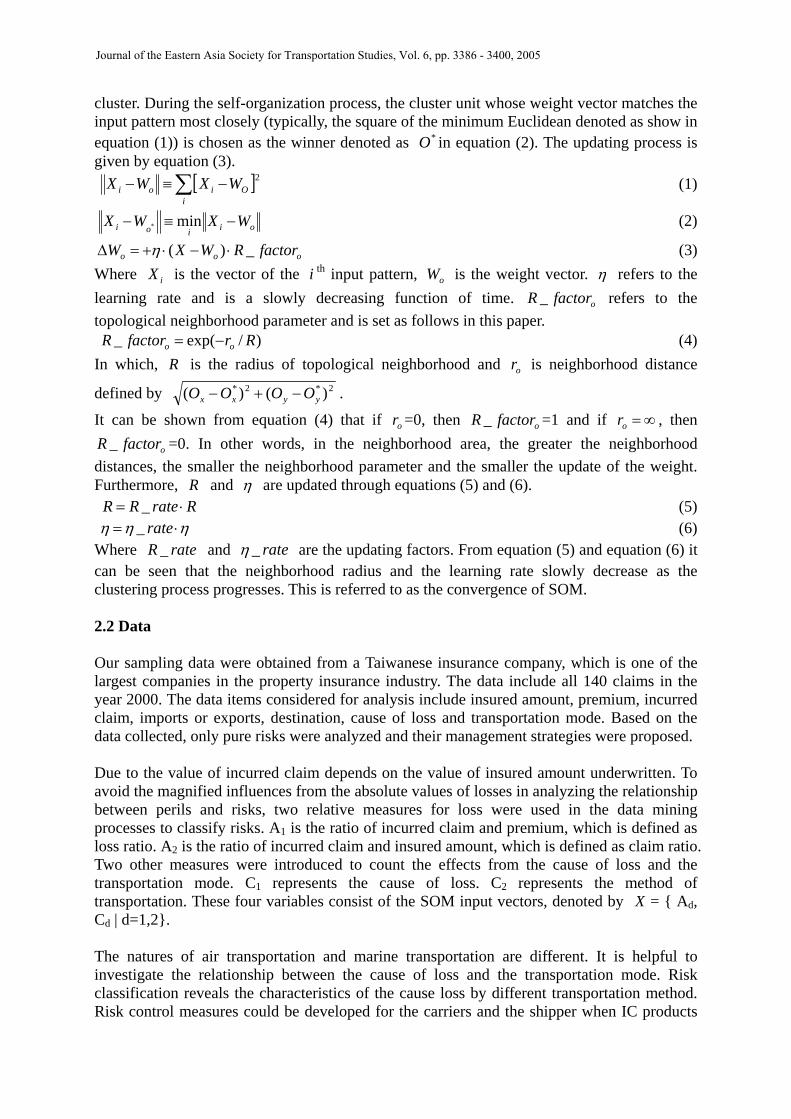
3.2 Risk Classifying and Data Mining SOM is used to categorize risks and to mine data for the purpose of understanding the characteristics of goods loss. The characteristics will be utilized to develop effective risk management strategies. The input data of SOM include loss ratio, claim ratio, cause of loss and transportation mode. An 8 by 8 output SOM matrix is used for the depiction of the network topology. To make the results converge. The learning rate was set as 0.1, the neighborhood radius was set as 4, and convergence was achieved after 500 learning cycles. Learning convergence diagrams and Sammon's Mapping (Note: Sammon's Mapping is used to test whether the results derived from SOM have converged fully. The SOM classification is complete if the graphical topology has no overlaps or knots.), as shown in Figure 3.2 and Figure 3.3 The training and testing errors both are only 0.026.
Figure 3.2 Network Learning Convergence Diagram
Figure 3.3 Sammon's Mapping of SOM
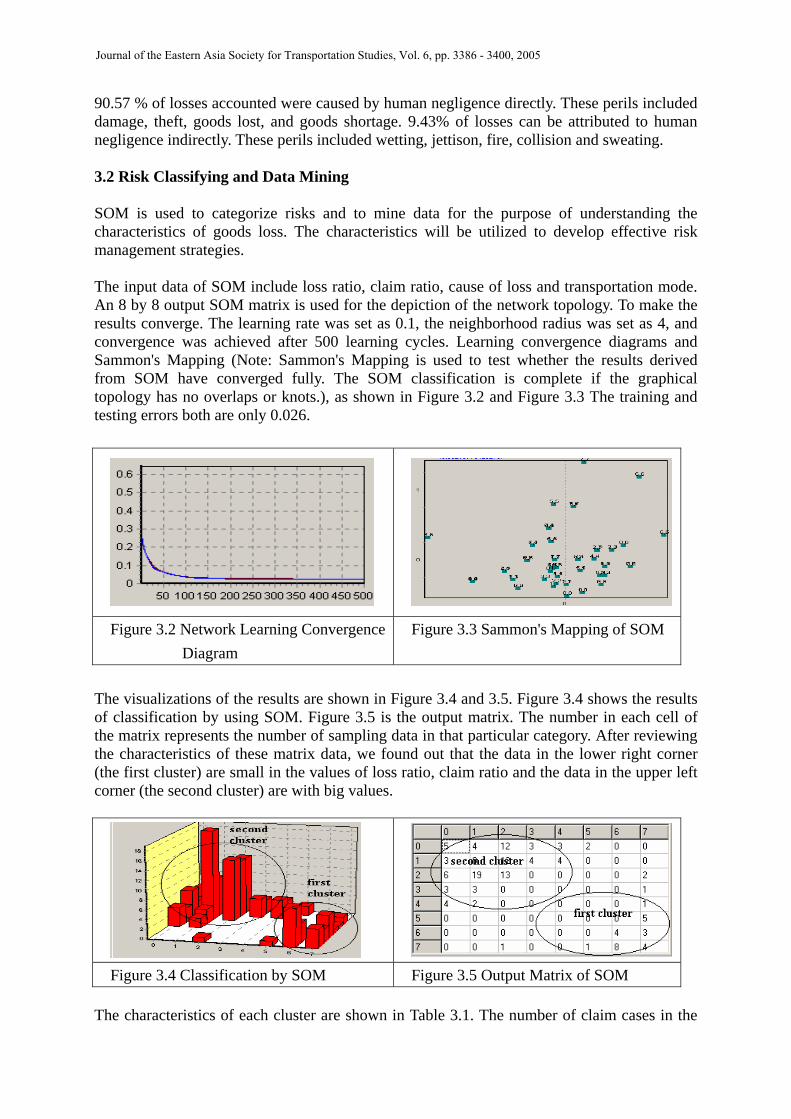
The visualizations of the results are shown in Figure 3.4 and 3.5. Figure 3.4 shows the results of classification by using SOM. Figure 3.5 is the output matrix. The number in each cell of the matrix represents the number of sampling data in that particular category. After reviewing the characteristics of these matrix data, we found out that the data in the lower right corner (the first cluster) are small in the values of loss ratio, claim ratio and the data in the upper left corner (the second cluster) are with big values.
Figure 3.4 Classification by SOM Figure 3.5 Output Matrix of SOM The characteristics of each cluster are shown in Table 3.1. The number of claim cases in the
Journal of the Eastern Asia Society for Transportation Studies, Vol. 6, pp. 3386 - 3400, 2005
3391

first cluster is 29. The average loss ratio is 1569, average claim ratio is 0.93, and the average loss severity is NT$607,543. The main cause of loss is damage with percentage of 55.18%. Number two cause of loss is theft with percentage of 27.58%. Number three is wetting with percentage of 13.79%. And lost is the number four cause of loss with percentage of 3.4%. In this cluster, 89.64% were transported by air with average loss of NT$548,021. The other 10.34% were transported by sea with average loss of NT$1,123,394. The number of claim cases in the second cluster is 111. The average loss ratio is 69.4, average claim ratio is 0.041, and the average loss severity is NT$97,183. The main cause of loss is damage with percentage of 70.27%. Number two cause of loss is theft with percentage of 16.21%. Number three is wetting with percentage of 5.4%. And shortage is the number four cause of loss with percentage of 4.5%. In this cluster, 71.18% were transported by air with average loss of NT$102,870. The other 28.82% were transported by sea with average loss of NT$83,143. The first cluster is defined as high-loss cluster because of the high loss ratio, high average claim ratio, and high average loss severity. The second is defined as low-loss cluster. The average loss of the high-loss cluster is about 5 times larger than the average loss of the low-loss cluster. Most of the claim cases in the high-loss cluster were transported by air. The main cause of loss is damage that occupies 55.18%. The second cause of loss is theft that occupies 27.58%. When IC products are transported by air, it is important to implement control measures about damage and theft. As of the low-loss cluster, the main cause of loss is damage, too. It occupies 70.27%. The characteristics of each risk cluster are listed in Table 3.2.
Table 3.1 Data Statistics after SOM Classification Cluster first second Number of claim cases 29 111Average loss ratio 1,569 69Average claim ratio 0.93 0.04Average amount of losses 607,542 97,183
Relative loss frequency 10.34% 28.82%Maritime transportation Average loss severity 1,123,394 83,143
Relative loss frequency 89.66% 71.18%
Transportation mode
Air transportation Average loss severity 548,021 102,870Damage 55.18% 70.27%Theft 27.58% 16.21%Wetting 13.79% 5.4%Shortage --- 4.5%Non-delivery 3.4% ---Jettison --- 0.9%Fire --- 0.9%Collusion --- 0.9%
Perils
Sweating --- 0.9%*Note: In December 2000, one U.S. dollar was worth about NT$34.
Journal of the Eastern Asia Society for Transportation Studies, Vol. 6, pp. 3386 - 3400, 2005
3392