Embed Size (px)
Citation preview

Risk Management In IT-projects
Master of Science Thesis in the Master Degree Programme
International Project Management
André Söderlind
Department of Civil and Environmental Engineering
Division of Building Economics and Management
CHALMERS UNIVERSITY OF TECHNOLOGY
NORTHUMBRIA UNIVERSITY, NEWCASTLE U.K.
Göteborg, Sweden, 2007

Page 2

Page 3
Abstract Competing in the IT-industry today is an uncertain business. A project manager in the
industry has lots of threats and pitfalls to handle. A lot of his or her work is about managing
risks. The purpose of my study is to provide a better understanding of the use of risk
management in projects at various companies. To reach this purpose I conducted multiple
case studies at Ericsson and two businesses that wished to remain anonymous. I have
investigated the objectives with risk management, the strategies of risk management and how
the effects of risk management can be measured. My main findings showed that having less
chaos in the projects was the main objective. When it came to risk management strategy my
main finding showed that successful risk management often included everyone in the project.
It is also important to start early with risk management. Another important finding was that
having an informal way of conducting risk management was not necessary bad in a project
where the pre-requisites changed often. Regarding the effects of coaching my findings
showed that measuring the return of investment on the use of risk management is non-
existent.

Page 4

Page 5
Table of contents Abstract ..............................................................................................................................................3
List of Figures ....................................................................................................................................7
List of Tables ......................................................................................................................................7
1. Introduction ....................................................................................................................................8
Background ....................................................................................................................................8
Problem discussion .........................................................................................................................9
Purpose .......................................................................................................................................9
Parameters to the study................................................................................................................9
Disposition of the Thesis ............................................................................................................... 10
2. Literature review ........................................................................................................................... 11
Definition of risk and risk management/analysis ............................................................................ 11
The objectives of risk management/analysis .................................................................................. 12
The strategy of risk management/analysis ..................................................................................... 13
Different strategies .................................................................................................................... 13
How to identify risks ................................................................................................................. 17
How to assess/evaluate risks ...................................................................................................... 18
How to reduce risks ................................................................................................................... 19
The effects of risk analysis and management ................................................................................. 20
3. Conceptual Framework ................................................................................................................. 22
Objectives with risk analysis/management..................................................................................... 22
Risk analysis/management strategy ............................................................................................... 22
The effects of risk analysis/management ....................................................................................... 23
4. Methodology................................................................................................................................. 25
Research purpose .......................................................................................................................... 25
Research approach ........................................................................................................................ 25
Deductive versus Inductive Research......................................................................................... 25
Qualitative and Quantitative Method ......................................................................................... 26
Research Strategy ......................................................................................................................... 26
Data collection method ................................................................................................................. 27
Sample selection ........................................................................................................................... 28
Data analysis ................................................................................................................................. 28
5. Data presentation .......................................................................................................................... 30
Company 1 - Ericsson ................................................................................................................... 30
Objectives with risk management .............................................................................................. 30
Risk Management strategy ........................................................................................................ 31
Effects of Risk Management ..................................................................................................... 35
Company 2 ................................................................................................................................... 37
Objectives with risk management .............................................................................................. 37
Risk management strategy ......................................................................................................... 37
The effects of risk analysis/management.................................................................................... 39
Company 3 ................................................................................................................................... 40
Objectives with risk management .............................................................................................. 40
Risk management strategy ......................................................................................................... 41
The effects of risk analysis/management.................................................................................... 42
6. Data analysis ................................................................................................................................. 43

Page 6
Objectives of Risk Management / Analysis – Research Question 1 ................................................ 43
Strategy of Risk Management / Analysis – Research Question 2 .................................................... 45
Identify risks and uncertainties .................................................................................................. 45
Risk analysis ............................................................................................................................. 45
Risk reduction ........................................................................................................................... 45
Effects of Risk Management – Research Question 3 ...................................................................... 46
7. Findings and Conclusions ............................................................................................................. 48
How can the objectives of Risk Management / Analysis be described ............................................ 48
How can the strategy of Risk Management / Analysis be described ............................................... 49
How can the effects of Risk Management / Analysis be described ................................................. 50
Implications and recommendations ............................................................................................... 50
Implications for project managers .............................................................................................. 50
Implications for theory .............................................................................................................. 51
Implications for future research ................................................................................................. 51
Reference list .................................................................................................................................... 52

Page 7
List of Figures Figure 1: The three components of a risk, which determine our ability to manage it. ............. 11 Figure 2: Risk Management and Analysis approach .............................................................. 14
Figure 3: Risk Management stages. ...................................................................................... 15 Figure 4: Risk Management process flow diagram. ............................................................... 16
Figure 5: Risk Management flow. ......................................................................................... 17 Figure 6: PROPS different Toll-Gates................................................................................... 31
Figure 7: Minirisk example ................................................................................................... 33
List of Tables Table 1: Relevant situations for different research strategies. ................................................ 27
Page 8
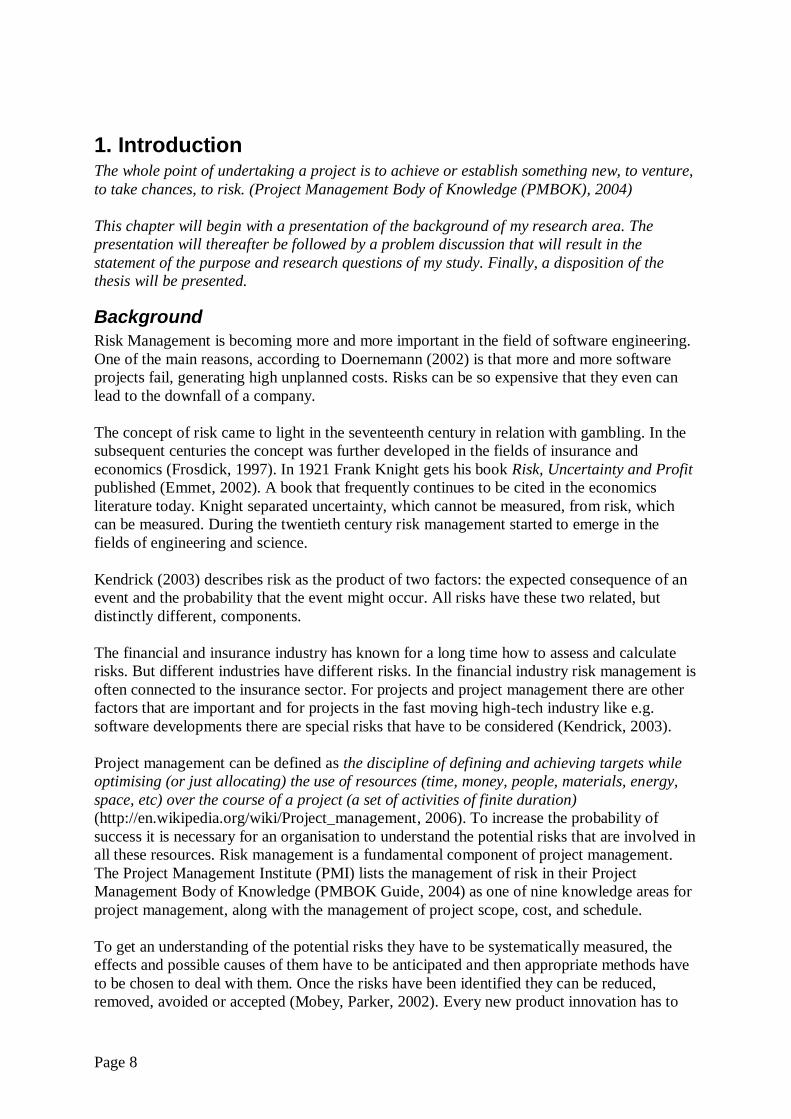
1. Introduction The whole point of undertaking a project is to achieve or establish something new, to venture,
to take chances, to risk. (Project Management Body of Knowledge (PMBOK), 2004)
This chapter will begin with a presentation of the background of my research area. The
presentation will thereafter be followed by a problem discussion that will result in the
statement of the purpose and research questions of my study. Finally, a disposition of the
thesis will be presented.
Background
Risk Management is becoming more and more important in the field of software engineering.
One of the main reasons, according to Doernemann (2002) is that more and more software
projects fail, generating high unplanned costs. Risks can be so expensive that they even can
lead to the downfall of a company.
The concept of risk came to light in the seventeenth century in relation with gambling. In the
subsequent centuries the concept was further developed in the fields of insurance and
economics (Frosdick, 1997). In 1921 Frank Knight gets his book Risk, Uncertainty and Profit
published (Emmet, 2002). A book that frequently continues to be cited in the economics
literature today. Knight separated uncertainty, which cannot be measured, from risk, which
can be measured. During the twentieth century risk management started to emerge in the
fields of engineering and science.
Kendrick (2003) describes risk as the product of two factors: the expected consequence of an
event and the probability that the event might occur. All risks have these two related, but
distinctly different, components.
The financial and insurance industry has known for a long time how to assess and calculate
risks. But different industries have different risks. In the financial industry risk management is
often connected to the insurance sector. For projects and project management there are other
factors that are important and for projects in the fast moving high-tech industry like e.g.
software developments there are special risks that have to be considered (Kendrick, 2003).
Project management can be defined as the discipline of defining and achieving targets while
optimising (or just allocating) the use of resources (time, money, people, materials, energy,
space, etc) over the course of a project (a set of activities of finite duration)
(http://en.wikipedia.org/wiki/Project_management, 2006). To increase the probability of
success it is necessary for an organisation to understand the potential risks that are involved in
all these resources. Risk management is a fundamental component of project management.
The Project Management Institute (PMI) lists the management of risk in their Project
Management Body of Knowledge (PMBOK Guide, 2004) as one of nine knowledge areas for
project management, along with the management of project scope, cost, and schedule.
To get an understanding of the potential risks they have to be systematically measured, the
effects and possible causes of them have to be anticipated and then appropriate methods have
to be chosen to deal with them. Once the risks have been identified they can be reduced,
removed, avoided or accepted (Mobey, Parker, 2002). Every new product innovation has to
Page 9
deal with risks and with every decision there are risks associated with it. When starting a new
software development project there cannot be a complete understanding of all the
components, the technology, people‘s knowledge and expertise. So risks will be taken and
decisions have to be made on how to handle those (Smith, Merrit, 2002).
Problem discussion
Software projects are all about time to market, with the hard competition you want to be first
out. As a leader you have the luxury of time, but for the followers the clock is running
(http://en.wikipedia.org/wiki/Time_to_market, 2006). Often long before version 1.0 is coming
out there are already plans for what should be included in version 2.0 and 3.0. With this
pressure to be first on the market there are big risks. Often quality gets the short end of the
stick and that can be bad for the reputation. Neil Hagglund, Corporate VP and Director of
Corporate Technology Planning, Motorola, Inc, said that customers expect flawless quality
and leading products with value-added features, at lower prices and in shorter and shorter
cycle time. Companies that respond to these needs will flourish and those that cannot will fall
behind (Smith, Reinertsen, 1998).
To avoid problems during a project most projects today use some sort of risk identification.
This work often tends to end up with a delivery of a risk-list at the beginning of a project that
few development teams put much attention into (Smith, Merrit, 2002). Therefore the project
will run into needless surprises in schedule, product cost or features, project budget, team
morale, or market acceptance. Often the nature of these surprises are shown late in the
development when it is harder, sometimes impossible, to do anything about them.
Often these surprises seem to occur in project after project and the organisation will not learn
from past experiences. Experience can be an invaluable resource, but the organisation have to
learn from them and from others of how and what not to do (Kendrick, 2003). Constant
problems with lack of resources a budget that can not the hold is a situation that does not need
to exist, all the tools and resolutions are available, yet only a few companies use them in their
development processes (Smith, Merrit, 2002).
All this puts burden on the project manager. According to (PMBOK Guide, 2004) a good
project manager needs to be able to balance the competing demands of scope, time, cost,
quality, resources and risk to produce a successful outcome. Kendrick (2003) says that to be
able to succeed a project manager must be able to look backward and learn from his and
others mistakes and he must be able to look forward and plan in a way to reduce risks.
Purpose
The purpose of this study is to provide a better understanding of how managing and analysing
risk can improve software development projects time to market, quality and overall success.
To be able to achieve this, the following research questions will be further investigated.
RQ1: How can the objectives of risk management/analysis be described?
RQ2: How can the strategy of risk management/analysis be described?
RQ3: How can the effects of risk management/analysis be measured?
Parameters to the study
This study investigates how the Risk Management/Analysis work is done in a software
development project at various companies. Risk Management/Analysis as a whole and for

Page 10
other types of projects has been used in the research for this thesis. However the conclusions
drawn are for a Project Manager working in the fast moving world of software development.
Disposition of the Thesis
This thesis is divided into seven chapters. In this one, the first chapter, the reader has received
an introduction to the field of study, followed by a problem discussion, a presentation of the
overall purpose of the study, the research questions to be investigated, and the demarcations
of the study. In the second chapter, the reader is provided with a literature review of previous
research conducted within the area of the overall purpose, which serve as theories for the
study. The conceptual framework is following the literature review and presented in chapter
three, further describes the theories that will be used. Chapter four describes and motivates the
choices of methodology made for this thesis. In chapter five, the collected empirical data is
presented. The empirical data that has been gathered is then examined and analysed in chapter
six. In the seventh and final chapter, findings and conclusions are drawn based on the findings
of the research conducted. At the end of the seventh chapter, implications for further research
are presented.

Page 11
2. Literature review "Show me a man who risks nothing and I will show you a man who achieves nothing."
– unknown
In the previous chapter, an introduction and background to the research area of this study
was presented, as well as the overall purpose and research questions. This chapter presents a
review of literature relating to each of the three stated research questions
Definition of risk and risk management/analysis
Smith and Merrit (2002) said that three essential aspects of risk are uncertainty, loss and time,
see Figure 1.
Uncertainty: A project manager has to identify as many uncertainties as possible. A
risk may or may not happen. This inherent uncertainty cannot be eliminated, but it can
be made little clearer by clarifying the probability of occurrence of the risk, to get at
better understanding of the consequences and alternatives if the risk occurs and
determine the factors that influence the magnitude and likelihood of occurrence of the
particular risk. This means that an uncertainty can never be completely eliminated, but
it can be reduced to a level the project find tolerable. This means that even with the
best plans there cannot be any guarantees that there will be no surprises.
Loss: A risk is always something that involves some kind of loss. If there is no loss
possible, then the project is not concerned about the risk, because it cannot
compromise the project.
Time: Associated with every risk there is a time where the risk no longer exists. Either
the risk has occurred and the loss has been suffered or the potential problems that
could cause the risk have been resolved and no longer pose a threat. It is important to
know when this time has arrived so the risk can be removed from the agenda.
Figure 1: The three components of a risk, which determine our ability to manage it.
Among writers and in the literature there are differences in the meaning of risk management
and risk analysis. Frosdick (1997) says that there are no clear views of the differences and
what one writer defines as risk management another writer is calling it risk analysis.
Frosdick‘s own view is that he separates them by saying that risk analysis is the sum of the
processes of risk identification, estimation and evaluation and risk management is about
planning, monitoring and controlling activities that are produced by the risk analysis activity.
The Association for Project Management (Chapman, Simister 2004) definition of risk analysis
is similar to Frosdick‘s, they have however divided the risk analysis into two stages. The first
stage is called the Qualitative Analysis and it is where risks are identified and subjectively
assessed. These identified risks are then analysed in terms of e.g. cost and time estimates and
that is called the Quantitative Analysis. Just like for Frosdick it is then followed by the risk

Page 12
management process. In their definition it is the process of formulating responses, both
proactive and reactive ones.
Pennock & Haimes (2001) said that risk management could be represented in six steps, three
each for risk assessment/analysis and risk management, where each step is a question.
Risk assessment/analysis
o What can go wrong? Identify as many risks as possible. The risks can be of any
kind financial, time, resources etc. and no risk is too small to not be included.
o What is the likelihood for the risk to occur? Try to measure how likely, or
unlikely, it is for the risk to occur. Maybe some risks are dependent on each
other.
o What are the consequences? What will be the impact on the project if the risk
occurs, is it a minor risk or maybe a stopping fault that endangers the whole
project.
Risk management
o What can be done and what options are available? How to decrease the chance
of a risk occurring, for example get more resources or have them readily
available.
o What are the tradeoffs in term of all costs, benefits and risks among the
available options? For every risk there is somewhere a limit for how costly
measures one can put in, where there is no economy in putting in more
measures. Often the budget is not enough to eliminate all risks therefore one
must choose which risks to put more emphasis on.
o What are the impacts on current decisions on future options?
The objectives of risk management/analysis
The Association for Project Management (Chapman, Simister 2004) defines Risk
Management/Analysis as a process designed to remove or reduce the risks that threaten the
achievement of project objectives. Properly undertaken it will increase the likelihood of
successful completion of a project in terms of cost, time and performance objectives. PMBOK
(PMBOK Guide, 2004) describes it similarly where they say that the objectives of project
management are to increase the probability and impact of positive effects and decrease the
probability and impact of events adverse to project objectives.
Kendrick (2003) list seven benefits on the use of risk management:
Project Justification: Project risk management is undertaken primarily to improve the
chances that a project will achieve its objectives. While there are never any
guarantees, broader awareness of common failure modes and ideas that make projects
more robust can significantly improve the odds of success. The primary goal of project
risk management is either to develop a credible foundation for each project, showing
that it is possible, or to demonstrate that the project is not feasible so that it can be
avoided, aborted, or transformed.
Lower Costs and Less Chaos: Adequate risk analysis reduces both the overall cost
and the frustration caused by avoidable problems. The amount of rework and of
unforeseen late project effort is minimised. Knowledge of the root causes of the
potentially severe project problems enables project leaders and teams to work in ways
that avoid these problems. Dealing with the causes of risk also minimises "fire-
fighting" and chaos during projects, much of which is focused short-term and deals
primarily with symptoms rather than the intrinsic sources of the problems. Chadbourn
(1999) describes it similarly when he likened the uncertainties to chaos, where a

Page 13
poorly designed project could be described as a room full of mousetraps, each with a
ping pong ball. Before you know it, someone not under your control tosses in the first
ball, thus mayhem and chaos erupts. In the ideal project the mousetraps are gone. In
their place there is a network of dominos, where each action and reaction could be
foreseen. It is within the role of organisations to try and identify these mousetraps and
replace them with an orderly string of dominos
Project Priority and Management Support: Support from managers and other project
stakeholders and commitment from the project team are more easily won when
projects are based on thorough, understandable information. High-risk projects may
begin with lower priority, but a thorough risk plan, displaying competence and good
preparation for possible problems, can improve the project priority. Whenever you are
successful in raising the priority of your project, you significantly reduce project
risk—by opening doors, reducing obstacles, making resources available, and
shortening queues for services.
Project Portfolio Management: Achieving and maintaining an appropriate mix of
ongoing projects for an organisation uses risk data as a key factor. The ideal project
portfolio includes both lower- and higher-risk projects in proportions that are
consistent with the business objectives.
Fine-Tuning Plans to Reduce Risk: Risk analysis uncovers weaknesses in a project
plan and triggers changes, new activities, and resource shifts that improve the project.
Risk analysis at the project level may also reveal needed shifts in overall project
structure or basic assumptions.
Establishing Management Reserve: Risk analysis demonstrates the uncertainty of
project outcomes and is useful in setting reserves for schedule and/or resources. Risky
projects really require a window of time (or budget), instead of a single-point
objective. While the project targets can be based on expectations (the "most likely"
versions of the analysis), project commitments should be established with less
aggressive goals, reflecting overall project risk. The target and committed objectives
set a range for acceptable project results and provide visible recognition of project
risk.
Project Communication and Control: Project communication is more effective when
there is a solid, credible plan. Risk assessments also build awareness of project
exposures for the project team, showing how painful the problems might be and when
and where they might occur. This causes people to work in ways that avoid project
difficulties. Risk data can also be very useful in negotiations with project sponsors.
Using information about the likelihood and consequences of potential problems gives
project teams more influence in defining objectives, determining budgets, obtaining
staff, setting deadlines, and negotiating project changes.
The strategy of risk management/analysis
Every project have risks and the outcome can never be fully predicted (Kendrick, 2003). With
Risk Management/Analysis, though there are ways to have more accurate predictions.
Different strategies
There are different strategies and methods that have different approaches toward risk
management. JISC (Joint Information Systems Management) says that the focus for risk
management should be on risks related to the particular project, not project management in
general (http://www.jisc.ac.uk/proj_manguide15.html). The overall goal according to
Kendrick (2003) for risk management in a single project is to establish a credible plan
consistent with business objectives and then to minimise the range of possible outcomes. That

Page 14
is why risk management in a project is about identifying potential risks, analyse the ones that
have the greatest likelihood of occurring, grade their different levels of impact on the project
and define a plan of how to avoid the risk and if it occurs how to reduce its impact (Heldman,
2005).
In Figure 2 Doernemann (2002) shows a basic approach to Risk Management and Analysis
that most strategies are built upon. From the requirements on the project the risks are
identified and evaluated. Actions of how to track them and, if they occur, treat them are
planned.
The Project Management Institute defines six stages in their Project Risk Management
Process (PMBOK Guide, 2004). In Figure 3 they give the details for each stage and Figure 4
shows the process flow diagram of those processes and their inputs, outputs, and other related
Knowledge Area processes.
Risk Management Planning: Deciding how to approach, plan, and execute the risk
management activities for a project.
Risk Identification: Determining which risks might affect the project and
documenting their characteristics.
Qualitative Risk Analysis: Prioritising risks for subsequent further analysis or action
by assessing and combining their probability of occurrence and impact.
Quantitative Risk Analysis: Numerically analysing the effect on overall project
objectives of identified risks.
Risk Response Planning: Developing options and actions to enhance opportunities,
and to reduce threats to project objectives.
Risk Monitoring and Control: Tracking identified risks, monitoring residual risks,
identifying new risks, executing risk response plans, and evaluating their effectiveness
throughout the project life cycle.
Figure 2: Risk Management and Analysis approach

Page 15
Figure 3: Risk Management stages.

Page 16
Figure 4: Risk Management process flow diagram.

Page 17
Smith & Merrit (2001) sees risk strategy as a five step process. Figure 5 shows the flow
through the five-step process and lists deliverables from each step:
Step 1: Identify risks that you could encounter across all facets of the project.
Step 2: Analyse these risks to determine what is driving them, how great their impact
might be, and how likely they are.
Step 3: Prioritise and map the risks so that you can choose those most important to
resolve.
Step 4: Plan how you will take action against the risks on this short list.
Step 5: On a regular basis, monitor progress on your action plans, terminate action
plans for risks that have been adequately resolved, and look for new risks.
Figure 5: Risk Management flow.
Frosdick (1997) also mentioned Strutt‘s, definition of the concept of risk analysis that is a
seven stage process.
Systematic assessment (item by item – question every part of the system).
Identification of risks.
Assessment of risks (frequencies and consequences).
Establish acceptable/tolerable levels of risk.
Evaluate the risks. Are they acceptable? Can they be reduced and at what cost?
Determine whether the risks are as low as reasonably practicable.
Determine risk reduction measures where appropriate.
How to identify risks
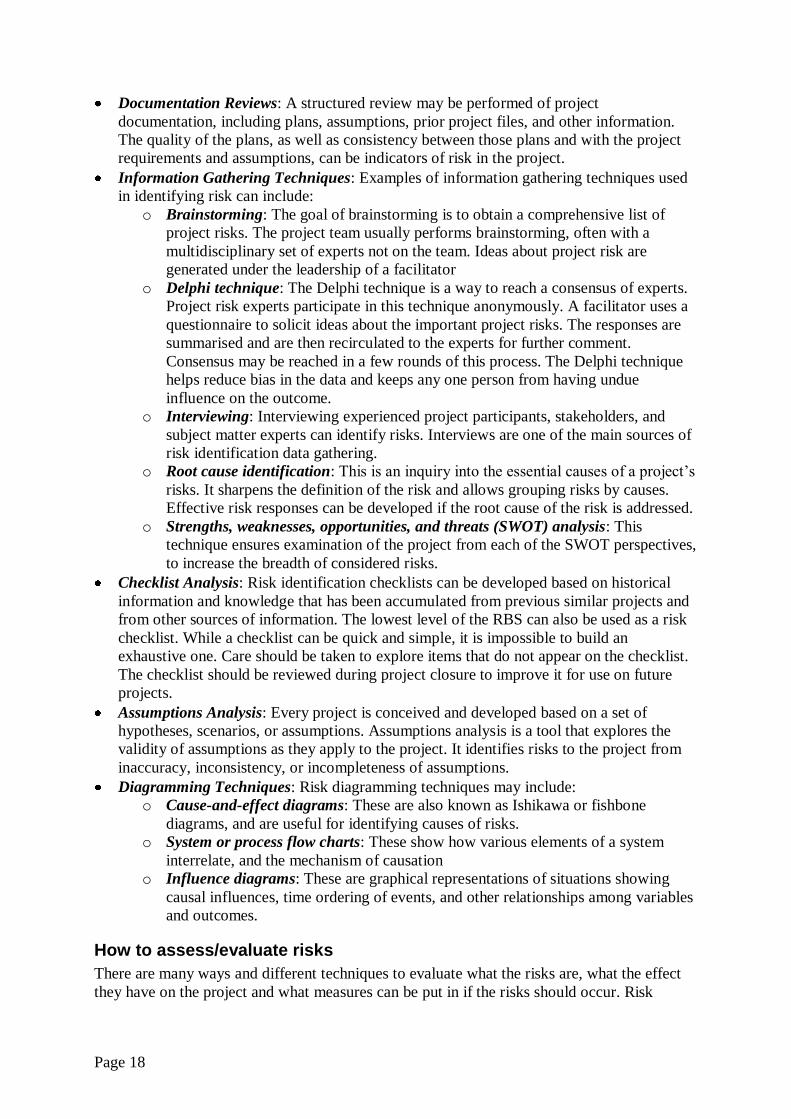
PMBOK (PMBOK Guide, 2004) lists five tools and techniques for risk identification:
Figur 1
Page 18
Documentation Reviews: A structured review may be performed of project
documentation, including plans, assumptions, prior project files, and other information.
The quality of the plans, as well as consistency between those plans and with the project
requirements and assumptions, can be indicators of risk in the project.
Information Gathering Techniques: Examples of information gathering techniques used
in identifying risk can include:
o Brainstorming: The goal of brainstorming is to obtain a comprehensive list of
project risks. The project team usually performs brainstorming, often with a
multidisciplinary set of experts not on the team. Ideas about project risk are
generated under the leadership of a facilitator
o Delphi technique: The Delphi technique is a way to reach a consensus of experts.
Project risk experts participate in this technique anonymously. A facilitator uses a
questionnaire to solicit ideas about the important project risks. The responses are
summarised and are then recirculated to the experts for further comment.
Consensus may be reached in a few rounds of this process. The Delphi technique
helps reduce bias in the data and keeps any one person from having undue
influence on the outcome.
o Interviewing: Interviewing experienced project participants, stakeholders, and
subject matter experts can identify risks. Interviews are one of the main sources of
risk identification data gathering.
o Root cause identification: This is an inquiry into the essential causes of a project‘s
risks. It sharpens the definition of the risk and allows grouping risks by causes.
Effective risk responses can be developed if the root cause of the risk is addressed.
o Strengths, weaknesses, opportunities, and threats (SWOT) analysis: This
technique ensures examination of the project from each of the SWOT perspectives,
to increase the breadth of considered risks.
Checklist Analysis: Risk identification checklists can be developed based on historical
information and knowledge that has been accumulated from previous similar projects and
from other sources of information. The lowest level of the RBS can also be used as a risk
checklist. While a checklist can be quick and simple, it is impossible to build an
exhaustive one. Care should be taken to explore items that do not appear on the checklist.
The checklist should be reviewed during project closure to improve it for use on future
projects.
Assumptions Analysis: Every project is conceived and developed based on a set of
hypotheses, scenarios, or assumptions. Assumptions analysis is a tool that explores the
validity of assumptions as they apply to the project. It identifies risks to the project from
inaccuracy, inconsistency, or incompleteness of assumptions.
Diagramming Techniques: Risk diagramming techniques may include:
o Cause-and-effect diagrams: These are also known as Ishikawa or fishbone
diagrams, and are useful for identifying causes of risks.
o System or process flow charts: These show how various elements of a system
interrelate, and the mechanism of causation
o Influence diagrams: These are graphical representations of situations showing
causal influences, time ordering of events, and other relationships among variables
and outcomes.
How to assess/evaluate risks
There are many ways and different techniques to evaluate what the risks are, what the effect
they have on the project and what measures can be put in if the risks should occur. Risk

Page 19
assessment is by most people divided into two areas, Quantitative Risk Analysis and
Qualitative Risk Analysis.
Quantitative
In its most basic form the formula for risk quantification is: ―Rate of occurrence‖ multiplied
by the ―impact of the event‖ = risk. Methods based on this method are often called ―expected
value analysis‖ and include models like Annualized Loss Expectancy (ALM), the Courtney
formula, the Livermore Risk Analysis Methodology (LRAM) and Stochastic Dominance
(Snyder, Rainer Jr., Carr 1991).
The advantages of Quantitative Risk Analysis methodologies are that they are good at
identifying the most critical areas that, if something happens, will have the largest impact on
the project. There are also disadvantages to Quantitative Risk Analysis. When one measures
the probability of damage to the project the quantitative approach tends to average the events
leading up to a problem (Snyder, Rainer Jr, Carr 1991).
Qualitative
Qualitative methods attempts to express risks in terms of descriptive variables rather than an
economic impact. These approaches are based on the assumption that certain threat or loss of
data cannot be appropriately expressed in terms of dollars or pounds and that precise
information is impossible to obtain. These methodologies include Scenario
Analysis/Planning, Fuzzy Metrics and questionnaires (Snyder, Rainer Jr., Carr 1991).
The advantages of Qualitative Risk Analysis methodologies are that they save time, effort and
expense over quantitative methods. This is because assets do not need exact values in dollars
or pounds nor do threats need to have exact probabilities. It is also a valuable methodology in
identifying significant weaknesses in a risk management portfolio. There are disadvantages
with this method as well. Qualitative Risk Analysis is inexact, the variables used (e.g. low,
medium and high) must be understood by all parties involved (Snyder, Rainer Jr., Carr 1991).
How to reduce risks
Once risks have been identified and evaluated they have to be responded to in some way.
Wideman (1992) lists seven basic responses on identified risks:
Recognised but no action taken (absorbed as a matter of policy)
Avoided (by taking appropriate steps)
Reduced (by an alternative approach)
Shared (with others, e.g., by joint venture)
Transferred (to others through contract or insurance)
Retained and absorbed (by prudent allowances)
Handled by a combination of the above
Dorfman (1997) says that all techniques to manage the risk fall into one or more of these four
major categories (remembered as the 4 T's):
Tolerate (aka Retention)
Treat (aka Mitigation)
Terminate (aka Elimination)
Transfer (aka Buying Insurance)

Page 20
Ideal use of these strategies may not be possible. Some of them may involve trade-offs that
are not acceptable to the organisation or person making the risk management decisions
(Wikipedia, 2007).
Bliss (2005) listed these five types of similar risk responses as Dorfman and Wideman.
Risk avoidance: Also known as risk removal or risk prevention, risk avoidance
involves altering the original plans for the project so that particularly risky elements
are removed. It could include deciding not to perform an activity that carries a high
risk. Adopting such avoidance techniques may seem an obvious way to deal with all
risks. However, often the areas of the project that involve high risks are also the areas
of the project that potentially contain the highest worth or the best value for money.
Avoiding such risks may also result in removing potentially the 'best bits' of a
resource, and an alternative strategy that retains these risks may be more appropriate.
Risk reduction: Risk reduction or risk mitigation involves the employment of methods
that reduce the probability of a risk occurring, or reducing the severity of the impact of
a risk on the outcome of the project. The loss of highly skilled staff is a considerable
risk in any project and not one that can be totally avoided. Suitable risk mitigation
could involve the enforcement of a notice period, comprehensive documentation
allowing for replacement staff to continue with the job at hand and adequate
management oversight and the use of staff development programmes to encourage
staff to stay.
Risk transfer: Risk transfer moves the ownership of the risk to a third party normally
by contract. This also moves the impact of the risk away from the project itself to this
third party.
Risk deferral: The impact a risk can have on a project is not constant throughout the
life of a project. Risk deferral entails deferring aspects of the project to a date when a
risk is less likely to happen. For example managing the expectations users have about
the content and delivery of a resource can be time-consuming, one way to reduce this
risk is by not making a web resource available until user testing is complete.
Risk retention: Whilst a certain number of the risks to the project originally identified
can be removed by changing the project plan or dealt with by transferring the
responsibility of the risk to third parties inevitably certain risks have to be accepted as
a necessary part of the project. All risks that have not been avoided or transferred are
retained or accepted risks by default.
The effects of risk analysis and management
Can the effects of risk analysis be measured? Risk management is a field that is important and
is growing into more and more types of industries. There are many firms and organisations
that make their living in supporting this service. Nevertheless, even though a lot of time and
money is invested in risk analysis and development of risk analysis processes, it was hard to
find research regarding the impact of risk analysis and management. Executives and all kind
of managers often speak highly of risk management and are pleased with the results.
However, it is difficult to provide quantitative data to support their standpoint.
Paul Jones, the Vice President of Global Marketing at Orchestria recommends ―five proofs‖
to use as a measurement for software risk management solutions (Roberts, 2006). The proofs
are used when investigating if the risk management work is of good quality or not.
Proof of precedent: Who‘s using the methods? Due diligence chasing down customer
references, preferably in your industry, is essential.

Page 21
Proof of integration: Can the method integrate with the systems and methods you use
and may use in the future? Can the method prove itself with a working
implementation, or does it just offer promises?
Proof of ROI: Risk is not a one-hit wonder. Compliance must be sustained year in and
year out. Will the method bring down management costs and earn return on
investment both now and in the future?
Proof of policy: Can the method help you implement, rather than merely document,
detailed risk management policies? If so, using which methods?
Proof of concept: Can the method scale up to handle your data and your policies? Do
not take anyone‘s word for it. Run a large-scale pilot project before you decide to
implement it a wider context.

Page 22
3. Conceptual Framework In the previous chapter, literature was reviewed for each of the three stated research
questions. In this chapter, the emerged conceptual framework for the literature reviewed will
be presented. The structure for this chapter will mirror that of the previous chapter, in that
each research question will be addressed in turn.
Objectives with risk analysis/management
The objective emerged in the literature is that the purpose of doing a risk analysis and
handling risks is that a projects wants to discover as many risks as possible beforehand and
reduce the impact of them. I will use Kendrick‘s (2003) seven benefits of risk management,
explained more clearly in the Literature Review, when studying the companies‘ objectives:
Project Justification: The primary goal of project risk management is either to
develop a credible foundation for each project, showing that it is possible, or to
demonstrate that the project is not feasible so that it can be avoided, aborted, or
transformed.
Lower Costs and Less Chaos: Adequate risk analysis reduces both the overall cost
and the frustration caused by avoidable problems. The amount of rework and of
unforeseen late project effort is minimised. Knowledge of the root causes of the
potentially severe project problems enables project leaders and teams to work in ways
that avoid these problems.
Project Priority and Management Support: Support from managers and other project
stakeholders and commitment from the project team are more easily won when
projects are based on thorough, understandable information.
Project Portfolio Management: Achieving and maintaining an appropriate mix of
ongoing projects for an organisation uses risk data as a key factor. The ideal project
portfolio includes both lower- and higher-risk projects in proportions that are
consistent with the business objectives.
Fine-Tuning Plans to Reduce Risk: Risk analysis uncovers weaknesses in a project
plan and triggers changes, new activities, and resource shifts that improve the project.
Risk analysis at the project level may also reveal needed shifts in overall project
structure or basic assumptions.
Establishing Management Reserve: Risk analysis demonstrates the uncertainty of
project outcomes and is useful in setting reserves for schedule and/or resources.
Project Communication and Control: Project communication is more effective when
there is a solid, credible plan. Risk assessments also build awareness of project
exposures for the project team, showing how painful the problems might be and when
and where they might occur.
Risk analysis/management strategy
The literature presents several different strategies that can be used in the risk analysis process.
They all have some different approaches and/or they have divided similar strategies into
smaller parts. Some are very broad while others are more detailed. What is also important is
that although Risk Management and Analysis is very important in the beginning of the project
it is also something that must be ongoing and constantly re-evaluated.
I will use the three-stage process of risk identification, risk assessment and risk reduction
when investigating how the projects are managing their risks:

Page 23
Identify risks and uncertainties: This is the first step in the process, where as many
risks as possible are identified. The purpose is to stop the problems in the door. The
project can never keep everything under control but with proper risk identification the
foundation for a more controlled project is laid. I will see what types the companies
are using according to PMBOK (PMBOK Guide, 2004):
o Documentation reviews
o Information gathering Techniques
Brainstorming
Delphi technique
Interviewing
Root cause identification
SWOT-analysis
o Checklist analysis
o Assumptions analysis
o Diagramming techniques
Cause and effect diagram
System or process flow charts
Influence diagrams
Risk assessment: When risks have been identified it is time to asses and grade them.
There are two parts in risk assessment that form the input when weighing the overall
impact of the risk. It is the probability of the risk to occur, how likely is it to happen?
The second is how big the impact would be if the risk really occurs. The list produced
then forms the basics of where to put in resources. I will look at how the studied
projects do their risk analysis and I will use Snyder, Rainer Jr. and Carr‘s (1991)
definition.
o Quantitative: In its most basic form the formula for risk quantification is: ―Rate
of occurrence‖ multiplied by the ―impact of the event‖ = risk.
o Qualitative: Qualitative methods attempts to express risks in terms of
descriptive variables rather than an economic impact.
Risk reduction: When the list of risks has been produced it is time to try and eliminate
them. Although it is not completely possible the project must have the goal to reduce
them to a level it can tolerate before moving on. I will compare the companies work
with risk reduction with Bliss (2005) five types.
o Risk avoidance: Avoid the risk, by e.g. changing the scope of the project.
o Risk reduction: Take action to reduce the risk, e.g. more personnel.
o Risk transfer: Transfer the risk to a third party, e.g. outsource service and
support or use third party software.
o Risk deferral: Move parts of the project to a future date.
o Risk retention: Accept the risk and the loss if it occurs, e.g. unlikely risks or risk
with a small impact.
I will see what overall insight the projects have when it comes to risks. What methods the
projects are using, if any when they are identifying the risks that can affect the project. How
are they assessing their risks? Are they using a Quantitative or Qualitative approach? What
actions, if any, are they taking with reducing risks? What risks are they trying to avoid and/or
reduce? What risks can the project accept to live with and are they taking any risk transfer
actions. I will also look at how they are documenting the risk analysis work.
The effects of risk analysis/management
I will use Paul Jones five proofs for investigating if the risk management is of good quality or
not. I will see how the companies I examine follow these proofs. The proofs are.

Page 24
Proof of precedent: Who is using the methods? Due diligence chasing down customer
references, preferably in your industry, is essential.
Proof of integration: Can the method integrate with the systems and methods you use
and may use in the future? Can the method prove itself with a working
implementation, or does it just offer promises?
Proof of ROI: Risk is not a one-hit wonder. Compliance must be sustained year in and
year out. Will the method bring down management costs and earn return on
investment both now and in the future?
Proof of policy: Can the method help you implement, rather than merely document,
detailed risk management policies? If so, using which methods?
Proof of concept: Can the method scale up to handle your data and your policies? Do
not take anyone‘s word for it. Run a large-scale pilot project before you decide to
implement it in a wider context.

Page 25
4. Methodology In the previous chapter, a conceptual framework was presented, which detailed theories of
relevance to the purpose and research questions of this thesis. In this chapter, the research
process will be described. Specifically, the research purpose, research method, research
strategy, data collection method, sample selection, data analysis and quality standards will be
presented. Additionally, the considerations that have influenced the choices of methods and
approaches will be presented.
Research purpose
The purpose of research is classified by three different types (Yin 2003). Yin classified the
research purpose as being either explanatory, exploratory or descriptive study.
The three research purposes have differences in their objective and in the structure of the
problem. The objective of the explanatory study is analysing cause-effect relations. That is a
study that concentrates on finding the cause for the chain of events that leads to a certain
effect. The descriptive study differs from the explanatory study as its objective is to break
problems into lower level of components (Reynolds, 1971). To be able to do this the problem
is preferably well structured. The third type of research study is the exploratory one. It is
available when the problem, differing from the two previous, is difficult to structurally
analyse and thereby not easily fits a given predefined model. This research often demands a
more flexible and open minded research according to Yin (2003) and the result should
preferably be used as guidelines in later studies.
Reynolds (1971) claims that choosing one of the three purposes over of the others is not
necessary. Instead, he proposes a compound procedure whereby the research is divided into
three different stages. The goal is to provide the researcher with a cycle of theory
construction, theory testing, and finally theory reformulation.
I will in this study explore, describe and possibly start to explain how different companies in
the IT-industry use risk analysis and risk management. The study is primarily exploratory,
because few studies have been conducted on the subject of Swedish IT-companies use of risk
analysis and risk management. Risk analysis and risk management is a fairly new and
somewhat underused part of risk management in this type of industry. My study is also
descriptive because I will try to describe the discovered patterns of the exploratory stage.
Finally, I will aim to start the explanatory stage because I intend to explain the results that I
gained in the two previous stages, by drawing conclusions on the matter.
Research approach
Deductive versus Inductive Research
Conclusions may be drawn through either inductive or deductive research (Eriksson &
Wiedersheim-Paul 1997). Inductive research draws conclusions that are founded on empirical
data. The researcher establishes a theory and a model that is based on different observable
facts in reality. Deductive research, in contrast, is when the researcher use existing theories
and perform an empirically investigation with different methods. Existing theory is the base
for deciding what information should be selected, how it should be understood and how the
results are to be related to theory. (Patel & Davidson, 1994)

Page 26
This study is deductive due to the means through which the purpose and research questions
were developed. The starting point of this research was with theories previously in existence,
which will then be compared with the empirical data to be collected and concluding with the
drawing of logical conclusions from the research findings.
Qualitative and Quantitative Method
The qualitative and quantitative methods refer to the means through which one chooses to
discuss and analyse the selected data (Patel & Davidson, 1994). According to Yin (2003), the
best approach to use for a study depends on the purpose of the study and the accompanying
research questions.
According to Denscombe (1998) a qualitative research is useful when a researcher wants to
put what has been observed, reported or registered into written words and not numbers.
Qualitative research tends to rely on detailed and thorough descriptions of events or people.
Qualitative research is often associated with small-scale studies and because it helps with
understanding the situation or problem on a deeper scale it is considered to be a good tool to
handle complex situations.
Quantitative research is characterised by a formalised and structured method (Holme &
Solvang, 1995). This method attempts to obtain numbers to help explain events, thereby the
conclusions are founded on data that can be quantified. In this approach, there is a relatively
high degree of control from the researcher, who is impartial in the study. The researcher
defines the conditions that are of interest to the study based on the stated research questions.
Being impartial is essential in order to conduct formalised analyses and make comparisons
and generalisations. Also because many objects are studied, these generalised conclusions can
be drawn despite the fact that relatively little information is collected from each object.
(Holme & Solvang, 1995)
In regards to this previous discussion I have decided to rely on a qualitative approach in this
study. The aim of this study is to provide a better understanding of how and why risk
management/Analysis is being used as at the companies studied. My aim is not to make
generalisation. Instead, by using small-scale studies I could perform a more in-depth
investigation and thus, provide a better understanding of my research area.
Research Strategy
A researcher who conducts an empirical data collection can take a number of approaches. It
all depends on the type of research questions that are being asked, the degree of focus on
contemporary events and to which extent the researcher has control over behavioural events.
The researcher can choose between an experiment, a survey, history, an analysis of archival
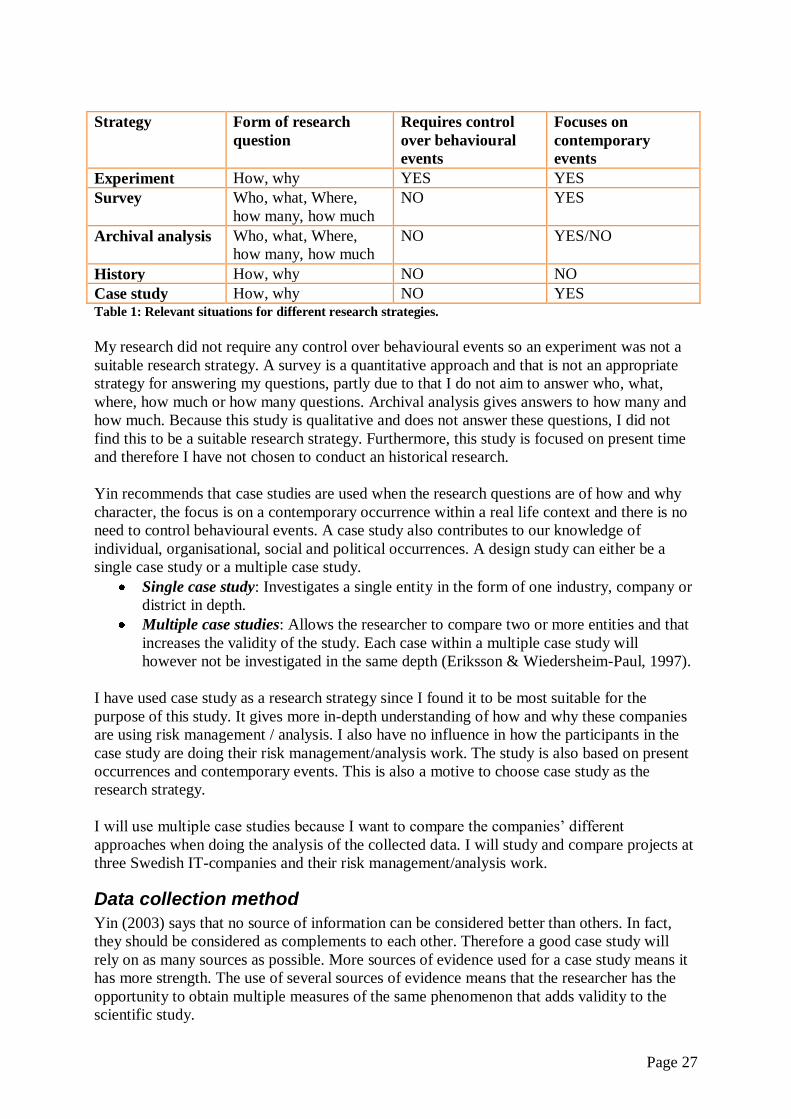
records and a case study. (Yin, 2003) These are shown in Table 1.
Page 27
Strategy Form of research
question
Requires control
over behavioural
events
Focuses on
contemporary
events
Experiment How, why YES YES
Survey Who, what, Where,
how many, how much
NO YES
Archival analysis Who, what, Where,
how many, how much
NO YES/NO
History How, why NO NO
Case study How, why NO YES Table 1: Relevant situations for different research strategies.
My research did not require any control over behavioural events so an experiment was not a
suitable research strategy. A survey is a quantitative approach and that is not an appropriate
strategy for answering my questions, partly due to that I do not aim to answer who, what,
where, how much or how many questions. Archival analysis gives answers to how many and
how much. Because this study is qualitative and does not answer these questions, I did not
find this to be a suitable research strategy. Furthermore, this study is focused on present time
and therefore I have not chosen to conduct an historical research.
Yin recommends that case studies are used when the research questions are of how and why
character, the focus is on a contemporary occurrence within a real life context and there is no
need to control behavioural events. A case study also contributes to our knowledge of
individual, organisational, social and political occurrences. A design study can either be a
single case study or a multiple case study.
Single case study: Investigates a single entity in the form of one industry, company or
district in depth.
Multiple case studies: Allows the researcher to compare two or more entities and that
increases the validity of the study. Each case within a multiple case study will
however not be investigated in the same depth (Eriksson & Wiedersheim-Paul, 1997).
I have used case study as a research strategy since I found it to be most suitable for the
purpose of this study. It gives more in-depth understanding of how and why these companies
are using risk management / analysis. I also have no influence in how the participants in the
case study are doing their risk management/analysis work. The study is also based on present
occurrences and contemporary events. This is also a motive to choose case study as the
research strategy.
I will use multiple case studies because I want to compare the companies‘ different
approaches when doing the analysis of the collected data. I will study and compare projects at
three Swedish IT-companies and their risk management/analysis work.
Data collection method
Yin (2003) says that no source of information can be considered better than others. In fact,
they should be considered as complements to each other. Therefore a good case study will
rely on as many sources as possible. More sources of evidence used for a case study means it
has more strength. The use of several sources of evidence means that the researcher has the
opportunity to obtain multiple measures of the same phenomenon that adds validity to the
scientific study.

Page 28
Yin also says that interviews are one of the most important sources for case study information
and that documentary information is relevant in every case study. Interviews can be open
ended, focused or structured.
Open ended: The respondent is asked about facts of matter as well as their opinions
about an event.
Focused: Can still remain open ended but a certain set of questions derived from the
case study will be followed.
Structured: Follows the same lines of a formal survey.
Documents can be of many forms, paper, word (Microsoft) or pdf (Adobe Acrobat)
documents and info on a webpage being the most common. I used both interviews and
documentation in various forms that was gathered from the companies.
When I did the interviews I used an open-ended approach because I was interested in both the
facts of matter and their opinions on various subjects. It gave me more flexibility and helped
me additional information. All interviews were done in Swedish and the conceptual
framework was the guide in my discussions.
Sample selection
According to Saunders and Thornhill (2000), there are various sampling techniques that
provide a selection of methods that help the researcher with reducing the amount of required
data to collect. This is done by considering only data from a sub-group rather than all possible
cases. One sampling technique is purposive/judgmental sampling. It is a non-probability
sampling method that basically allows a researcher to select cases that seems to be best suited
to answer the research questions. This form of sampling is often used when working with
small samples, especially in a case study when a researcher is looking for cases that are
particularly informative. This is therefore the sampling technique I have chosen.
Miles and Huberman (1994) suggest that investigating contrasting cases can help understand a
single case finding, by specifying how, where and possible why it proceeds as it does. Based
on this reasoning, I have chosen to include companies of different sizes that I think differs
from each other in their view of risk management/analysis. Miles and Huberman (1994) also
say that the number of cases to include in a multiple case study depends on how rich and
complex the case analysis is. Since my research questions and conceptual framework provides
a fairly complex situation for each case, I have decided to include three cases in my study.
Data analysis
According to Miles and Huberman (1994) data analysis can be defined as consisting of three
concurrent flows of activity.
Data reduction: The process of selecting, focusing, simplifying, abstracting, and
transforming the data. It is done to help the researcher make the data sharp, sorted,
focused, discarded, and organised in order to be able to draw and verify conclusions.
Data display: Is used to organise and display the reduced data so that it will make it
easier to draw conclusions. This phase is useful when the researcher studies more than
one case, a so-called multiple case.
Conclusion drawing and verification: The researcher notes regularities, patterns,
explanations, possible configurations, casual flows and propositions.

Page 29
Yin (2003) says that data analysis involves examining, categorising, tabulating or otherwise
recombining the collected data. When a research of something is made then a general
analytical strategy should be outlined. This is to decide what to analyse and why the analysis
is made. Two general strategies are suggested: Follow the theoretical propositions that led to
the case study or develop a descriptive framework to organise the case study.
Within these two strategies there are four different techniques for analysing the collected data
can be used:
Pattern matching: This means comparing an empirical based pattern with a
predictable one.
Explanation building: Which is a kind of pattern matching where the goal is to
analyse the case study data by building an explanation about the case.
Time-series analysis: Which are repeated measures of the dependent
variable/variables so changes can be studied over time.
Program logic models: Which is a combination of pattern-matching and time-series
analysis where the analysis stipulates a complex chain of patterns over time.
In this study I will have the three steps presented by Miles & Huberman (1994) as a frame
when analysing the empirical data. My strategy is to follow a theoretical proposition that led
to the case studies. In this strategy I will use Pattern Matching because the case studies will be
compared with previous theories presented in the literature review.
Page 30
5. Data presentation This chapter will present the empirical data from the selected companies. To begin with, I will
present a background of the company and thereafter the data collected will be presented in
the same order as my research questions are presented. Thus, this chapter will include
objectives with risk management/analysis, followed by different risk management/analysis
strategies, and finally how the effects of risk management/analysis can be measured.
Company 1 - Ericsson
Ericsson is one of the world‘s biggest telecommunication companies and has its headquarter
in Kista, Stockholm, Sweden. They are about 55000 employees. Of those about half are
employed in Sweden. Ericsson is from the 1st of January 2007 divided into three business
units (BU).
Network
Multimedia
Global Services
Business Unit Network is the division where hardware like mobile, wire line systems,
transmissions and transport are made. This is still the core of Ericsson and represents the bulk
of Ericsson income. The other two business units are more focused on developing software
and services. They all use different variants of the Ericsson tool of PROPS though.
The projects I studied where within Business Unit Multimedia and the PROPS variant used
was iPROPS.
Objectives with risk management
At Ericsson they state that Project Risk Management is used to ensure that risks and
unplanned events do not jeopardise the successful completion of the project. They use two
perspectives on risk management, the human perspective and the business perspective. The
project method they use, iPROPS, directly states that the project that has the best control over
its risk is the project with the greatest chances to reach its goal as planned.
Human perspective
At Ericsson each and every project is seen as a unique, non-recurrent operation that is
performed by a temporary organisation (iPROPS). With this view and prerequisites a project
at Ericsson is by definition uncertain and contains risks from the start.
In a human perspective Ericsson wants Risk Management in projects to be an attitude and a
state of mind that is supported by the structured approach of iPROPS (2006). Their goal is to
involve all project members in the different aspects of risk management. By doing this they
get a better understanding about the plan for the project and becomes more committed doing
their assignments. They also do this to create an awareness about the risks contained in the
project plan. Getting everyone onboard when it comes to risk management will create a
common view on the project and also prepare the project members that future changes in the
plan and organisation can be necessary. It will also stimulate their openness to opportunities
and make them fully committed to their assignment.
Ericsson‘s aim of risk management for the project members is to stimulate them to constantly
search for solutions to problems and to promote an innovative climate (iPROPS, 2006).

Page 31
Business perspective
From a business point of view risks are events that could reduce the business value of a
project (iPROPS, 2006). That means that Risk Management is one of the project managers
most important and challenging responsibilities and something he has to focus on and carry
out in a structured way.
The primary risk taker for the project is the project sponsor who also is the one who has the
commercial responsibility for the project and its outcome. It is up to the project manager
though to encourage all project members to see that different risks influence the business
values of the project. The project members should try to constantly identify and report all the
risks that can have an impact on the business value of the project. It is them who often see that
a particular solution that looked good on paper and in the planning turned out to be very hard,
if not impossible to implement in practice later. It is not only up to the project members to
identify and analyse risks but all stakeholders have to their little part, this will help in
eliminating many risks caused by misunderstandings.
Risk Management strategy
At Ericsson the risk management process is an ongoing process, however most of the work on
the risk analysis is spent in the beginning of the project. The risk analysis plays an important
role in the different toll-gates (TG) where a decision is made if it is possible for the project to
reach its goal considering the prerequisites it has been given.
Figure 6: PROPS different Toll-Gates.
Risk Management Planning
The first step is the Risk Management Planning phase, it is performed during the prestudy
phase, and in iPROPS-terms that is also called the Project Analysis Phase. The Risk
Management Planning is together with other activities one of the inputs for the TG1 decision.
TG1 or tollgate 1 is where they classify if a project is feasible or not. Risk Management
Planning is also used as basis for the risk identification, risk analysis and risk response
planning. The purpose of this risk management planning is to ensure that the level and type of
risk management are commensurate with both risk and importance of the project
organisation. This means at Ericsson that this is where the projects decide how risk
management will be handled during the project. This planning is also used to identify the
most important risk areas, on a very broad scale and analyse them; finance, resources
technology, competence, culture, health and security, physical environment, uncertainty in
budget and schedule, etc. This means that it is up to each project to define how the risk
management process is performed adapt it to the specific needs of that project. That usually
means identifying the roles and their responsibilities, methods and tools to use and also plans
the risk management activities in the project. For a small project with a short timeframe it
could mean that there will be few risk management activities and that the project manager

Page 32
performs all of them. For a large project there can be a full-time role of e.g. a project risk
coordinator who performs daily risk management work.
Risk Identification
The second activity is Risk Identification, it starts a bit into the Project Analysis Phase, after
the Risk Management Planning and over the whole project planning phase and acts as one of
the inputs for the TG2 decision. The purpose of this phase is to identify which risks might
affect the project (iPROPS, 2006). Ericsson sees risk identification in iPROPS as an iterative
process and the first step of the risk assessment cycle. They use risk identification workshops
that if possible should have these participants: project team, people with experience from
similar projects, experts on different areas, end users, stakeholders and outside experts. There
is often an experienced project manager taking part in the workshop, someone that have
worked on similar projects before and know what to expect. They can use their experiences
from earlier similar projects when it comes to e.g. where the projects resources are most thin
and how likely it is that the budget will hold. There is also almost always a software architect
that have the expertise when it comes to what kind of technology and competence that will be
needed etc.
The risk identification itself is done with focus on a few areas at a time. This is to promote a
more focused approach. The risks identified are things like uncertain estimates of e.g. man-
hours or certain people in exposed roles that are hard to replace should they quit or be sick.
When a risk has been identified its description should be as specific as possible, that will
make it easier in the Risk Response Planning. All members of the project are of course
encouraged to identify the risks they see.
The project identifies something Ericsson calls Risk Triggers. Risk triggers are early
symptoms or warning signs of risks that are about to occur. Failure to meet an intermediate
milestone is a sign of an impending delay of the project. Lack of motivation is another where
slow status reporting and delays are early symptoms.
Risk analysis
The risks identified are used as inputs for the Risk Analysis phase. The risk analysis starts in
the project planning phase. It also acts as an input to the TG2 decision. Ericsson uses both
qualitative and quantitative analysis to assess identified risks. The tool recommended for
smaller projects is called Minirisk and is a qualitative risk analysis tool. It is a very simple
method that does not take too much time to perform and is also recommended to make quick
assessments during or late in the project. Figure 7 shows a suggestion from Ericsson of how
to perform the Minirisk analysis.

Page 33
For larger projects Ericsson recommends the use of Quantitative Risk Analysis. That does not
mean the two types cannot be used together though. The method used for Quantitative Risk
Analysis is the Successive Principle method. Due to the effort investment it is not
recommended for use in projects with a budget under $1 million. The focus of successive
principle is to remove as many uncertainties as possible to get a better total understanding of
the project in terms of risks and opportunities. The investment is quite high because it requires
a two-day workshop with all stakeholders involved as well as an objective external facilitator.
The outcome from a Risk Analysis at Ericsson should be a list where the prioritised risks are
described.
List all risks
Calculate the risk
values
Give value for the
consequence
Cover the P value
Give value for
probability
Go through all risks
Action plan
Identify prioritized
risks
Describe the risks very clear!
(15 minutes)
Everyone must understand the risk
Group similar risks - headings
(45 minutes)
P=1 small; P=5 very high
(15 minutes)
C=1 mild; C=5 very serious
(10 minutes)
R=P*C
BREAK!
(10 minutes)
Introduction Describe the purpose of the Analysis
(5 minutes)
Does everyone agree?
(10 minutes)
Suggest actions that will minimise or
eliminate the risks with highest R-value
(10 minutes)
Figure 7: Minirisk example

Page 34
Each risk on the list is defined through:
Risk identifier
Risk description
Triggers
Risk probability and consequence
Numerical measurement of impact (from risk quantification)
Suggest action:
o Threat to respond to
o Threat to accept and who made the decision to do so.
Risk-response Planning
At Ericsson the Risk-Response Planning is the third step in their risk assessment cycle. Risk
Analysis is the second step and usually starts a bit before the Risk-response Planning. The
outcome from Risk Analysis, a list with prioritised risks, is often used as input for the Risk-
response Planning, most of the time these two are done side by side with each other. They are
both done in the feasibility phase and both are inputs for the TG2 decision.
Ericsson uses these five response categories:
Avoidance: Often means changing the project specification to avoid that risk.
Transference: It does not remove the risk it just moves the consequence of the risk to
a third party.
Mitigation: Take action to reduce the probability for a risk to occur. The cost for
mitigation should not be higher than the estimated impact of the risk
Acceptance: If the project has chosen not to change the project specification or if the
project is unable to find a suitable response to the risk.
Ignore: If the risk is unlikely to occur or if its impact is less than mitigating it then it
can be seen as ―safe‖ to ignore the risk. It should still be documented however.
Each response action should be documented as well as why the action has been chosen. There
should be the name of the person responsible for the implementation of the response action,
the risk response owner and a completion date.
The risk response planning also serves as an input to the budget work, because all project
plans should include a buffer for unforeseen events and cost for those response actions.
Risk Monitoring and Control
Risk Monitoring and Control is done in the Project Execution Phase. In iPROPS the project
execution phase spans over the establishment, realisation and hand-over phases and the three
tollgates TG3, TG4 and TG5. The Risk Monitoring and Control process is where the project
keeps track of the identified risks, monitoring the remaining risks and identifies new risks
(iPROPS, 2006).
Since iPROPS is an iterative process where scopes and processes change it also means that
the effects of these changes must be analysed and considered. That falls under the Risk
Monitoring and Control part of the project.

Page 35
The monitoring part is an on-going iterative process during the whole execution phase to keep
track of changes in risk, new risks that develop, monitor the remaining risks and remove risks
that disappear from the risk list.
There are several levels of risk that should be monitored. The project sponsor who is
financially responsible and the primary risk taker for the project should monitor the business
risks of the project. The project manager has a responsibility for the projects outcome and for
fulfilling its requirements. The project members also have a responsibility for monitoring and
controlling risks related to their own areas of responsibility and assignments in the project.
The Control part is how risks are handled that do occur and what to do with new risks that
have been identified or risks that have changed. The handling must be done according to
agreed routines and results in change requests. The change requests handling is done in a
change control board meeting (CCB meeting) where the project manager together with system
management, like architects, sponsors etc. discuss what to do about the change in scope for
the project.
Effects of Risk Management
In my research I could not find that there is any documented way of evaluating the work with
risks at Ericsson, however in my investigation compared their work with Paul Jones (Roberts,
2006) five forces.
The first one is Proof of precedent and at this department in Ericsson they use iPROPS.
iPROPS is a newer variant of PROPS that is a project model that have proven its high quality
at Ericsson and is now used by many other companies and organisations. Risk analysis and
management is an important part in every stage leading up to a tollgate in iPROPS. Projects
that have used a PROPS-model, several thousand according to Ericsson, often have shown to
be successful it has also been adopted by other firms, mostly in Sweden.
The second one is the Proof of integration. iPROPS is very tightly integrated in all of
Ericsson‘s work, whether it is developing hardware or software or a project for maintenance
or sales. iPROPS is the model taught to everyone, from managers high up in the organisation
to the people working ―at the bottom‖, in various detail and from various point of views of
course. If one wants to see a proven working implementation you can pick many projects at
Ericsson. The ones that have failed cannot be attributed to the model itself, but have failed
due to other factors.
The third one is the Proof of ROI. It is hard to measure if the method Ericsson is using saves
them money. They only use one method with slight variations at Ericsson for running
projects, PROPS, therefore it is hard to see if another way of working would be better. When
it comes to risk management it is even harder to measure the ROI. The projects I have studied
have not used a system, like Key Performance Indicators, to measure the success of the risk
management work. Because of that it is hard to measure the risk management work in the
project. The level of success for a project at Ericsson is only measured in how well they
completed on time and within budget and how well the product the project produces is selling.
The projects I studied were never completed on time, the first time-plan never held and they
had to put forward the first delivery of the product to their customers.
The fourth one is the Proof of policy. iPROPS is very detailed in what processes that should
be done in the project and when and by whom. The model itself does not provide the tools for

Page 36
doing risk management, but Ericsson suggests and supports several that can be used. Like
Minirisk or the Successive principle for the Risk Analysis.
The fifth and last one is Proof of concept. The iPROPS method and its risk management and
analysis stages are very detailed but on a quite high level, that means that they can scale from
very small projects to very large ones, with hundreds of members spanning several
organisations and geographical locations. The department I worked in had a unit working in
Coventry, England and during the different projects the distance and dividing of the work
never proved a problem for the risk management and risk analysis work.

Page 37
Company 2
Company 2 wished to remain anonymous and is therefore called C2 in the future.
C2 is, by Swedish measures, a medium sized it-consultant company. The company was
founded in 1988, but have grown rapidly during the twenty-first century. In 2006 they were
acquired by a Norwegian firm but act as a free-standing daughter company on the Swedish
market. They are today 500+ employees in Sweden.
The person I interviewed works at the office in Gothenburg on a small project in terms of
people involved, with only three developers. The project is in phase one, which is on 1600
man-hours and will probably go on to more phases where it is not impossible that it will grow
in terms of people and other resources.
The goal of the project is to develop a content and process control system for documents, the
client is a big industrial firm in Sweden. It will help them store, manage and deploy all types
of content including web, graphics, multimedia and traditional documents like word, excel,
pdf etc.
Objectives with risk management
C2 uses something they call PMT or Project Managers Toolbox. PMT is used by the project
managers in all types of projects. The toolbox consists of tools to help with e.g. calculations
or planning. There are also templates in the toolbox for all types of situations like protocols or
the risk list. Finally it also contains what they call guidelines that contain the models for e.g.
project steering, project planning and risk handling.
C2 sees risk identification as essential in the start up of the project. There are several reasons,
one is to see if there are items in the scope that e.g. cannot be finished on time or is outside
the skills of the project. This so they can change the scope together with the customer.
Another reason is that everyone in the project should understand the risks and help identifying
them. Therefore they include as many from the project as possible in the risk analysis.
Risk identification is seen as an important part when they reach their different milestones.
This so they can see if there are any new risks that need to be highlighted. The risk list is re-
examined too, to see if there are risks that can be removed or risks that need to be reassessed.
C2 sees it as essential to identify and assess all important risks so that they can reduce them.
If the risks cannot be reduced in time it might mean that they will not finish the project in
time. Since the customer has paid for a certain amount of man-hours often the extra time
needed in a project is non billable.
Risk management strategy
Risk identification
At the start of the project the developers together with the stakeholders had a round table
meeting. At the meeting they had a type of brainstorming where as many risks as possible was
identified.
When the project starts it is up to the developers to identify risks that can affect the
progression of the project. There are no formal meetings where risk identification is done;

Page 38
they are done in the day to day development work. That means that as soon as the developer
sees a risk he highlights it for the project manager.
Risk assessment
The risk list produced at the round table meeting is then assessed, often it is done immediately
after the risk identification, especially if it is a small project with few people involved. The
grading is very simple, if the impact is big enough and not unlikely to occur it is considered
critical. It is the project managers‘ responsibility to reduce these risks.
C2 use both qualitative and quantitative analysis. They first start with qualitative analysis and
the aim is to rank the risk and identify the risks that matter the most. This is then followed by
a quantitative analysis where the goal is to quantify the effect of the most important risks
identified in the qualitative analysis. The reason is to see what risks they should focus on.
The risks identified by the developers during the project are assessed in a similar way. The
developer together with the manager analyses the risk. If the risks are recognised as critical
they take immediate action on it. If risks are not recognised as critical they are tolerated for
now and most of them get into the normal project management plan as tasks that should be
completed.
Risk reduction
The round table meeting often leads to a change of scope for the project. It can be that they
see that there are not enough resources to finish certain targets within the project time-plan. If
that is the case these targets are removed from the scope, for example from phase one to phase
two. Not always easy though since the customer of the project has ordered a functionality that
he may not get. This is their most common response, to add more resources, at least in terms
of personnel is not very common in their projects. Actions with e.g. documentation to be used
if a developer leaves are almost nonexistent. They are aware of this risk but take no actions to
reduce it.
Risk reduction is often training, when a new project starts it can be that the people available
have some gaps in their knowledge for this project. Then they get the proper training before
the project starts, it is also seen as an investment for the future. Normal risk reduction like
more personnel is harder though, since they are a consultant firm that has agreed on creating
some functionality for a customer within a fixed set of man-hours.
Many of the risks identified by the developers during the project are accepted, at least for the
moment. These risks often do get into the project management plan though as something that
should be fixed within the normal project development.
Being a software company they have the choice to develop certain parts of the product
themselves or buy them from a third party. C2 have chosen to build most of their software
developed for the customer on industry standard products, either by buying or using free
software. This means they can start working much faster, have access to good documentation
and can get good support. Support can be software patches, support from a manufacturer,
support from user groups on the internet etc. New functionality however is almost always
developed in house. Sometimes an expert is contracted to help the team when they do not see
the benefit or have the time to train their own staff.

Page 39
The effects of risk analysis/management
At C2 there is no documented way of evaluating the work with risks, they are using what I
call ―ad-hoc‖ risk analysis. I used Paul Jones (Roberts, 2006) five proofs when I investigated
the effects of their risk management work.
The first one is Proof of precedent. The methods from the PMT are used for all projects at C2.
These methods have been used for some years now and they feel that those methods are
working for them. PMT is also a product where they sell either consultants with expert
knowledge in PMT to help as project managers, test leaders etc or sell the methods and tools
included in PMT directly to customers.
The second one is the Proof of integration. All project managers at C2 should have taken
training in PMT and how C2 implements them before they start managing projects. All
projects at C2 use PMT and risk analysis is a part of the toolbox integrated with their other
methods. PMT has been used for some time now and they have and have had several
successful projects using the toolbox.
The third one is the Proof of ROI. Risk analysis often helped them in changing the scope so
they could finish on time. If the project was not before the deadline it would mean that they
have to finish the project in non-billable hours. A good risk analysis is therefore very
important for them to see that they do not take on a bigger task than they can handle.
The fourth one is the Proof of policy. In the PMT there are tools and templates included.
Those tools and templates are there to support the project manager in his work on the tasks in
a project. For the work with risk analysis there is e.g. a tool and a template in the toolbox that
are supposed to be used.
The fifth and last one is Proof of concept. The project I studied was very small with only three
developers and the person I interviewed did not know of any project with more than twenty
people involved. PMT is based on industry standards though with e.g. initiation, planning,
tollgates, milestone etc. and as such they say it could probably handle a project of any size.
Perhaps they would have to tweak it a bit but all in all they saw no problem in using PMT for
any type of software project.

Page 40
Company 3
Company 3 wished to remain anonymous and is therefore called C3 in the future.
C3 is a small company that distributes film by mail as a subscriber service. For a fixed fee the
subscribers get to rent a fixed number of movies every month. The subscribers cannot get a
new movie until they have returned an old one.
The company started in Sweden 2002, in 2005 it was bought by UK‘s leading DVD rental
service business. In 2006 they merged with another UK firm and formed Europe‘s largest
subscriber service for online home entertainment with over 500 000 customers.
Today they are about 30 employees in Sweden and the Swedish office has the responsibility
for the Scandinavian business with customers in Sweden, Norway and Denmark.
Objectives with risk management
At C3 there is no formalised way in using Project Risk Management and they do not use a
model like Ericsson‘s PROPS or other project management tools. There is an awareness of
the different risks that pose a threat to their business. They do a kind of risk analysis that is
done in what I call a bit of ―ad-hoc‖ way where the methods differ from time to time, but
most of it does follow the basic principle of risk identification, assessment and reduction.
C3 is a fairly new company that has its business on the internet and therefore face some
special risks that fast growing companies often have. An ―established‖ company often has
gotten past its growth problems. As a web-business with fairly young customers they must
constantly evolve and improve to keep their leading edge over their competitors. That means
that the environment and pre-requisites are constantly changing.
They also have no formal project plan. There are many goals and plans, lots of them, but
those are spread out, some of them are on paper, some are on a whiteboard etc. Most of these
goals are not written in stone, they can be and are changed often. There is usually no specific
point in time where they should be met. Except when the goals have to be coordinated with
marketing like e.g. some features has to be ready for a Christmas campaign.
Their single most important component in their business is their webpage. No presence on the
web means no business. Therefore they have identified as their biggest risk that the webpage
for some reason is down or unreachable. That means, among other things, that whenever new
features are launched it is critical that those have been tested thoroughly. An example can be
that they launch a new feature that worked perfectly on one developer‘s computer, but when
thousands of web users use it simultaneously it stalls the entire webpage. So for C3 the main
objective of identifying risks is to identify those that pose an immediate threat to the day to
day use of their website.
There is no formal way of characterising identified risks at C2, but they can be categorized
into two different types, critical and non critical. A critical risk would be one that is not highly
unlikely and has a big impact on their business (their web page). The other identified risks
that are not ―critical‖ are put into the day to day work together with the projects other
objectives.

Page 41
When risks have been identified and assessed it is time to reduce them. At C3 it is done in a
very ad-hoc manner. When a new risk is discovered and it is assessed as critical they act on it
immediately because it can affect their business.
Risk management strategy
If you define strategy as having a plan for something the Risk Management Strategy at C3 is
non-existent. They are in no way unique for their type of businesses and can, on the contrary
join the majority of web-businesses that have grown very fast. I will however try to see if they
are using any methods for the different parts of the risk management strategy.
Risk identification
At C3 it is up to all the developers and the management team to identify the risks. There is no
formal meeting or other way where risk identification is made. Risks are identified as they
come. It can be that they notice that the time customers has to wait on the phone when calling
support increases, which can led to irritated customers or that a developer highlights that the
new function he is about to implement can have negative consequences on the business.
Risk assessment
As soon as risks are identified they are assessed. How big the impact of it will be on their
business is often the first question asked when a risk has been identified. If a risk is viewed as
business critical C2 will analyse it to see how likely it is to occur. If it also passes that test it
gets on the informal ―action list‖. This is a list that is not on paper, but everyone knew about
these risks and that they had to be fixed immediately. The other risks that do not make that list
stays as e.g. action points at the respective developer or manager.
Risk reduction
Their goal is to constantly implement new functions to keep their edge in their business. The
list of planned new functions seems to be growing constantly. When that list starts to get too
long they start the process of employing a suitable person.
Risks that are seen as critical immediately get all focus in terms of resources. The normal
development work is put aside until the risk has been removed. They also avoid critical risks,
e.g. if a new functionality is discovered to have a big negative impact on the business, then
the implementation of the functionality stops for the moment.
As a web-business there is always a risk of being vulnerable to different kinds of hacking.
Some of it are very hard to protect against like so called Denial of Service attacks or so called
social hacking. There is no meaning in buying an insurance against it since an attack like that
is unlikely and cost more than it taste. Therefore, even though risks like that would have a big
impact on their business they are considered too expensive to protect against and so unlikely
that they are accepted.
C3 have taken the decision to have their website operated at a third party web service
provider. This is a model that most web-business uses. That means that if e.g. they need to
expand the hardware or bandwidth to increase the capacity of simultaneous users the service
provider can provide that within a day. The service provider also has the means to replace
failed hardware immediately and can guarantee almost 100% uptime of the website.

Page 42
The effects of risk analysis/management
At C3 there is no documented way of evaluating the work with risks, they are using what I
call ―ad-hoc‖ risk analysis. I will try and compare how the effects of their risk management
work with Paul Jones (Roberts, 2006) five forces.
The first one is Proof of precedent and since they are not using any formal methods at C3 it is
hard to compare them to others. However their way of doing risk management/analysis are in
no way unique and one can find very successful business as well as failed ones who work in
the same ―ad-hoc‖ way.
The second one is the Proof of integration. The ―ad-hoc‖ way in which they are working
often suits small businesses that have to be flexible and often requires quick decisions.
The third one is the Proof of ROI ―Ad-hoc‖ is not a formal method and it is therefore very
hard to say if they save any money working in this way instead of going for a more formal
method.
The fourth one is the Proof of policy. At C3 there is no documentation for the risk
management/analysis work. One can say that the ad-hoc method is all about implementation
and none about documentation.
The fifth and last one is Proof of concept. It is hard to see if they can continue to use the ―ad-
hoc‖ method when they continue to grow. It is hard to find large scale projects that are proven
successful using the ad-hoc methods.

Page 43
6. Data analysis The following chapter presents an analysis of the empirical data gathered and theory from
previous research. Each research question will be analysed separately, and will show
similarities and differences between theory and the empirical data.
Objectives of Risk Management / Analysis – Research Question 1
Kendrick (2003) says that one objective with Risk Management and Analysis is Project
Justification. At Ericsson one can say that they agree with this. In their iPROPS prestudy
phase the purpose is to justify that the business idea is technically and commercially feasible.
Risk Management Planning and Risk Identification are important parts in this work, but there
are also a lot of other activities that have equal importance, like Finance Management
Analysis, Cost and Revenue Estimating, Activity Definition and more. C2 also uses Risk
Management as a Project Justification tool, for them it is a very important tool when the scope
of the project is decided. Since their services are sold to customers all their undertakings have
to be justified so they don‘t end up making work they don‘t get paid for. At C3 Risk
Management is almost never used as a Project Justification tool since they have no formal
plan or objectives.
Kendrick (2003) also says that Risk Management and Analysis can be used to Lower Costs
and have Less Chaos. I divide this into two parts the first being lower costs. Ericsson sees
risks as events that could reduce the business value of the project. One example is that all
project members are encouraged to identify and report all risks that will influence the business
value of the project to the project sponsor, who has the financial responsibility for the project.
C2 definitely uses Risk Management as a financial tool, maybe not so much to lower costs as
to keep within the budget agreed with the customer. At C3 the risk analysis can be seen as
tool to lower costs since they use it to keep their business (their webpage) available. The
second part is less chaos. For Ericsson the whole purpose of Risk Management is to ensure
that risks and unplanned events do not jeopardise the successful completion of the project.
The usage of a tool like iPROPS is in itself a way to have less chaos and control the events in
the project. Also C2 uses a tool, the Project Managers Toolbox with tools that helps the
project and project manager. C3 never mentions usages of risk management as a tool to have
less chaos in their projects.
Kendrick (2003) says that one benefit with Risk Management and Analysis is Project Priority
and Management Support. That a thorough risk plan opens doors and make resources
available. This is not entirely true at Ericsson where the door to open is TG0, passing the
prestudy phase. Whenever a project has passed that and proven that it has a business case it is
treated at the same level as all other projects. This is the same at C2, whenever there is a
signed a contract with a customer that project will not be treated any different because of a
good risk analysis. If it gets a higher or lower priority it is because of other reasons. For C3
this benefit is not valid at all since they only have one project running all the time.
The fourth of Kendrick‘s (2003) benefits is Project Portfolio Management. I didn‘t study the
project portfolio mix at the companies. However one can see that company 3 who only has
one project, their web-business, can‘t have as an objective a good project portfolio mix. It is
also hard to say that C2 has this as objective, their intention is to always do low-risk projects
where they are certain that they will make money.

Page 44
Another benefit according to Kendrick (2003) is Fine-Tuning Plans to Reduce Risks. For C2
this is definitely one of their most important objectives. The fine-tuning of their project plan is
probably their primary objective with the risk analysis. The outcome from the analysis is used
when discussing the pre-requisites with the customer, weaknesses to avoid, resources to be
added etc. It all comes down to know exactly what the pre-requisites are in order to offer a
work for a price to the customer they know they can carry out. At Ericsson all the different
parts in their Project Risk Management, risk management planning, identification, analysis,
response planning and monitoring and control serves as inputs to the different toll-gates in the
project (TG1-TG5). These toll-gates are where they see if their project plan is still aligned
with their objective and if it isn‘t they revise and tune it. Toll-gates are a core part of iPROPS
and revising and rework the project plan because of changed scope or preconditions is
therefore an essential objective to Ericsson. One can also say that this is true at C3, because
when they have identified a critical risk they change their plans. They take action to reduce
that risk immediately which can mean more resources, removal of functionality etc.
According to Kendrick (2003) Establishing Management Reserve is also a benefit with risk
management. At C3 this is not an objective at all with risk management. There is only one
project and all the resources in terms of budget and personnel go into it. However most of the
time there is no specific dates set for when functionality should be ready. Therefore one can
say that they have reserves when it comes to the time frame for their goals. It is similar at C2
where they never have aggressive goals in terms of time. One of their objectives with risk
analysis is to find weaknesses and if those cannot be removed or more resources added to
manage that risk they add enough slack in the time-plan. When the contract has been signed
however, there is no slack in the resource in terms of man-hours, e.g. they can‘t bring in an
additional developer for a couple of weeks without using these man-hours. At Ericsson it is
also hard to say that this is an objective with risk management. I couldn‘t see any reserves in
terms of time and there are certainly none in terms of personnel resources, everyone involved
is so at full time. However their project plans were always seen as feasible and not very
aggressive. They never booked resources for a new project that at the moment were working
in an on-going project. That means that if a deadline is missed they still have all resources
available.
The last of Kendrick‘s (2003) benefits is Project Communication and Control. At Ericsson
this is one of the core objectives with iPROPS (2006). They talk about the Human Perspective
and in that perspective risk management is an attitude and a state of mind. The involvement
of the project members in the risk management is seen as a way to influence them and create
an awareness of the risks that comes with the project. Risk management will create a common
view on the project and also prepare the project members for any changes necessary. They
don‘t use it as much to negotiate with the project sponsor since he almost always is internal
and takes part in the daily work and planning in the project. At C2 I couldn‘t see that they
used risk management as a way to ease project communication or build awareness of
exposures to the project team. Risk management is used as a control tool though, where they
use the risk data in their negotiations with the customer. If there are potential problems the
customer is informed about them and will try to have him pay for more resources or agree
with removal of some functionality. At C3 this was not an objective at all, they don‘t have
project sponsor who demands certain functionality to be ready on time and they have no solid
credible plan which eases project communication.

Page 45
Strategy of Risk Management / Analysis – Research Question 2
Identify risks and uncertainties
The three different companies took a very different approach to risk identification. At
Ericsson the risk identification was an iterative process but most of the emphasis is at the start
of the project. The iterative part comes mostly down to that the different project members are
supposed to report new risks that may have been identified. They have a formal way of
identifying risks with risk identification workshops. This is a type of workshop where they
use brainstorming to try and identify as many risks as possible. This way of working, where
they often use an experienced project manager as a type of facilitator and have different
experts who know different areas, can also be described as a type of Delphi Technique.
C2 uses a method similar to the one at Ericsson, where they at the start of the project sit down
in a ―round table‖ meeting. The technique they use is brainstorming to try to identify as many
risks as possible. Also like at Ericsson the project members are encouraged to identify risks
during the project phase.
C3 don‘t use any formal method or tool at all to identify risks. The risks that are identified are
done so in the day to day work.
None of the projects I looked at used tools like Cause-and-Effect Diagrams nor was Checklist
Analysis used. Assumptions analysis was used in some way at Ericsson and C2, where they
particularly looked at if the assumptions used when taking the project were correct and
sufficient.
Risk analysis
At Ericsson they use both qualitative and quantitative analysis. They recommend qualitative
risk analysis with the Minirisk method for small projects. It is also recommended for making
quick assessments in a project. For larger projects they say that the quantitative analysis
method Successive Principle is preferred.
C2 also used both quantitative and qualitative analysis when they assessed their risks. The
risks were graded into two categories, critical and non-critical. It is a very basic type of
quantification where only two values are used when quantifying risks. This is similar to the
way C3 analyses their risks where they try and investigate if it is critical for their business.
Risk reduction
Bliss (2005) suggests five different types of how to reduce risks. Ericsson with their method
iPROPS uses most of these. They avoid risks by changing the project scope. Suitable risks are
transferred to a third party, like hiring consultants etc. Risks are reduced if the cost for it is not
too high. That means that the cost for reducing the risk cannot be higher than accepting the
consequence of the risk, at Ericsson this is called mitigating risks. Ericsson has divided risk
retention into two parts, risks that are accepted and risks that are ignored. Accepted risks are
risk they consider too expensive to take action on. Ignored risks are seen as unlikely to occur.
They don‘t use risk deferral, where the cause for a risk is postponed to a future date.
C2 use a lot of risk avoidance where they change the scope of their project. Except for
training they don‘t use much risk reduction, there is for example not much backup in terms of
resources for their projects. For many of the risks that are identified by the developers during
the project, risk deferral is used. They are put in the normal project plan as actions to be

Page 46
solved at a future date. This can also be seen as a form of risk retention. Transfer of risks are
used in a way since C2 use a lot of third party products, this is however the common way to
work in the software industry. Risk transfer to a third party is not used for functionality they
have to develop themselves, everything is kept ―in-house‖.
At C3 it is vital to reduce the risks that are considered critical as soon as possible. Risks are
also reduced by e.g. make sure that they have the resources they need in terms of personnel.
Risk avoidance is also used on critical risks, where they stop implementing functionality that
seems risky. It can also be seen as risk deferral as C3 often plan to implement the stopped
functionality in the future. Risks that seems unlikely to occur or too expensive to be insured
against are accepted. They have also transferred all the risks associated with running their
webpage to a third party web service provider.
Effects of Risk Management – Research Question 3
Jones (Roberts, 2006) says there are five proofs one can use when investigating if the risk
management work is of good quality.
The first one is proof of precedent and that is the case at Ericsson, the model that is used,
iPROPS is based on their corporate standard that have been used for many years and in
thousand of projects. There are also other firms that have started to use PROPS or variants of
it. The precedent proof is very strong at Ericsson. At C2 they have been using PMT for some
years now and feel that it is working for them. It is also proven in the fact that they sell PMT
or consultants with PMT expertise to customers. For C3 their way of doing risk management
in the ad-hoc way is abundant within the software industry. It is very hard to say that there is a
proof that this is negative and for C3 it is working quite ok.
The second proof is proof of integration. Ericsson‘s use of iPROPS is tightly integrated in
their project work. It covers almost everything in a project from start to finish. All new project
managers have to learn the PROPS way of doing projects. However iPROPS does not include
any tools, they recommend tools like Minirisk or Successive Principle for risk analysis.
iPROPS is a very integrated part and the core in how Ericsson executes their projects. C2 also
use a proven method, PMT that has been used for years and is an integrated part in their way
of working. It is a method that has been used in several successful projects and its integration
at C2 is verified. It is hard to find proof of integration at C3. They use, what I call, a non
documented ad-hoc approach to risk management. A lot of similar businesses work in the
same way, but since it is an undocumented approach it is impossible to say it is a proven
method with working implementations.
The third of Jones (Roberts, 2006) proofs is proof of ROI can the companies show that their
work is saving them money? This was hard to measure at all three companies. According to
the Literature review where e.g. PMBOK (PMBOK Guide, 2004) says that properly
undertaken, risk management will increase the likelihood of successful completion of a
project in terms of cost, time and performance objectives all types of formal methods have the
economic advantage. Therefore one can say that Ericsson and C2 have benefits from PROPS
and PMT respectively. However implementing tools and methods doesn‘t come for free and
at C3 it will probably drain resources from their normal daily operations.
Number four in Jones (Roberts, 2006) list of proofs is proof of policy. For C3 this is not valid
at all, they don‘t follow any formal methods, use any risk management/analysis or document
their work. iPROPS used by Ericsson and PMT used at C2 on the other are methods used by

Page 47
the projects in helping them with their routines. In PMT there are also tools and document
templates for the project manager to use in the different parts of the projects.
The last of Jones (Roberts, 2006) proofs is proof of concept. Are their methods only fine
words on paper or do they actually work for them? Again this is not feasible for C3 since they
don‘t use any formal methods. Ericsson have shown that their PROPS ―concept‖ is proven, it
is now commonly used by the company, from small projects to very large ones all over the
world. It is also adapted to suit Ericsson‘s needs with many of their tools. At C2 they only
have small projects today with a maximum of twenty people involved. PMT worked very well
under those circumstances and if they were to take on larger projects PMT is not seen as
something that would hinder them.

Page 48
7. Findings and Conclusions Based on the previous chapters I will now provide the answers to my research questions. First
I will present my findings to each research question, thereafter what conclusions I have
drawn based on the analysed data. Finally I will present the implications for management,
theory and future research.
How can the objectives of Risk Management / Analysis be described
My research has shown that there are many strong objectives for the use of Risk Management
and Analysis. The strongest objective would be the one that good Risk Management and
Analysis lays the foundation for a much more organised project with less chaos. Less chaos
means that with good risk management the probability for unwanted surprises is much less
likely. It also means that not only are risks anticipated but there is already a plan available if
they do occur. Another very important objective seemed to be the use of risk management as
a tool to fine-tune project plans. That would mean that the outcome from a risk analysis
changed the scope of the project, led to functionality being dropped or postponed or led to the
demand for more resources in terms of time, personnel and budget. Risk management was
seen at all three businesses to have an impact on the project plan. The use of risk management
as a project justification tool is also very important. If project is seen as to risky it is simply
not done.
There are also objectives that are important, but maybe not seen as the core for doing risk
management work. The objective to use risk management as a tool to lower costs is one of
them. It is a very important reason but maybe not the primary one for the use of risk
management. It was also very hard to follow up if that objective had been met and that the use
of risk management had been advantageous for the project in terms of lowering costs. The use
of risk management as a tool for project communication and control is also seen as an
important benefit. Getting all members in a project having a good attitude towards risk
management helps in identifying new risks and also prepares them for changes to come.
There were several objectives with risk management that did not seem that important at the
companies I studied. One was the use of risk management as a tool to have a good product
portfolio mix. None of the companies mentioned this as a benefit and of the projects I studied
this was never a reason for their existence, they simply had a good business case. Another
benefit that did not seem so important was the use of risk management to establish a
management reserve. Having a reserve was seen as something useful but all projects I studied
did not have it, at least not in terms of personnel. All the companies I have studied wanted
their project members to have a full-time commitment. The only reserve that seemed as an
important objective was the use of risk management to add some space in the time-plan for
unforeseen events. The last objective, using risk management as a tool to get management
support was also not seen as important. As soon as a project had a business case and all the
resources located it had the same attention as other projects.
From these findings I conclude that
Risk management is seen as an important tool when defining the project scope.
Risk management prevents chaos further on in the project.
The number of risks identified and having a plan for what to do about them is the
measure for a successful risk management work.

Page 49
Risk management can reduce costs, it is not something that is measured and followed
up on though.
Risk management is not seen as a tool to base a product portfolio on.
Risk management is not used to gain the attention of system management, the project
should already have their full attention.
How can the strategy of Risk Management / Analysis be described
All three companies had different strategies. With Ericsson and C2 basing theirs on
documented methods C3 used a more ad-hoc strategy.
I found that all companies used some sort of risk identification. Both Ericsson and C2 used
risk identification at the start of the project. The preferred method at both of these companies
was brainstorming where the whole project participated. All of the three companies
encouraged the project members to identify risks during the project. At Ericsson this was
called an iterative process.
When it came to analysing the risks different techniques were used. For the analyse itself both
Ericsson and C2 had a formal way of doing it. They both used quantitative and qualitative risk
analysis. Ericsson also recommended the use of risk identification tools like Minirisk and
Successive Principle. C3 used a more informal way where they assessed the risk as soon as it
was raised by someone. The outcome from the risk analysis was quite different as well.
Ericsson used a very detailed risk list with triggers for the risk, consequence of the risk and
also if it should be responded to or ignored. C2 and C3 however were much simpler, risks
were critical or non-critical. Immediate was taken on the critical ones, while the non-critical
was put into the day to day work.
The actions taken to reduce risks were similar at all three companies. They all try to avoid
risks, often by changing the scope of the project. This is not only done in the beginning but
changing of scope can also be done during a project if it is deemed as necessary. Risk
reduction in terms of adding more personnel was not so common though, they had the ones
assigned to the project. Ericsson and C3 both use risk transfer, although very different types.
C3 uses a third party service provider that can guarantee high uptime on their website.
Ericsson uses consultants, something the two others probably see as to expensive and they
also want the knowledge in house. Risk deferral can be seen as used in a way at C2 and C3,
both put risks that are seem as non-critical into the normal project plan as tasks or action
points to be fixed at a future date. Risk acceptance seemed to be used at all three companies.
There is always a risk with developing new software. Some of the accepted risks seemed
more risky though, like not having a backup plan if an expert developer leaves the project.
From these findings I conclude that.
They are all aware that developing software is a risky type of project.
The best tool for risk identification is brainstorming.
Both quantitative and qualitative risk identification methods are used.
The most common sort of categoriing is critical and non-critical, which is a
quantitative measurement.
Risk avoidance and risk acceptance seemed to be the most used risk responses.
Risk reduction was not a common response.

Page 50
How can the effects of Risk Management / Analysis be described
The effects of risk management can be measured and evaluated in numerous ways. My
findings indicate that the two companies that used a formal approach have done so for a
number of years and it has proven successful for them. The informal way of doing risk
management as used by C3 have been described by me as an ―ad-hoc‖ way of doing things
and it is not uncommon in this industry. The ad-hoc also seemed to work very well for them.
For the ones that used formal methods these were very tightly integrated into their
organisation. That had the effect that everyone knew what to do and what was expected from
them. The informal way of working was more flexible though and decisions could be taken
much quicker with that approach.
It was very hard to see if the use of risk management provided an return of investment. None
of the companies could provide figures to prove that that was the case.
The formal methods all provided ways of working for most of the tasks a project manager has
to take. Both of them provided methods for a project from start to finish. With one of the
methods the project manager also had help from tools and templates.
Both of the formal methods seemed to scale for any type of software development project.
The one at Ericsson had proven itself in projects from small to large. The one at C2 was
promised to work on large projects as well. Both of them are based on industry standards and
have a lot in common with what e.g. PMBOK (2004) says.
From these findings I conclude that:
Doing risk management the informal way is not necessary bad, on the contrary it can
provide a small team with better flexibility and lets them take quicker decisions.
A formal way of doing a software development project is preferred when you have
large projects.
A formal way of working is also preferred when you have committed something to a
customer.
None of the companies measure the return of investment in using their risk
management method, nor do they investigate if they would be better of using
something else.
A formal method based on industry standards works in projects from small to large.
Implications and recommendations
In this final section I will present the implications and recommendations based on my findings
and conclusions. I will primarily address project managers but also others involved in
projects. I will also provide ideas for theory and future research.
Implications for project managers
When starting a new project, have the goals clearly set and bring in risk management
from the beginning. This is important, so the project knows what risks to handle and
consequently choose the right risk management method.
One person cannot identify and manage all risks in a project. In other words,
communicate the reason for risk management to all project members and involve them
in the work, especially in the risk identification parts of the project.

Page 51
Too often no one knows what the benefits of risk management are, if any, in their
organisation. For that reason a way to measure if the objectives have been met or not
have to be defined.
Every project is unique, therefore choose a structured way of working where the most
suitable methods and tools are used for the specific project.
When risks are identified at the start of the project involve members from parts of the
project. Use the method of brainstorming to identify as many as possible.
Accept the fact that all risks cannot be avoided. If the cost of avoiding it is higher than
accepting it should be accepted.
If the project is done in an environment where the pre-requisites are often changed, it
can actually be an advantage doing risk management the ―ad-hoc‖ way.
Implications for theory
The purpose of my study was to provide a better understanding of how risk management is
used at different types of projects. The study has been to some extent exploratory since I have
gained a better understanding of the area of research through gathering information.
My study has also been of descriptive nature since I, with the use of data collection have been
able to describe the objectives of risk management. I have also been able to describe the
characteristics of the strategy by describing the process, the style and the techniques. I have
also have been able to describe how the effect can be measured. The study has also been to
some extent explanatory for the reason that I have been able to draw conclusions when
answering my research questions.
The thesis has contributed to theory in terms of describing the necessities of measuring risk
management. It also showed that having no formal risk management is not necessary bad,
working the ad-hoc gives more freedom and shorter time for making decisions. This thesis
contribution to theory is based on empirical findings of the observable facts from three case
studies and can serve as a base for future research.
Implications for future research
The study investigated some of the effects of coaching, it would however be
interesting to see how you can measure the return of investment (ROI) of risk
management.
It would be interesting to see this type of study on more companies in the IT-sector in
order to see a potential trend. Then it is also possible to see if the findings in this thesis
can be generalised.
The thesis was limited to IT-companies in Sweden, it would be interesting to compare
these results with business cultures from all over the world

Page 52
Reference list Bliss Z. (2005) Risk Management and Contingency Planning Available at:
http://ahds.ac.uk/creating/information-papers/risk-management/index.htm (Accessed: 02 mar
2007)
Brandon D. (2006), Project Management for Modern Information Systems, IGI Publishing
Carr H., Rainer Jr. R.K. & Snyder C. (1991), ‗Risk analysis for information‘, Journal of
Management Information Systems, 8 (1), pp. 129-147
Chapman C. & Simister S. (2004). The PRAM process Project Risk Analysis and
Management Guide, 2nd Edition. APM Publishing Ltd.
Denscombe M. (1998), Forskningshandboken - för småskaliga forskningsprojekt inom
samhällsvetenskaperna, Studentlitteratur.
Dinsmore P. & Cabanis-Brewin J. (2006), The AMA Handbook of Project Management,
Second Edition, AMACOM
Doernemann H. (2002),‘Tool-Based Risk Management Made Practical‘, Joint IEEE
International Requirements Engineering Conference (RE'02), p. 192
Dorfmann & Mark S. (1997), Introduction to Risk Management and Insurance (6th ed.),
Prentice Hall
Emmet R. (2002) Biography of Frank Hyneman Knight (1885-1972) Available at:
http://www.econlib.org/library/Enc/bios/Knight.html
Eriksson L. & Wiedersheim-Paul F. (1997). Att utreda, forska och rapportera, Liber
Ekonomi.
Frosdick S. (1997) ‗The techniques of risk analysis are insufficient in themselves‘, Disaster
Prevention and Management, 6 (3), pp. 165-177
Heldman K. (2005) Project Manager's Spotlight on Risk Management, Sybex
Holme I. & Solvang B. (1995), Forskningsmetodik: om kvalitativa och kvantitativa metoder,
Studentlitteratur.
Kendrick T. (2003) Identifying and Managing Project Risk: Essential Tools for Failure-
Proofing Your Project. AMACOM
Kerzner H. (2003) Project Management: A Systems Approach to Planning, Scheduling, and
Controlling, Eighth Edition, John Wiley & Sons
Westland J. (2006), The Project Management Life Cycle: Complete Step-by-Step
Methodology for Initiating, Planning, Executing & Closing a Project Successfully, Kogan
Page

Page 53
Lewis P. & Wong L. (2005), Accelerated Project Management: How to Be the First to
Market, Wong McGraw-Hill
McConnell S. (1996), Rapid Development: Taming Wild Software Schedules, Microsoft Press
Miles M. & Huberman M. (1994), Qualitative Data Analysis: An Expanded Sourcebook.
Thousand Oaks: Sage Publications, Inc.
Mobey A. & Parker D. (2002) ‗Risk evaluation and its importance to project implementation‘,
Work Study, 51(4), pp. 202 – 208
Patel R. & Davidson B. (1994), Forskningsmetodikens Grunder; att Planera, Genomföra och
Rapportera en Undersökning, Studentlitteratur.
Pennock M. & Haimes Y. (2001). ‗Principles and Guidelines for Project Risk Management‘
Systems Engineering, 5(2), 89-108.
Pinto J. , Cleland D. & Slevin D. (2003), The Frontiers of Project Management Research,
Project Management Institute
Reynolds P. (1971), A Primer in theory construction, MacMillan Publishing.
Richman L. (2002), Successful Project Management, Second Edition, AMACOM
Roberts P. (2006), How to evaluate risk management solutions Available at:
http://www.infoworld.com/article/06/06/19/79056_25FEriskmgmtsolutions_1.html
(Accessed: 09 feb 2007)
Saunders M., Lewis P. & Thornhill, A. (2000). Research Methods for Business Students.
Second edition. Pearson Education Limited.
Schuyler J. (2001), Risk and Decision Analysis in Projects, Second Edition, Project
Management Institute
Smith P & Merrit G. (2002) Proactive Risk Management, Productivity press
Smith P. & Reinertsen D. (1998) Developing Products in Half the Time, 2nd Edition, John
Wiley and Sons
Taylor J. (2004), Managing Information Technology Projects: Applying Project Management
Strategies to Software, Hardware, and Integration Initiatives, AMACOM
Yin R. K. (2003). Case study research - design and methods. Third edition. Thousand Oaks:
Sage publication.
Whitten N. (2005), Neal Whitten's No-Nonsense Advice for Successful Projects, Whitten
Management Concepts
Wideman R. M. (1992.) Risk Management, A guide to Managing Project Risks &
Opportunities, Project Management Institute

Page 54
Ericsson (2006) iPROPS – the PROPS application for R&D R2D Ericsson
A Guide to the Project Management Body of Knowledge (PMBOK® Guide), Third Edition
(Project Management Institute), 2004
http://www.jisc.ac.uk/proj_manguide15.html (2006) (Accessed at: 18 June 2006)
http://en.wikipedia.org/wiki/Time_to_market (2006) (Accessed: 8 June 2006)
http://en.wikipedia.org/wiki/Project_management (2006) (Accessed: 6 June 2006)
http://en.wikipedia.org/wiki/Risk_management (2006) ( Accessed at: 31 nov 2006)