Embed Size (px)
Citation preview
1
1
2
Risk Perceptions of Environmental Hazards and Human Reproduction: A Community 3
Based Survey 4
5
6
Dr Ashley Shepherd*, School of Nursing, Midwifery and Health, University of Stirling, Stirling, 7
Scotland, FK9 4LA, tel: + 44 (0) 1786 466334, fax: + 44 (0) 1786 466333, 8
email: [email protected] 9
10
Dr Ruth Jepson, Centre for Public Health and Population Health, University of Stirling, Stirling, 11
Scotland, FK9 4LA 12
13
Prof Andrew Watterson, Occupational and Environmental Health Research Group, University of 14
Stirling, Stirling, Scotland, FK9 4LA 15
16
Dr Josie MM Evans, Centre for Public Health and Population Health, Epidemiology Research 17
Programme, University of Stirling, Stirling, Scotland, FK9 4LA 18
19
*Corresponding Author 20
21
Key Words: Reproductive Health, Environmental Health Hazards, Public Health, Risk 22
perception 23
2
Abstract 24
Objectives: We have investigated the Australian public‟s perceived risks on human reproductive 25
health from a number of identified environmental hazards. 26
Methods: A sample of 1261 subjects were interviewed. This interview included specific 27
questions related to perceived risks of certain environmental hazards to human reproductive 28
health. 29
Results: Women were almost twice as likely to rank all hazards as harmful or very harmful to 30
human reproduction than men. Age also influenced perceived risk with those in the 35 and older 31
age groups more likely to rank lead as a harmful hazard when compared with the 18-34 group. 32
Pesticides were identified by 84.5% of the sample as the most harmful environmental hazard to 33
human reproduction. 34
Conclusions: Similar to other environmental hazards, different groups of people in the general 35
population perceive hazards relating to reproductive health differently. This information is 36
important for both policy makers and health professionals dealing with reproductive 37
environmental health issues. 38
39
3
Introduction 40
Environmental health is an area of growing concern due to major global environmental changes 41
and an increase in established links between a number of diseases and environmental exposures. 42
Children and the developing fetus are known to be particularly vulnerable to the impact of 43
environmental pollution [1] and as such, the European Environment Agency (EEA) [2] and the 44
World Health Organisation (WHO) [3] have highlighted this as a high priority which warrants 45
further research. 46
47
Established risks for the fetus that relate to life circumstances and so-called lifestyle factors 48
include smoking and second hand smoke, alcohol and other licit and non- licit drugs, and physical 49
exercise linked to factors such as obesity [4, 5]. These might be viewed as „social environmental 50
risk factors‟ where data are often extensive and research has been conducted in some instances 51
for decades. Greater uncertainty and doubt exist about what could be described as non-personal 52
environmental risk factors and their impacts generated not by choices but by activities external to 53
and usually beyond the control of individuals. These are the focus for our paper. They may also 54
often involve complex inter-actions and long term, low level exposures and reviews flag both the 55
established risks and new potential hazards during pregnancy that may involve a range of 56
environmental factors. 57
58
The effects of exposure to environmental toxins especially for pregnant women were propelled 59
into the public domain in the 1960s with events such as the poisoning of Minamata Bay by 60
mercury dumped by a plastics company [6]. Infants born to mothers who had consumed 61
4
contaminated fish from the bay developed a number of problems including cerebral palsy, 62
developmental delays, central nervous system damage and blindness. 63
64
Environmental health hazards affecting human health are most commonly classified as chemical, 65
biological, physical, mechanical and psychological. These can be naturally occurring hazards (for 66
example radon in drinking water) or constructed (for example pesticides on food) [7]. Although 67
exposure to chemicals at critical periods of susceptibility in utero may result in lifelong adverse 68
health effects, the effects of many of these environmental toxins to the developing fetus are 69
unknown [7]. Pregnant women are exposed to environmental factors such as air pollution, 70
pesticides, domestic and commercial chemicals and radiation through their place of work, their 71
home or their local environment. In 2005 a number of reports relating to exposure of babies to 72
contaminants through cord blood provoked further interest in the link between environmental 73
exposure and child health [8, 9]. A recent survey in the United States concluded that virtually all 74
pregnant women carry multiple chemicals within their bodies. Interestingly, some of these 75
detected chemicals have been banned since the early 1970s and others are used commonly in 76
personal care products or non-stick cookware [10]. 77
78
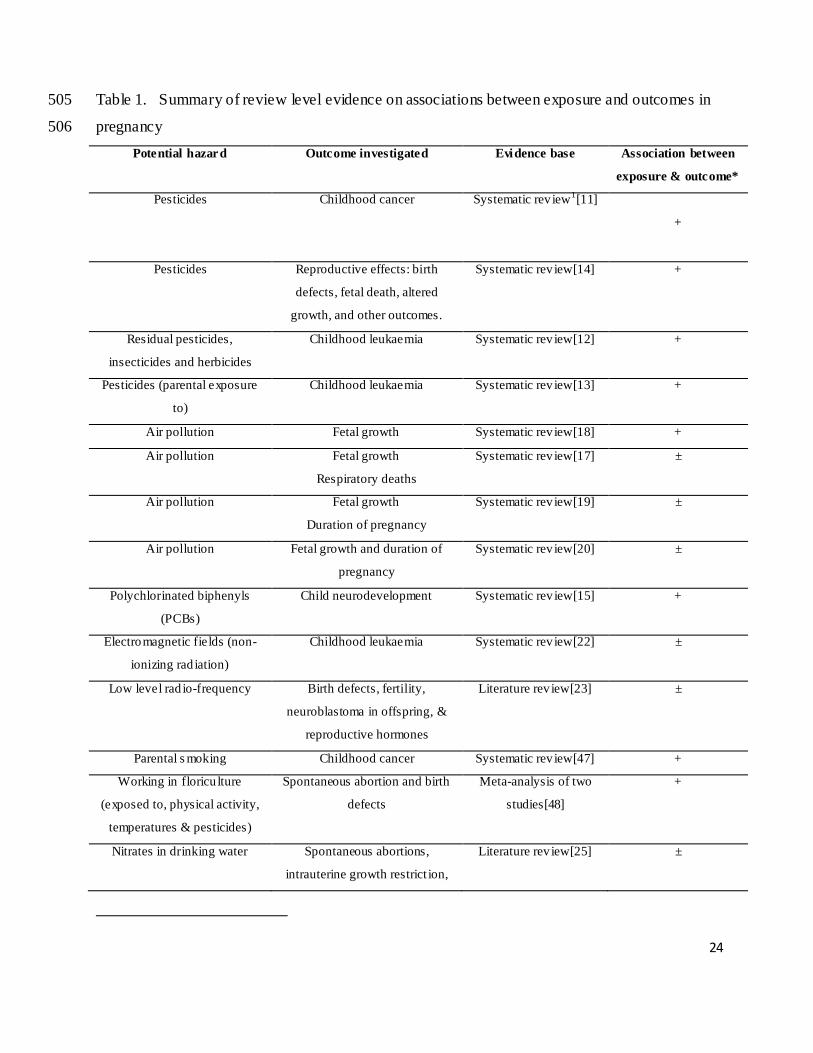
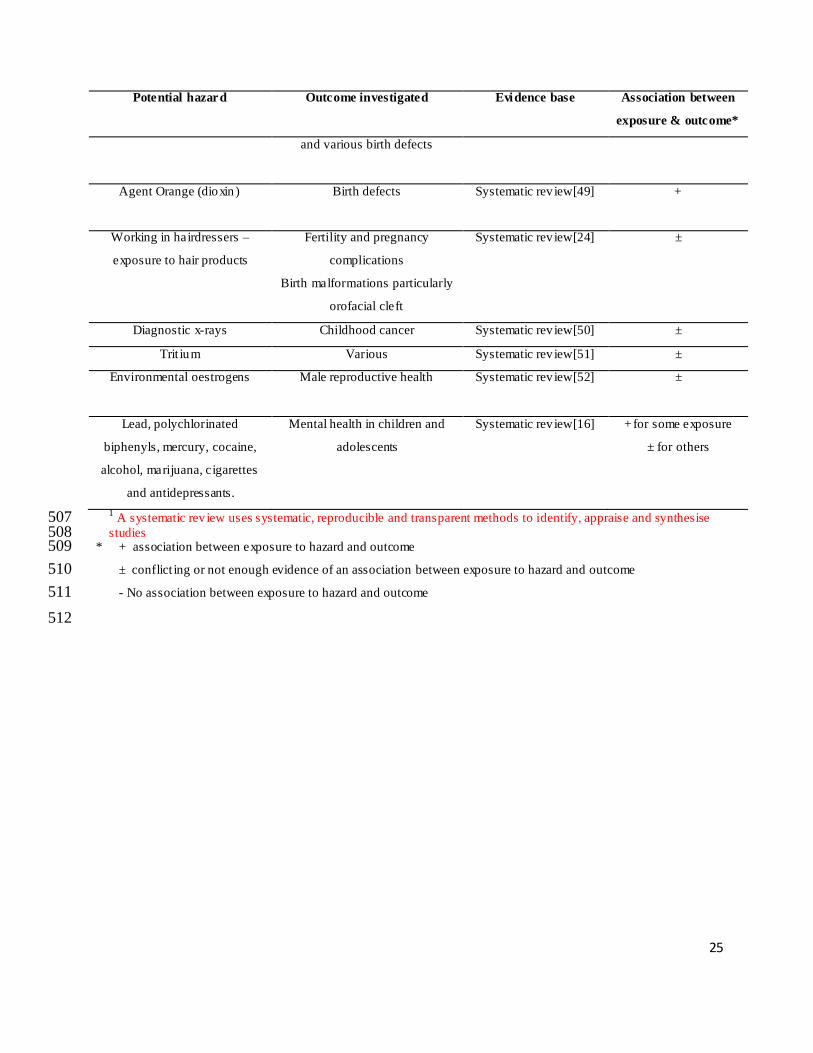
A number of systematic reviews (literature reviews using systematic, transparent and reproducible 79
methods) have examined the evidence on the associations between prenatal exposure to 80
environment hazards and adverse effects on children (see Table 1). There is evidence that 81
parental exposure to pesticides is associated with cancer in children [11-13] particularly 82
childhood leukaemia [12, 13]. Exposure to pesticides is also linked to several other cancers, birth 83
defects, fetal death and altered growth [9, 14]. Exposure to polychlorinated biphenyls (PCBs) 84
5
can have a subtle effect on childrens neurodevelopment [15] and lead and PCBs can affect brain 85
development, behaviour and reproduction at very low levels [16]. There is also evidence to 86
suggest a causal relationship between air pollution and fetal growth but the association is small 87
and it is difficult to determine which particulates are most harmful [17-20]. However, there is 88
equivocal or conflicting evidence on the associations between effects on the fetus and diagnostic 89
x-rays [21], non-ionizing radiation [22], low level radio-frequency [23], exposure to hair products 90
[24], and nitrates in drinking water [25]. 91
92
The public perceptions and attitudes towards risk and risk reduction are central to the „new‟ 93
public health [26]. There is an increasing emphasis on both public health and health promotion 94
bodies to avert risks of disease, particularly in high risk populations or where large populations 95
may be exposed. Risk discourse in public health can be separated into various perspectives 96
including: risk to health as a result of individual lifestyle choices and environmental hazards such 97
as pollution and toxic chemicals [27]. Ulrich Beck first used the term „risk society‟ in the 1990‟s 98
[28] and he viewed risk as a product of late modernity, whereby human progress and human 99
development have produced more and more hazards which threaten the ecosystem and human 100
health. His statements about risk mainly focus on external hazards and dangers (e.g. pollution 101
and global warming). For Beck, modern society changed fundamentally from a society 102
characterised primarily by social inequalities (such as income) to a society where (although such 103
inequalities remain), the chief threats are environmental hazards which cut across traditional 104
inequalities. He specifically identified the different responses of the scientific community and 105
the public to risk and observed: „scientific rationality without social rationality is empty: social 106
reality without scientific rationality is blind‟. He further noted that: „Social movements raise 107
6
questions that are not answered by the risk technicians at all, and the technicians answer 108
questions which miss out what was really asked and what feeds public anxiety‟ [28]. 109
110
Whilst it is commonly accepted that dangers and hazards do exist, they are not necessarily 111
viewed equally by the public. However the public's concerns about risks cannot necessarily be 112
attributed to ignorance or irrationality. It has been maintained that risk has generally been 113
discussed through a „paradigm of rational choice‟ and to consider risk assessment independent of 114
culture is useless [29]. Research has also shown that much of the public's reactions to risk can 115
be attributed to how they respond to hazards in terms of technical, social and perceptional 116
elements that are not normally well addressed in risk assessments [30]. 117
118
There is relatively little research on the general public‟s perceptions of specific environmental 119
factors related to reproductive health [31, 32]. These reviews and recent guides in the USA [33, 120
34] concur that this is an area of considerable significance to public health although it is under 121
researched. Australia is a country of special interest because in some areas it has progressive 122
laws in the field in question, it contains a wide range of potentially interesting reproductive 123
environmental hazards, and it has a number of national surveys that explore environmental 124
attitudes. Queensland contains agricultural, mining, industrial activities and a range of urban and 125
rural settings. The state has also some progressive social legislation. 126
127
The aim of this study was to explore aspects of the public‟s perceived risks of environmental 128
hazards on human reproduction by (i) gender, (ii) place of residence (city, town or rural) (iii) age 129
and (iv) presence of children in the household. The specific environmental hazards considered in 130
7
this study were selected due to the previous work we have conducted in this area and from the 131
literature reviewed. These are also the hazards that are believed to be most familiar to the public. 132
133
8
Materials and Methods 134
The study employed survey methods of a randomly selected sample of people living in Australia. 135
The study received ethical approval from the University Human Research Ethics Committee. 136
Data were collected in July and August 2010 as part of the annual Queensland Social Survey 137
conducted by the population Research Laboratory at Central Queensland University. Sampling 138
was a two-stage selection process involving i) Selection of households; and ii) Selection of 139
respondent within each household. The target population designated for telephone interviewing 140
was all persons 18 years of age or older who, at the time of the survey, were living in a home in 141
Queensland that could be contacted by direct-dialling to a land based telephone service. A 142
random selection approach was used to ensure that all respondents had an equal chance to be 143
contacted. The sampling error is a measure of the validity of the descriptive statistics that are 144
observed in a sample. Survey estimates of sampling error for the total sample of 1261 indicate 145
that this is accurate within plus or minus 2.7 percentage points, at a 95% confidence interval 146
[35]. 147
148
The sample was drawn using list-assisted random digit dialling. All duplicate and mobile 149
telephone numbers were removed from the generated lists. A respondent within each household 150
was pre-selected on the basis of gender to ensure an equal yet random selection of male and 151
female participants. Within the household, one eligible person was selected as the respondent for 152
the 30 minute interview. A respondent within each household was selected on the basis of 153
gender using the following selection guidelines to ensure an equal yet random selection of male 154
and female participants i) the dwelling unit must be the person‟s usual place of residence and 155
he/she must be 18 years of age or older; ii) each household was randomly pre-selected as either a 156
9
male or female household iii) if there was more than one male/female in the household then the 157
male/female that had the most recent birthday was selected iv) If there was no-one of the pre-158
selected gender residing in the house then the house was designated not qualified. Past surveys 159
have indicated that 60% of the time, the first household contact is female. Previous experience 160
indicated that recruitment to the survey was more successful when calls were made in the 161
evenings or weekends. 162
163
The questionnaire was pilot tested by trained interviewers on a total of 52 respondents. 164
Interviewer comments (e.g. any confusing questions, inadequate response categories etc) and 165
pre-test response distributions were made available to the researchers. Following this pilot, one 166
of our questions response categories was modified for the main data collection. 167
168
The Queensland Social Survey is an annual omnibus survey that addresses a variety of topics of 169
interest to the research community. The survey consists of a standardised introduction, a series 170
of question sets reflecting the specific research interests of the university and community 171
researchers participating in the study, and demographic questions. Questions relating to the 172
public‟s opinion of environmental hazards and human reproduction were embedded into the 173
survey. Interviewees were asked to firstly rank five individual environmental hazards from 174
„very harmful‟ to not „harmful at all‟ to human reproduction and secondly to choose from a list 175
of five hazards which they perceived to be the hazard most harmful to human reproduction. 176
Selection of the questions on common reproductive hazards in the survey were geared to 177
covering some of the most common hazards linked to reproduction and likely to occur in the 178
state and based on the knowledge of the authors of those substances or activities linked to 179
10
environmental exposure in major international and national governmental and scientific guides 180
[32]. 181
182
All data were cleaned, coded and analysed using PASW Statistics Version 18. The data cleaning 183
process included wildcode, discrepant value, and consistency checks. Simple frequencies were 184
calculated for each question and expressed as percentages. Frequencies were presented by total 185
sample, gender, age group, place of residence, and presence of children in the household. The 186
resultant data set contains 1261 cases. 187
188
For questions where respondents were asked as to whether they considered a list of potential 189
environmental hazards to be very harmful, harmful, neutral, slightly harmful or not harmful at all 190
to reproduction, numbers and percentages of those considering them to be harmful or very 191
harmful were determined and stratified by gender, age group, place of residence, and presence of 192
children in the household. A logistic regression was then carried out with whether or not the 193
pollutant was considered to be harmful or very harmful as the dependent variable. Odds ratios 194
were determined for each covariate, adjusted for all other covariates. 195
196
11
Results 197
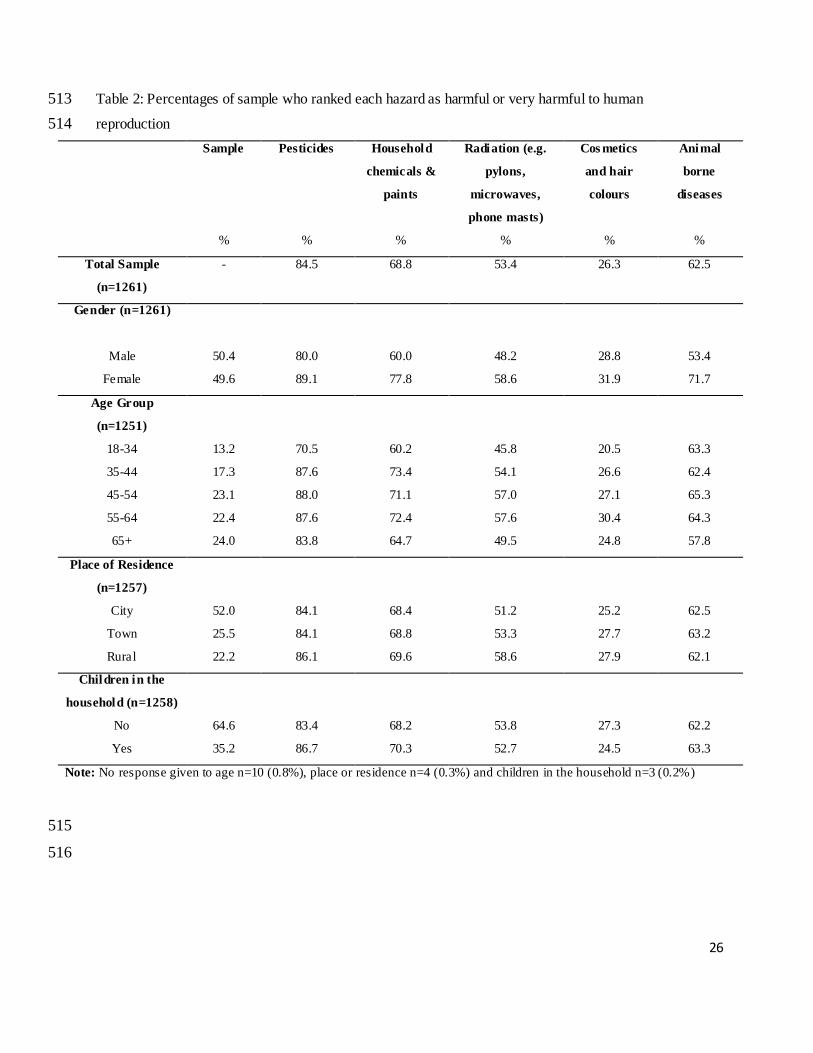
There were 1261 telephone interviews completed and the characteristics of the respondents are 198
presented in Table 2. Comparison of the survey sample with the most recent Australian Bureau 199
of Statistics (ABS) census data (2006) revealed there was over sampling in the 45-65+ age 200
categories and under sampling in the under 45 age categories. The response rate was calculated 201
by dividing the number of people participating in the survey (completed or partially completed 202
interview) by the number of people in the selected survey. For this survey the response rate was 203
35.2%. 204
205
In the total sample of Queensland residents there was general agreement that pesticides, 206
household chemicals and animal borne diseases had either a very harmful or harmful effect on 207
human reproduction (Table 2). Pesticides were described by the highest proportion (84.5%) of 208
the sample as harmful or very harmful. This agreement ranged from a low of 70.5% in the 18-34 209
year-old age group to a high of 88% in the 45-54 year-old age group. With only 26.3% of the 210
sample ranking cosmetics and hair colours as harmful or very harmful, this hazard was perceived 211
to cause the lowest risk to reproduction. 212
213
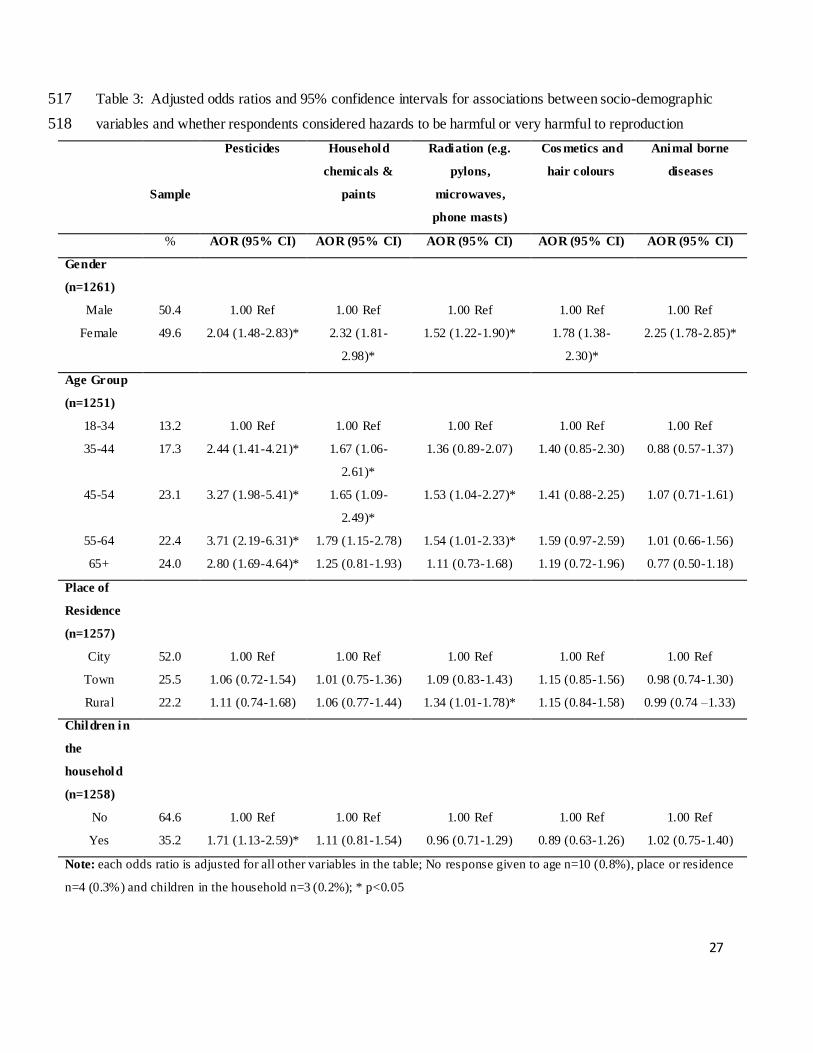
Table 3 represents the result of a logistic regression analyses for each potential hazard. Results 214
indicate that there was a significant association between gender and perceived risk. In general, 215
women were around twice as likely to rank all hazards as harmful or very harmful than men. 216
Those in the 35-44, 45-54, 55-64 and 65 years and older age groups were also all significantly 217
more likely to rank pesticides as harmful or very harmful than those in the 18-34 age group; 218
12
while those in the 45-54 age group were significantly more likely to rank household 219
chemicals/paints and radiation as harmful or very harmful than the 18-34 age group. 220
221
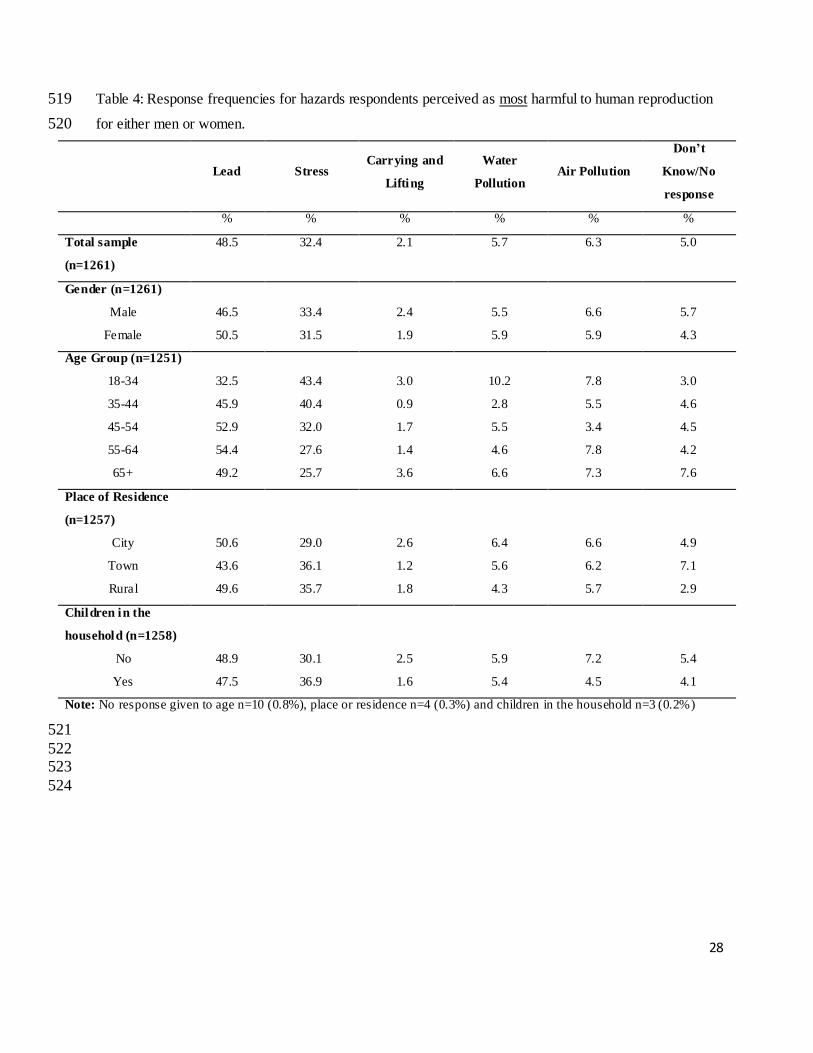
Lead was identified by 48.5% of respondents to be the most harmful hazard to reproduction 222
when compared with stress (32.4%), carrying and lifting (2.1%), water pollution (5.7%) and air 223
pollution (6.3%) (Table 4). A Chi-squared test for independence indicated no significant 224
association between most harmful hazard identified with either gender, place of residence or 225
children in the household (p>0.05). A significant association was, however, noted with age 226
(p<0.001). Only 32.5% of those in the younger age group (18-34 years) identified lead as the 227
most harmful hazard compared with 45.9% in the 35-44 group, 52.9% in the 45-54 group, 54.4% 228
in the 55-64 group and 49.2% in the 65 years and older group. Stress however, was chosen as 229
the most harmful hazard in the younger age group with this agreement decreasing as age 230
increased. 231
232
233
13
Discussion 234
This study provides a snapshot of risk perceptions. Whilst the scientific evidence of the effects 235
of prenatal exposure to environment hazards and adverse effects on children is on the rise, it is 236
important to investigate what the public believe about the exposure to a range of hazards and 237
reproductive health. To date, little empirical data about the public‟s knowledge about 238
environmental hazards and reproduction have been reported. Data such as that collected in this 239
study has been compared with the scientific evidence base, whether that provides strong, weak, 240
or absent links to adverse effects to human health. Comparisons such as these may provide an 241
invaluable contribution to both environmental health policy and practice developments. 242
243
Setting the results either in the context of Australia as a whole, or globally, is difficult because of 244
the lack of comparative studies using similar methodologies. However, the Australian-wide 245
survey of public environmental health perceptions - not specifically environmental risk to human 246
reproduction - based on 2,008 interviews and carried out in 2000 did identify some similar but 247
broad brush conclusions to our study, both on gender responses and several hazards. It 248
commented that concerns about risks that affected children and pregnant women are usually 249
heightened and noted: “Pollution issues all frequently rated as high risks, with chemical pollution 250
overall being regarded as the greatest risk. Chemicals such as pesticides and insecticides were 251
considered high risk by about half of respondents. Dioxin chemicals ranked lower however, 252
perhaps indicating a lack of recognition of this class of chemicals. New or topical issues such as 253
food irradiation and genetically modified food did not rank as high a risk as most of the other 254
categories” [36] pg 31. 255
256
14
A pioneering study which is still relevant to the present analysis of global risks to health 257
concluded that the most highly uncertain risks such as pesticides and nuclear power are deemed 258
the most dreaded, while risks associated with health interventions and clinical procedures are 259
more acceptable [37]. A range of factors have been shown to influence risk perceptions and 260
these are embedded within different economic, social and cultural environments [38]. Some of 261
these have been explored in the survey such as gender, age and location. Others like 262
employment, family and peer group, and education may also be factors. The media too plays a 263
part in risk perception and rating - the web as well as radio, TV and newspapers are of growing 264
significance although evidence-based media sources may not always be accessed. 265
266
We conducted a search, using environmental health, reproduction and specific haza rd topics of 267
all national Australian and major Western Australian newspapers through the Nexis-Lexis 268
newspaper data base for the three months prior to the survey date. We also accessed the web 269
sites of major Australian TV channels for the same period using the same search terms. 270
Surprisingly, no major stories on general environmental hazards linked to reproductive outcomes 271
were identified. Major TV channels such as ABC had only one story on the topic in the six 272
months prior to the survey. In the early 2000s there had been several major news stories linked 273
to pesticides and reproduction, other more general stories on environmental hazards not 274
specifically related to reproduction, such as female breast cancer clusters in TV offices, that may 275
have shaped some public responses to hazard ratings. These sources have often diverse and 276
complex influences that merit further investigation but are beyond the scope of the current 277
survey. 278
15
Where different generations had some extensive sensitisation to or greater knowledge of hazards 279
than later generations, risk ratings, whatever the evidence base indicates, may be lower or may 280
be higher for a range of reasons. Hazards widely publicised over several decades such as 281
pesticides in general and specific pesticides in particular appear to score highly. However, older 282
hazards that are considered to be no longer present at levels or in places that might threaten 283
health may sometimes be given lower risk ratings. The risk rating may be further lowered if up 284
to date scientific evidence is not available or not highlighted in the population at large. Lead is a 285
case in point in Table 4 [39]. City dwellers were more likely to rate lead as the most harmful 286
hazard to human reproduction when compared with town dwellers (50.6% v‟s 43.6%). This may 287
again reflect particular concerns about lead paint in old buildings and in pipes with related 288
information campaigns and public health interventions to remove the hazard in large 289
conurbations. 290
291
The chronic high level exposures to lead have been well known and well publicised as have the 292
effects of high exposures on female reproduction whilst the male reproductive health hazards of 293
lead have been downplayed or ignored. However, recent research has focused on effects that are 294
chronic, low level and sometimes subtle including reproductive effects. The neurological and 295
behavioural as well as the reproductive effects of very low lead levels in humans has yet to 296
percolate through into the public domain. This raises a raft of questions about info rmation, 297
communication, regulation and enforcement on environmental hazards. 298
299
Familiarity that is sometimes a reflection of knowledge and sometimes of ignorance may also 300
explain some low ratings and lack of knowledge of a hazard may explain high risk ratings. For 301
16
example, in Table 2 similar rankings surprisingly exist from residents in cities and towns for 302
animal-borne diseases to that of residents in rural areas. This may be because those working with 303
animals in agricultural areas come across zoonotic diseases frequently and rate the risks highly 304
whereas those in towns and cities hear about a few dangerous zoonotic diseases and may over-305
estimate their threats. Alternatively, dog and cat borne diseases may be brought to the attention 306
of owners by vets and are more widely publicized than other hazards in urban areas particularly 307
in terms of toxocaria canis and toxoplasmosis. There is some evidence too that vets and 308
physicians assess and identify zoonotic threats differently: vets may downplay tick-borne 309
diseases as they are not involved in human diagnoses and physicians may misunderstand the 310
threats of toxoplasmosis from sheep [40]. With such confusion among health professionals, it is 311
unsurprising that there may be confusion in the minds of the public about what are real threats 312
and what the scale of those threats is. 313
314
The responses for animal-borne diseases again show a greater risk perception for women than 315
men although a zoonotic-specific set of questions might have elicited different responses. Hence 316
there is much information publicly available about reproductive adverse effects in women from 317
zoonotic diseases that men and women would be aware of. Risks of contracting Q disease are 318
probably more limited to those in abattoirs and animal husbandry. The age profiles on risk 319
perceptions, however, are harder to interpret with age group 45-54 ranking risks higher and the 320
18-34 group ranking risks lowest. This may reflect the knowledge and experience base of 321
responders. 322
323
17
There is a growing body of evidence to indicate that women express far greater concern than 324
men with regard to health and environmental hazards [41]. Explanations for this difference have 325
focused on both social and biological factors. It has been suggested by some that there is an 326
association between knowledge of the potential hazard and the perceived risk [41]. However, in 327
a study of male and female scientists of similar scientific training [42], the authors concluded 328
that male scientists tended to see substantially less risk from nuclear technologies and materials 329
than female scientists. A review of 85 published studies in this area [43] reported that for 38 330
studies that examined nuclear power and radio-active waste, women expressed greater concern in 331
every study; for the 19 studies that examined risk-related environmental issues such as toxic 332
chemical waste, women expressed greater concern in 95% of these. 333
334
Men ranked stress, air pollution and lifting and carrying as greater hazards to reproduction than 335
women (Table 4). Why this should be so is not clear. Air pollution and lifting and carrying have 336
not been linked to adverse male reproductive effects and it may be that women adjust to 337
everyday hazards that they face and „downplay‟ them. With much recent information and media 338
discussion of stress, it is perhaps easier to explain why younger age groups rank stress highest 339
and older age groups place it lowest although different definitions of stress may be used by 340
different age groups. Findings for which no explanation exist or where sample size may be a 341
factor occur on water pollution which attracts the highest hazard rating for younger age groups 342
but the lowest for the 35-44 group. 343
344
Although insightful, the current study was subject to a number of limitations. Participants were 345
volunteers and therefore there may be some selection bias. However, it is worth noting that 346
18
respondents were answering questions on a number of health related topics and are unlikely to 347
have agreed to participate because they feel strongly about the topic area being studied here. 348
Also, only Queensland residents that were contactable by a landline telephone were able to 349
participate. It should be acknowledged that the sample is not representative of the Australian 350
population with over representation of the 45 years and older age group and under representation 351
of the 45 years and younger group. Gaining adequate participation of younger respondents when 352
conducting computer –assisted telephone interviewing surveys using only randomly generated 353
landline telephone samples has become more difficult as increasing numbers of young people 354
use only mobile telephones. Recent studies have shown that exclusion of mobile phone only 355
households does not significantly influence survey results [44]. The response rate of 35.2% is 356
representitive of general household surveys which have been on the decline in recent years [45]. 357
It has been suggested that with reduced telephone number listings and people's increasing 358
resistance to unwanted phone calls, alternatives to telephone surveys, such as computer and 359
internet-based approaches, should be investigated [46]. Strengths of this study include the use of 360
a large state-wide sample to conduct an analysis of perceived risks of environmental health on 361
human reproduction. No similar survey of this topic and of this scale has been reported in the 362
scientific literature. 363
364
Acknowledgements 365
We thank all those from the Central Queensland Social Survey for collection of data and the 366
School or Nursing, Midwifery and Health, University of Stirling for funding this study. 367
368
369
370
19
Conflict of Interest 371
The authors declare that they have no conflict of interest. 372 373
20
References 374
1. Dietert, R. R. Developmental Immunotoxicology: Focus on Health Risks. Chem Res 375 Toxicol 2009;22:17-23. 376
2. European Environment Agency. Environment and Health. Copenhagen; EEA 2005. 377
3. WHO Regional Office for Europe. Children's Environment and Health Action Plan for 378 Europe . http://www euro who int/document/e83338 pdf 2004 (last accessed 04/2011) 379
4. Wigle DT, Arbuckle TE, Turner MC, Bérubé A, Yang Q, Liu S, Krewski D. 380 Epidemiologic evidence of relationships between reproductive and child health outcomes 381 and environmental chemical contaminants. J Toxicol Environ Health B Crit Rev 2008 382
11(5-6):373-51. 383
5. Nybo Andersen AM, Olsen J. The Danish National Birth Cohort: Selected scientific 384
contributions within perinatal epidemiology and future perspectives. Scand J Public 385 Health 2011 39(7 Suppl):115-20. 386
6. Takeuchi T, Morikawa N, Atsumoto H, and Shiraishi Y. A Pathological Study of 387
Minamata Disease in Japan Acta Neuropathol 1962;2:40-57. 388
7. Chalupka, S. Environmental Health: an Opportunity for Health Promotion and Disease 389
Prevention. Amer Ann Occ Heal Nur 2005;53:13-28. 390
8. Houlihan, J, Kropp, T, Wiles, R, Gray, S, and Campbell C. Body Burden: the pollution in 391 newborns. Washington DC, USA; Environmental Working Group 2005. 392
9. Lyons G and Watterson, A. A Review of the Role Pesticides Play in Some Cancers: 393 Children, Farmers and Pesticide Users at Risk? http://www chemtrust org 394 uk/Pesticidesandcancer php 2010 (last accessed 04/2011). 395
10. Sutton, P, Giudice, LC, and Woodruff, TJ. Reproductive Environmental Health. Curr 396 Opin in Obstet Gyn 2010; 22:517-24. 397
11. Bassil, K. L., Vakil, C., Sanborn, M., Cole, D. C., Kaur, J. S., and Kerr, K. J. Cancer 398 Health Effects of Pesticides: Systematic Review Canadian family physician Medecin de 399 famille canadien 2007; 1704-11. 400
12. Turner, M. C., Wigle, D. T., and Krewski, D. Residential Pesticides and Childhood 401 Leukemia: A Systematic Review and Meta-Analysis. Environ Health Persp 2010;118: 402
33-41. 403
13. Van Maele-Fabry, G., Lantin, A.C., Hoet, P., and Lison, D. Childhood Leukaemia and 404 Parental Occupational Exposure to Pesticides: A Systematic Review and Meta-Analysis. 405
Cancer Cause Control 2010;21:787-809. 406
21
14. Sanborn, M., Kerr, K. J., Sanin, L. H., Cole, D. C., Bassil, K. L., and Vakil, C. Non-407 Cancer Health Effects of Pesticides: Systematic Review and Implications for Family 408
Doctors Canadian family physician. Medecin Famille Canadien 2007;53:1712-20. 409
15. Ribas-Fitó, N, Sala, M, Kogevinas, M, and Sunyar, J. Polychlorinated Biphenyls (PCBs) 410 and Neurological Development in Children: a Systematic Review. J Epidemiol Commun 411
H 2001;55:537-46. 412
16. Williams, J. H. G. and Ross, L. Consequences of Prenatal Toxin Exposure for Mental 413
Health in Children and Adolescents: A Systematic Review. Eur Child Adol Psych 414 2007;16:243-53. 415
17. Sram, R. J., Binkova, B., Dejmek, J., and Bobak, M. Ambient Air Pollution and 416
Pregnancy Outcomes: A Review of the Literature. Environ Health Persp 2005;113:375-417 82. 418
18. Maisonet, M., Correa, A., Misra, D., and Jaakkola, J. J. A Review of the Literature on 419 the Effects of Ambient Air Pollution on Fetal Growth. Environ Res 2004;95:106-15. 420
19. Glinianaia, S. V., Rankin, J., Bell, R., Pless-Mulloli, T., and Howel, D. Particulate Air 421
Pollution and Fetal Health: a Systematic Review of the Epidemiologic Evidence. 422 Epidemiology 2004;15:36-45. 423
20. Annesi-Maesano, I., Ackermann, U., Boudet, C., Filleul, L., Medina, S., Slama, R., et al. 424 Health Effects of Atmospheric Particles: Review of the Epidemiologic Studies. Environ 425 Risques Sante 2004;3:97-110. 426
21. Schulze-Rath, R., Hammer, G. P., and Blettner, M. Are Pre- or Postnatal Diagnostic X-427 Rays a Risk Factor for Childhood Cancer? A Systematic Review. Radiation & Environ 428 Biophy 2008;47:301-12. 429
22. Calvente, I., Fernandez, M. F., Villalba, J., Olea, N., and Nunez, M. I. Exposure to 430 Electromagnetic Fields (Non-Ionizing Radiation) and its Relationship With Childhood 431
Leukemia: A Systematic Review. Sci Total Environ 2010;408:3062-69. 432
23. Jauchem, J. R. Effects of Low-Level Radio-Frequency (3kHz to 300GHz) Energy on 433 Human Cardiovascular, Reproductive, Immune, and Other Systems: a Review of the 434
Recent Literature. Int J Hyg Envir Heal 2008; 21:1-29. 435 436
24. Peters, C., Harling, M., Dulon, M., Schablon, A., Torres, Costa J., and Nienhaus, A. 437 Fertility Disorders and Pregnancy Complications in Hairdressers - A Systematic Review. 438 J Occup Med Toxicol 2010;5:24. 439
25. Manassaram, D. M., Backer, L. C., and Moll, D. M. A. Review of Nitrates in Drinking 440 Water: Maternal Exposure and Adverse Reproductive and Developmental Outcomes. 441
Environ Health Persp 2006;114:320-27. 442
22
26. Petersen, A and Lupton, D. The New Public Health. Health and Self in the Age of Risk. 443 Sage; 1996. 444
27. Lupton, D. The Imperative of Health. Public Health and the Regulated Body. Sage; 1995. 445
28. Beck, U. Risk Society; Towards a New Modernity. Sage; 1992. 446
29. Douglas, M. Risk and Blame: Essays in Cultural Theory. Routeledge; 1992. 447
30. Slovic, P. Public Perception of Risk. J Environ Health 1997;59:22-3. 448
31. Grason, H. A. and Misra, D. P. Reducing Exposure to Environmental Toxicants Before 449
Birth: Moving From Risk Perception to Risk Reduction. Public Health Rep 450 2009;124:629-41. 451
32. Watterson, A., Thomson, P., Malcolm, C., Shepherd, A., and McIntosh, C. Integrating 452
Environmental Health into Nursing and Midwifery Practice. J Adv Nurs 2005;49:665-453 74. 454
33. Etzel, R ed and Balk, SJ Ass Ed. Pediatric Environmental Health 2003; 2nd edition 455
34. Shendell, D. G. and Pike-Paris, A. Environmental Exposure Assessment, Pollution 456 Sources, and Exposure Agents: a Primer for Pediatric Nursing Professionals. Pediatr 457
Nurs 2007;33:179-182. 458
35. Babbie, E. The Practice of Social Research. International Thomson Pub; 1989. 459
36. Starr, G and Langley A, Taylor A. Environmental health risk perception in Australia : a 460 research report to the Commonwealth Department of Health and Aged Care. Adelaide; 461 Dept. of Human Services 2000. 462
37. Solvic P, Fischhoff B, Lichtenstein S. Facts and fears: undertanding perceived risk. In: 463 Schwing RC, Albers WA (eds). Societal risk assessment: how safe is safe enough? New 464 York: Plenum; 1980, 181-214 465
38. World Health Organisation. World Health Report 2002. Perceiving risks. Chapter three. 466 2003 27-45. 467
39. O'Neill, R. Dangerous Lead. http://www hazards org/lead/ 2009 (last accessed 04/2011) 468
40. Watterson A. Crofting, Health and the Environment Report. Stirling University; 2010. 469
41. Kovacs, D. C., Small, M. J., Davidson, C. I., and Fischhoff, B. Behavioral Factors 470
Affecting Exposure Potential for Household Cleaning Products. J Expo Anal Env Epid 471 1997;7:505-20. 472
42. Barke, R. P, Jenkins-Smith, H, and Slovic, P. Risk Perceptions of Men and Women 473 Scientists. Soc Sci Quart 1997;78;167. 474
23
43. Davidson, D and Freudenburg, W. Gender and Environmental Risk Concerns: A Review 475 and Analysis of Available Research. Environ Behav 1996;28:302-39. 476
44. Pennay DW and Bishop N (2009). Profiling the „mobile phone only‟ population: A study 477 of Australians with a mobile phone and no landline telephone, Social Research Centre 478 Pty Ltd. 479
45. Curtin R, Presser S, Singer E. Changes in telephone survey non-response over the past 480 quarter century. Pub Op Quarterly 2005 69: 87-98. 481
482 46. O‟Toole J, Sinclaire M, Leder K. Maximising response rates in household telephone 483
surveys. BMC Med Res Methodology 2008, 8:71 484
485 47. Ferris, I. Tortajada, Ortega Garcia, J. A., Lopez Andreu, J. A., Berbel, Tornero O., 486
Marco, Macian A., and Garcia, I. Castell. Parental Tobacco Smoke and Childhood 487 Cancer. Revista Espanola de Pediatria 2004;60:225-36. 488
48. Idrovo, A. J. and Sanin, L. H. Adverse Reproductive Outcomes Among Women Working 489
in Colombian Floriculture: a Summary of the Evidence through Meta-analysis. 490 Biomedica: revista del Instituto Nacional de Salud 2007;27:490-97 491
49. Ngo, A. D., Taylor, R., Roberts, C. L., and Nguyen, T. V. Association between Agent 492 Orange and Birth Defects: Systematic Review and Meta-Analysis. Int J Epidemiol 493 2006;35:1220-30. 494
50. Schultze-Mosgau, A., Griesinger, G., Altgassen, C., von, Otte S., Hornung, D., and 495 Diedrich, K. New Developments in the Use of Peptide Gonadotropin-Releasing 496 Hormone Antagonists Versus Agonists. Expert Opin Invest Drugs. 2005;14:1085-97. 497
51. Little, M. P. and Wakeford, R. Systematic Review of Epidemiological Studies of 498 Exposure to Tritium. J Radiolo Protect 2008;28:9-32. 499
52. Vidaeff, A. C. and Sever, L. E. In Utero Exposure to Environmenta l Estrogens and Male 500 Reproductive Health: A Systematic Review of Biological and Epidemiologic Evidence. 501 Reprod Toxicol 2005;20:5-20. 502
503
504
24
Table 1. Summary of review level evidence on associations between exposure and outcomes in 505
pregnancy 506
Potential hazard Outcome investigated Evidence base Association between
exposure & outcome*
Pesticides Childhood cancer Systematic rev iew1[11]
+
Pesticides Reproductive effects: birth
defects, fetal death, altered
growth, and other outcomes.
Systematic rev iew[14] +
Residual pesticides,
insecticides and herbicides
Childhood leukaemia Systematic rev iew[12] +
Pesticides (parental exposure
to)
Childhood leukaemia Systematic rev iew[13] +
Air pollution Fetal growth Systematic rev iew[18] +
Air pollution Fetal growth
Respiratory deaths
Systematic rev iew[17] ±
Air pollution Fetal growth
Duration of pregnancy
Systematic rev iew[19] ±
Air pollution Fetal growth and duration of
pregnancy
Systematic rev iew[20] ±
Polychlorinated biphenyls
(PCBs)
Child neurodevelopment Systematic rev iew[15] +
Electromagnetic fields (non-
ionizing rad iation)
Childhood leukaemia Systematic rev iew[22]
±
Low level rad io-frequency Birth defects, fertility,
neuroblastoma in offspring, &
reproductive hormones
Literature rev iew[23] ±
Parental s moking Childhood cancer Systematic rev iew[47] +
Working in floricu lture
(exposed to, physical activity,
temperatures & pesticides)
Spontaneous abortion and birth
defects
Meta-analysis of two
studies[48]
+
Nitrates in drinking water Spontaneous abortions,
intrauterine growth restrict ion,
Literature rev iew[25] ±
25
Potential hazard Outcome investigated Evidence base Association between
exposure & outcome*
and various birth defects
Agent Orange (dioxin) Birth defects Systematic rev iew[49] +
Working in hairdressers –
exposure to hair products
Fertility and pregnancy
complications
Birth malformations particularly
orofacial cleft
Systematic rev iew[24] ±
Diagnostic x-rays Childhood cancer Systematic rev iew[50] ±
Trit ium Various Systematic rev iew[51] ±
Environmental oestrogens Male reproductive health Systematic rev iew[52]
±
Lead, polychlorinated
biphenyls, mercury, cocaine,
alcohol, marijuana, cigarettes
and antidepressants.
Mental health in children and
adolescents
Systematic rev iew[16] + for some exposure
± for others
1 A systematic rev iew uses systematic, reproducible and transparent methods to identify, appraise and synthesise 507
studies 508 * + association between exposure to hazard and outcome 509
± conflict ing or not enough evidence of an association between exposure to hazard and outcome 510
- No association between exposure to hazard and outcome 511
512
26
Table 2: Percentages of sample who ranked each hazard as harmful or very harmful to human 513
reproduction 514
Sample Pesticides
Household
chemicals &
paints
Radiation (e.g.
pylons,
microwaves,
phone masts)
Cos metics
and hair
colours
Animal
borne
diseases
% % % % % %
Total Sample
(n=1261)
- 84.5 68.8 53.4 26.3 62.5
Gender (n=1261)
Male
Female
50.4
49.6
80.0
89.1
60.0
77.8
48.2
58.6
28.8
31.9
53.4
71.7
Age Group
(n=1251)
18-34 13.2 70.5 60.2 45.8 20.5 63.3
35-44 17.3 87.6 73.4 54.1 26.6 62.4
45-54 23.1 88.0 71.1 57.0 27.1 65.3
55-64 22.4 87.6 72.4 57.6 30.4 64.3
65+ 24.0 83.8 64.7 49.5 24.8 57.8
Place of Residence
(n=1257)
City 52.0 84.1 68.4 51.2 25.2 62.5
Town 25.5 84.1 68.8 53.3 27.7 63.2
Rural 22.2 86.1 69.6 58.6 27.9 62.1
Children in the
household (n=1258)
No 64.6 83.4 68.2 53.8 27.3 62.2
Yes 35.2 86.7 70.3 52.7 24.5 63.3
Note: No response given to age n=10 (0.8%), place or residence n=4 (0.3%) and children in the household n=3 (0.2%)
515
516
27
Table 3: Adjusted odds ratios and 95% confidence intervals for associations between socio-demographic 517
variables and whether respondents considered hazards to be harmful or very harmful to reproduction 518
Sample
Pesticides
Household
chemicals &
paints
Radiation (e.g.
pylons,
microwaves,
phone masts)
Cos metics and
hair colours
Animal borne
diseases
% AOR (95% CI) AOR (95% CI) AOR (95% CI) AOR (95% CI) AOR (95% CI)
Gender
(n=1261)
Male 50.4 1.00 Ref 1.00 Ref 1.00 Ref 1.00 Ref 1.00 Ref
Female 49.6 2.04 (1.48-2.83)* 2.32 (1.81-
2.98)*
1.52 (1.22-1.90)* 1.78 (1.38-
2.30)*
2.25 (1.78-2.85)*
Age Group
(n=1251)
18-34 13.2 1.00 Ref 1.00 Ref 1.00 Ref 1.00 Ref 1.00 Ref
35-44 17.3 2.44 (1.41-4.21)* 1.67 (1.06-
2.61)*
1.36 (0.89-2.07) 1.40 (0.85-2.30) 0.88 (0.57-1.37)
45-54 23.1 3.27 (1.98-5.41)* 1.65 (1.09-
2.49)*
1.53 (1.04-2.27)* 1.41 (0.88-2.25) 1.07 (0.71-1.61)
55-64 22.4 3.71 (2.19-6.31)* 1.79 (1.15-2.78) 1.54 (1.01-2.33)* 1.59 (0.97-2.59) 1.01 (0.66-1.56)
65+ 24.0 2.80 (1.69-4.64)* 1.25 (0.81-1.93) 1.11 (0.73-1.68) 1.19 (0.72-1.96) 0.77 (0.50-1.18)
Place of
Residence
(n=1257)
City 52.0 1.00 Ref 1.00 Ref 1.00 Ref 1.00 Ref 1.00 Ref
Town 25.5 1.06 (0.72-1.54) 1.01 (0.75-1.36) 1.09 (0.83-1.43) 1.15 (0.85-1.56) 0.98 (0.74-1.30)
Rural 22.2 1.11 (0.74-1.68) 1.06 (0.77-1.44) 1.34 (1.01-1.78)* 1.15 (0.84-1.58) 0.99 (0.74 –1.33)
Children in
the
household
(n=1258)
No 64.6 1.00 Ref 1.00 Ref 1.00 Ref 1.00 Ref 1.00 Ref
Yes 35.2 1.71 (1.13-2.59)* 1.11 (0.81-1.54) 0.96 (0.71-1.29) 0.89 (0.63-1.26) 1.02 (0.75-1.40)
Note: each odds ratio is adjusted for all other variables in the table; No response given to age n=10 (0.8%), place or residence
n=4 (0.3%) and children in the household n=3 (0.2%); * p<0.05
28
Table 4: Response frequencies for hazards respondents perceived as most harmful to human reproduction 519
for either men or women. 520
Lead Stress Carrying and
Lifting
Water
Pollution Air Pollution
Don’t
Know/No
response
% % % % % %
Total sample
(n=1261)
48.5 32.4 2.1 5.7 6.3 5.0
Gender (n=1261)
Male
Female
46.5
50.5
33.4
31.5
2.4
1.9
5.5
5.9
6.6
5.9
5.7
4.3
Age Group (n=1251)
18-34 32.5 43.4 3.0 10.2 7.8 3.0
35-44 45.9 40.4 0.9 2.8 5.5 4.6
45-54 52.9 32.0 1.7 5.5 3.4 4.5
55-64 54.4 27.6 1.4 4.6 7.8 4.2
65+ 49.2 25.7 3.6 6.6 7.3 7.6
Place of Residence
(n=1257)
City 50.6 29.0 2.6 6.4 6.6 4.9
Town 43.6 36.1 1.2 5.6 6.2 7.1
Rural 49.6 35.7 1.8 4.3 5.7 2.9
Children in the
household (n=1258)
No 48.9 30.1 2.5 5.9 7.2 5.4
Yes 47.5 36.9 1.6 5.4 4.5 4.1
Note: No response given to age n=10 (0.8%), place or residence n=4 (0.3%) and children in the household n=3 (0.2%)
521
522 523
524