Embed Size (px)
Citation preview
Structured Finance
Mortgage and Housing Market Outlook
January 2013 1
RMBS / Global
Fitch Residential Mortgage Briefing Global Market Outlook for Housing and Mortgage Lending
Special Report
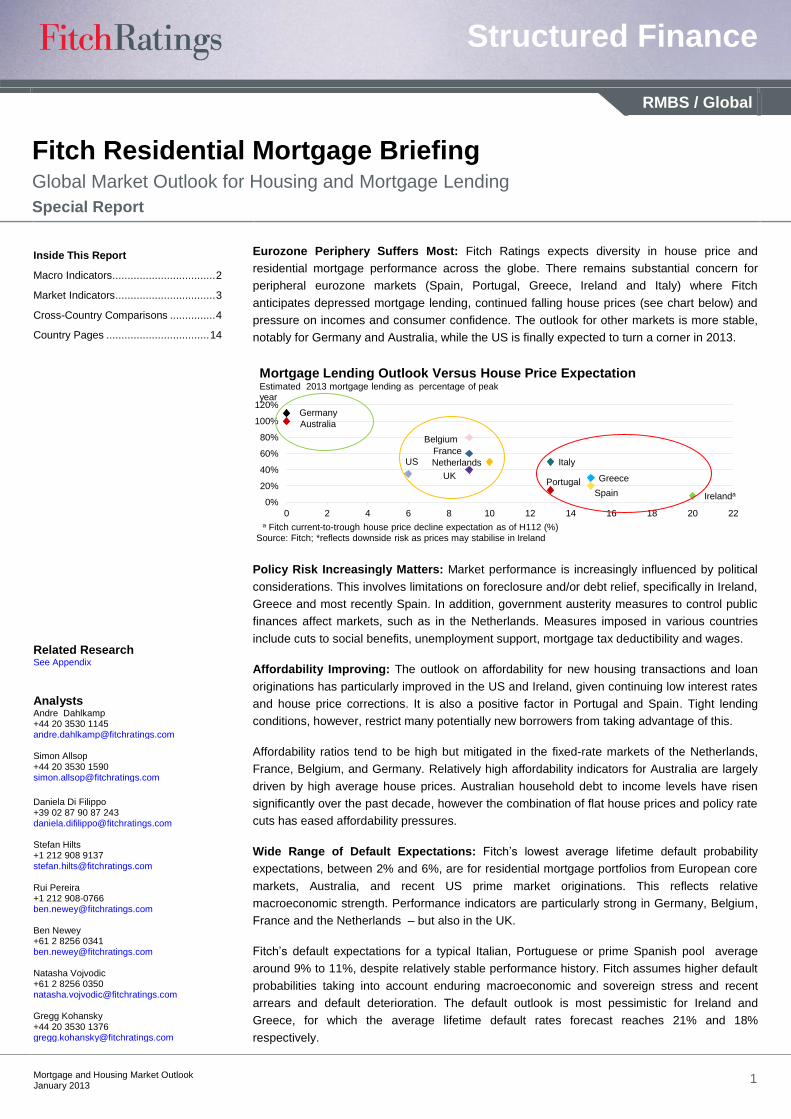
Eurozone Periphery Suffers Most: Fitch Ratings expects diversity in house price and
residential mortgage performance across the globe. There remains substantial concern for
peripheral eurozone markets (Spain, Portugal, Greece, Ireland and Italy) where Fitch
anticipates depressed mortgage lending, continued falling house prices (see chart below) and
pressure on incomes and consumer confidence. The outlook for other markets is more stable,
notably for Germany and Australia, while the US is finally expected to turn a corner in 2013.
Policy Risk Increasingly Matters: Market performance is increasingly influenced by political
considerations. This involves limitations on foreclosure and/or debt relief, specifically in Ireland,
Greece and most recently Spain. In addition, government austerity measures to control public
finances affect markets, such as in the Netherlands. Measures imposed in various countries
include cuts to social benefits, unemployment support, mortgage tax deductibility and wages.
Affordability Improving: The outlook on affordability for new housing transactions and loan
originations has particularly improved in the US and Ireland, given continuing low interest rates
and house price corrections. It is also a positive factor in Portugal and Spain. Tight lending
conditions, however, restrict many potentially new borrowers from taking advantage of this.
Affordability ratios tend to be high but mitigated in the fixed-rate markets of the Netherlands,
France, Belgium, and Germany. Relatively high affordability indicators for Australia are largely
driven by high average house prices. Australian household debt to income levels have risen
significantly over the past decade, however the combination of flat house prices and policy rate
cuts has eased affordability pressures.
Wide Range of Default Expectations: Fitch‘s lowest average lifetime default probability
expectations, between 2% and 6%, are for residential mortgage portfolios from European core
markets, Australia, and recent US prime market originations. This reflects relative
macroeconomic strength. Performance indicators are particularly strong in Germany, Belgium,
France and the Netherlands – but also in the UK.
Fitch‘s default expectations for a typical Italian, Portuguese or prime Spanish pool average
around 9% to 11%, despite relatively stable performance history. Fitch assumes higher default
probabilities taking into account enduring macroeconomic and sovereign stress and recent
arrears and default deterioration. The default outlook is most pessimistic for Ireland and
Greece, for which the average lifetime default rates forecast reaches 21% and 18%
respectively.
Netherlands
Australia
Italy
UK
Belgium
France
Spain
Greece
US
Portugal
Irelanda
Germany
0%
20%
40%
60%
80%
100%
120%
0 2 4 6 8 10 12 14 16 18 20 22
a Fitch current-to-trough house price decline expectation as of H112 (%)
Estimated 2013 mortgage lending as percentage of peak year
Mortgage Lending Outlook Versus House Price Expectation
Source: Fitch; *reflects downside risk as prices may stabilise in Ireland
Related Research See Appendix
Analysts Andre Dahlkamp +44 20 3530 1145 [email protected] Simon Allsop +44 20 3530 1590 [email protected]
Daniela Di Filippo +39 02 87 90 87 243 [email protected] Stefan Hilts +1 212 908 9137 [email protected] Rui Pereira +1 212 908-0766 [email protected] Ben Newey +61 2 8256 0341 [email protected] Natasha Vojvodic +61 2 8256 0350 [email protected] Gregg Kohansky +44 20 3530 1376 [email protected]
Inside This Report
Macro Indicators .................................. 2
Market Indicators ................................. 3
Cross-Country Comparisons ............... 4
Country Pages .................................. 14
Structured Finance
Mortgage and Housing Market Outlook
January 2013 2
Macroeconomic Indicators
Germany UK NL France Belgium Ireland Spain Italy Portugal Greece Australia US
Sovereign Environment
Status summary + + + + o o – – – – – + +
Sovereign Issuer Default Rating (IDR) AAA AAA AAA AAA AA BBB+ BBB A- BB+ CCC AAA AAA
Notches downgrade since Aug 2011 0 0 0 1 0 7 3 3 0 (-1) upgrade 0
Maximum structured finance rating AAAsf AAAsf AAAsf AAAsf AAAsf AAsf AA-sf AAAsf Asf B-sf AAAsf AAAsf
Unemployment
Status summary + o o o o – – – o – – – + o
Average 2013-14 Forecast (%) 6.6 8.0 6.5 10.4 7.5 14.1 26.2 11.7 16.1 23.5 5.5 7.7
Forecast change since Aug 2011 ▼ ▲ ▲ ▲ ▼ ► ▲▲ ▲ ▲ ▲▲ ► ►
GDP growth
Status summary + o o o o o – – – – – + +
Average 2013-14 Forecast (%) 1.1 1.5 0.6 0.7 0.9 1.5 -0.5 0.1 -0.4 -2.0 3.1 2.6
Forecast change since Aug 2011 ▼ ▼ ▼ ▼ ▼ ▼ ▼ ▼ ▼ ▼▼ ▲ ►
Inflation
Status summary o o o o o o o o o o o o
Average 2013-14 Forecast (%) 1.8 2.1 2.1 1.7 1.9 1.3 2.0 1.9 1.5 -0.8 3.0 2.0
Forecast change since Aug 2011 ► ► ► ► ► ► ► ► ► ► ▼ ►
Policy rates
Status summary + + + + + + + + + + + +
Overall macro evaluation
Macro status and outlook relatively positive
neutral / weak
neutral / weak
neutral / weak
neutral / weak
stabilising relatively
poor neutral /
weak relatively
poor very poor
relatively positive
relatively positive
Macro status/outlook change since Aug 2011 ► ▼ ▼ ▼ ► ► ▼▼ ▼ ▼ ▼▼ ► ►
Legend Status and outlook: ranges from ++ (excellent) via +, o, and – to – – (very negative); Forecast change: ranges from ▲▲ (sharp increase) via ▲, ►, ▼ to ▼▼ (sharp decline) Limitations: Most indicators used in this report represent an isolated single-factor perspective and an average figure that does not take into account distribution around the mean. Therefore, while useful for a high-level benchmarking analysis, these indicators should not be interpreted in isolation to form an overall view on mortgage performance for a specific country. Source: Fitch
Structured Finance
Mortgage and Housing Market Outlook
January 2013 3
Market Indicators
Germany UK prime NL France retail Belgium Ireland Spain Italy Portugal Greece Australia US
Arrears and defaults
Status summary + o o o + – – – o – – – o +
Arrears trend ► ► ▲ ► ► ▲▲ ▲ ▲ ▲ ▲▲ ► ▼
RMBS 3-month plus arrears (%) 0.5 2.0 0.9 0.1-0.3 0.2 15.0 2.3 2.2 2.6 5.1 0.7 11.1
Mortgage default probability
Fitch expectation for a typical pool (%) 4.1 6.0 3.8 4.4 3.2 21 11.4 9.1 9.9 18 3.0 2.3
Mortgage rates
Status summary + + + + + + + + + + o +
Current mortgage rates (%) 3.0 3.4 4.2 3.6 3.8 4.3 3.4 4.3 3.7 3.3 5.9 3.4
Fitch end-2013 forecast (%) 3.5 3.8 4.7 4.0 4.1 4.7 3.9 4.3 4.2 3.8 5.5 3.4
Gross new mortgage lending
Status summary + o o – o – – – – – – +
Year-on-year change (%) 1 10 -26 -35 -8 -20 -28 -35 -61 -12 5
Fitch 2013 forecast ▲ ► ▼ ▼ ► ► ▼ ▼ ▼ ▼ ► ▼
House Prices
Status summary + o – o o – – – o – – – o
Trend since Aug 2011 ▲ ► ▼ ► ▲ ▼ ▼ ▼ ▼ ▼ ▼ ▲
Peak-to-current house price decline (HPD) (%) 0 14 16 1 0 50 25.5 10 18 24 4 31
Fitch current-to-trough HPD assumption (%) (as of Q312 unless otherwise stated)
0 9 10 9 (Q212) 9 (Q411) 20 15 13 (Q411) 13 15 (Q212) 0
6
Overall market evaluation
Status & outlook positive neutral neutral /
weak neutral /
weak neutral
very negative
negative neutral /
weak negative
very negative
neutral positive
Change since Aug 2011 ▲ ► ▼ ▼ ► ▼▼ ▼ ► ▼ ▼▼ ► ▲
Legend Status and outlook: ranges from ++ (excellent) via +, o, and – to – – (very negative); Forecast change: ranges from ▲▲ (sharp increase) via ▲, ►, ▼ to ▼▼ (sharp decline) Limitations: Most indicators used in this report represent an isolated single-factor perspective and an average figure that does not take into account distribution around the mean. Therefore, while useful for a high-level benchmarking analysis, these indicators should not be interpreted in isolation to form an overall view on mortgage performance for a specific country. Source: Fitch
Structured Finance
Mortgage and Housing Market Outlook
January 2013 4
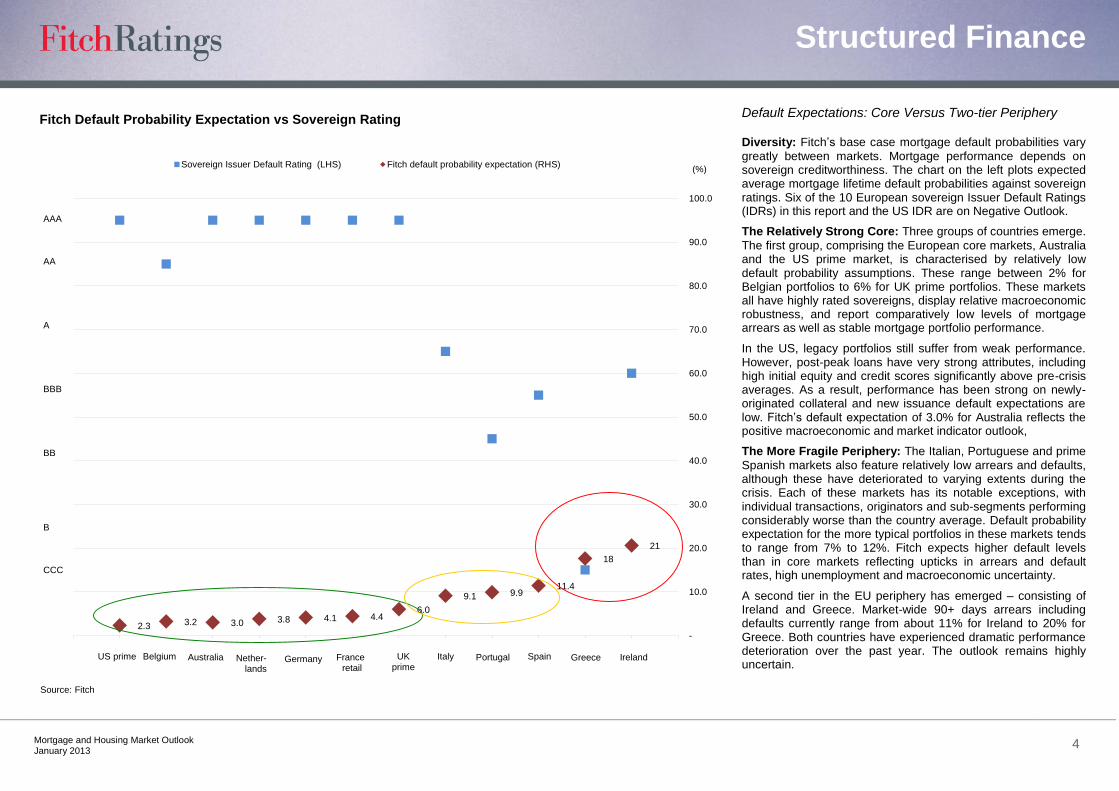
Default Expectations: Core Versus Two-tier Periphery Diversity: Fitch‘s base case mortgage default probabilities vary
greatly between markets. Mortgage performance depends on sovereign creditworthiness. The chart on the left plots expected average mortgage lifetime default probabilities against sovereign ratings. Six of the 10 European sovereign Issuer Default Ratings (IDRs) in this report and the US IDR are on Negative Outlook.
The Relatively Strong Core: Three groups of countries emerge.
The first group, comprising the European core markets, Australia and the US prime market, is characterised by relatively low default probability assumptions. These range between 2% for Belgian portfolios to 6% for UK prime portfolios. These markets all have highly rated sovereigns, display relative macroeconomic robustness, and report comparatively low levels of mortgage arrears as well as stable mortgage portfolio performance.
In the US, legacy portfolios still suffer from weak performance. However, post-peak loans have very strong attributes, including high initial equity and credit scores significantly above pre-crisis averages. As a result, performance has been strong on newly-originated collateral and new issuance default expectations are low. Fitch‘s default expectation of 3.0% for Australia reflects the positive macroeconomic and market indicator outlook,
The More Fragile Periphery: The Italian, Portuguese and prime
Spanish markets also feature relatively low arrears and defaults, although these have deteriorated to varying extents during the crisis. Each of these markets has its notable exceptions, with individual transactions, originators and sub-segments performing considerably worse than the country average. Default probability expectation for the more typical portfolios in these markets tends to range from 7% to 12%. Fitch expects higher default levels than in core markets reflecting upticks in arrears and default rates, high unemployment and macroeconomic uncertainty.
A second tier in the EU periphery has emerged – consisting of Ireland and Greece. Market-wide 90+ days arrears including defaults currently range from about 11% for Ireland to 20% for Greece. Both countries have experienced dramatic performance deterioration over the past year. The outlook remains highly uncertain.
2.3 3.2 3.0 3.8 4.1 4.4 6.0
9.1 9.9 11.4
18
21
-
10.0
20.0
30.0
40.0
50.0
60.0
70.0
80.0
90.0
100.0
Sovereign Issuer Default Rating (LHS) Fitch default probability expectation (RHS)
Source: Fitch
Fitch Default Probability Expectation vs Sovereign Rating
(%)
AAA
AA
A
BBB
BB
B
CCC
US prime Belgium Australia Nether-lands
Germany France retail
UKprime
Italy Spain Portugal Greece Ireland
Structured Finance
Mortgage and Housing Market Outlook
January 2013 5
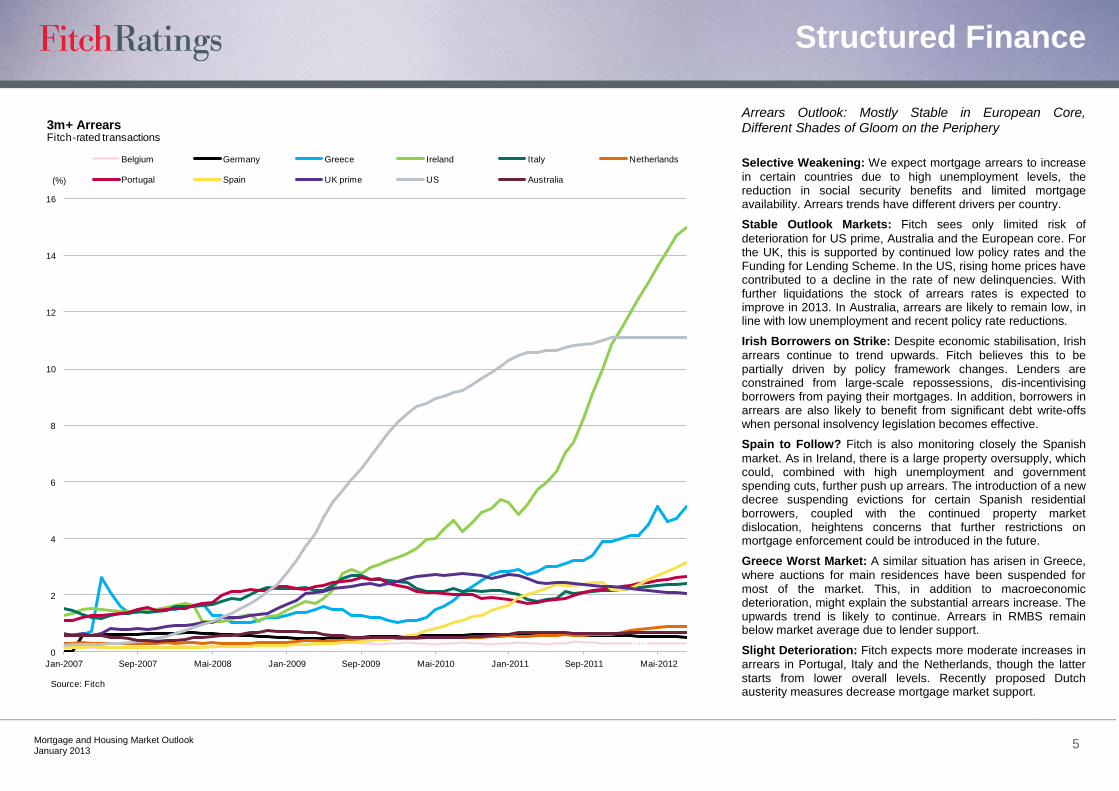
Arrears Outlook: Mostly Stable in European Core, Different Shades of Gloom on the Periphery
Selective Weakening: We expect mortgage arrears to increase
in certain countries due to high unemployment levels, the reduction in social security benefits and limited mortgage availability. Arrears trends have different drivers per country.
Stable Outlook Markets: Fitch sees only limited risk of
deterioration for US prime, Australia and the European core. For the UK, this is supported by continued low policy rates and the Funding for Lending Scheme. In the US, rising home prices have contributed to a decline in the rate of new delinquencies. With further liquidations the stock of arrears rates is expected to improve in 2013. In Australia, arrears are likely to remain low, in line with low unemployment and recent policy rate reductions.
Irish Borrowers on Strike: Despite economic stabilisation, Irish
arrears continue to trend upwards. Fitch believes this to be partially driven by policy framework changes. Lenders are constrained from large-scale repossessions, dis-incentivising borrowers from paying their mortgages. In addition, borrowers in arrears are also likely to benefit from significant debt write-offs when personal insolvency legislation becomes effective.
Spain to Follow? Fitch is also monitoring closely the Spanish
market. As in Ireland, there is a large property oversupply, which could, combined with high unemployment and government spending cuts, further push up arrears. The introduction of a new decree suspending evictions for certain Spanish residential borrowers, coupled with the continued property market dislocation, heightens concerns that further restrictions on mortgage enforcement could be introduced in the future.
Greece Worst Market: A similar situation has arisen in Greece,
where auctions for main residences have been suspended for most of the market. This, in addition to macroeconomic deterioration, might explain the substantial arrears increase. The upwards trend is likely to continue. Arrears in RMBS remain below market average due to lender support.
Slight Deterioration: Fitch expects more moderate increases in
arrears in Portugal, Italy and the Netherlands, though the latter starts from lower overall levels. Recently proposed Dutch austerity measures decrease mortgage market support.
0
2
4
6
8
10
12
14
16
Jan-2007 Sep-2007 Mai-2008 Jan-2009 Sep-2009 Mai-2010 Jan-2011 Sep-2011 Mai-2012
Belgium Germany Greece Ireland Italy Netherlands
Portugal Spain UK prime US Australia(%)
Source: Fitch
3m+ ArrearsFitch-rated transactions
Structured Finance
Mortgage and Housing Market Outlook
January 2013 6
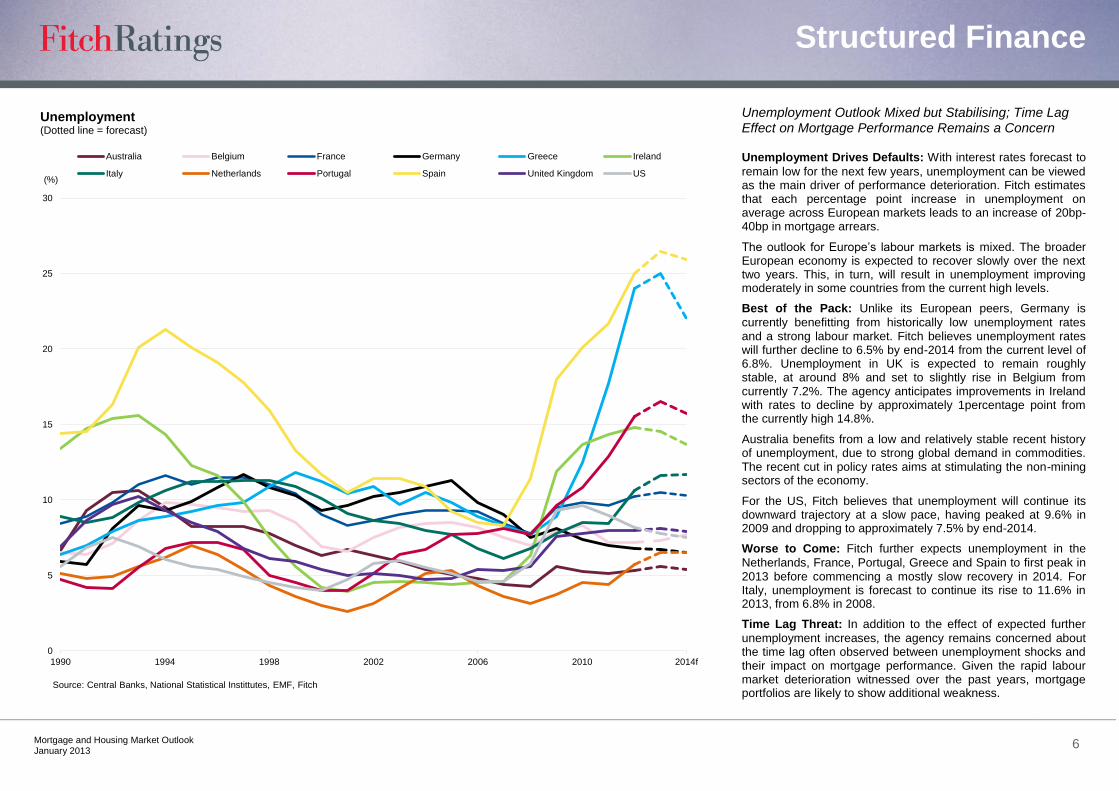
Unemployment Outlook Mixed but Stabilising; Time Lag Effect on Mortgage Performance Remains a Concern Unemployment Drives Defaults: With interest rates forecast to
remain low for the next few years, unemployment can be viewed as the main driver of performance deterioration. Fitch estimates that each percentage point increase in unemployment on average across European markets leads to an increase of 20bp-40bp in mortgage arrears.
The outlook for Europe‘s labour markets is mixed. The broader European economy is expected to recover slowly over the next two years. This, in turn, will result in unemployment improving moderately in some countries from the current high levels.
Best of the Pack: Unlike its European peers, Germany is
currently benefitting from historically low unemployment rates and a strong labour market. Fitch believes unemployment rates will further decline to 6.5% by end-2014 from the current level of 6.8%. Unemployment in UK is expected to remain roughly stable, at around 8% and set to slightly rise in Belgium from currently 7.2%. The agency anticipates improvements in Ireland with rates to decline by approximately 1percentage point from the currently high 14.8%.
Australia benefits from a low and relatively stable recent history of unemployment, due to strong global demand in commodities. The recent cut in policy rates aims at stimulating the non-mining sectors of the economy.
For the US, Fitch believes that unemployment will continue its downward trajectory at a slow pace, having peaked at 9.6% in 2009 and dropping to approximately 7.5% by end-2014.
Worse to Come: Fitch further expects unemployment in the
Netherlands, France, Portugal, Greece and Spain to first peak in 2013 before commencing a mostly slow recovery in 2014. For Italy, unemployment is forecast to continue its rise to 11.6% in 2013, from 6.8% in 2008.
Time Lag Threat: In addition to the effect of expected further
unemployment increases, the agency remains concerned about the time lag often observed between unemployment shocks and their impact on mortgage performance. Given the rapid labour market deterioration witnessed over the past years, mortgage portfolios are likely to show additional weakness.
0
5
10
15
20
25
30
1990 1994 1998 2002 2006 2010 2014f
Australia Belgium France Germany Greece Ireland
Italy Netherlands Portugal Spain United Kingdom US
Source: Central Banks, National Statistical Instittutes, EMF, Fitch
Unemployment(Dotted line = forecast)
(%)
Structured Finance
Mortgage and Housing Market Outlook
January 2013 7
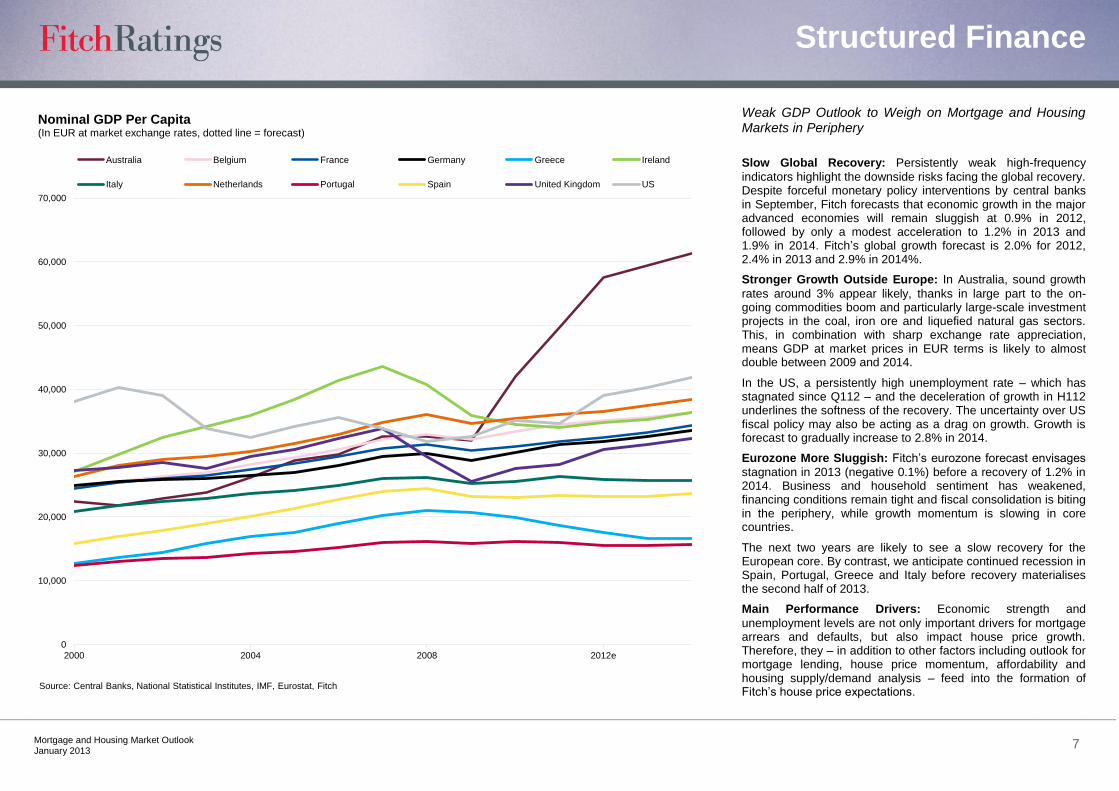
Weak GDP Outlook to Weigh on Mortgage and Housing Markets in Periphery
Slow Global Recovery: Persistently weak high-frequency
indicators highlight the downside risks facing the global recovery. Despite forceful monetary policy interventions by central banks in September, Fitch forecasts that economic growth in the major advanced economies will remain sluggish at 0.9% in 2012, followed by only a modest acceleration to 1.2% in 2013 and 1.9% in 2014. Fitch‘s global growth forecast is 2.0% for 2012, 2.4% in 2013 and 2.9% in 2014%.
Stronger Growth Outside Europe: In Australia, sound growth
rates around 3% appear likely, thanks in large part to the on-going commodities boom and particularly large-scale investment projects in the coal, iron ore and liquefied natural gas sectors. This, in combination with sharp exchange rate appreciation, means GDP at market prices in EUR terms is likely to almost double between 2009 and 2014.
In the US, a persistently high unemployment rate – which has stagnated since Q112 – and the deceleration of growth in H112 underlines the softness of the recovery. The uncertainty over US fiscal policy may also be acting as a drag on growth. Growth is forecast to gradually increase to 2.8% in 2014.
Eurozone More Sluggish: Fitch‘s eurozone forecast envisages
stagnation in 2013 (negative 0.1%) before a recovery of 1.2% in 2014. Business and household sentiment has weakened, financing conditions remain tight and fiscal consolidation is biting in the periphery, while growth momentum is slowing in core countries.
The next two years are likely to see a slow recovery for the European core. By contrast, we anticipate continued recession in Spain, Portugal, Greece and Italy before recovery materialises the second half of 2013.
Main Performance Drivers: Economic strength and
unemployment levels are not only important drivers for mortgage arrears and defaults, but also impact house price growth. Therefore, they – in addition to other factors including outlook for mortgage lending, house price momentum, affordability and housing supply/demand analysis – feed into the formation of Fitch‘s house price expectations.
0
10,000
20,000
30,000
40,000
50,000
60,000
70,000
2000 2004 2008 2012e
Australia Belgium France Germany Greece Ireland
Italy Netherlands Portugal Spain United Kingdom US
Source: Central Banks, National Statistical Institutes, IMF, Eurostat, Fitch
Nominal GDP Per Capita(In EUR at market exchange rates, dotted line = forecast)
Structured Finance
Mortgage and Housing Market Outlook
January 2013 8
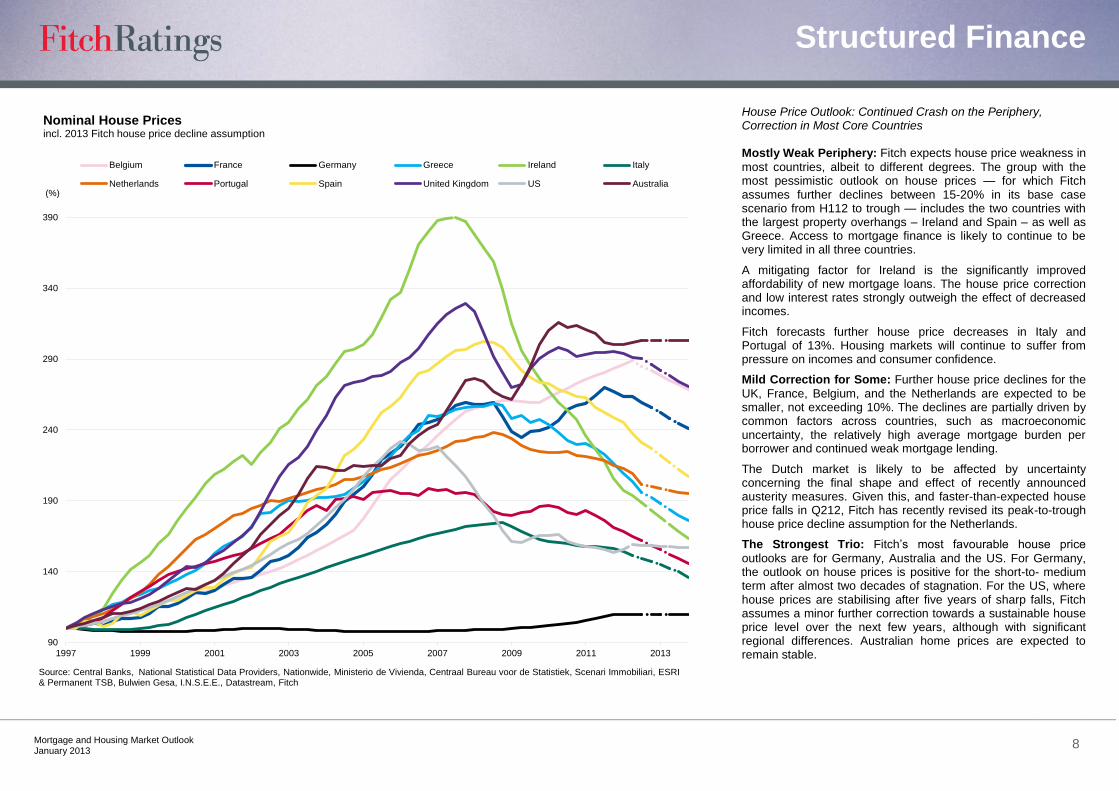
House Price Outlook: Continued Crash on the Periphery, Correction in Most Core Countries
Mostly Weak Periphery: Fitch expects house price weakness in
most countries, albeit to different degrees. The group with the most pessimistic outlook on house prices — for which Fitch assumes further declines between 15-20% in its base case scenario from H112 to trough — includes the two countries with the largest property overhangs – Ireland and Spain – as well as Greece. Access to mortgage finance is likely to continue to be very limited in all three countries.
A mitigating factor for Ireland is the significantly improved affordability of new mortgage loans. The house price correction and low interest rates strongly outweigh the effect of decreased incomes.
Fitch forecasts further house price decreases in Italy and Portugal of 13%. Housing markets will continue to suffer from pressure on incomes and consumer confidence.
Mild Correction for Some: Further house price declines for the
UK, France, Belgium, and the Netherlands are expected to be smaller, not exceeding 10%. The declines are partially driven by common factors across countries, such as macroeconomic uncertainty, the relatively high average mortgage burden per borrower and continued weak mortgage lending.
The Dutch market is likely to be affected by uncertainty concerning the final shape and effect of recently announced austerity measures. Given this, and faster-than-expected house price falls in Q212, Fitch has recently revised its peak-to-trough house price decline assumption for the Netherlands.
The Strongest Trio: Fitch‘s most favourable house price
outlooks are for Germany, Australia and the US. For Germany, the outlook on house prices is positive for the short-to- medium term after almost two decades of stagnation. For the US, where house prices are stabilising after five years of sharp falls, Fitch assumes a minor further correction towards a sustainable house price level over the next few years, although with significant regional differences. Australian home prices are expected to remain stable.
90
140
190
240
290
340
390
1997 1999 2001 2003 2005 2007 2009 2011 2013
Belgium France Germany Greece Ireland Italy
Netherlands Portugal Spain United Kingdom US Australia(%)
Source: Central Banks, National Statistical Data Providers, Nationwide, Ministerio de Vivienda, Centraal Bureau voor de Statistiek, Scenari Immobiliari, ESRI & Permanent TSB, Bulwien Gesa, I.N.S.E.E., Datastream, Fitch
Nominal House Pricesincl. 2013 Fitch house price decline assumption
Structured Finance
Mortgage and Housing Market Outlook
January 2013 9
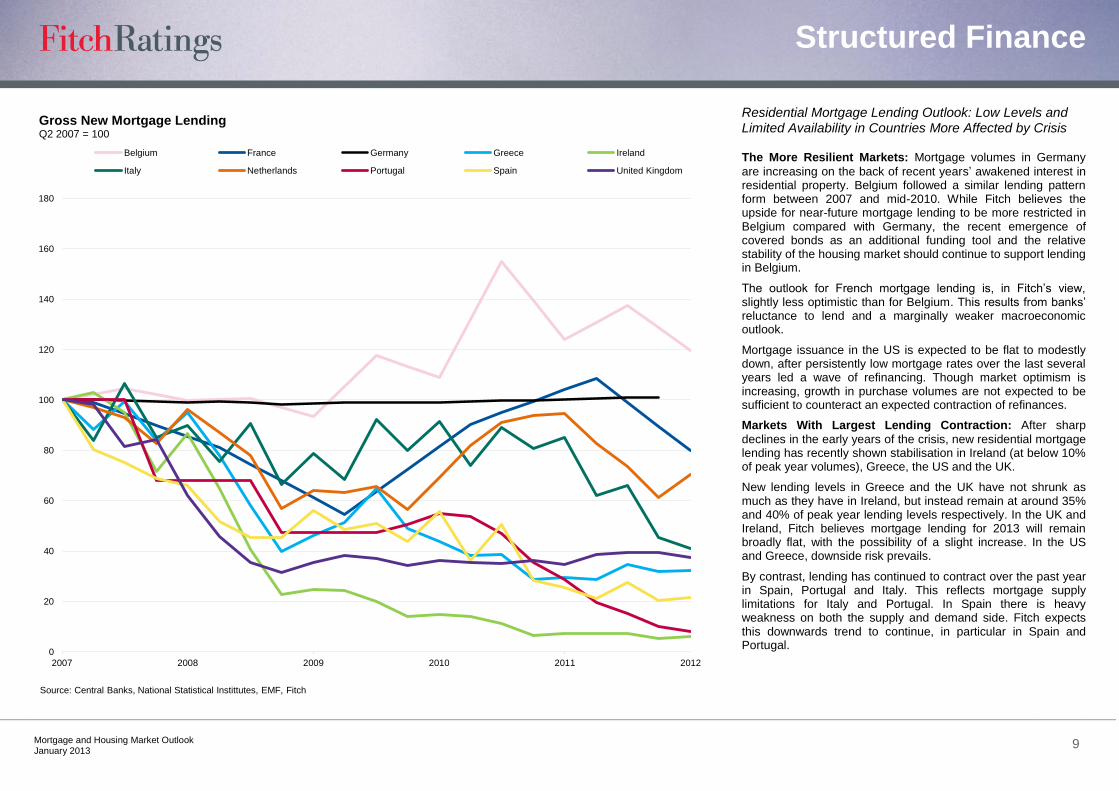
Residential Mortgage Lending Outlook: Low Levels and Limited Availability in Countries More Affected by Crisis The More Resilient Markets: Mortgage volumes in Germany
are increasing on the back of recent years‘ awakened interest in residential property. Belgium followed a similar lending pattern form between 2007 and mid-2010. While Fitch believes the upside for near-future mortgage lending to be more restricted in Belgium compared with Germany, the recent emergence of covered bonds as an additional funding tool and the relative stability of the housing market should continue to support lending in Belgium.
The outlook for French mortgage lending is, in Fitch‘s view, slightly less optimistic than for Belgium. This results from banks‘ reluctance to lend and a marginally weaker macroeconomic outlook.
Mortgage issuance in the US is expected to be flat to modestly down, after persistently low mortgage rates over the last several years led a wave of refinancing. Though market optimism is increasing, growth in purchase volumes are not expected to be sufficient to counteract an expected contraction of refinances.
Markets With Largest Lending Contraction: After sharp
declines in the early years of the crisis, new residential mortgage lending has recently shown stabilisation in Ireland (at below 10% of peak year volumes), Greece, the US and the UK.
New lending levels in Greece and the UK have not shrunk as much as they have in Ireland, but instead remain at around 35% and 40% of peak year lending levels respectively. In the UK and Ireland, Fitch believes mortgage lending for 2013 will remain broadly flat, with the possibility of a slight increase. In the US and Greece, downside risk prevails.
By contrast, lending has continued to contract over the past year in Spain, Portugal and Italy. This reflects mortgage supply limitations for Italy and Portugal. In Spain there is heavy weakness on both the supply and demand side. Fitch expects this downwards trend to continue, in particular in Spain and Portugal.
0
20
40
60
80
100
120
140
160
180
2007 2008 2009 2010 2011 2012
Belgium France Germany Greece Ireland
Italy Netherlands Portugal Spain United Kingdom
Source: Central Banks, National Statistical Instittutes, EMF, Fitch
Gross New Mortgage LendingQ2 2007 = 100
Structured Finance
Mortgage and Housing Market Outlook
January 2013 10
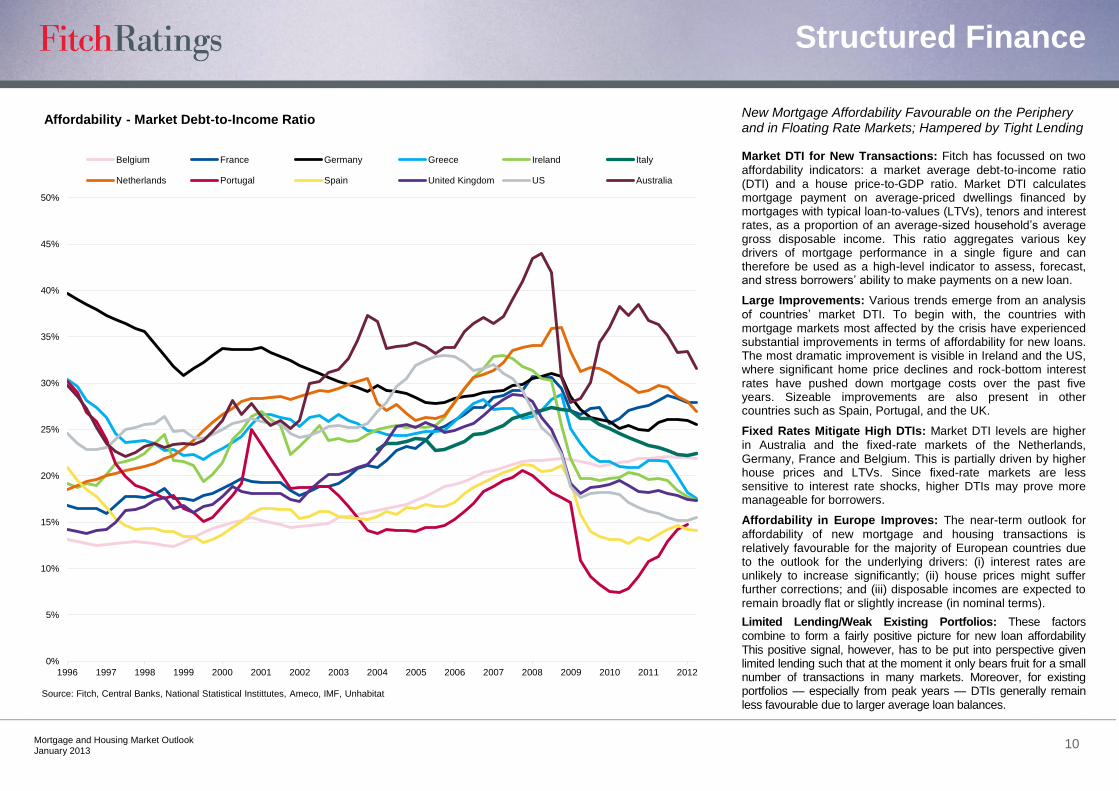
New Mortgage Affordability Favourable on the Periphery and in Floating Rate Markets; Hampered by Tight Lending Market DTI for New Transactions: Fitch has focussed on two
affordability indicators: a market average debt-to-income ratio (DTI) and a house price-to-GDP ratio. Market DTI calculates mortgage payment on average-priced dwellings financed by mortgages with typical loan-to-values (LTVs), tenors and interest rates, as a proportion of an average-sized household‘s average gross disposable income. This ratio aggregates various key drivers of mortgage performance in a single figure and can therefore be used as a high-level indicator to assess, forecast, and stress borrowers‘ ability to make payments on a new loan.
Large Improvements: Various trends emerge from an analysis
of countries‘ market DTI. To begin with, the countries with mortgage markets most affected by the crisis have experienced substantial improvements in terms of affordability for new loans. The most dramatic improvement is visible in Ireland and the US, where significant home price declines and rock-bottom interest rates have pushed down mortgage costs over the past five years. Sizeable improvements are also present in other countries such as Spain, Portugal, and the UK.
Fixed Rates Mitigate High DTIs: Market DTI levels are higher
in Australia and the fixed-rate markets of the Netherlands, Germany, France and Belgium. This is partially driven by higher house prices and LTVs. Since fixed-rate markets are less sensitive to interest rate shocks, higher DTIs may prove more manageable for borrowers.
Affordability in Europe Improves: The near-term outlook for
affordability of new mortgage and housing transactions is relatively favourable for the majority of European countries due to the outlook for the underlying drivers: (i) interest rates are unlikely to increase significantly; (ii) house prices might suffer further corrections; and (iii) disposable incomes are expected to remain broadly flat or slightly increase (in nominal terms).
Limited Lending/Weak Existing Portfolios: These factors
combine to form a fairly positive picture for new loan affordability This positive signal, however, has to be put into perspective given limited lending such that at the moment it only bears fruit for a small number of transactions in many markets. Moreover, for existing portfolios — especially from peak years — DTIs generally remain less favourable due to larger average loan balances.
0%
5%
10%
15%
20%
25%
30%
35%
40%
45%
50%
1996 1997 1998 1999 2000 2001 2002 2003 2004 2005 2006 2007 2008 2009 2010 2011 2012
Belgium France Germany Greece Ireland Italy
Netherlands Portugal Spain United Kingdom US Australia
Source: Fitch, Central Banks, National Statistical Instittutes, Ameco, IMF, Unhabitat
Affordability - Market Debt-to-Income Ratio
Structured Finance
Mortgage and Housing Market Outlook
January 2013 11
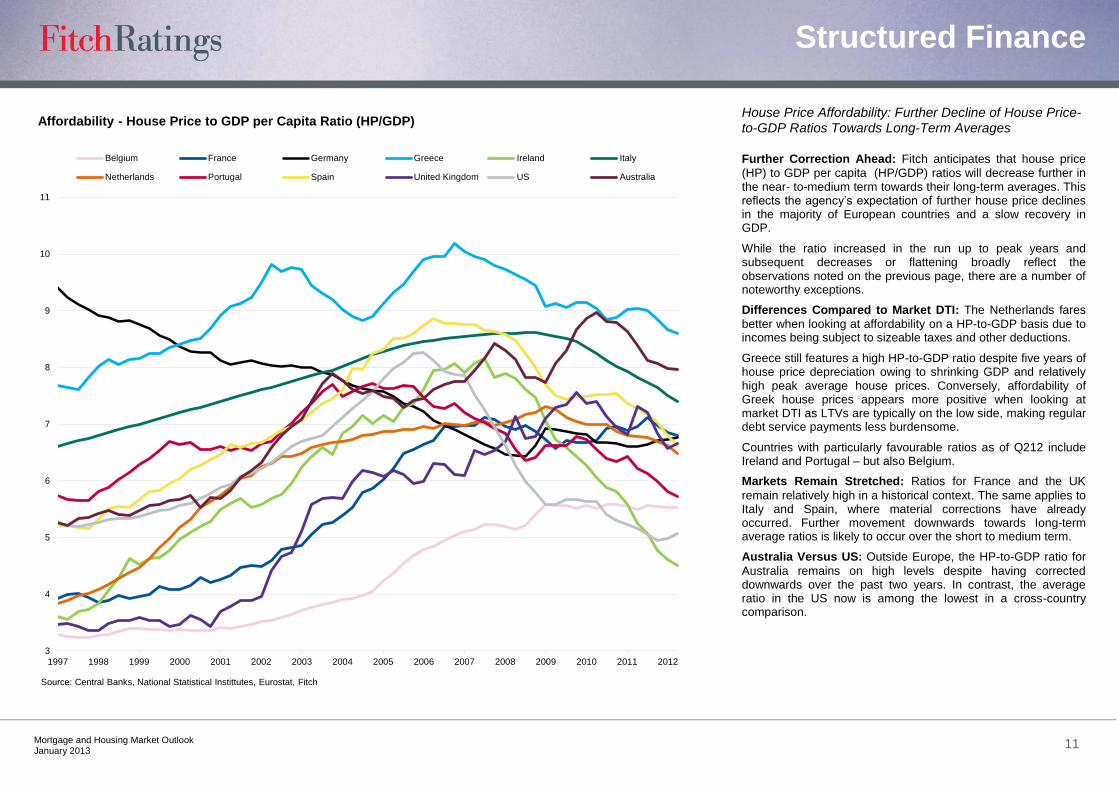
House Price Affordability: Further Decline of House Price-to-GDP Ratios Towards Long-Term Averages
Further Correction Ahead: Fitch anticipates that house price
(HP) to GDP per capita (HP/GDP) ratios will decrease further in the near- to-medium term towards their long-term averages. This reflects the agency‘s expectation of further house price declines in the majority of European countries and a slow recovery in GDP.
While the ratio increased in the run up to peak years and subsequent decreases or flattening broadly reflect the observations noted on the previous page, there are a number of noteworthy exceptions.
Differences Compared to Market DTI: The Netherlands fares
better when looking at affordability on a HP-to-GDP basis due to incomes being subject to sizeable taxes and other deductions.
Greece still features a high HP-to-GDP ratio despite five years of house price depreciation owing to shrinking GDP and relatively high peak average house prices. Conversely, affordability of Greek house prices appears more positive when looking at market DTI as LTVs are typically on the low side, making regular debt service payments less burdensome.
Countries with particularly favourable ratios as of Q212 include Ireland and Portugal – but also Belgium.
Markets Remain Stretched: Ratios for France and the UK
remain relatively high in a historical context. The same applies to Italy and Spain, where material corrections have already occurred. Further movement downwards towards long-term average ratios is likely to occur over the short to medium term.
Australia Versus US: Outside Europe, the HP-to-GDP ratio for
Australia remains on high levels despite having corrected downwards over the past two years. In contrast, the average ratio in the US now is among the lowest in a cross-country comparison.
3
4
5
6
7
8
9
10
11
1997 1998 1999 2000 2001 2002 2003 2004 2005 2006 2007 2008 2009 2010 2011 2012
Belgium France Germany Greece Ireland Italy
Netherlands Portugal Spain United Kingdom US Australia
Source: Central Banks, National Statistical Instittutes, Eurostat, Fitch
Affordability - House Price to GDP per Capita Ratio (HP/GDP)
Structured Finance
Mortgage and Housing Market Outlook
January 2013 12
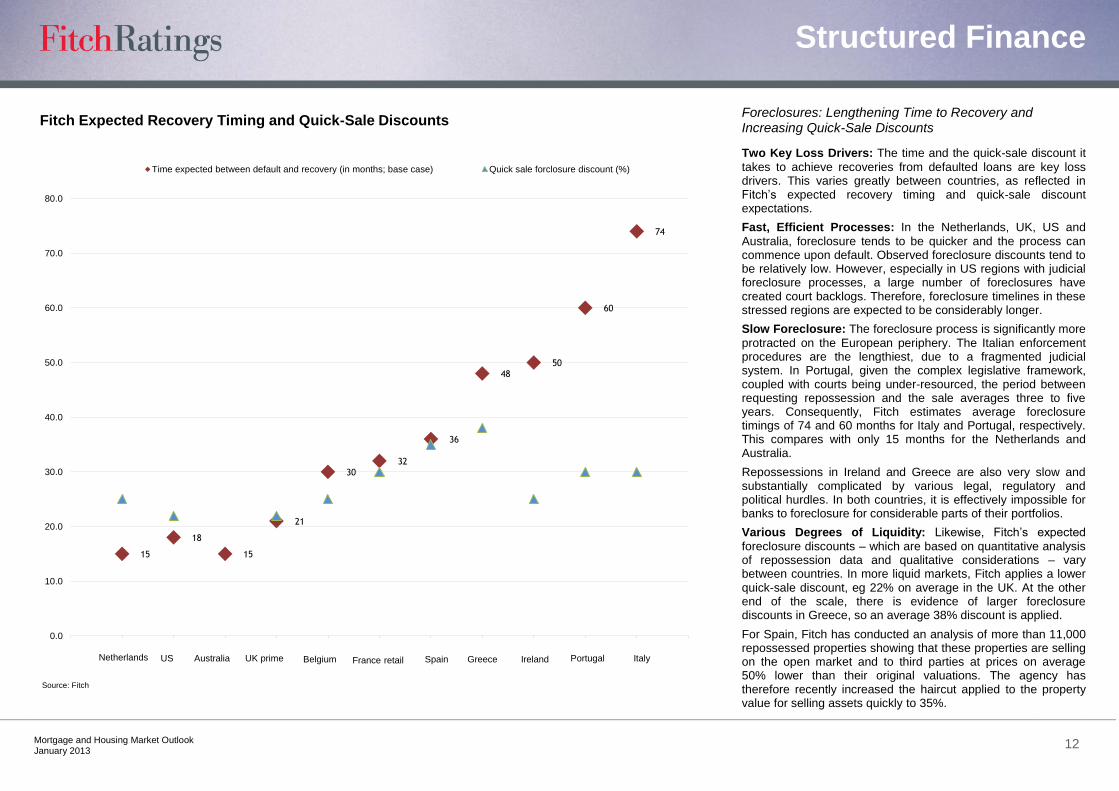
Foreclosures: Lengthening Time to Recovery and Increasing Quick-Sale Discounts
Two Key Loss Drivers: The time and the quick-sale discount it
takes to achieve recoveries from defaulted loans are key loss drivers. This varies greatly between countries, as reflected in Fitch‘s expected recovery timing and quick-sale discount expectations.
Fast, Efficient Processes: In the Netherlands, UK, US and
Australia, foreclosure tends to be quicker and the process can commence upon default. Observed foreclosure discounts tend to be relatively low. However, especially in US regions with judicial foreclosure processes, a large number of foreclosures have created court backlogs. Therefore, foreclosure timelines in these stressed regions are expected to be considerably longer.
Slow Foreclosure: The foreclosure process is significantly more
protracted on the European periphery. The Italian enforcement procedures are the lengthiest, due to a fragmented judicial system. In Portugal, given the complex legislative framework, coupled with courts being under-resourced, the period between requesting repossession and the sale averages three to five years. Consequently, Fitch estimates average foreclosure timings of 74 and 60 months for Italy and Portugal, respectively. This compares with only 15 months for the Netherlands and Australia.
Repossessions in Ireland and Greece are also very slow and substantially complicated by various legal, regulatory and political hurdles. In both countries, it is effectively impossible for banks to foreclosure for considerable parts of their portfolios.
Various Degrees of Liquidity: Likewise, Fitch‘s expected
foreclosure discounts – which are based on quantitative analysis of repossession data and qualitative considerations – vary between countries. In more liquid markets, Fitch applies a lower quick-sale discount, eg 22% on average in the UK. At the other end of the scale, there is evidence of larger foreclosure discounts in Greece, so an average 38% discount is applied.
For Spain, Fitch has conducted an analysis of more than 11,000 repossessed properties showing that these properties are selling on the open market and to third parties at prices on average 50% lower than their original valuations. The agency has therefore recently increased the haircut applied to the property value for selling assets quickly to 35%.
15
18
15
21
30
32
36
48
50
60
74
0.0
10.0
20.0
30.0
40.0
50.0
60.0
70.0
80.0
Time expected between default and recovery (in months; base case) Quick sale forclosure discount (%)
Source: Fitch
Fitch Expected Recovery Timing and Quick-Sale Discounts
Netherlands US Australia UK prime Belgium France retail Spain Greece Ireland Portugal Italy
Structured Finance
Mortgage and Housing Market Outlook
January 2013 13
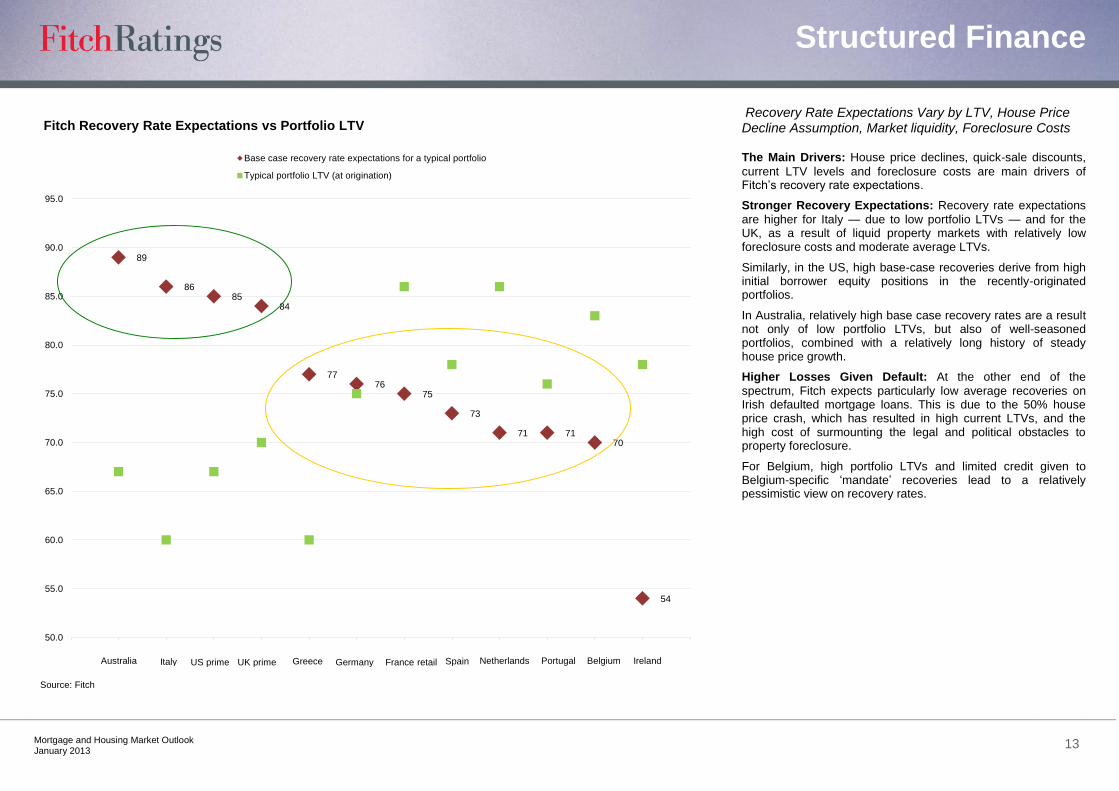
Recovery Rate Expectations Vary by LTV, House Price Decline Assumption, Market liquidity, Foreclosure Costs The Main Drivers: House price declines, quick-sale discounts,
current LTV levels and foreclosure costs are main drivers of Fitch‘s recovery rate expectations.
Stronger Recovery Expectations: Recovery rate expectations
are higher for Italy — due to low portfolio LTVs — and for the UK, as a result of liquid property markets with relatively low foreclosure costs and moderate average LTVs.
Similarly, in the US, high base-case recoveries derive from high initial borrower equity positions in the recently-originated portfolios.
In Australia, relatively high base case recovery rates are a result not only of low portfolio LTVs, but also of well-seasoned portfolios, combined with a relatively long history of steady house price growth.
Higher Losses Given Default: At the other end of the
spectrum, Fitch expects particularly low average recoveries on Irish defaulted mortgage loans. This is due to the 50% house price crash, which has resulted in high current LTVs, and the high cost of surmounting the legal and political obstacles to property foreclosure.
For Belgium, high portfolio LTVs and limited credit given to Belgium-specific ‗mandate‘ recoveries lead to a relatively pessimistic view on recovery rates.
89
86 85
84
77 76
75
73
71 71 70
54
50.0
55.0
60.0
65.0
70.0
75.0
80.0
85.0
90.0
95.0
Base case recovery rate expectations for a typical portfolio
Typical portfolio LTV (at origination)
Source: Fitch
Fitch Recovery Rate Expectations vs Portfolio LTV
Australia Italy US prime UK prime Greece Germany France retail Spain Netherlands Portugal Belgium Ireland
Structured Finance
Mortgage and Housing Market Outlook
January 2013 14
United Kingdom
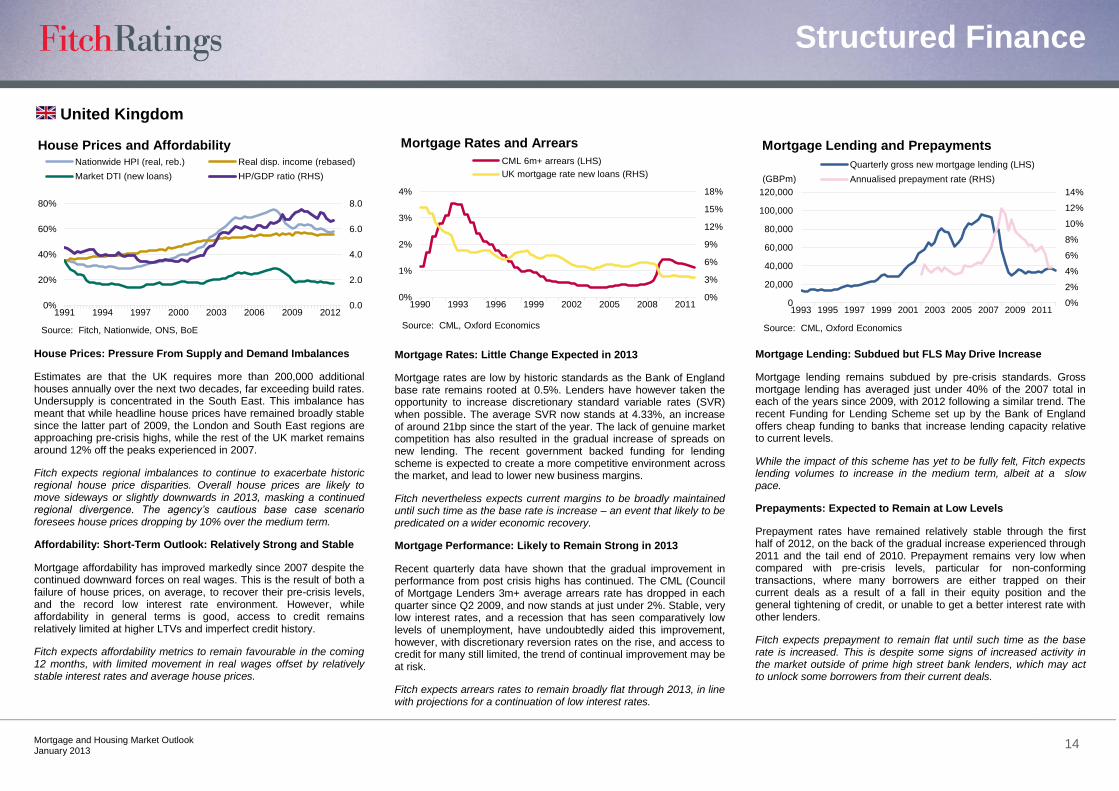
House Prices: Pressure From Supply and Demand Imbalances
Estimates are that the UK requires more than 200,000 additional houses annually over the next two decades, far exceeding build rates. Undersupply is concentrated in the South East. This imbalance has meant that while headline house prices have remained broadly stable since the latter part of 2009, the London and South East regions are approaching pre-crisis highs, while the rest of the UK market remains around 12% off the peaks experienced in 2007.
Fitch expects regional imbalances to continue to exacerbate historic regional house price disparities. Overall house prices are likely to move sideways or slightly downwards in 2013, masking a continued regional divergence. The agency’s cautious base case scenario foresees house prices dropping by 10% over the medium term.
Affordability: Short-Term Outlook: Relatively Strong and Stable
Mortgage affordability has improved markedly since 2007 despite the continued downward forces on real wages. This is the result of both a failure of house prices, on average, to recover their pre-crisis levels, and the record low interest rate environment. However, while affordability in general terms is good, access to credit remains relatively limited at higher LTVs and imperfect credit history.
Fitch expects affordability metrics to remain favourable in the coming 12 months, with limited movement in real wages offset by relatively stable interest rates and average house prices.
Mortgage Rates: Little Change Expected in 2013
Mortgage rates are low by historic standards as the Bank of England base rate remains rooted at 0.5%. Lenders have however taken the opportunity to increase discretionary standard variable rates (SVR) when possible. The average SVR now stands at 4.33%, an increase of around 21bp since the start of the year. The lack of genuine market competition has also resulted in the gradual increase of spreads on new lending. The recent government backed funding for lending scheme is expected to create a more competitive environment across the market, and lead to lower new business margins.
Fitch nevertheless expects current margins to be broadly maintained until such time as the base rate is increase – an event that likely to be predicated on a wider economic recovery.
Mortgage Performance: Likely to Remain Strong in 2013
Recent quarterly data have shown that the gradual improvement in performance from post crisis highs has continued. The CML (Council of Mortgage Lenders 3m+ average arrears rate has dropped in each quarter since Q2 2009, and now stands at just under 2%. Stable, very low interest rates, and a recession that has seen comparatively low levels of unemployment, have undoubtedly aided this improvement, however, with discretionary reversion rates on the rise, and access to credit for many still limited, the trend of continual improvement may be at risk.
Fitch expects arrears rates to remain broadly flat through 2013, in line with projections for a continuation of low interest rates.
Mortgage Lending: Subdued but FLS May Drive Increase
Mortgage lending remains subdued by pre-crisis standards. Gross mortgage lending has averaged just under 40% of the 2007 total in each of the years since 2009, with 2012 following a similar trend. The recent Funding for Lending Scheme set up by the Bank of England offers cheap funding to banks that increase lending capacity relative to current levels.
While the impact of this scheme has yet to be fully felt, Fitch expects lending volumes to increase in the medium term, albeit at a slow pace.
Prepayments: Expected to Remain at Low Levels
Prepayment rates have remained relatively stable through the first half of 2012, on the back of the gradual increase experienced through 2011 and the tail end of 2010. Prepayment remains very low when compared with pre-crisis levels, particular for non-conforming transactions, where many borrowers are either trapped on their current deals as a result of a fall in their equity position and the general tightening of credit, or unable to get a better interest rate with other lenders.
Fitch expects prepayment to remain flat until such time as the base rate is increased. This is despite some signs of increased activity in the market outside of prime high street bank lenders, which may act to unlock some borrowers from their current deals.
0.0
2.0
4.0
6.0
8.0
0%
20%
40%
60%
80%
1991 1994 1997 2000 2003 2006 2009 2012
Nationwide HPI (real, reb.) Real disp. income (rebased)
Market DTI (new loans) HP/GDP ratio (RHS)
House Prices and Affordability
Source: Fitch, Nationwide, ONS, BoE
0%
3%
6%
9%
12%
15%
18%
0%
1%
2%
3%
4%
1990 1993 1996 1999 2002 2005 2008 2011
CML 6m+ arrears (LHS)
UK mortgage rate new loans (RHS)
Mortgage Rates and Arrears
Source: CML, Oxford Economics
0%
2%
4%
6%
8%
10%
12%
14%
0
20,000
40,000
60,000
80,000
100,000
120,000
1993 1995 1997 1999 2001 2003 2005 2007 2009 2011
Quarterly gross new mortgage lending (LHS)
Annualised prepayment rate (RHS)(GBPm)
Mortgage Lending and Prepayments
Source: CML, Oxford Economics
Structured Finance
Mortgage and Housing Market Outlook
January 2013 15
Netherlands
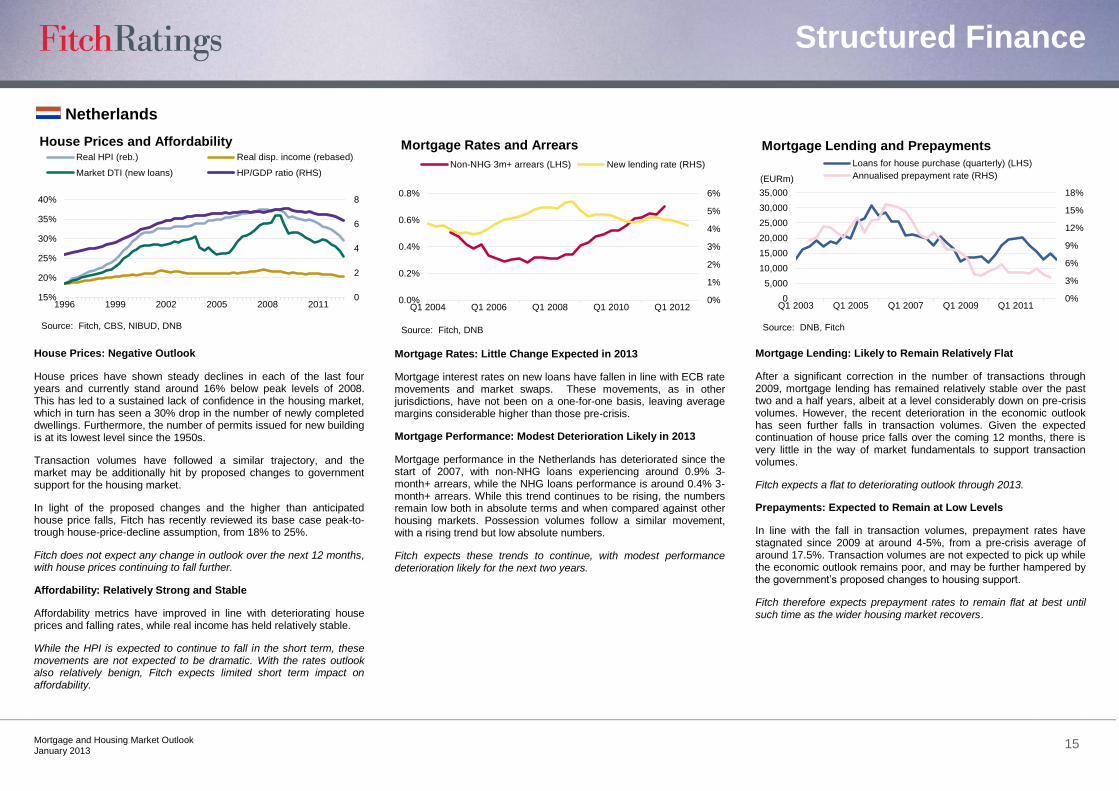
House Prices: Negative Outlook
House prices have shown steady declines in each of the last four years and currently stand around 16% below peak levels of 2008. This has led to a sustained lack of confidence in the housing market, which in turn has seen a 30% drop in the number of newly completed dwellings. Furthermore, the number of permits issued for new building is at its lowest level since the 1950s.
Transaction volumes have followed a similar trajectory, and the market may be additionally hit by proposed changes to government support for the housing market.
In light of the proposed changes and the higher than anticipated house price falls, Fitch has recently reviewed its base case peak-to-trough house-price-decline assumption, from 18% to 25%.
Fitch does not expect any change in outlook over the next 12 months, with house prices continuing to fall further.
Affordability: Relatively Strong and Stable
Affordability metrics have improved in line with deteriorating house prices and falling rates, while real income has held relatively stable.
While the HPI is expected to continue to fall in the short term, these movements are not expected to be dramatic. With the rates outlook also relatively benign, Fitch expects limited short term impact on affordability.
Mortgage Rates: Little Change Expected in 2013
Mortgage interest rates on new loans have fallen in line with ECB rate movements and market swaps. These movements, as in other jurisdictions, have not been on a one-for-one basis, leaving average margins considerable higher than those pre-crisis.
Mortgage Performance: Modest Deterioration Likely in 2013
Mortgage performance in the Netherlands has deteriorated since the start of 2007, with non-NHG loans experiencing around 0.9% 3-month+ arrears, while the NHG loans performance is around 0.4% 3-month+ arrears. While this trend continues to be rising, the numbers remain low both in absolute terms and when compared against other housing markets. Possession volumes follow a similar movement, with a rising trend but low absolute numbers.
Fitch expects these trends to continue, with modest performance deterioration likely for the next two years.
Mortgage Lending: Likely to Remain Relatively Flat
After a significant correction in the number of transactions through 2009, mortgage lending has remained relatively stable over the past two and a half years, albeit at a level considerably down on pre-crisis volumes. However, the recent deterioration in the economic outlook has seen further falls in transaction volumes. Given the expected continuation of house price falls over the coming 12 months, there is very little in the way of market fundamentals to support transaction volumes.
Fitch expects a flat to deteriorating outlook through 2013.
Prepayments: Expected to Remain at Low Levels
In line with the fall in transaction volumes, prepayment rates have stagnated since 2009 at around 4-5%, from a pre-crisis average of around 17.5%. Transaction volumes are not expected to pick up while the economic outlook remains poor, and may be further hampered by the government‘s proposed changes to housing support.
Fitch therefore expects prepayment rates to remain flat at best until such time as the wider housing market recovers.
0
2
4
6
8
15%
20%
25%
30%
35%
40%
1996 1999 2002 2005 2008 2011
Real HPI (reb.) Real disp. income (rebased)
Market DTI (new loans) HP/GDP ratio (RHS)
House Prices and Affordability
Source: Fitch, CBS, NIBUD, DNB
0%
1%
2%
3%
4%
5%
6%
0.0%
0.2%
0.4%
0.6%
0.8%
Q1 2004 Q1 2006 Q1 2008 Q1 2010 Q1 2012
Non-NHG 3m+ arrears (LHS) New lending rate (RHS)
Mortgage Rates and Arrears
Source: Fitch, DNB
0%
3%
6%
9%
12%
15%
18%
0
5,000
10,000
15,000
20,000
25,000
30,000
35,000
Q1 2003 Q1 2005 Q1 2007 Q1 2009 Q1 2011
Loans for house purchase (quarterly) (LHS)
Annualised prepayment rate (RHS)
Mortgage Lending and Prepayments
Source: DNB, Fitch
(EURm)
Structured Finance
Mortgage and Housing Market Outlook
January 2013 16
United States
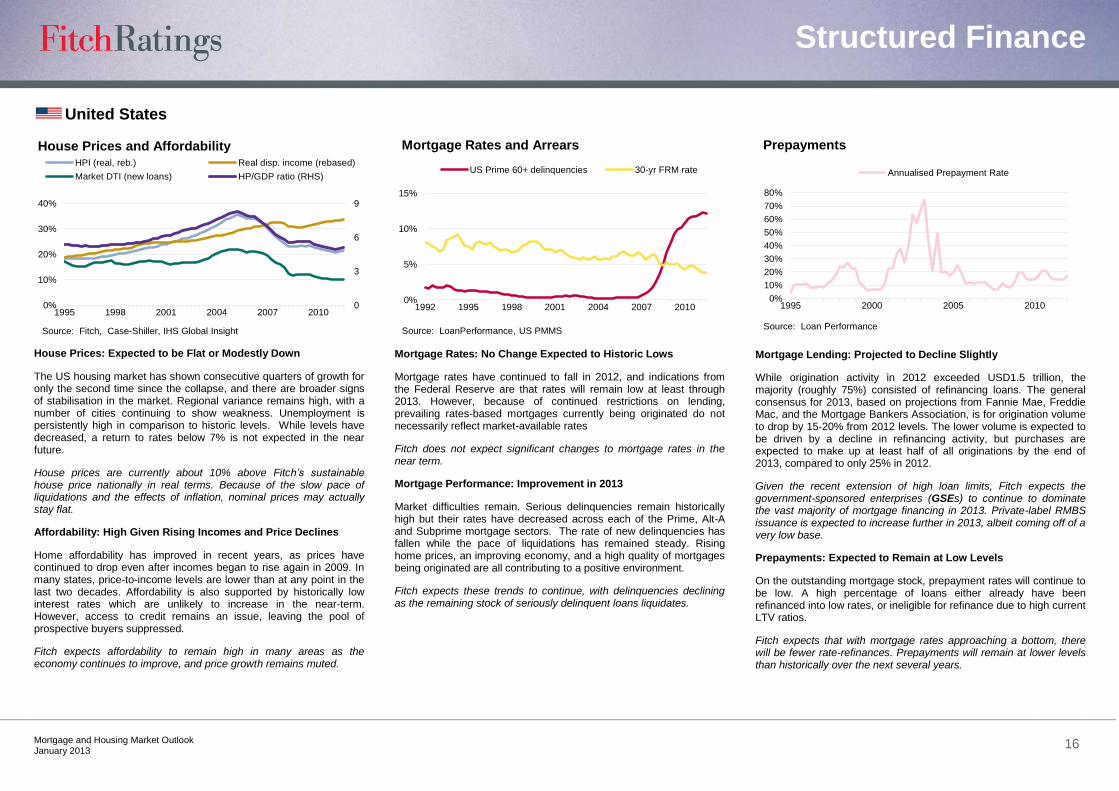
House Prices: Expected to be Flat or Modestly Down
The US housing market has shown consecutive quarters of growth for only the second time since the collapse, and there are broader signs of stabilisation in the market. Regional variance remains high, with a number of cities continuing to show weakness. Unemployment is persistently high in comparison to historic levels. While levels have decreased, a return to rates below 7% is not expected in the near future.
House prices are currently about 10% above Fitch’s sustainable house price nationally in real terms. Because of the slow pace of liquidations and the effects of inflation, nominal prices may actually stay flat.
Affordability: High Given Rising Incomes and Price Declines
Home affordability has improved in recent years, as prices have continued to drop even after incomes began to rise again in 2009. In many states, price-to-income levels are lower than at any point in the last two decades. Affordability is also supported by historically low interest rates which are unlikely to increase in the near-term. However, access to credit remains an issue, leaving the pool of prospective buyers suppressed.
Fitch expects affordability to remain high in many areas as the economy continues to improve, and price growth remains muted.
Mortgage Rates: No Change Expected to Historic Lows
Mortgage rates have continued to fall in 2012, and indications from the Federal Reserve are that rates will remain low at least through 2013. However, because of continued restrictions on lending, prevailing rates-based mortgages currently being originated do not necessarily reflect market-available rates
Fitch does not expect significant changes to mortgage rates in the near term.
Mortgage Performance: Improvement in 2013
Market difficulties remain. Serious delinquencies remain historically high but their rates have decreased across each of the Prime, Alt-A and Subprime mortgage sectors. The rate of new delinquencies has fallen while the pace of liquidations has remained steady. Rising home prices, an improving economy, and a high quality of mortgages being originated are all contributing to a positive environment.
Fitch expects these trends to continue, with delinquencies declining as the remaining stock of seriously delinquent loans liquidates.
Mortgage Lending: Projected to Decline Slightly
While origination activity in 2012 exceeded USD1.5 trillion, the majority (roughly 75%) consisted of refinancing loans. The general consensus for 2013, based on projections from Fannie Mae, Freddie Mac, and the Mortgage Bankers Association, is for origination volume to drop by 15-20% from 2012 levels. The lower volume is expected to be driven by a decline in refinancing activity, but purchases are expected to make up at least half of all originations by the end of 2013, compared to only 25% in 2012.
Given the recent extension of high loan limits, Fitch expects the government-sponsored enterprises (GSEs) to continue to dominate the vast majority of mortgage financing in 2013. Private-label RMBS issuance is expected to increase further in 2013, albeit coming off of a very low base.
Prepayments: Expected to Remain at Low Levels
On the outstanding mortgage stock, prepayment rates will continue to be low. A high percentage of loans either already have been refinanced into low rates, or ineligible for refinance due to high current LTV ratios.
Fitch expects that with mortgage rates approaching a bottom, there will be fewer rate-refinances. Prepayments will remain at lower levels than historically over the next several years.
0
3
6
9
0%
10%
20%
30%
40%
1995 1998 2001 2004 2007 2010
HPI (real, reb.) Real disp. income (rebased)
Market DTI (new loans) HP/GDP ratio (RHS)
House Prices and Affordability
Source: Fitch, Case-Shiller, IHS Global Insight
0%
5%
10%
15%
1992 1995 1998 2001 2004 2007 2010
US Prime 60+ delinquencies 30-yr FRM rate
Mortgage Rates and Arrears
Source: LoanPerformance, US PMMS
0%
10%
20%
30%
40%
50%
60%
70%
80%
1995 2000 2005 2010
Annualised Prepayment Rate
Prepayments
Source: Loan Performance
Structured Finance
Mortgage and Housing Market Outlook
January 2013 17
Australia
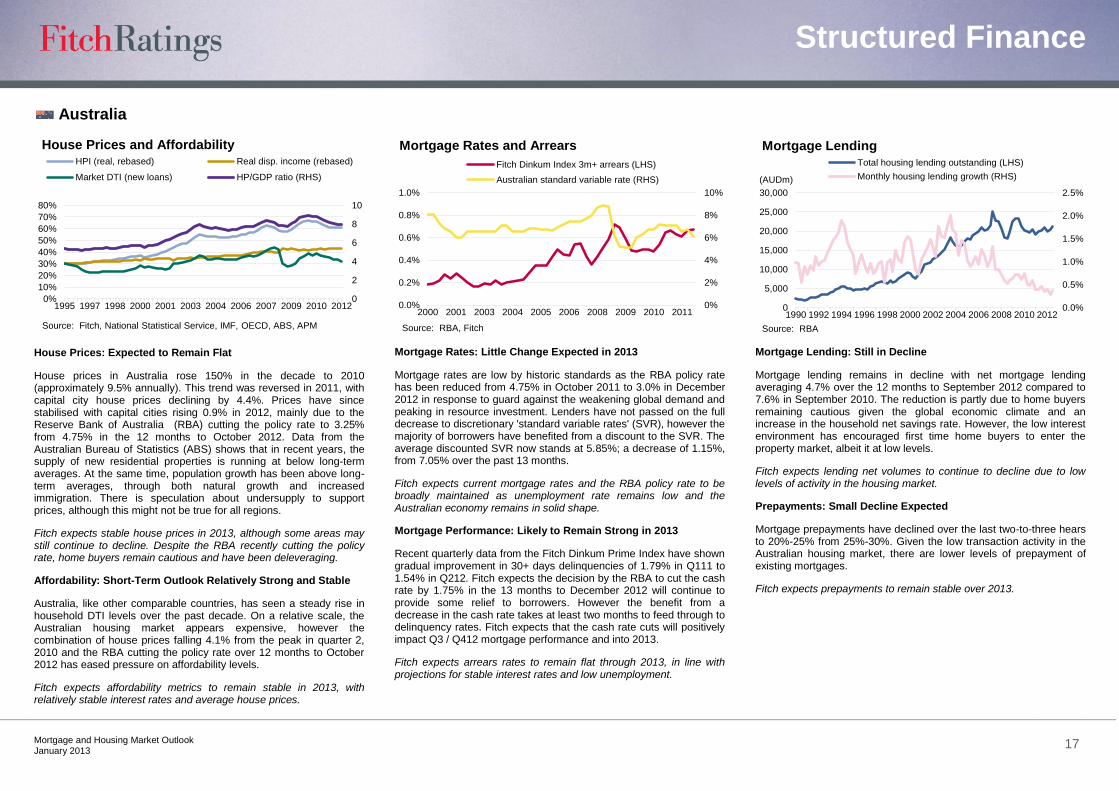
House Prices: Expected to Remain Flat
House prices in Australia rose 150% in the decade to 2010 (approximately 9.5% annually). This trend was reversed in 2011, with capital city house prices declining by 4.4%. Prices have since stabilised with capital cities rising 0.9% in 2012, mainly due to the Reserve Bank of Australia (RBA) cutting the policy rate to 3.25% from 4.75% in the 12 months to October 2012. Data from the Australian Bureau of Statistics (ABS) shows that in recent years, the supply of new residential properties is running at below long-term averages. At the same time, population growth has been above long-term averages, through both natural growth and increased immigration. There is speculation about undersupply to support prices, although this might not be true for all regions.
Fitch expects stable house prices in 2013, although some areas may still continue to decline. Despite the RBA recently cutting the policy rate, home buyers remain cautious and have been deleveraging.
Affordability: Short-Term Outlook Relatively Strong and Stable
Australia, like other comparable countries, has seen a steady rise in household DTI levels over the past decade. On a relative scale, the Australian housing market appears expensive, however the combination of house prices falling 4.1% from the peak in quarter 2, 2010 and the RBA cutting the policy rate over 12 months to October 2012 has eased pressure on affordability levels.
Fitch expects affordability metrics to remain stable in 2013, with relatively stable interest rates and average house prices.
Mortgage Rates: Little Change Expected in 2013
Mortgage rates are low by historic standards as the RBA policy rate has been reduced from 4.75% in October 2011 to 3.0% in December 2012 in response to guard against the weakening global demand and peaking in resource investment. Lenders have not passed on the full decrease to discretionary 'standard variable rates' (SVR), however the majority of borrowers have benefited from a discount to the SVR. The average discounted SVR now stands at 5.85%; a decrease of 1.15%, from 7.05% over the past 13 months.
Fitch expects current mortgage rates and the RBA policy rate to be broadly maintained as unemployment rate remains low and the Australian economy remains in solid shape.
Mortgage Performance: Likely to Remain Strong in 2013
Recent quarterly data from the Fitch Dinkum Prime Index have shown gradual improvement in 30+ days delinquencies of 1.79% in Q111 to 1.54% in Q212. Fitch expects the decision by the RBA to cut the cash rate by 1.75% in the 13 months to December 2012 will continue to provide some relief to borrowers. However the benefit from a decrease in the cash rate takes at least two months to feed through to delinquency rates. Fitch expects that the cash rate cuts will positively impact Q3 / Q412 mortgage performance and into 2013.
Fitch expects arrears rates to remain flat through 2013, in line with projections for stable interest rates and low unemployment.
Mortgage Lending: Still in Decline
Mortgage lending remains in decline with net mortgage lending averaging 4.7% over the 12 months to September 2012 compared to 7.6% in September 2010. The reduction is partly due to home buyers remaining cautious given the global economic climate and an increase in the household net savings rate. However, the low interest environment has encouraged first time home buyers to enter the property market, albeit it at low levels.
Fitch expects lending net volumes to continue to decline due to low levels of activity in the housing market.
Prepayments: Small Decline Expected
Mortgage prepayments have declined over the last two-to-three hears to 20%-25% from 25%-30%. Given the low transaction activity in the Australian housing market, there are lower levels of prepayment of existing mortgages.
Fitch expects prepayments to remain stable over 2013.
0
2
4
6
8
10
0%
10%
20%
30%
40%
50%
60%
70%
80%
1995 1997 1998 2000 2001 2003 2004 2006 2007 2009 2010 2012
HPI (real, rebased) Real disp. income (rebased)
Market DTI (new loans) HP/GDP ratio (RHS)
House Prices and Affordability
Source: Fitch, National Statistical Service, IMF, OECD, ABS, APM
0%
2%
4%
6%
8%
10%
0.0%
0.2%
0.4%
0.6%
0.8%
1.0%
2000 2001 2003 2004 2005 2006 2008 2009 2010 2011
Fitch Dinkum Index 3m+ arrears (LHS)
Australian standard variable rate (RHS)
Mortgage Rates and Arrears
Source: RBA, Fitch
0.0%
0.5%
1.0%
1.5%
2.0%
2.5%
0
5,000
10,000
15,000
20,000
25,000
30,000
1990 1992 1994 1996 1998 2000 2002 2004 2006 2008 2010 2012
Total housing lending outstanding (LHS)
Monthly housing lending growth (RHS)(AUDm)
Mortgage Lending
Source: RBA
Structured Finance
Mortgage and Housing Market Outlook
January 2013 18
Ireland
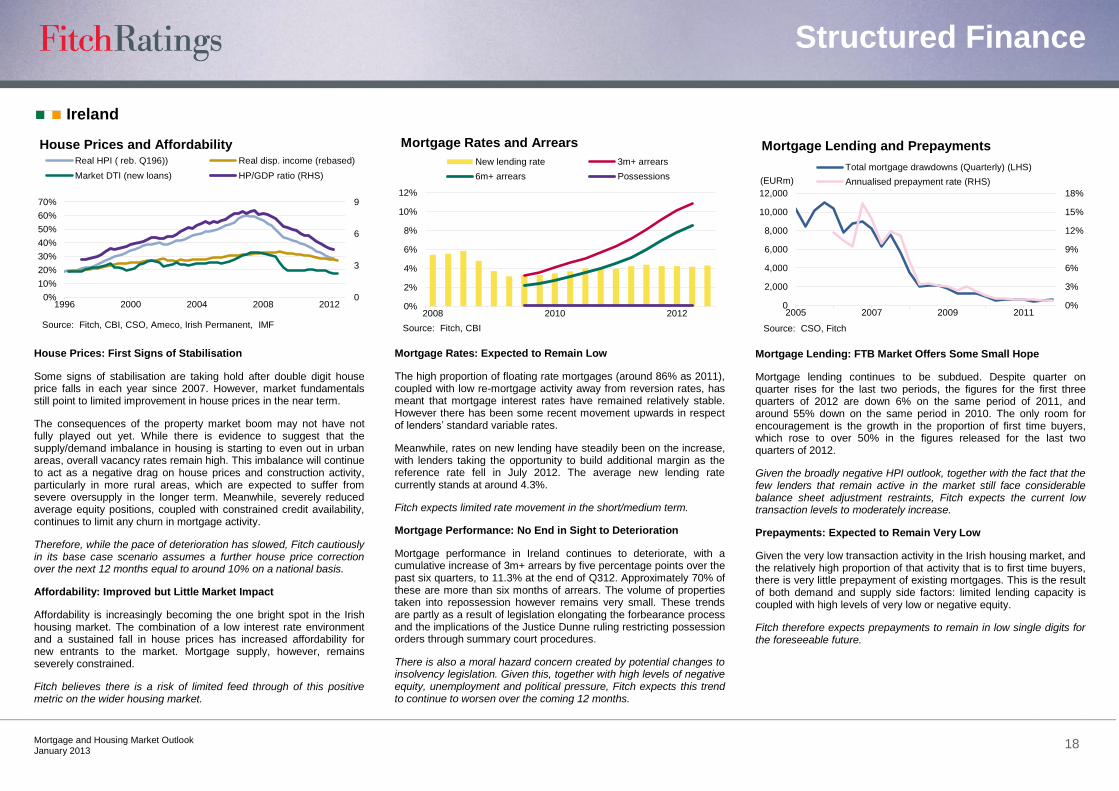
House Prices: First Signs of Stabilisation
Some signs of stabilisation are taking hold after double digit house price falls in each year since 2007. However, market fundamentals still point to limited improvement in house prices in the near term.
The consequences of the property market boom may not have not fully played out yet. While there is evidence to suggest that the supply/demand imbalance in housing is starting to even out in urban areas, overall vacancy rates remain high. This imbalance will continue to act as a negative drag on house prices and construction activity, particularly in more rural areas, which are expected to suffer from severe oversupply in the longer term. Meanwhile, severely reduced average equity positions, coupled with constrained credit availability, continues to limit any churn in mortgage activity.
Therefore, while the pace of deterioration has slowed, Fitch cautiously in its base case scenario assumes a further house price correction over the next 12 months equal to around 10% on a national basis.
Affordability: Improved but Little Market Impact
Affordability is increasingly becoming the one bright spot in the Irish housing market. The combination of a low interest rate environment and a sustained fall in house prices has increased affordability for new entrants to the market. Mortgage supply, however, remains severely constrained.
Fitch believes there is a risk of limited feed through of this positive metric on the wider housing market.
Mortgage Rates: Expected to Remain Low
The high proportion of floating rate mortgages (around 86% as 2011), coupled with low re-mortgage activity away from reversion rates, has meant that mortgage interest rates have remained relatively stable. However there has been some recent movement upwards in respect of lenders‘ standard variable rates.
Meanwhile, rates on new lending have steadily been on the increase, with lenders taking the opportunity to build additional margin as the reference rate fell in July 2012. The average new lending rate currently stands at around 4.3%.
Fitch expects limited rate movement in the short/medium term.
Mortgage Performance: No End in Sight to Deterioration
Mortgage performance in Ireland continues to deteriorate, with a cumulative increase of 3m+ arrears by five percentage points over the past six quarters, to 11.3% at the end of Q312. Approximately 70% of these are more than six months of arrears. The volume of properties taken into repossession however remains very small. These trends are partly as a result of legislation elongating the forbearance process and the implications of the Justice Dunne ruling restricting possession orders through summary court procedures.
There is also a moral hazard concern created by potential changes to insolvency legislation. Given this, together with high levels of negative equity, unemployment and political pressure, Fitch expects this trend to continue to worsen over the coming 12 months.
Mortgage Lending: FTB Market Offers Some Small Hope
Mortgage lending continues to be subdued. Despite quarter on quarter rises for the last two periods, the figures for the first three quarters of 2012 are down 6% on the same period of 2011, and around 55% down on the same period in 2010. The only room for encouragement is the growth in the proportion of first time buyers, which rose to over 50% in the figures released for the last two quarters of 2012.
Given the broadly negative HPI outlook, together with the fact that the few lenders that remain active in the market still face considerable balance sheet adjustment restraints, Fitch expects the current low transaction levels to moderately increase.
Prepayments: Expected to Remain Very Low
Given the very low transaction activity in the Irish housing market, and the relatively high proportion of that activity that is to first time buyers, there is very little prepayment of existing mortgages. This is the result of both demand and supply side factors: limited lending capacity is coupled with high levels of very low or negative equity.
Fitch therefore expects prepayments to remain in low single digits for the foreseeable future.
0
3
6
9
0%
10%
20%
30%
40%
50%
60%
70%
1996 2000 2004 2008 2012
Real HPI ( reb. Q196)) Real disp. income (rebased)
Market DTI (new loans) HP/GDP ratio (RHS)
House Prices and Affordability
Source: Fitch, CBI, CSO, Ameco, Irish Permanent, IMF
0%
2%
4%
6%
8%
10%
12%
2008 2010 2012
New lending rate 3m+ arrears
6m+ arrears Possessions
Mortgage Rates and Arrears
Source: Fitch, CBI
0%
3%
6%
9%
12%
15%
18%
0
2,000
4,000
6,000
8,000
10,000
12,000
2005 2007 2009 2011
Total mortgage drawdowns (Quarterly) (LHS)
Annualised prepayment rate (RHS)
Mortgage Lending and Prepayments
Source: CSO, Fitch
(EURm)
Structured Finance
Mortgage and Housing Market Outlook
January 2013 19
Greece
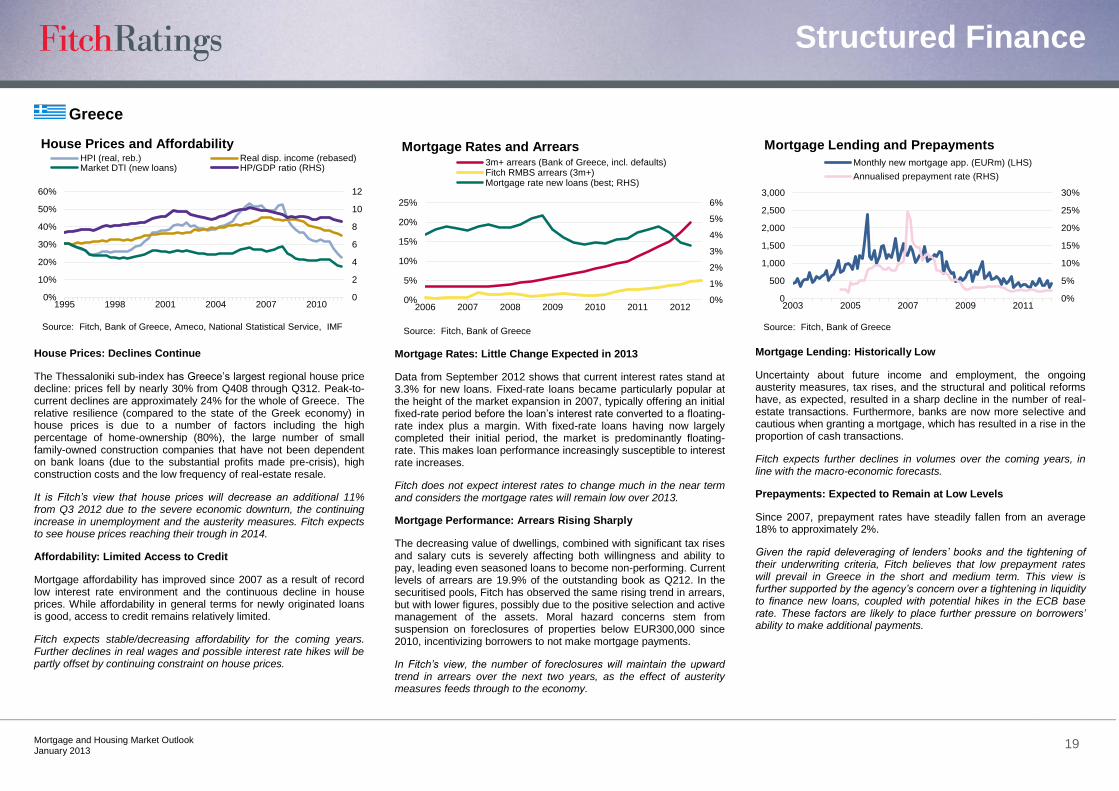
House Prices: Declines Continue
The Thessaloniki sub-index has Greece‘s largest regional house price decline: prices fell by nearly 30% from Q408 through Q312. Peak-to-current declines are approximately 24% for the whole of Greece. The relative resilience (compared to the state of the Greek economy) in house prices is due to a number of factors including the high percentage of home-ownership (80%), the large number of small family-owned construction companies that have not been dependent on bank loans (due to the substantial profits made pre-crisis), high construction costs and the low frequency of real-estate resale.
It is Fitch’s view that house prices will decrease an additional 11% from Q3 2012 due to the severe economic downturn, the continuing increase in unemployment and the austerity measures. Fitch expects to see house prices reaching their trough in 2014.
Affordability: Limited Access to Credit
Mortgage affordability has improved since 2007 as a result of record low interest rate environment and the continuous decline in house prices. While affordability in general terms for newly originated loans is good, access to credit remains relatively limited.
Fitch expects stable/decreasing affordability for the coming years. Further declines in real wages and possible interest rate hikes will be partly offset by continuing constraint on house prices.
Mortgage Rates: Little Change Expected in 2013
Data from September 2012 shows that current interest rates stand at 3.3% for new loans. Fixed-rate loans became particularly popular at the height of the market expansion in 2007, typically offering an initial fixed-rate period before the loan‘s interest rate converted to a floating-rate index plus a margin. With fixed-rate loans having now largely completed their initial period, the market is predominantly floating-rate. This makes loan performance increasingly susceptible to interest rate increases.
Fitch does not expect interest rates to change much in the near term and considers the mortgage rates will remain low over 2013.
Mortgage Performance: Arrears Rising Sharply
The decreasing value of dwellings, combined with significant tax rises and salary cuts is severely affecting both willingness and ability to pay, leading even seasoned loans to become non-performing. Current levels of arrears are 19.9% of the outstanding book as Q212. In the securitised pools, Fitch has observed the same rising trend in arrears, but with lower figures, possibly due to the positive selection and active management of the assets. Moral hazard concerns stem from suspension on foreclosures of properties below EUR300,000 since 2010, incentivizing borrowers to not make mortgage payments.
In Fitch’s view, the number of foreclosures will maintain the upward trend in arrears over the next two years, as the effect of austerity measures feeds through to the economy.
Mortgage Lending: Historically Low
Uncertainty about future income and employment, the ongoing austerity measures, tax rises, and the structural and political reforms have, as expected, resulted in a sharp decline in the number of real-estate transactions. Furthermore, banks are now more selective and cautious when granting a mortgage, which has resulted in a rise in the proportion of cash transactions.
Fitch expects further declines in volumes over the coming years, in line with the macro-economic forecasts.
Prepayments: Expected to Remain at Low Levels
Since 2007, prepayment rates have steadily fallen from an average 18% to approximately 2%.
Given the rapid deleveraging of lenders’ books and the tightening of their underwriting criteria, Fitch believes that low prepayment rates will prevail in Greece in the short and medium term. This view is further supported by the agency’s concern over a tightening in liquidity to finance new loans, coupled with potential hikes in the ECB base rate. These factors are likely to place further pressure on borrowers’ ability to make additional payments.
0
2
4
6
8
10
12
0%
10%
20%
30%
40%
50%
60%
1995 1998 2001 2004 2007 2010
HPI (real, reb.) Real disp. income (rebased)Market DTI (new loans) HP/GDP ratio (RHS)
House Prices and Affordability
Source: Fitch, Bank of Greece, Ameco, National Statistical Service, IMF
0%
1%
2%
3%
4%
5%
6%
0%
5%
10%
15%
20%
25%
2006 2007 2008 2009 2010 2011 2012
3m+ arrears (Bank of Greece, incl. defaults)Fitch RMBS arrears (3m+)Mortgage rate new loans (best; RHS)
Mortgage Rates and Arrears
Source: Fitch, Bank of Greece
0%
5%
10%
15%
20%
25%
30%
0
500
1,000
1,500
2,000
2,500
3,000
2003 2005 2007 2009 2011
Monthly new mortgage app. (EURm) (LHS)
Annualised prepayment rate (RHS)
Mortgage Lending and Prepayments
Source: Fitch, Bank of Greece
Structured Finance
Mortgage and Housing Market Outlook
January 2013 20
Germany
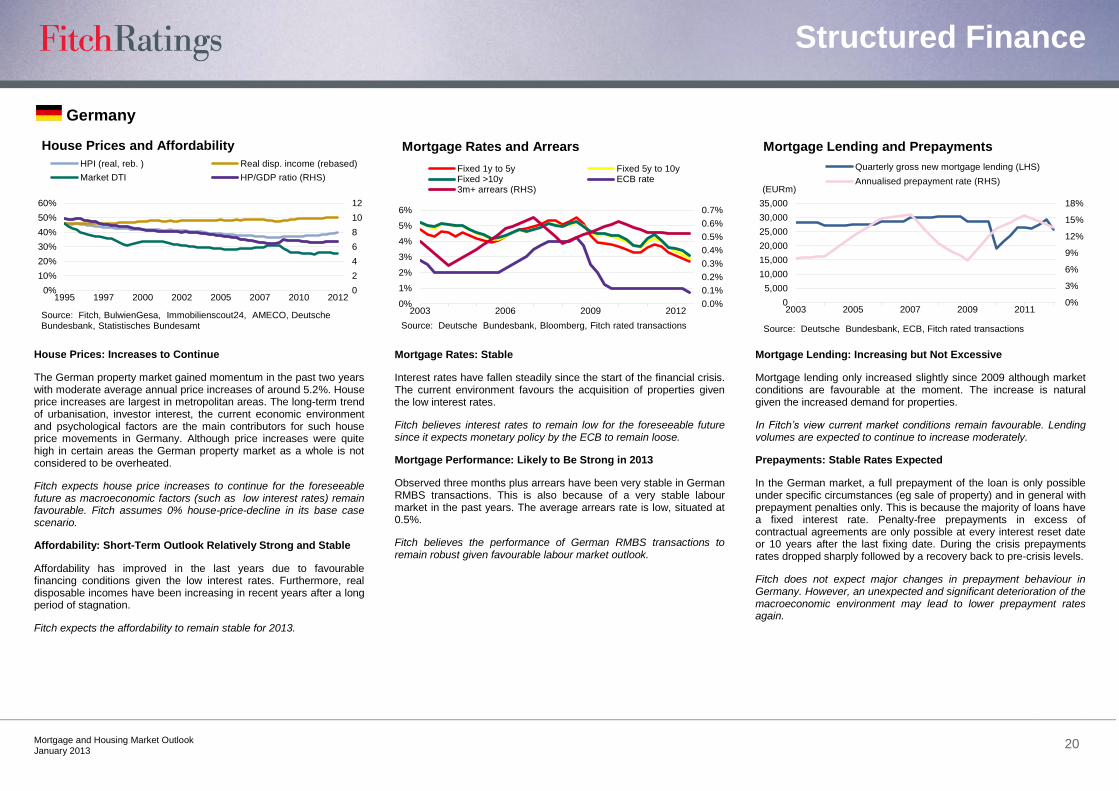
House Prices: Increases to Continue
The German property market gained momentum in the past two years with moderate average annual price increases of around 5.2%. House price increases are largest in metropolitan areas. The long-term trend of urbanisation, investor interest, the current economic environment and psychological factors are the main contributors for such house price movements in Germany. Although price increases were quite high in certain areas the German property market as a whole is not considered to be overheated.
Fitch expects house price increases to continue for the foreseeable future as macroeconomic factors (such as low interest rates) remain favourable. Fitch assumes 0% house-price-decline in its base case scenario.
Affordability: Short-Term Outlook Relatively Strong and Stable
Affordability has improved in the last years due to favourable financing conditions given the low interest rates. Furthermore, real disposable incomes have been increasing in recent years after a long period of stagnation.
Fitch expects the affordability to remain stable for 2013.
Mortgage Rates: Stable
Interest rates have fallen steadily since the start of the financial crisis. The current environment favours the acquisition of properties given the low interest rates.
Fitch believes interest rates to remain low for the foreseeable future since it expects monetary policy by the ECB to remain loose.
Mortgage Performance: Likely to Be Strong in 2013
Observed three months plus arrears have been very stable in German RMBS transactions. This is also because of a very stable labour market in the past years. The average arrears rate is low, situated at 0.5%.
Fitch believes the performance of German RMBS transactions to remain robust given favourable labour market outlook.
Mortgage Lending: Increasing but Not Excessive
Mortgage lending only increased slightly since 2009 although market conditions are favourable at the moment. The increase is natural given the increased demand for properties.
In Fitch’s view current market conditions remain favourable. Lending volumes are expected to continue to increase moderately.
Prepayments: Stable Rates Expected
In the German market, a full prepayment of the loan is only possible under specific circumstances (eg sale of property) and in general with prepayment penalties only. This is because the majority of loans have a fixed interest rate. Penalty-free prepayments in excess of contractual agreements are only possible at every interest reset date or 10 years after the last fixing date. During the crisis prepayments rates dropped sharply followed by a recovery back to pre-crisis levels.
Fitch does not expect major changes in prepayment behaviour in Germany. However, an unexpected and significant deterioration of the macroeconomic environment may lead to lower prepayment rates again.
0
2
4
6
8
10
12
0%
10%
20%
30%
40%
50%
60%
1995 1997 2000 2002 2005 2007 2010 2012
HPI (real, reb. ) Real disp. income (rebased)
Market DTI HP/GDP ratio (RHS)
House Prices and Affordability
Source: Fitch, BulwienGesa, Immobilienscout24, AMECO, Deutsche Bundesbank, Statistisches Bundesamt
0.0%
0.1%
0.2%
0.3%
0.4%
0.5%
0.6%
0.7%
0%
1%
2%
3%
4%
5%
6%
2003 2006 2009 2012
Fixed 1y to 5y Fixed 5y to 10yFixed >10y ECB rate3m+ arrears (RHS)
Mortgage Rates and Arrears
Source: Deutsche Bundesbank, Bloomberg, Fitch rated transactions
0%
3%
6%
9%
12%
15%
18%
0
5,000
10,000
15,000
20,000
25,000
30,000
35,000
2003 2005 2007 2009 2011
Quarterly gross new mortgage lending (LHS)
Annualised prepayment rate (RHS)(EURm)
Mortgage Lending and Prepayments
Source: Deutsche Bundesbank, ECB, Fitch rated transactions
Structured Finance
Mortgage and Housing Market Outlook
January 2013 21
France
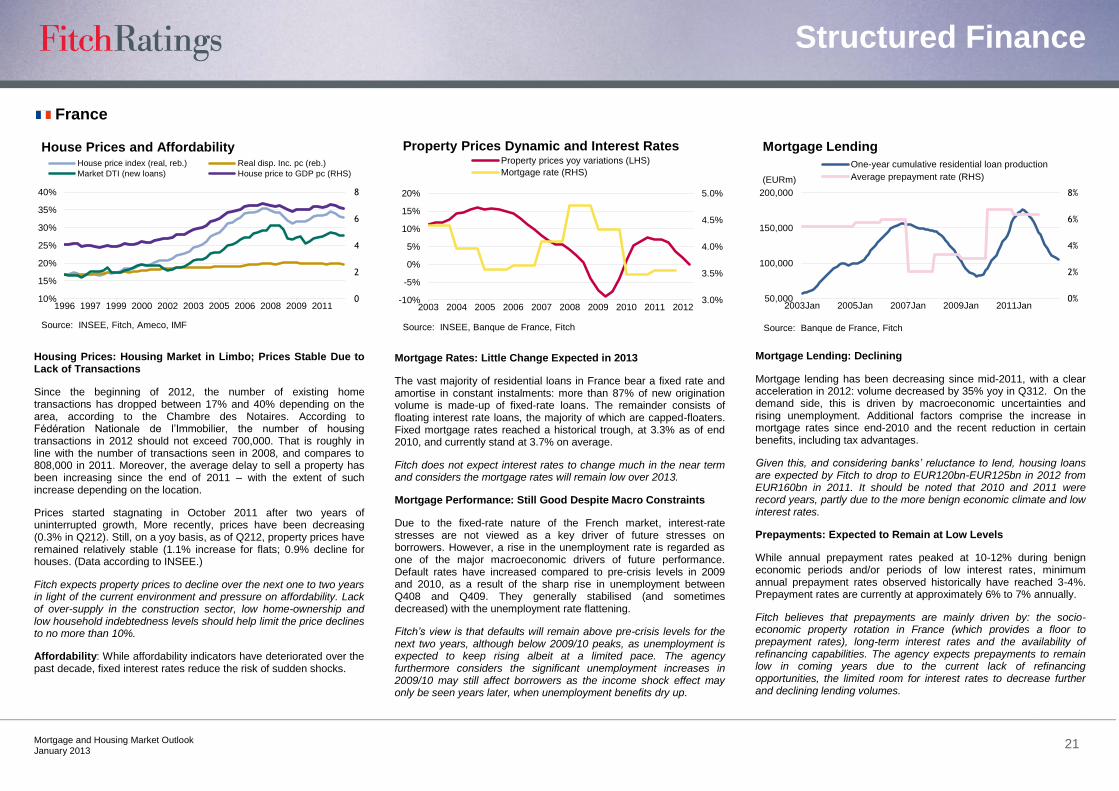
Housing Prices: Housing Market in Limbo; Prices Stable Due to Lack of Transactions
Since the beginning of 2012, the number of existing home transactions has dropped between 17% and 40% depending on the area, according to the Chambre des Notaires. According to Fédération Nationale de l‘Immobilier, the number of housing transactions in 2012 should not exceed 700,000. That is roughly in line with the number of transactions seen in 2008, and compares to 808,000 in 2011. Moreover, the average delay to sell a property has been increasing since the end of 2011 – with the extent of such increase depending on the location.
Prices started stagnating in October 2011 after two years of uninterrupted growth, More recently, prices have been decreasing (0.3% in Q212). Still, on a yoy basis, as of Q212, property prices have remained relatively stable (1.1% increase for flats; 0.9% decline for houses. (Data according to INSEE.)
Fitch expects property prices to decline over the next one to two years in light of the current environment and pressure on affordability. Lack of over-supply in the construction sector, low home-ownership and low household indebtedness levels should help limit the price declines to no more than 10%.
Affordability: While affordability indicators have deteriorated over the past decade, fixed interest rates reduce the risk of sudden shocks.
Mortgage Rates: Little Change Expected in 2013
The vast majority of residential loans in France bear a fixed rate and amortise in constant instalments: more than 87% of new origination volume is made-up of fixed-rate loans. The remainder consists of floating interest rate loans, the majority of which are capped-floaters. Fixed mortgage rates reached a historical trough, at 3.3% as of end 2010, and currently stand at 3.7% on average.
Fitch does not expect interest rates to change much in the near term and considers the mortgage rates will remain low over 2013.
Mortgage Performance: Still Good Despite Macro Constraints
Due to the fixed-rate nature of the French market, interest-rate stresses are not viewed as a key driver of future stresses on borrowers. However, a rise in the unemployment rate is regarded as one of the major macroeconomic drivers of future performance. Default rates have increased compared to pre-crisis levels in 2009 and 2010, as a result of the sharp rise in unemployment between Q408 and Q409. They generally stabilised (and sometimes decreased) with the unemployment rate flattening.
Fitch’s view is that defaults will remain above pre-crisis levels for the next two years, although below 2009/10 peaks, as unemployment is expected to keep rising albeit at a limited pace. The agency furthermore considers the significant unemployment increases in 2009/10 may still affect borrowers as the income shock effect may only be seen years later, when unemployment benefits dry up.
Mortgage Lending: Declining
Mortgage lending has been decreasing since mid-2011, with a clear acceleration in 2012: volume decreased by 35% yoy in Q312. On the demand side, this is driven by macroeconomic uncertainties and rising unemployment. Additional factors comprise the increase in mortgage rates since end-2010 and the recent reduction in certain benefits, including tax advantages.
Given this, and considering banks’ reluctance to lend, housing loans are expected by Fitch to drop to EUR120bn-EUR125bn in 2012 from EUR160bn in 2011. It should be noted that 2010 and 2011 were record years, partly due to the more benign economic climate and low interest rates.
Prepayments: Expected to Remain at Low Levels
While annual prepayment rates peaked at 10-12% during benign economic periods and/or periods of low interest rates, minimum annual prepayment rates observed historically have reached 3-4%. Prepayment rates are currently at approximately 6% to 7% annually.
Fitch believes that prepayments are mainly driven by: the socio-economic property rotation in France (which provides a floor to prepayment rates), long-term interest rates and the availability of refinancing capabilities. The agency expects prepayments to remain low in coming years due to the current lack of refinancing opportunities, the limited room for interest rates to decrease further and declining lending volumes.
0
2
4
6
8
10%
15%
20%
25%
30%
35%
40%
1996 1997 1999 2000 2002 2003 2005 2006 2008 2009 2011
House price index (real, reb.) Real disp. Inc. pc (reb.)
Market DTI (new loans) House price to GDP pc (RHS)
House Prices and Affordability
Source: INSEE, Fitch, Ameco, IMF
3.0%
3.5%
4.0%
4.5%
5.0%
-10%
-5%
0%
5%
10%
15%
20%
2003 2004 2005 2006 2007 2008 2009 2010 2011 2012
Property prices yoy variations (LHS)
Mortgage rate (RHS)
Property Prices Dynamic and Interest Rates
Source: INSEE, Banque de France, Fitch
0%
2%
4%
6%
8%
50,000
100,000
150,000
200,000
2003Jan 2005Jan 2007Jan 2009Jan 2011Jan
One-year cumulative residential loan production
Average prepayment rate (RHS)(EURm)
Mortgage Lending
Source: Banque de France, Fitch
Structured Finance
Mortgage and Housing Market Outlook
January 2013 22
Belgium
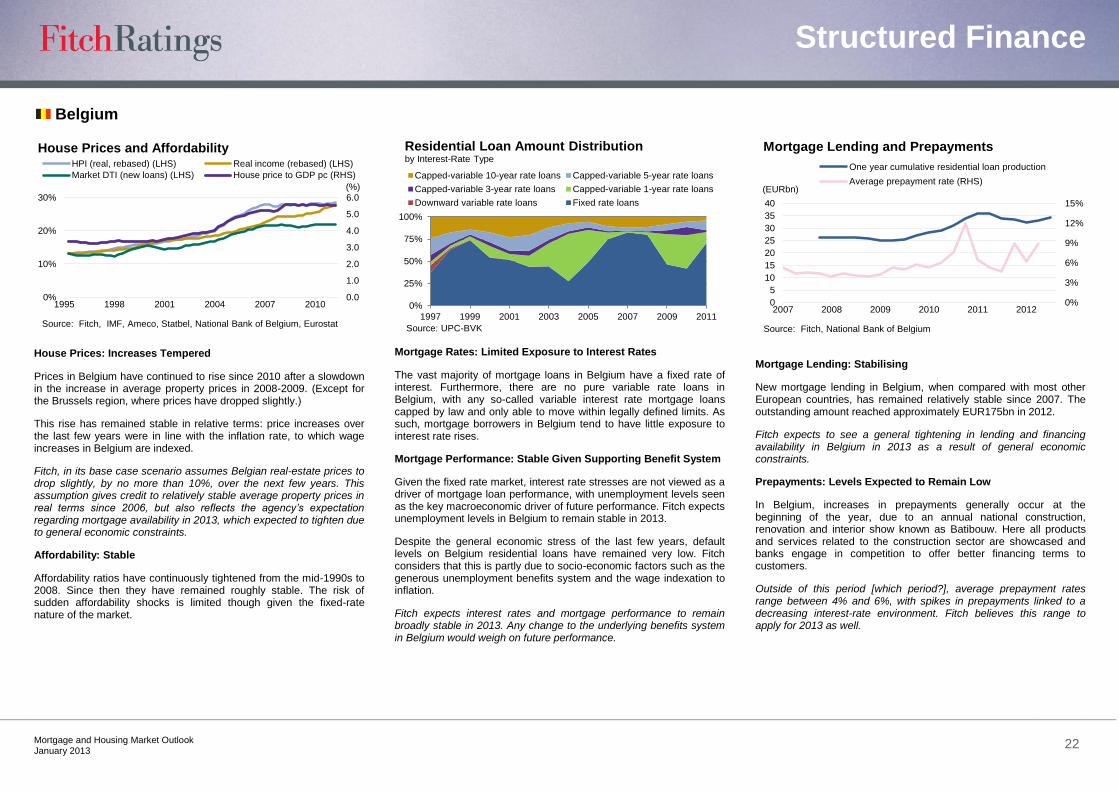
House Prices: Increases Tempered
Prices in Belgium have continued to rise since 2010 after a slowdown in the increase in average property prices in 2008-2009. (Except for the Brussels region, where prices have dropped slightly.)
This rise has remained stable in relative terms: price increases over the last few years were in line with the inflation rate, to which wage increases in Belgium are indexed.
Fitch, in its base case scenario assumes Belgian real-estate prices to drop slightly, by no more than 10%, over the next few years. This assumption gives credit to relatively stable average property prices in real terms since 2006, but also reflects the agency’s expectation regarding mortgage availability in 2013, which expected to tighten due to general economic constraints.
Affordability: Stable
Affordability ratios have continuously tightened from the mid-1990s to 2008. Since then they have remained roughly stable. The risk of sudden affordability shocks is limited though given the fixed-rate nature of the market.
Mortgage Rates: Limited Exposure to Interest Rates
The vast majority of mortgage loans in Belgium have a fixed rate of interest. Furthermore, there are no pure variable rate loans in Belgium, with any so-called variable interest rate mortgage loans capped by law and only able to move within legally defined limits. As such, mortgage borrowers in Belgium tend to have little exposure to interest rate rises.
Mortgage Performance: Stable Given Supporting Benefit System
Given the fixed rate market, interest rate stresses are not viewed as a driver of mortgage loan performance, with unemployment levels seen as the key macroeconomic driver of future performance. Fitch expects unemployment levels in Belgium to remain stable in 2013.
Despite the general economic stress of the last few years, default levels on Belgium residential loans have remained very low. Fitch considers that this is partly due to socio-economic factors such as the generous unemployment benefits system and the wage indexation to inflation.
Fitch expects interest rates and mortgage performance to remain broadly stable in 2013. Any change to the underlying benefits system in Belgium would weigh on future performance.
Mortgage Lending: Stabilising
New mortgage lending in Belgium, when compared with most other European countries, has remained relatively stable since 2007. The outstanding amount reached approximately EUR175bn in 2012.
Fitch expects to see a general tightening in lending and financing availability in Belgium in 2013 as a result of general economic constraints.
Prepayments: Levels Expected to Remain Low
In Belgium, increases in prepayments generally occur at the beginning of the year, due to an annual national construction, renovation and interior show known as Batibouw. Here all products and services related to the construction sector are showcased and banks engage in competition to offer better financing terms to customers.
Outside of this period [which period?], average prepayment rates range between 4% and 6%, with spikes in prepayments linked to a decreasing interest-rate environment. Fitch believes this range to apply for 2013 as well.
0.0
1.0
2.0
3.0
4.0
5.0
6.0
0%
10%
20%
30%
1995 1998 2001 2004 2007 2010
HPI (real, rebased) (LHS) Real income (rebased) (LHS)
Market DTI (new loans) (LHS) House price to GDP pc (RHS)
House Prices and Affordability
Source: Fitch, IMF, Ameco, Statbel, National Bank of Belgium, Eurostat
(%)
0%
25%
50%
75%
100%
1997 1999 2001 2003 2005 2007 2009 2011
Residential Loan Amount Distributionby Interest-Rate Type
Capped-variable 10-year rate loans Capped-variable 5-year rate loans
Capped-variable 3-year rate loans Capped-variable 1-year rate loans
Downward variable rate loans Fixed rate loans
Source: UPC-BVK
0%
3%
6%
9%
12%
15%
0
5
10
15
20
25
30
35
40
2007 2008 2009 2010 2011 2012
One year cumulative residential loan production
Average prepayment rate (RHS)(EURbn)
Mortgage Lending and Prepayments
Source: Fitch, National Bank of Belgium
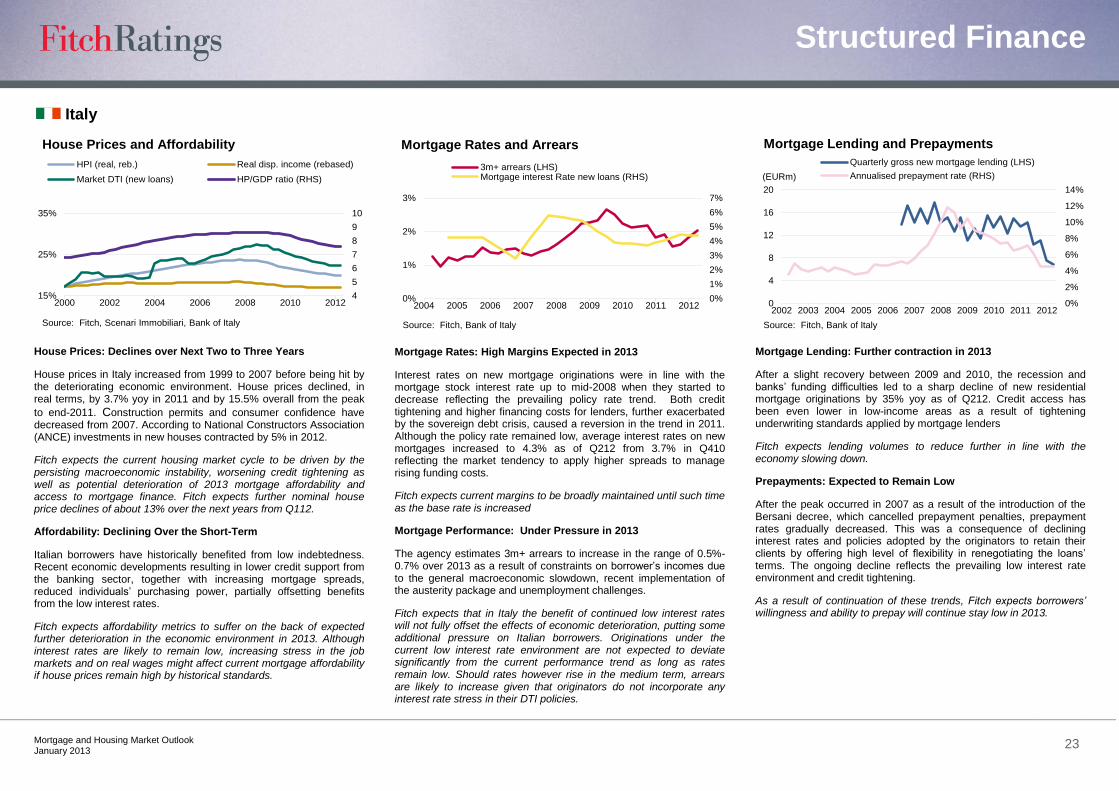
Structured Finance
Mortgage and Housing Market Outlook
January 2013 23
Italy
House Prices: Declines over Next Two to Three Years
House prices in Italy increased from 1999 to 2007 before being hit by the deteriorating economic environment. House prices declined, in real terms, by 3.7% yoy in 2011 and by 15.5% overall from the peak
to end-2011. Construction permits and consumer confidence have decreased from 2007. According to National Constructors Association (ANCE) investments in new houses contracted by 5% in 2012.
Fitch expects the current housing market cycle to be driven by the persisting macroeconomic instability, worsening credit tightening as well as potential deterioration of 2013 mortgage affordability and access to mortgage finance. Fitch expects further nominal house price declines of about 13% over the next years from Q112.
Affordability: Declining Over the Short-Term
Italian borrowers have historically benefited from low indebtedness. Recent economic developments resulting in lower credit support from the banking sector, together with increasing mortgage spreads, reduced individuals‘ purchasing power, partially offsetting benefits from the low interest rates.
Fitch expects affordability metrics to suffer on the back of expected further deterioration in the economic environment in 2013. Although interest rates are likely to remain low, increasing stress in the job markets and on real wages might affect current mortgage affordability if house prices remain high by historical standards.
Mortgage Rates: High Margins Expected in 2013
Interest rates on new mortgage originations were in line with the mortgage stock interest rate up to mid-2008 when they started to decrease reflecting the prevailing policy rate trend. Both credit tightening and higher financing costs for lenders, further exacerbated by the sovereign debt crisis, caused a reversion in the trend in 2011. Although the policy rate remained low, average interest rates on new mortgages increased to 4.3% as of Q212 from 3.7% in Q410 reflecting the market tendency to apply higher spreads to manage rising funding costs.
Fitch expects current margins to be broadly maintained until such time as the base rate is increased
Mortgage Performance: Under Pressure in 2013
The agency estimates 3m+ arrears to increase in the range of 0.5%-0.7% over 2013 as a result of constraints on borrower‘s incomes due to the general macroeconomic slowdown, recent implementation of the austerity package and unemployment challenges.
Fitch expects that in Italy the benefit of continued low interest rates will not fully offset the effects of economic deterioration, putting some additional pressure on Italian borrowers. Originations under the current low interest rate environment are not expected to deviate significantly from the current performance trend as long as rates remain low. Should rates however rise in the medium term, arrears are likely to increase given that originators do not incorporate any interest rate stress in their DTI policies.
Mortgage Lending: Further contraction in 2013
After a slight recovery between 2009 and 2010, the recession and banks‘ funding difficulties led to a sharp decline of new residential mortgage originations by 35% yoy as of Q212. Credit access has been even lower in low-income areas as a result of tightening underwriting standards applied by mortgage lenders
Fitch expects lending volumes to reduce further in line with the economy slowing down.
Prepayments: Expected to Remain Low
After the peak occurred in 2007 as a result of the introduction of the Bersani decree, which cancelled prepayment penalties, prepayment rates gradually decreased. This was a consequence of declining interest rates and policies adopted by the originators to retain their clients by offering high level of flexibility in renegotiating the loans‘ terms. The ongoing decline reflects the prevailing low interest rate environment and credit tightening.
As a result of continuation of these trends, Fitch expects borrowers’ willingness and ability to prepay will continue stay low in 2013.
4
5
6
7
8
9
10
15%
25%
35%
2000 2002 2004 2006 2008 2010 2012
HPI (real, reb.) Real disp. income (rebased)
Market DTI (new loans) HP/GDP ratio (RHS)
House Prices and Affordability
Source: Fitch, Scenari Immobiliari, Bank of Italy
0%
1%
2%
3%
4%
5%
6%
7%
0%
1%
2%
3%
2004 2005 2006 2007 2008 2009 2010 2011 2012
3m+ arrears (LHS)Mortgage interest Rate new loans (RHS)
Mortgage Rates and Arrears
Source: Fitch, Bank of Italy
0%
2%
4%
6%
8%
10%
12%
14%
0
4
8
12
16
20
2002 2003 2004 2005 2006 2007 2008 2009 2010 2011 2012
Quarterly gross new mortgage lending (LHS)
Annualised prepayment rate (RHS)(EURm)
Mortgage Lending and Prepayments
Source: Fitch, Bank of Italy
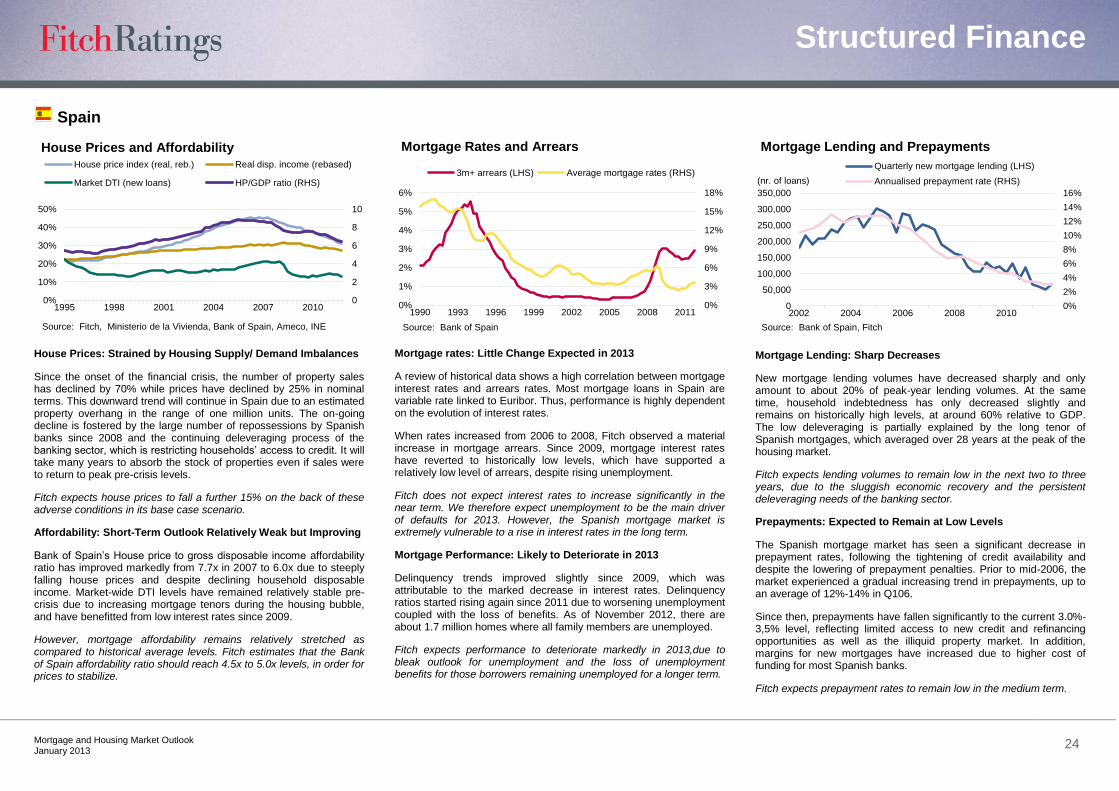
Structured Finance
Mortgage and Housing Market Outlook
January 2013 24
Spain
House Prices: Strained by Housing Supply/ Demand Imbalances
Since the onset of the financial crisis, the number of property sales has declined by 70% while prices have declined by 25% in nominal terms. This downward trend will continue in Spain due to an estimated property overhang in the range of one million units. The on-going decline is fostered by the large number of repossessions by Spanish banks since 2008 and the continuing deleveraging process of the banking sector, which is restricting households‘ access to credit. It will take many years to absorb the stock of properties even if sales were to return to peak pre-crisis levels.
Fitch expects house prices to fall a further 15% on the back of these adverse conditions in its base case scenario.
Affordability: Short-Term Outlook Relatively Weak but Improving
Bank of Spain‘s House price to gross disposable income affordability ratio has improved markedly from 7.7x in 2007 to 6.0x due to steeply falling house prices and despite declining household disposable income. Market-wide DTI levels have remained relatively stable pre-crisis due to increasing mortgage tenors during the housing bubble, and have benefitted from low interest rates since 2009.
However, mortgage affordability remains relatively stretched as compared to historical average levels. Fitch estimates that the Bank of Spain affordability ratio should reach 4.5x to 5.0x levels, in order for prices to stabilize.
Mortgage rates: Little Change Expected in 2013
A review of historical data shows a high correlation between mortgage interest rates and arrears rates. Most mortgage loans in Spain are variable rate linked to Euribor. Thus, performance is highly dependent on the evolution of interest rates.
When rates increased from 2006 to 2008, Fitch observed a material increase in mortgage arrears. Since 2009, mortgage interest rates have reverted to historically low levels, which have supported a relatively low level of arrears, despite rising unemployment.
Fitch does not expect interest rates to increase significantly in the near term. We therefore expect unemployment to be the main driver of defaults for 2013. However, the Spanish mortgage market is extremely vulnerable to a rise in interest rates in the long term.
Mortgage Performance: Likely to Deteriorate in 2013
Delinquency trends improved slightly since 2009, which was attributable to the marked decrease in interest rates. Delinquency ratios started rising again since 2011 due to worsening unemployment coupled with the loss of benefits. As of November 2012, there are about 1.7 million homes where all family members are unemployed.
Fitch expects performance to deteriorate markedly in 2013,due to bleak outlook for unemployment and the loss of unemployment benefits for those borrowers remaining unemployed for a longer term.
Mortgage Lending: Sharp Decreases
New mortgage lending volumes have decreased sharply and only amount to about 20% of peak-year lending volumes. At the same time, household indebtedness has only decreased slightly and remains on historically high levels, at around 60% relative to GDP. The low deleveraging is partially explained by the long tenor of Spanish mortgages, which averaged over 28 years at the peak of the housing market.
Fitch expects lending volumes to remain low in the next two to three years, due to the sluggish economic recovery and the persistent deleveraging needs of the banking sector.
Prepayments: Expected to Remain at Low Levels
The Spanish mortgage market has seen a significant decrease in prepayment rates, following the tightening of credit availability and despite the lowering of prepayment penalties. Prior to mid-2006, the market experienced a gradual increasing trend in prepayments, up to an average of 12%-14% in Q106.
Since then, prepayments have fallen significantly to the current 3.0%-3,5% level, reflecting limited access to new credit and refinancing opportunities as well as the illiquid property market. In addition, margins for new mortgages have increased due to higher cost of funding for most Spanish banks.
Fitch expects prepayment rates to remain low in the medium term.
0
2
4
6
8
10
0%
10%
20%
30%
40%
50%
1995 1998 2001 2004 2007 2010
House price index (real, reb.) Real disp. income (rebased)
Market DTI (new loans) HP/GDP ratio (RHS)
House Prices and Affordability
Source: Fitch, Ministerio de la Vivienda, Bank of Spain, Ameco, INE
0%
3%
6%
9%
12%
15%
18%
0%
1%
2%
3%
4%
5%
6%
1990 1993 1996 1999 2002 2005 2008 2011
3m+ arrears (LHS) Average mortgage rates (RHS)
Mortgage Rates and Arrears
Source: Bank of Spain
0%
2%
4%
6%
8%
10%
12%
14%
16%
0
50,000
100,000
150,000
200,000
250,000
300,000
350,000
2002 2004 2006 2008 2010
Quarterly new mortgage lending (LHS)
Annualised prepayment rate (RHS)(nr. of loans)
Mortgage Lending and Prepayments
Source: Bank of Spain, Fitch
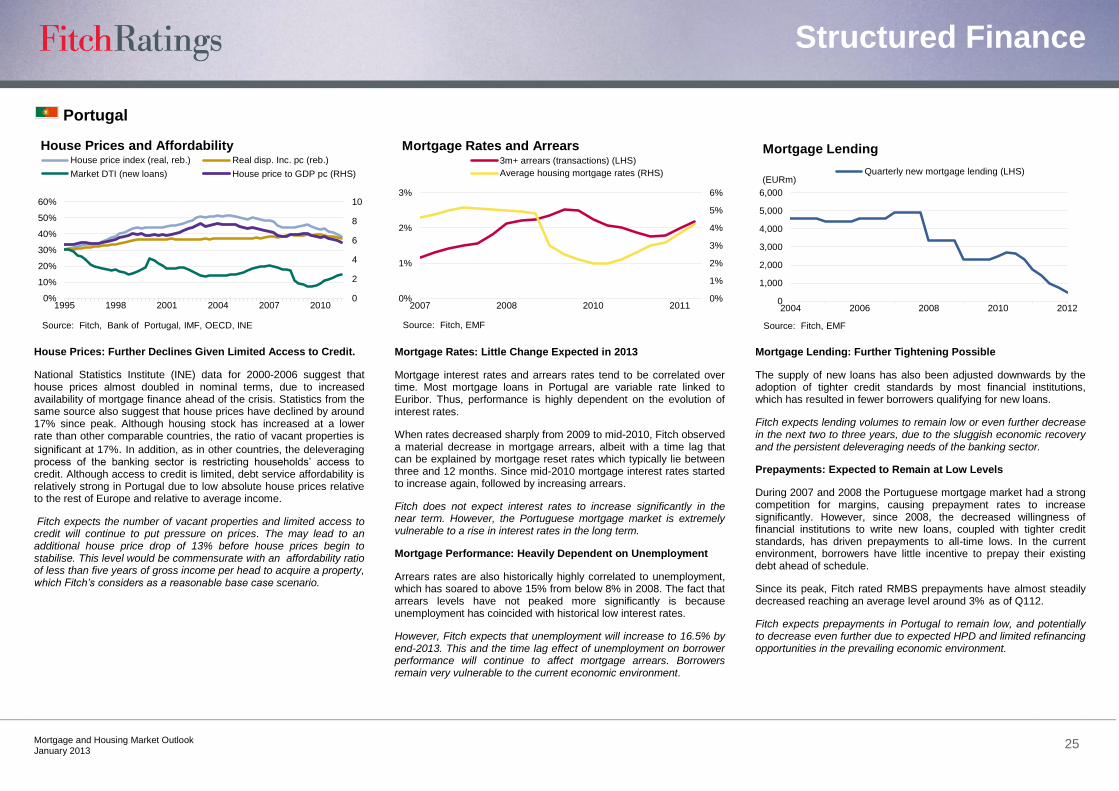
Structured Finance
Mortgage and Housing Market Outlook
January 2013 25
Portugal
House Prices: Further Declines Given Limited Access to Credit.
National Statistics Institute (INE) data for 2000-2006 suggest that house prices almost doubled in nominal terms, due to increased availability of mortgage finance ahead of the crisis. Statistics from the same source also suggest that house prices have declined by around 17% since peak. Although housing stock has increased at a lower rate than other comparable countries, the ratio of vacant properties is
significant at 17%. In addition, as in other countries, the deleveraging process of the banking sector is restricting households‘ access to credit. Although access to credit is limited, debt service affordability is relatively strong in Portugal due to low absolute house prices relative to the rest of Europe and relative to average income.
Fitch expects the number of vacant properties and limited access to credit will continue to put pressure on prices. The may lead to an additional house price drop of 13% before house prices begin to stabilise. This level would be commensurate with an affordability ratio of less than five years of gross income per head to acquire a property, which Fitch’s considers as a reasonable base case scenario.
Mortgage Rates: Little Change Expected in 2013
Mortgage interest rates and arrears rates tend to be correlated over time. Most mortgage loans in Portugal are variable rate linked to Euribor. Thus, performance is highly dependent on the evolution of interest rates.
When rates decreased sharply from 2009 to mid-2010, Fitch observed a material decrease in mortgage arrears, albeit with a time lag that can be explained by mortgage reset rates which typically lie between three and 12 months. Since mid-2010 mortgage interest rates started to increase again, followed by increasing arrears.
Fitch does not expect interest rates to increase significantly in the near term. However, the Portuguese mortgage market is extremely vulnerable to a rise in interest rates in the long term.
Mortgage Performance: Heavily Dependent on Unemployment
Arrears rates are also historically highly correlated to unemployment, which has soared to above 15% from below 8% in 2008. The fact that arrears levels have not peaked more significantly is because unemployment has coincided with historical low interest rates.
However, Fitch expects that unemployment will increase to 16.5% by end-2013. This and the time lag effect of unemployment on borrower performance will continue to affect mortgage arrears. Borrowers remain very vulnerable to the current economic environment.
Mortgage Lending: Further Tightening Possible
The supply of new loans has also been adjusted downwards by the adoption of tighter credit standards by most financial institutions, which has resulted in fewer borrowers qualifying for new loans.
Fitch expects lending volumes to remain low or even further decrease in the next two to three years, due to the sluggish economic recovery and the persistent deleveraging needs of the banking sector.
Prepayments: Expected to Remain at Low Levels
During 2007 and 2008 the Portuguese mortgage market had a strong competition for margins, causing prepayment rates to increase significantly. However, since 2008, the decreased willingness of financial institutions to write new loans, coupled with tighter credit standards, has driven prepayments to all-time lows. In the current environment, borrowers have little incentive to prepay their existing debt ahead of schedule.
Since its peak, Fitch rated RMBS prepayments have almost steadily decreased reaching an average level around 3% as of Q112.
Fitch expects prepayments in Portugal to remain low, and potentially to decrease even further due to expected HPD and limited refinancing opportunities in the prevailing economic environment.
0
2
4
6
8
10
0%
10%
20%
30%
40%
50%
60%
1995 1998 2001 2004 2007 2010
House price index (real, reb.) Real disp. Inc. pc (reb.)
Market DTI (new loans) House price to GDP pc (RHS)
House Prices and Affordability
Source: Fitch, Bank of Portugal, IMF, OECD, INE
0%
1%
2%
3%
4%
5%
6%
0%
1%
2%
3%
2007 2008 2010 2011
3m+ arrears (transactions) (LHS)
Average housing mortgage rates (RHS)
Mortgage Rates and Arrears
Source: Fitch, EMF
0
1,000
2,000
3,000
4,000
5,000
6,000
2004 2006 2008 2010 2012
Quarterly new mortgage lending (LHS)(EURm)
Mortgage Lending
Source: Fitch, EMF
Structured Finance
Mortgage and Housing Market Outlook
January 2013 26
Appendix 1: Related Research and Country-Specific Criteria Addenda
EMEA Criteria Addendum – Belgium (July 2012)
EMEA Criteria Addendum – France (July 2012)
EMEA Criteria Addendum – Germany (August 2012)
EMEA Criteria Addendum – Greece (August 2012)
Mortgage Market Index – Greece (November 2012)
EMEA Criteria Addendum – Ireland (August 2012)
EMEA Criteria Addendum – Italy (July 2012)
EMEA Criteria Addendum – Netherlands (June 2012)
EMEA Criteria Addendum – Portugal (August 2012)
EMEA Criteria Addendum – Spain (July 2012)
EMEA Criteria Addendum – UK (August 2012)
APAC Residential Mortgage Criteria Addendum – Australia (August 2012)
The Dinkum Index – Q212 (October 2012)
U.S. RMBS 1Q12 Sustainable Home Price Projection (September 2012)
U.S. RMBS Loan Loss Model Criteria (August 2012)
Structured Finance
Mortgage and Housing Market Outlook
January 2013 27
ALL FITCH CREDIT RATINGS ARE SUBJECT TO CERTAIN LIMITATIONS AND DISCLAIMERS. PLEASE READ THESE LIMITATIONS AND DISCLAIMERS BY FOLLOWING THIS LINK: HTTP://FITCHRATINGS.COM/UNDERSTANDINGCREDITRATINGS. IN ADDITION, RATING DEFINITIONS AND THE TERMS OF USE OF SUCH RATINGS ARE AVAILABLE ON THE AGENCY'S PUBLIC WEB SITE AT WWW.FITCHRATINGS.COM. PUBLISHED RATINGS, CRITERIA, AND METHODOLOGIES ARE AVAILABLE FROM THIS SITE AT ALL TIMES. FITCH'S CODE OF CONDUCT, CONFIDENTIALITY, CONFLICTS OF INTEREST, AFFILIATE FIREWALL, COMPLIANCE, AND OTHER RELEVANT POLICIES AND PROCEDURES ARE ALSO AVAILABLE FROM THE CODE OF CONDUCT SECTION OF THIS SITE.
Copyright © 2013 by Fitch, Inc., Fitch Ratings Ltd. and its subsidiaries. One State Street Plaza, NY, NY 10004.Telephone: 1-800-753-4824, (212) 908-0500. Fax: (212) 480-4435. Reproduction or retransmission in whole or in part is prohibited except by permission. All rights reserved. In issuing and maintaining its ratings, Fitch relies on factual information it receives from issuers and underwriters and from other sources Fitch believes to be credible. Fitch conducts a reasonable investigation of the factual information relied upon by it in accordance with its ratings methodology, and obtains reasonable verification of that information from independent sources, to the extent such sources are available for a given security or in a given jurisdiction. The manner of Fitch‘s factual investigation and the scope of the third-party verification it obtains will vary depending on the nature of the rated security and its issuer, the requirements and practices in the jurisdiction in which the rated security is offered and sold and/or the issuer is located, the availability and nature of relevant public information, access to the management of the issuer and its advisers, the availability of pre-existing third-party verifications such as audit reports, agreed-upon procedures letters, appraisals, actuarial reports, engineering reports, legal opinions and other reports provided by third parties, the availability of independent and competent third-party verification sources with respect to the particular security or in the particular jurisdiction of the issuer, and a variety of other factors. Users of Fitch‘s ratings should understand that neither an enhanced factual investigation nor any third-party verification can ensure that all of the information Fitch relies on in connection with a rating will be accurate and complete. Ultimately, the issuer and its advisers are responsible for the accuracy of the information they provide to Fitch and to the market in offering documents and other reports. In issuing its ratings Fitch must rely on the work of experts, including independent auditors with respect to financial statements and attorneys with respect to legal and tax matters. Further, ratings are inherently forward-looking and embody assumptions and predictions about future events that by their nature cannot be verified as facts. As a result, despite any verification of current facts, ratings can be affected by future events or conditions that were not anticipated at the time a rating was issued or affirmed.
The information in this report is provided ―as is‖ without any representation or warranty of any kind. A Fitch rating is an opinion as to the creditworthiness of a security. This opinion is based on established criteria and methodologies that Fitch is continuously evaluating and updating. Therefore, ratings are the collective work product of Fitch and no individual, or group of individuals, is solely responsible for a rating. The rating does not address the risk of loss due to risks other than credit risk, unless such risk is specifically mentioned. Fitch is not engaged in the offer or sale of any security. All Fitch reports have shared authorship. Individuals identified in a Fitch report were involved in, but are not solely responsible for, the opinions stated therein. The individuals are named for contact purposes only. A report providing a Fitch rating is neither a prospectus nor a substitute for the information assembled, verified and presented to investors by the issuer and its agents in connection with the sale of the securities. Ratings may be changed or withdrawn at anytime for any reason in the sole discretion of Fitch. Fitch does not provide investment advice of any sort. Ratings are not a recommendation to buy, sell, or hold any security. Ratings do not comment on the adequacy of market price, the suitability of any security for a particular investor, or the tax-exempt nature or taxability of payments made in respect to any security. Fitch receives fees from issuers, insurers, guarantors, other obligors, and underwriters for rating securities. Such fees generally vary from US$1,000 to US$750,000 (or the applicable currency equivalent) per issue. In certain cases, Fitch will rate all or a number of issues issued by a particular issuer, or insured or guaranteed by a particular insurer or guarantor, for a single annual fee. Such fees are expected to vary from US$10,000 to US$1,500,000 (or the applicable currency equivalent). The assignment, publication, or dissemination of a rating by Fitch shall not constitute a consent by Fitch to use its name as an expert in connection with any registration statement filed under the United States securities laws, the Financial Services and Markets Act 2000 of the United Kingdom, or the securities laws of any particular jurisdiction. Due to the relative efficiency of electronic publishing and distribution, Fitch research may be available to electronic subscribers up to three days earlier than to print subscribers.