Embed Size (px)
Citation preview

ROAD INVESTMENT FOR SUSTAINABILITY OF
NETWORK AND DOMESTIC CONTRACTORSBy Adam Andreski

Contact details
[email protected]:: +44 (1235) 437805Office: +44 (1235) 833753Fax:: +44 (1235) 832186I. T. Transport LtdThe Old Power Station, Ardington,Wantage, Oxon, OX12 8QJ,United Kingdom.
www.ittransport.co.uk
Introduction
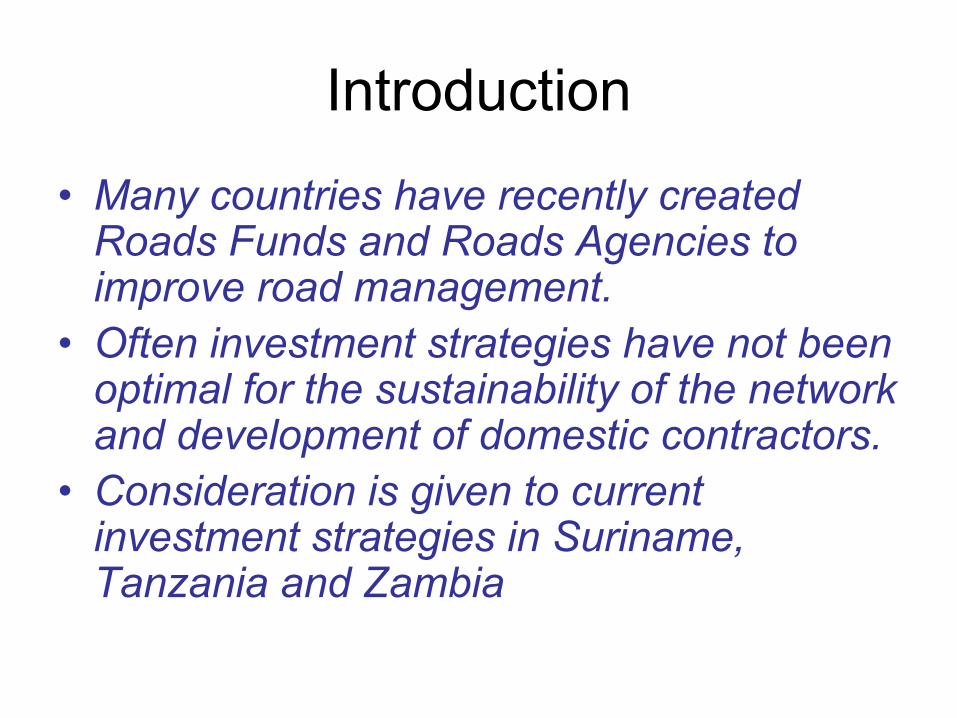
• Many countries have recently created Roads Funds and Roads Agencies to improve road management.
• Often investment strategies have not been optimal for the sustainability of the network and development of domestic contractors.
• Consideration is given to current investment strategies in Suriname, Tanzania and Zambia
Key Message
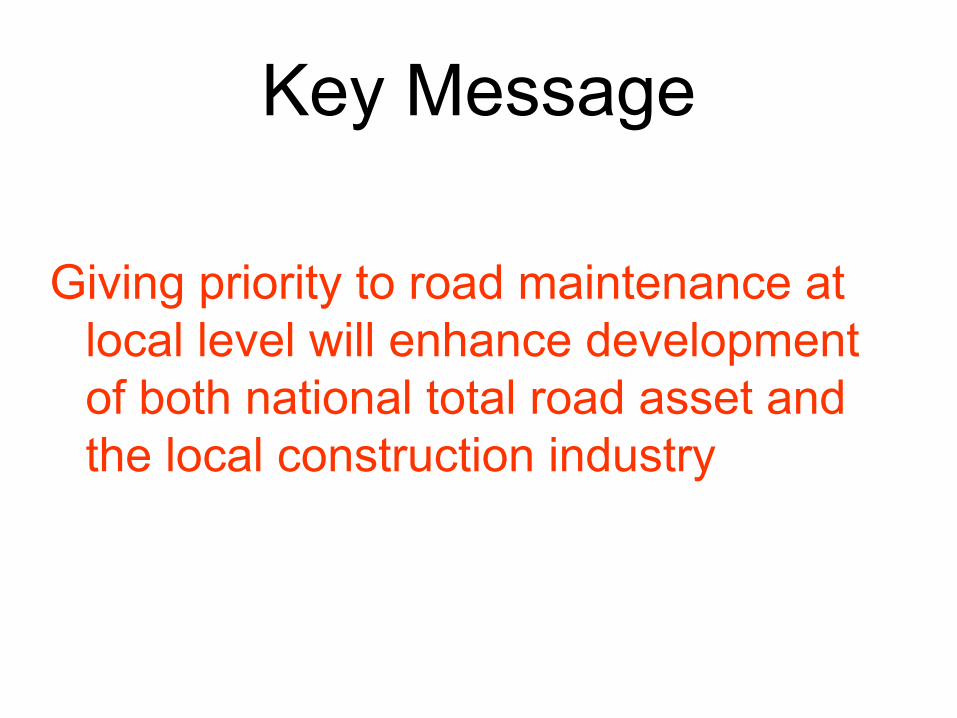
Giving priority to road maintenance at local level will enhance development of both national total road asset and the local construction industry

Paper in 2 parts:
• Strategic model for road investment
• Ways of developing local contractors

Investment Tool

Key Data Input
• Road Asset Value• Backlog Value• Deferred maintenance cost factor• Maintenance requirement as a % of asset
value• Annual increase in budget

1. Suriname Example
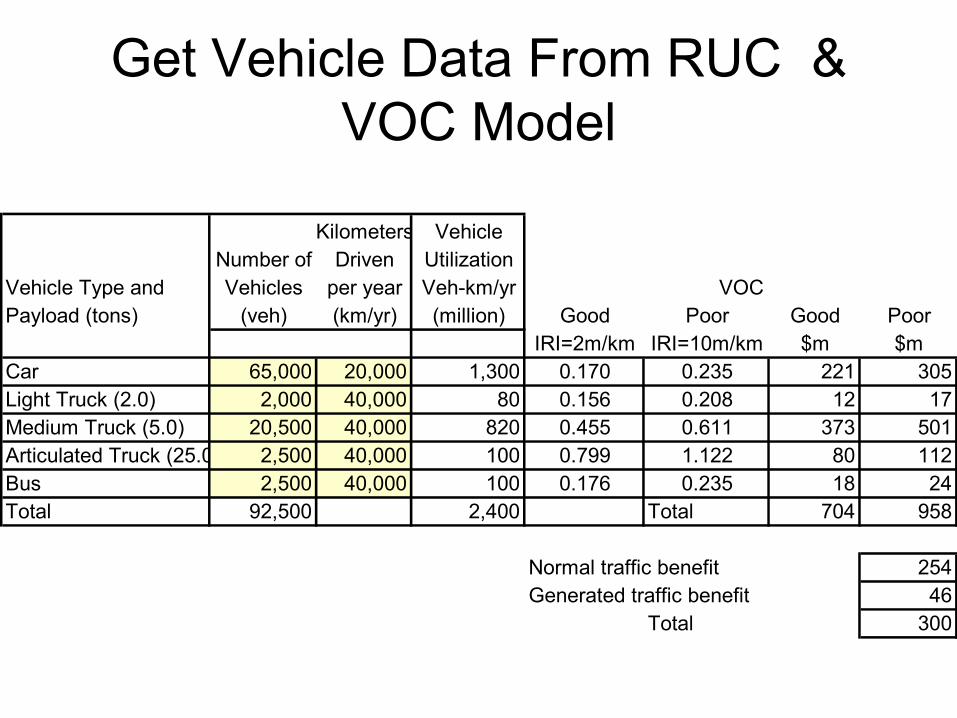
Get Vehicle Data From RUC & VOC Model
Kilometers VehicleNumber of Driven Utilization
Vehicle Type and Vehicles per year Veh-km/yrPayload (tons) (veh) (km/yr) (million) Good Poor Good Poor
IRI=2m/km IRI=10m/km $m $mCar 65,000 20,000 1,300 0.170 0.235 221 305Light Truck (2.0) 2,000 40,000 80 0.156 0.208 12 17Medium Truck (5.0) 20,500 40,000 820 0.455 0.611 373 501Articulated Truck (25.0 2,500 40,000 100 0.799 1.122 80 112Bus 2,500 40,000 100 0.176 0.235 18 24Total 92,500 2,400 Total 704 958
Normal traffic benefit 254Generated traffic benefit 46
Total 300
VOC
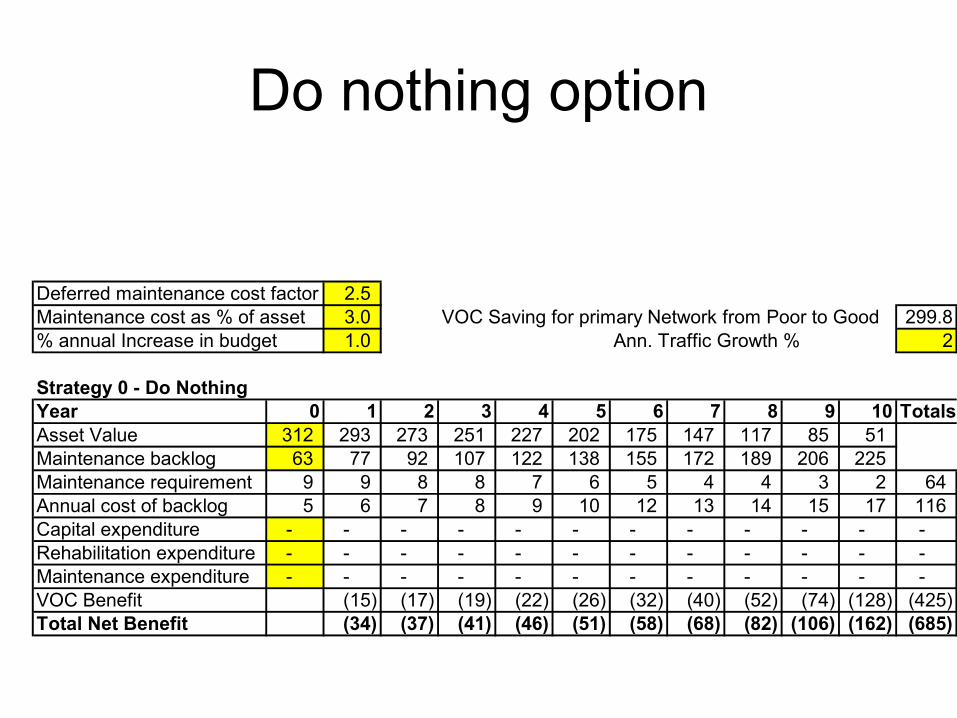
Do nothing option
Deferred maintenance cost factor 2.5 Maintenance cost as % of asset 3.0 VOC Saving for primary Network from Poor to Good 299.8% annual Increase in budget 1.0 Ann. Traffic Growth % 2
Strategy 0 - Do NothingYear 0 1 2 3 4 5 6 7 8 9 10 TotalsAsset Value 312 293 273 251 227 202 175 147 117 85 51 Maintenance backlog 63 77 92 107 122 138 155 172 189 206 225 Maintenance requirement 9 9 8 8 7 6 5 4 4 3 2 64 Annual cost of backlog 5 6 7 8 9 10 12 13 14 15 17 116 Capital expenditure - - - - - - - - - - - - Rehabilitation expenditure - - - - - - - - - - - - Maintenance expenditure - - - - - - - - - - - - VOC Benefit (15) (17) (19) (22) (26) (32) (40) (52) (74) (128) (425) Total Net Benefit (34) (37) (41) (46) (51) (58) (68) (82) (106) (162) (685)

Current Strategy
Strategy 1 - Current - Opcenten SRD 0.03 only on petrolYear 0 1 2 3 4 5 6 7 8 9 10 TotalsAsset Value 312 323 334 344 353 361 368 375 380 384 387 Maintenance backlog 63 67 72 77 83 89 96 104 112 121 131 Maintenance requirement 9 10 10 10 11 11 11 11 11 12 12 118 Annual cost of backlog 5 5 5 6 6 7 7 8 8 9 10 76 Capital expenditure 20 20 20 21 21 21 21 21 22 22 22 231 Rehabilitation expenditure 8 8 8 8 8 8 8 9 9 9 9 93 Maintenance expenditure 2 2 2 2 2 2 2 2 2 2 2 23 VOC Benefit (4) (4) (5) (5) (6) (6) (7) (8) (8) (9) (63) Total Net Benefit 11 13 15 18 22 28 35 47 69 123 381

Strategy 2
Asset Value 312 321 331 341 352 364 376 389 403 417 432 Maintenance backlog 63 59 55 51 46 41 37 31 26 21 15 Maintenance requirement 9 10 10 10 11 11 11 12 12 13 13 121 Cost of backlog 5 4 4 4 3 3 3 2 2 2 1 33 Capital expenditure 10 10 10 10 10 11 11 11 11 11 11 116 Rehabilitation expenditure 12 12 12 12 12 13 13 13 13 13 13 139 Maintenance expenditure 6 6 6 6 6 6 6 6 6 7 7 69 VOC Benefit 4 4 4 4 4 4 4 5 5 5 43 Total Net Benefit 18 22 27 32 38 45 55 70 95 150 552

Case Study Countries
• Suriname• Malawi• Tanzania

Suriname
Key Airport
Key River Route
Possible key RoadKey Road
Basic Statistics
• GDP $1.1b• Population 440,000• GDP per capita $2,500• 4,750km

Problem TreeHigh rate of accidents
High Economic/Social
Costs
Congestion (Paramaribo)
High Vehicle Costs Poor Access
Low road standards (loading, drainage,
alignment etc.)
High axle loading
Poor road condition (backlog)
Rural roads undeveloped
Strategic Routes
undeveloped
Poor drainage systems
Rapid deterioration of
network
Lack of Road maintenance
Low capacity road authority
Unclear functions RA, MPW, MRD,
MTCT
Poor compensation
levels
Low finance of road
maintenance
Road Authority Act inadequate
Non-acceptance by Government of
RA concept
Large org with low skills at
MPW
RA concept seen as donor driven
Lack of Professional
HRM
Key
Results Physical problems
Administrative problems
Main Problems
• Maintenance Expenditure ~15% of requirements
• Local contracting industry undeveloped• Roads damaged by overloaded trucks,
particularly loggers

Tanzania

National Development of Contracting Industry
• National Construction Council 1979• Management Action Group set up 1994• Tanzania Civil Engineering Contractors
Association set up 1995• Contractors Registration Board 1998 • In 1986 43 contractors and 2005 > 1,000• Equipment available for hire from
Tanroads plant pools

Tanzania Investment Strategies
Deferred maintenance cost factor 2.0 Maintenance cost as % of asset 3.0 % annual Increase in budget 1.0
(US$m) 2005 Strategy 1 Strategy 2 Strategy 3Asset Value 2,600 2,660 3,047 3,435 Maintenance backlog 1,400 1,766 908 49
130 65 - 65 130 180 65 65 80
Year 10 Projection (2015)
Initial Capital expenditureInitial Rehabilitation expenditureInitial Maintenance expenditure

Zambia

History of Transition
• 1993 - President Chiluba introduces private sector reforms in most sectors – very few contractors
• 1995 – 2001 – greenhouse contracts in E. Province
• 1998 – National Construction Council • 2002 – New Transport Policy & Road Act• 2006 – 450 contractors• 2006 – Road Development Agency takes over
national network of 67,000km

Zambia’s Investment Strategies
$millions2006 Strategy 1 Strategy 2 Strategy 3
Asset Value 1,750 1,734 1,861 3,014 Maintenance backlog 1,600 1,272 1,163 (9)
20 20 - 90 90 190 35 45 50 Initial Maintenance expenditure
Year 10 Projection (2016)
Initial Capital expenditureInitial Rehabilitation expenditure
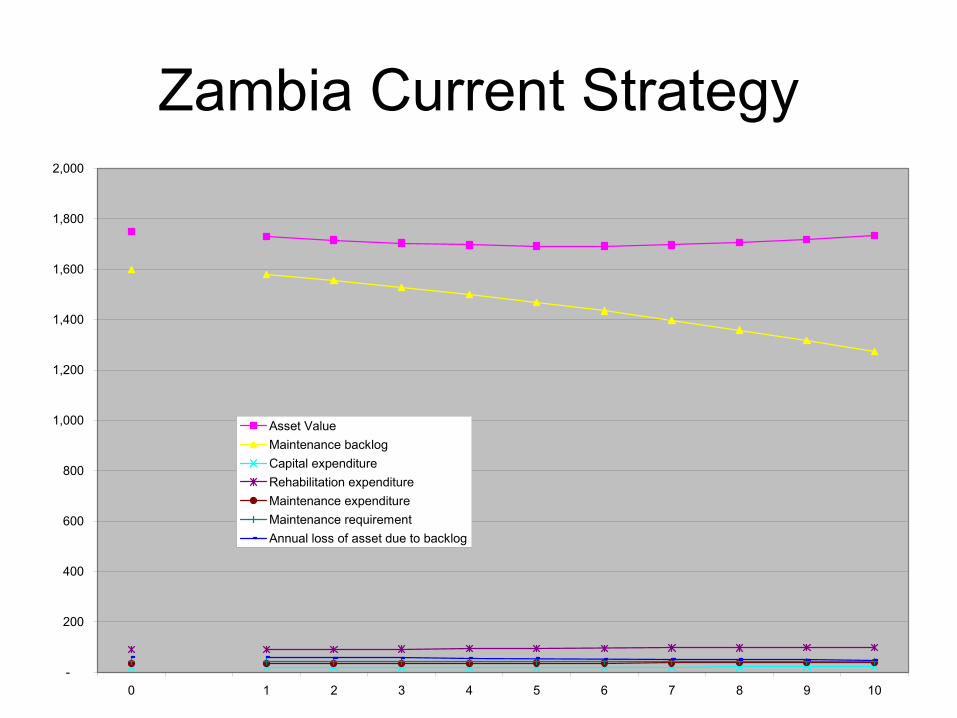
Zambia Current Strategy
-
200
400
600
800
1,000
1,200
1,400
1,600
1,800
2,000
0 1 2 3 4 5 6 7 8 9 10
Asset ValueMaintenance backlogCapital expenditureRehabilitation expenditureMaintenance expenditureMaintenance requirementAnnual loss of asset due to backlog

Zambia Strategy 2
(500)
-
500
1,000
1,500
2,000
2,500
3,000
3,500
1 2 3 4 5 6 7 8 9 10 11 12
Asset ValueMaintenance backlogCapital expenditureRehabilitation expenditureMaintenance expenditureMaintenance requirementAnnual loss of asset due to backlog

Strategies to Develop Domestic Contractors
• Give priority to maintenance at sub national level• Package contracts attractively vertically and
horizontally• Simpler forms of contract and specifications • The Development Team Model• “Greenhouse contracts”• Technical competitive tendering• Labour or low cost equipment based contracting


![WHAT DRIVES YOUTH UNEMPLOYMENT AND WHAT … · (J-PAL); Vimal Ranchhod, Cecil Mlatsheni and Callie Ardington (Southern Africa Labour and Development Research Unit [SALDRU], UCT);](https://img.pdfslide.net/doc/110x75/5f0c97297e708231d4362947/what-drives-youth-unemployment-and-what-j-pal-vimal-ranchhod-cecil-mlatsheni.jpg)