Embed Size (px)
Citation preview
Sampling and Sample Size Part 1
Cally Ardington
Course Overview
1. What is Evaluation?2. Outcomes, Impact, and Indicators3. Why Randomise?4. How to Randomise?5. Sampling and Sample Size6. Threats and Analysis7. Project from Start to Finish8. Cost Effectiveness and Scaling
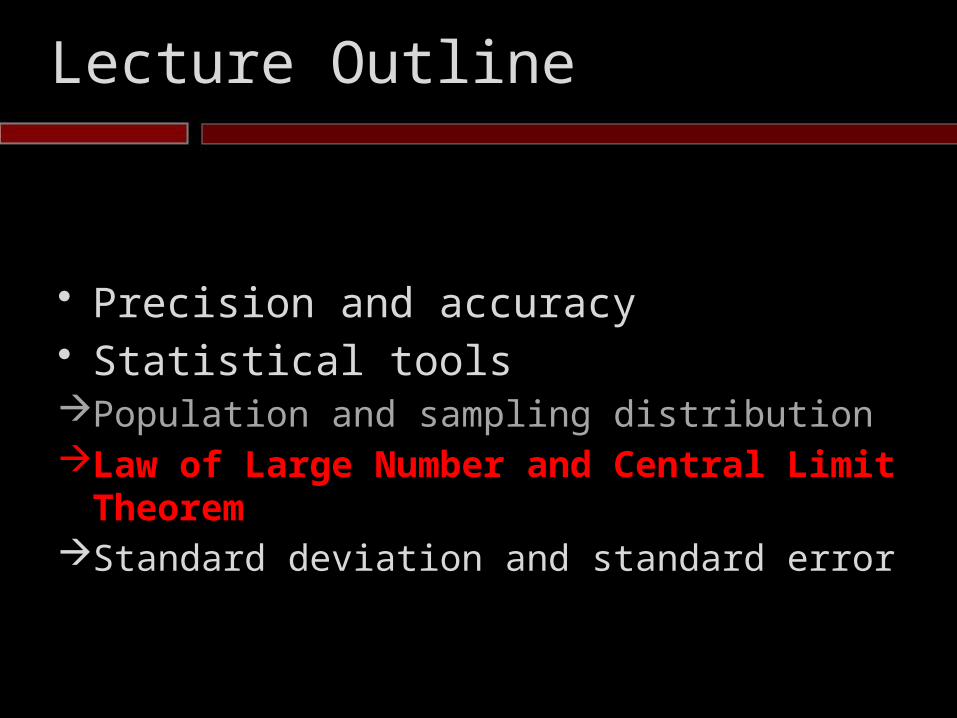
Lecture Outline
• Precision and accuracy • Statistical toolsPopulation and sampling
distribution Law of Large Number and Central
Limit Theorem Standard deviation and standard
error
I. II.
Don’t k
now
33%33%33%
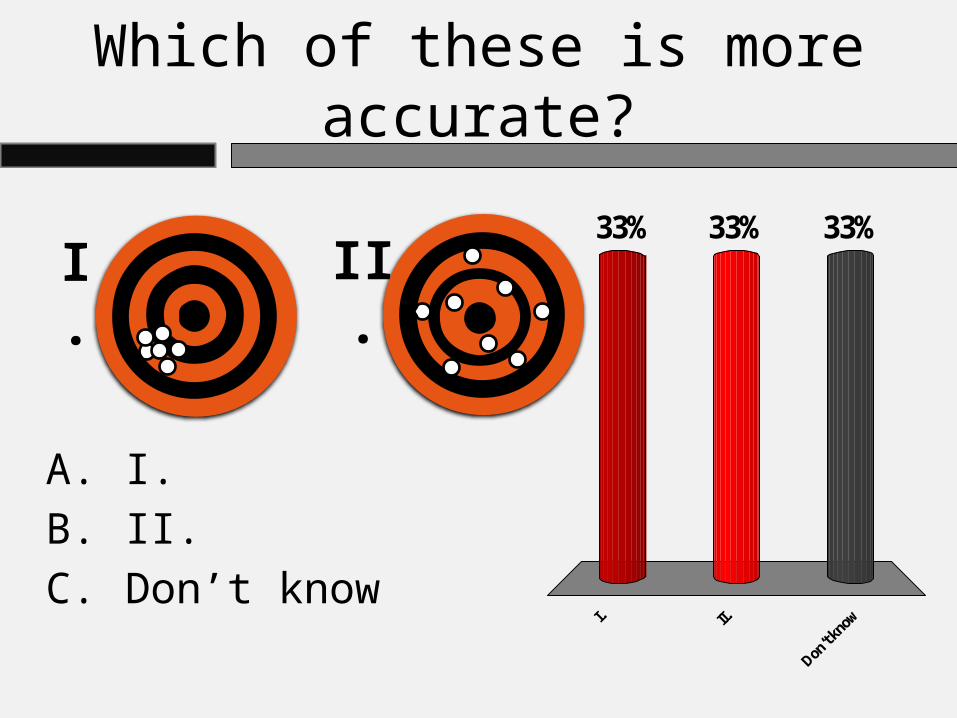
Which of these is more accurate?
A. I.B. II.C. Don’t know
I. II.
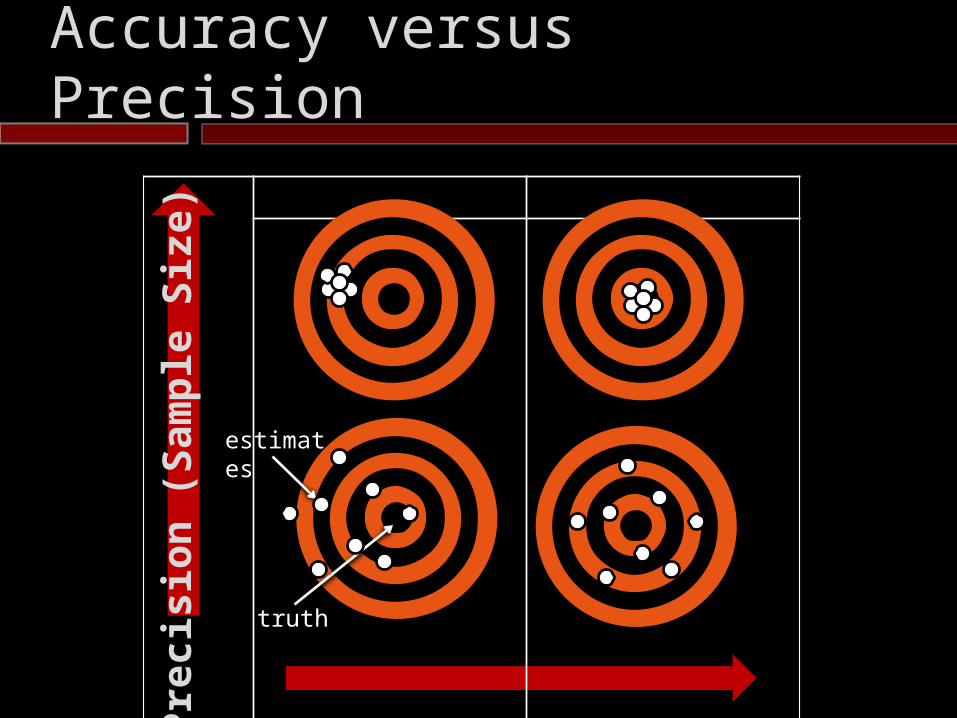
Accuracy versus Precision
Precision
(Sampl
e Size)
Accuracy (Randomization)
truth
estimates
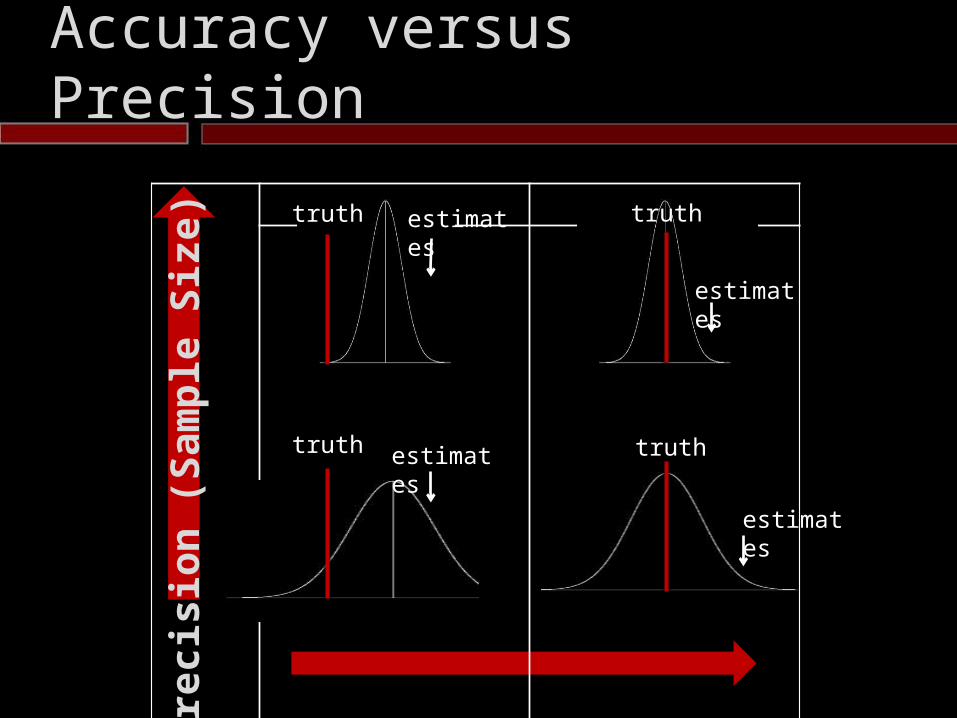
Accuracy versus Precision
Precision
(Sampl
e Size)
Accuracy (Randomization)
truth truthestimates
estimates
truth truthestimates
estimates
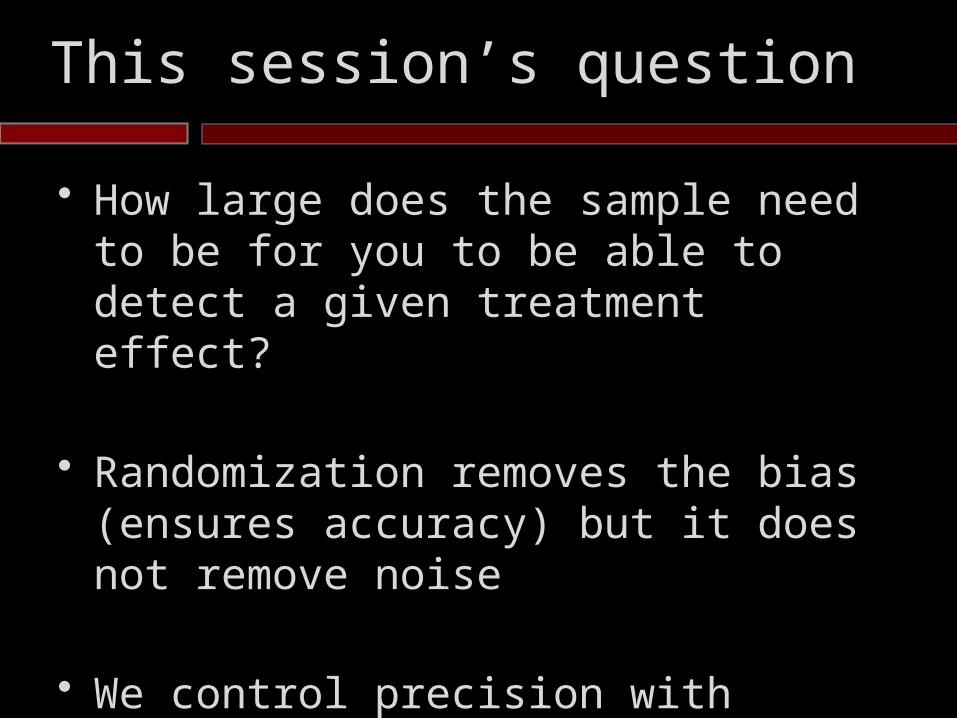
This session’s question
• How large does the sample need to be for you to be able to detect a given treatment effect?
• Randomization removes the bias (ensures accuracy) but it does not remove noise
• We control precision with sample size
Lecture Outline
• Precision and accuracy • Statistical tools Population and sampling distribution Law of Large Number and Central Limit
Theorem Standard deviation and standard error
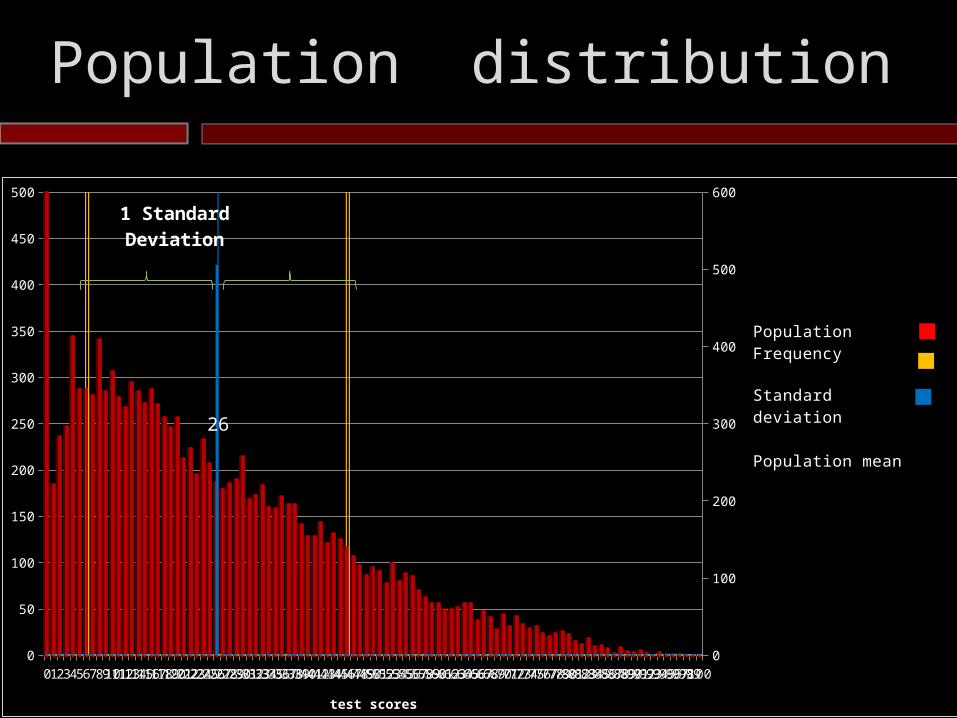
Population distribution
01234567891011121314151617181920212223242526272829303132333435363738394041424344454647484950515253545556575859606162636465666768697071727374757677787980818283848586878889909192939495969798991000
50
100
150
200
250
300
350
400
450
500
0
100
200
300
400
500
600
26
test scores
1 Standard Deviation
Population Frequency
Standard deviation
Population mean
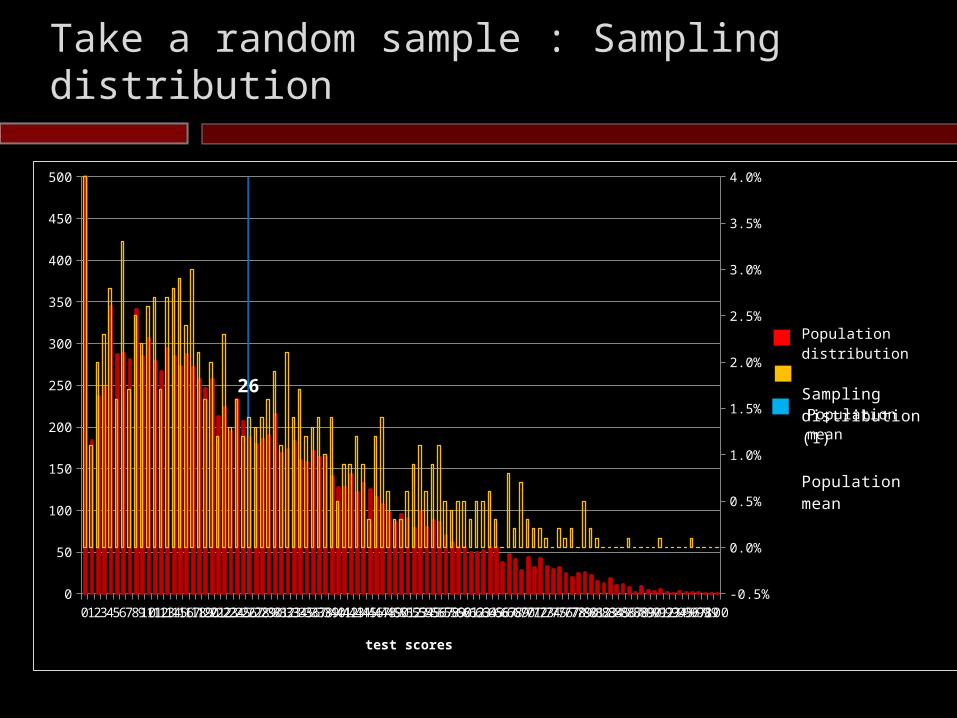
Take a random sample : Sampling distribution
01234567891011121314151617181920212223242526272829303132333435363738394041424344454647484950515253545556575859606162636465666768697071727374757677787980818283848586878889909192939495969798991000
50
100
150
200
250
300
350
400
450
500
-0.5%
0.0%
0.5%
1.0%
1.5%
2.0%
2.5%
3.0%
3.5%
4.0%
26
test scores
Population distribution
Sampling distribution (1)
Population mean Population mean
Lecture Outline
• Precision and accuracy • Statistical tools Population and sampling distribution Law of Large Number and Central
Limit Theorem Standard deviation and standard error
• We generally don’t have a our population distribution but, we have our sampling distribution.
• What do we know about our sampling distribution?
• Two statistical laws help us here (1)Central Limit Theorem (2)The Law of Large Numbers
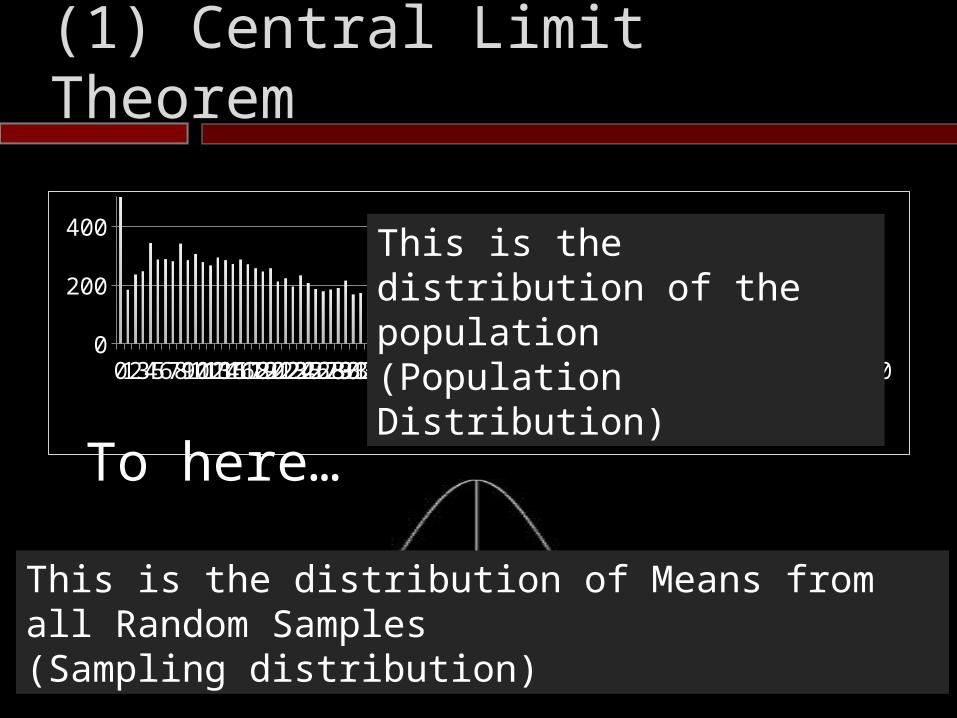
(1) Central Limit Theorem
01234567891011121314151617181920212223242526272829303132333435363738394041424344454647484950515253545556575859606162636465666768697071727374757677787980818283848586878889909192939495969798991000
100200300400500
test scores
To here…
This is the distribution of the population(Population Distribution)
This is the distribution of Means from all Random Samples(Sampling distribution)
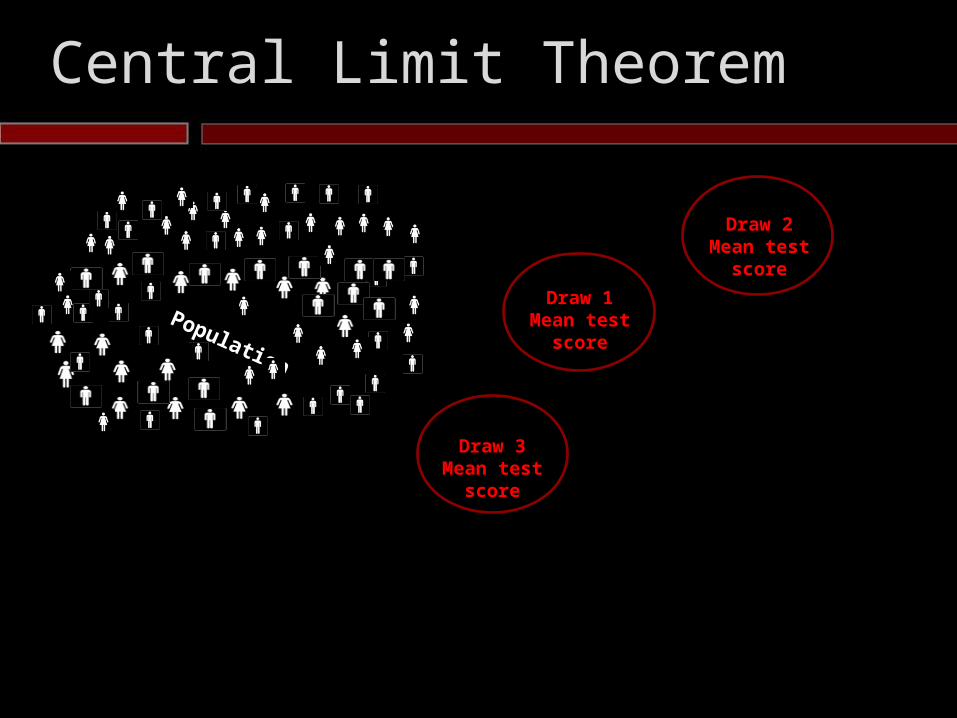
Central Limit Theorem
Population
Draw 1Mean test
score
Draw 2Mean test
score
Draw 3Mean test
score
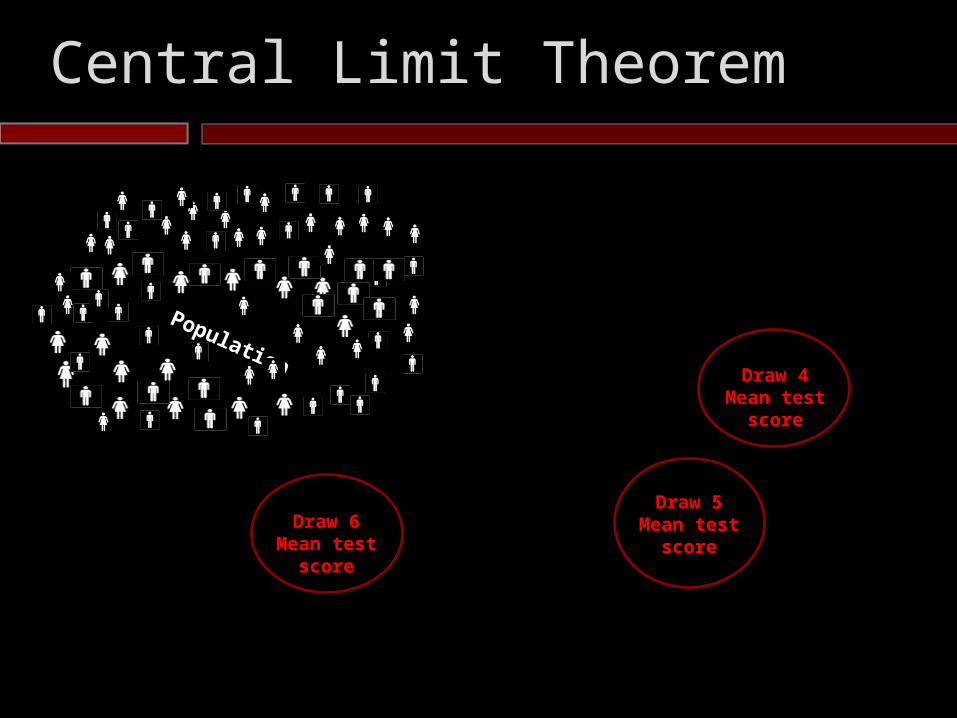
Central Limit Theorem
Population
Draw 6Mean test
score
Draw 5Mean test
score
Draw 4Mean test
score
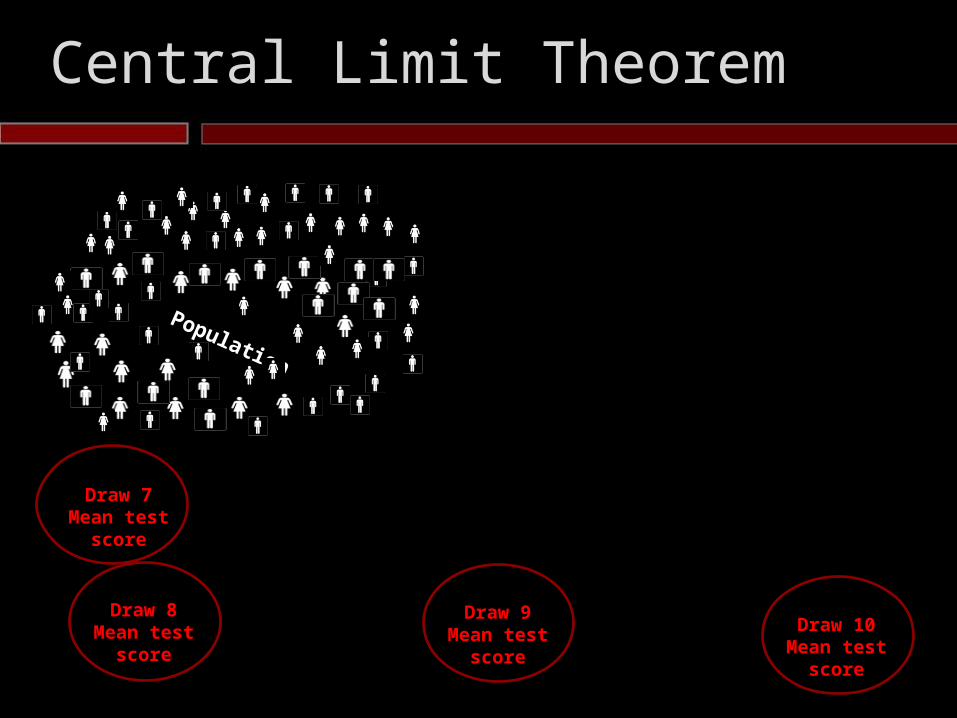
Central Limit Theorem
Population
Draw 9Mean test
score
Draw 10Mean test
score
Draw 8Mean test
score
Draw 7Mean test
score
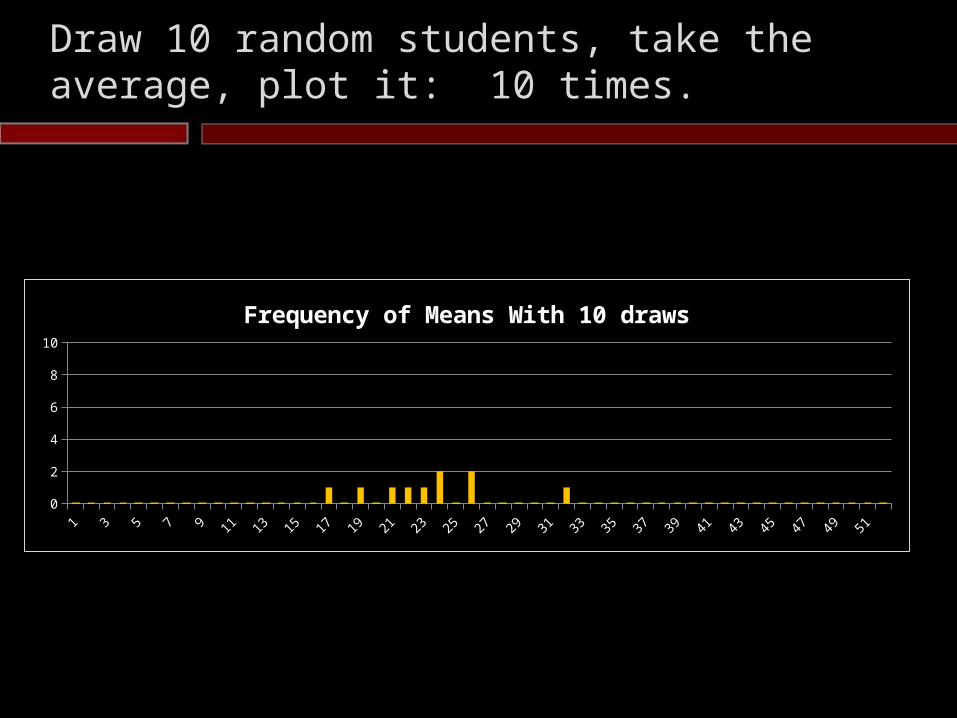
Draw 10 random students, take the average, plot it: 10 times.
Inadequate sample size
No clear distribution around population mean
1 2 3 4 5 6 7 8 9 101112131415161718192021222324252627282930313233343536373839404142434445464748495051520123456789
10
Frequency of Means With 10 draws
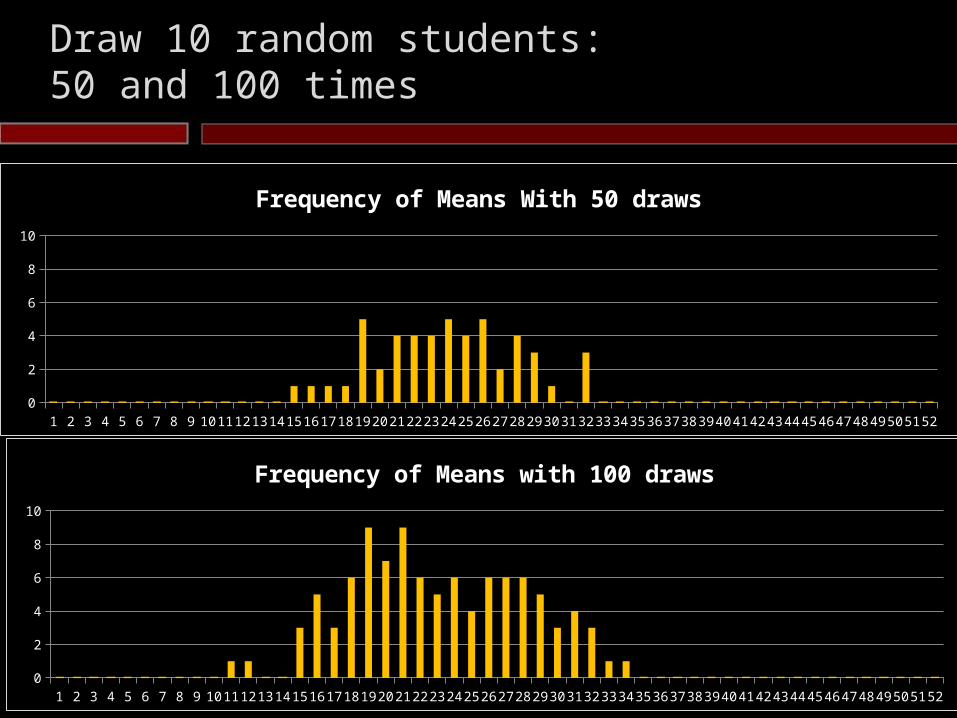
More sample means around population mean
Still spread a good deal
Draw 10 random students: 50 and 100 times
1 2 3 4 5 6 7 8 9 10 11 12 13 14 15 16 17 18 19 20 21 22 23 24 25 26 27 28 29 30 31 32 33 34 35 36 37 38 39 40 41 42 43 44 45 46 47 48 49 50 51 520123456789
10
Frequency of Means With 50 draws
1 2 3 4 5 6 7 8 9 10 11 12 13 14 15 16 17 18 19 20 21 22 23 24 25 26 27 28 29 30 31 32 33 34 35 36 37 38 39 40 41 42 43 44 45 46 47 48 49 50 51 520123456789
10
Frequency of Means with 100 draws
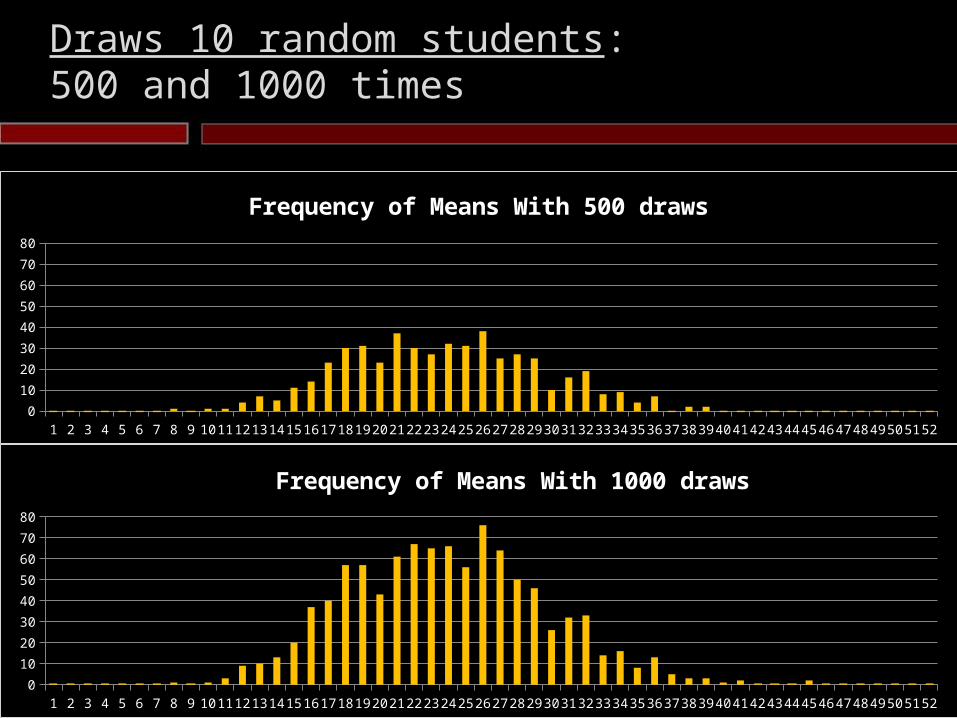
Distribution now significantly more normal
Starting to see peaks
Draws 10 random students: 500 and 1000 times
1 2 3 4 5 6 7 8 9 10 11 12 13 14 15 16 17 18 19 20 21 22 23 24 25 26 27 28 29 30 31 32 33 34 35 36 37 38 39 40 41 42 43 44 45 46 47 48 49 50 51 520
10
20
30
40
50
60
70
80
Frequency of Means With 500 draws
1 2 3 4 5 6 7 8 9 10 11 12 13 14 15 16 17 18 19 20 21 22 23 24 25 26 27 28 29 30 31 32 33 34 35 36 37 38 39 40 41 42 43 44 45 46 47 48 49 50 51 520
10
20
30
40
50
60
70
80
Frequency of Means With 1000 draws
• This is a theoretical exercise. In reality we do not have multiple draws, we only have one draw.
• BUT, we can control the number of people in that draw. This is what we refer to as SAMPLE SIZE.
• The previous example was based on a sample size of 10
• What happens if we take a sample size of 50?
We w
ill appro
ach a bell c
urv...
The b
ell cu
rve w
ill be narro
wer
Both A &
B
Neither.
The underly
ing sa...
25% 25%25%25%
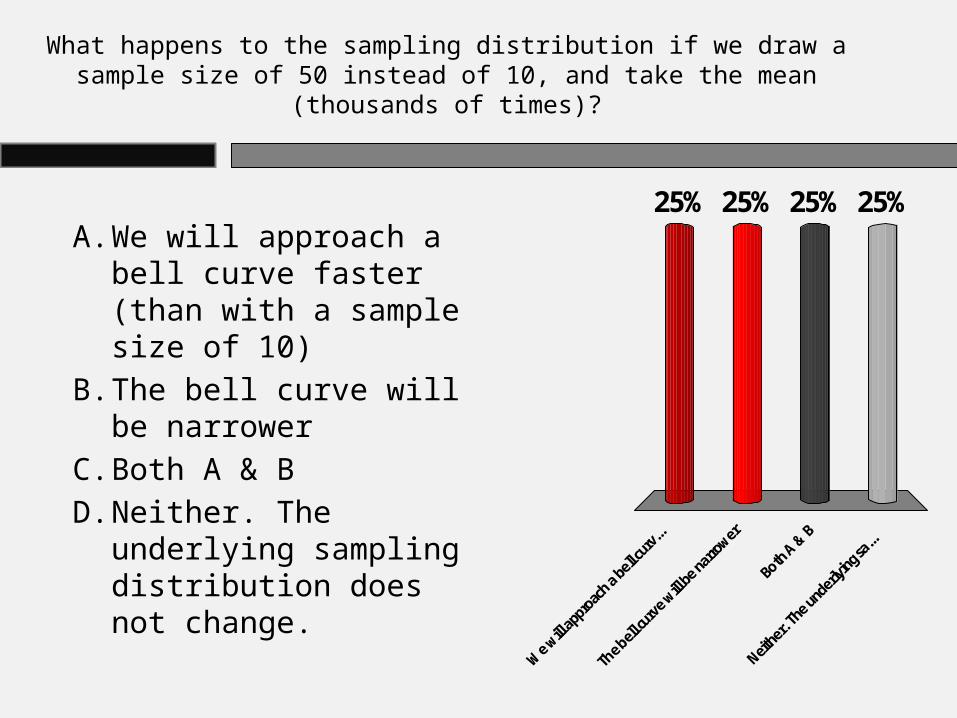
What happens to the sampling distribution if we draw a sample size of 50 instead of 10, and take the mean (thousands of
times)?
A. We will approach a bell curve faster (than with a sample size of 10)
B. The bell curve will be narrower
C. Both A & B D. Neither. The
underlying sampling distribution does not change.
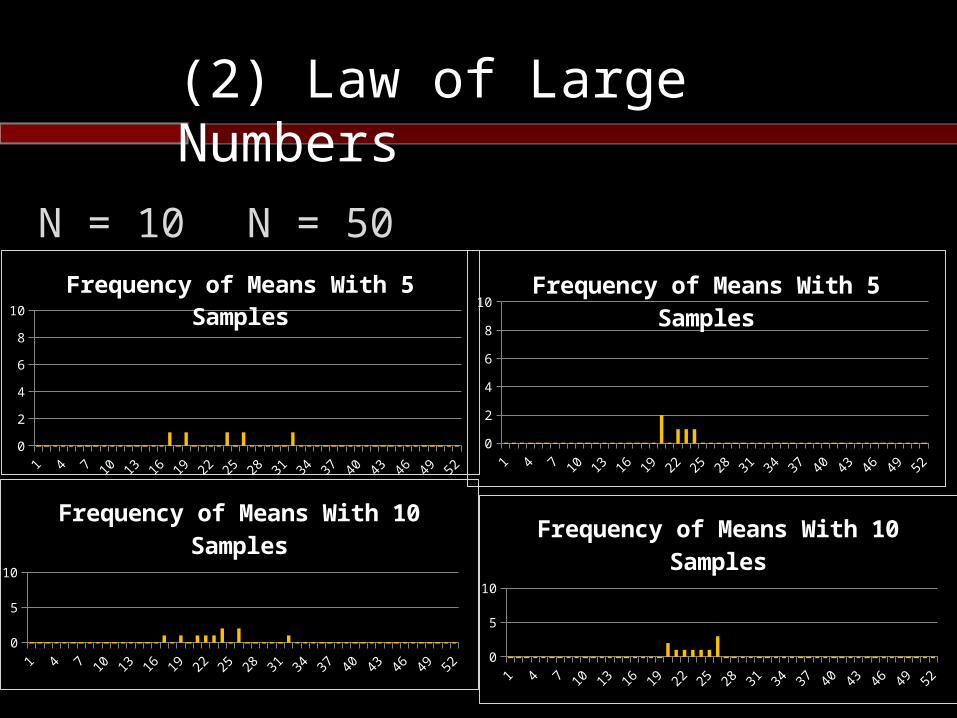
N = 10 N = 50
1 4 7 10 13 16 19 22 25 28 31 34 37 40 43 46 49 520
2
4
6
8
10
Frequency of Means With 5 Samples
1 4 7 10 13 16 19 22 25 28 31 34 37 40 43 46 49 5202468
10
Frequency of Means With 10 Samples
1 4 7 10 13 16 19 22 25 28 31 34 37 40 43 46 49 520
2
4
6
8
10Frequency of Means With 5
Samples
1 4 7 10 13 16 19 22 25 28 31 34 37 40 43 46 49 5202468
10
Frequency of Means With 10 Samples
(2) Law of Large Numbers
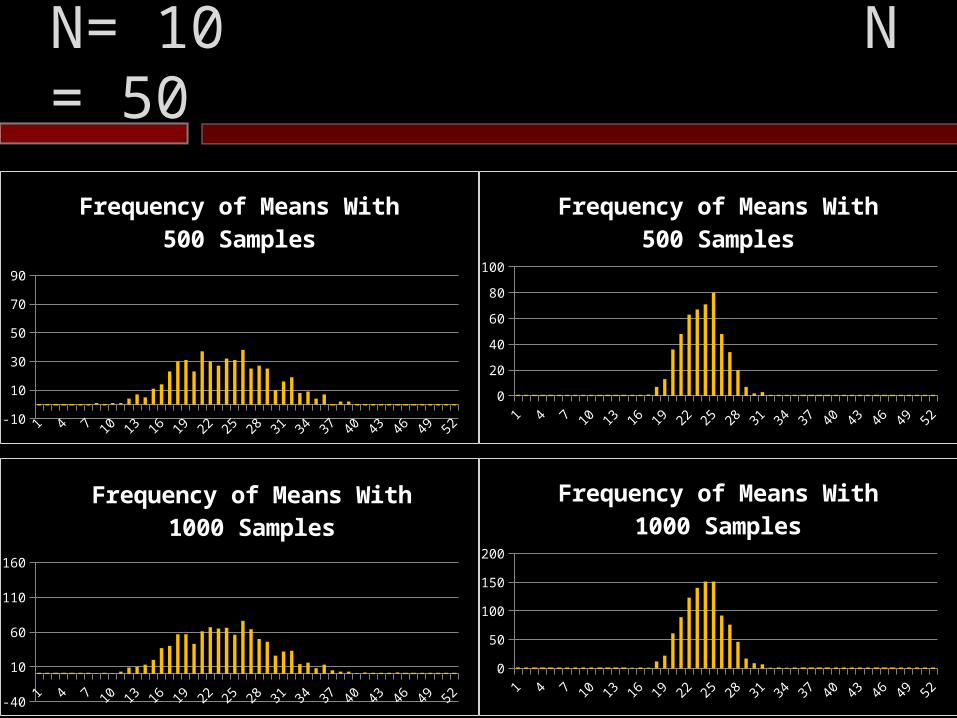
N= 10 N = 50
1 4 7 10 13 16 19 22 25 28 31 34 37 40 43 46 49 520
102030405060708090
Frequency of Means With 500 Samples
1 4 7 10 13 16 19 22 25 28 31 34 37 40 43 46 49 520
20406080
100120140160
Frequency of Means With 1000 Samples
1 4 7 10 13 16 19 22 25 28 31 34 37 40 43 46 49 520
102030405060708090
Frequency of Means With 500 Samples
1 4 7 10 13 16 19 22 25 28 31 34 37 40 43 46 49 520
20406080
100120140160
Frequency of Means With 1000 Samples
Lecture Outline
• Precision and accuracy • Statistical tools Population and sampling distribution Law of Large Number and Central Limit
Theorem Standard deviation and standard error
Standard deviation/error
• What’s the difference between the standard deviation and the standard error?
• The standard error = the standard deviation of the sampling distributions
Variance and Standard Deviation
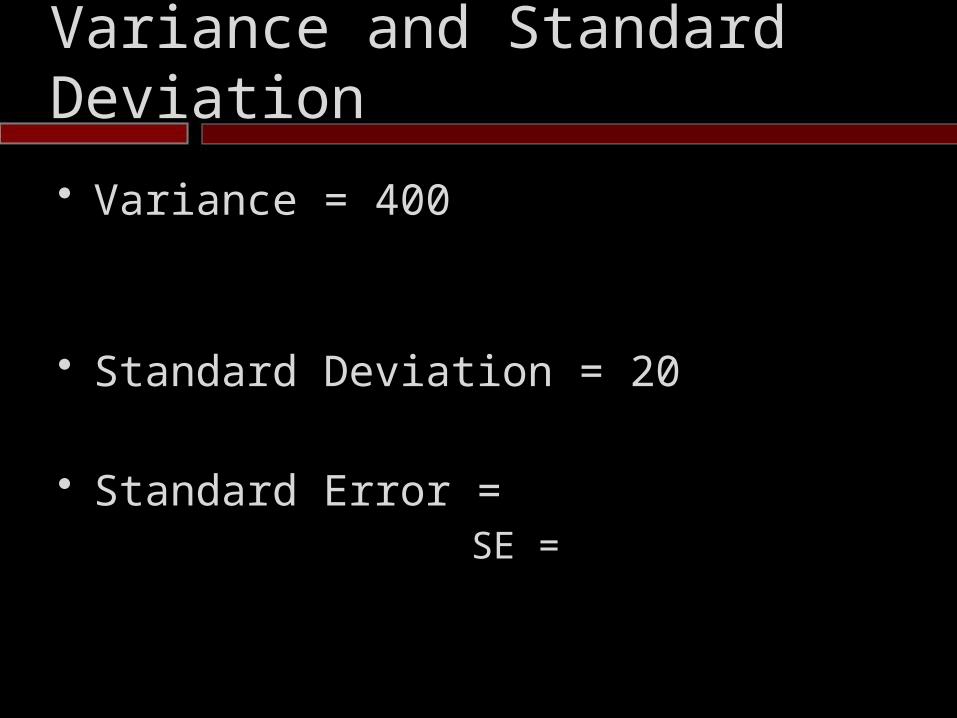
• Variance = 400
• Standard Deviation = 20
• Standard Error = SE =
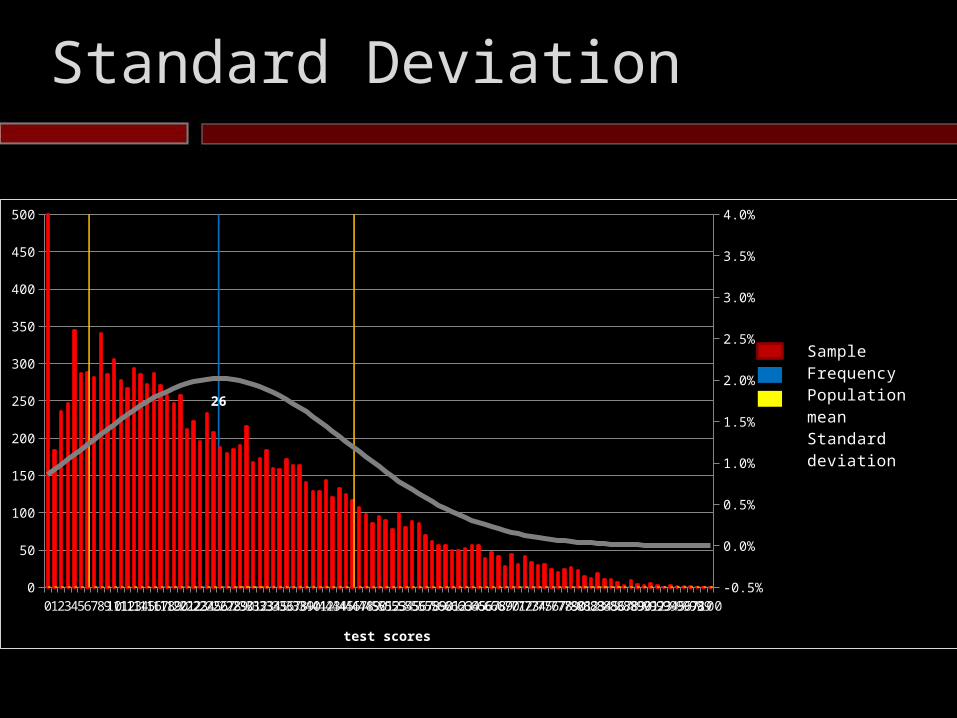
Standard Deviation
01234567891011121314151617181920212223242526272829303132333435363738394041424344454647484950515253545556575859606162636465666768697071727374757677787980818283848586878889909192939495969798991000
50
100
150
200
250
300
350
400
450
500
-0.5%
0.0%
0.5%
1.0%
1.5%
2.0%
2.5%
3.0%
3.5%
4.0%
26
test scores
Sample FrequencyPopulation mean Standard deviation
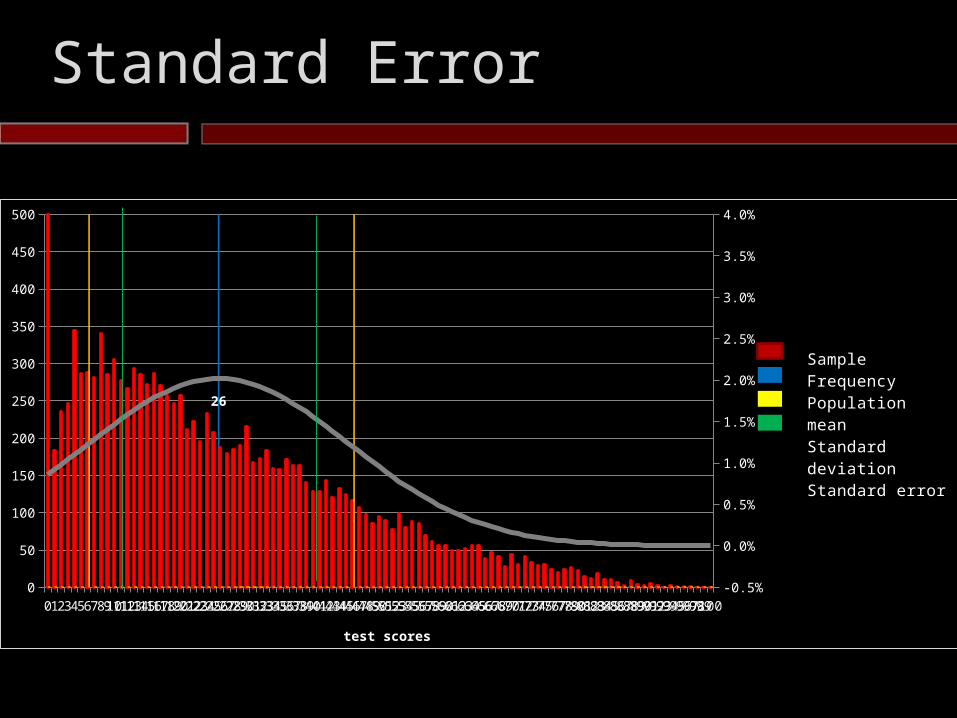
Standard Error
01234567891011121314151617181920212223242526272829303132333435363738394041424344454647484950515253545556575859606162636465666768697071727374757677787980818283848586878889909192939495969798991000
50
100
150
200
250
300
350
400
450
500
-0.5%
0.0%
0.5%
1.0%
1.5%
2.0%
2.5%
3.0%
3.5%
4.0%
26
test scores
Sample FrequencyPopulation mean Standard deviation Standard error
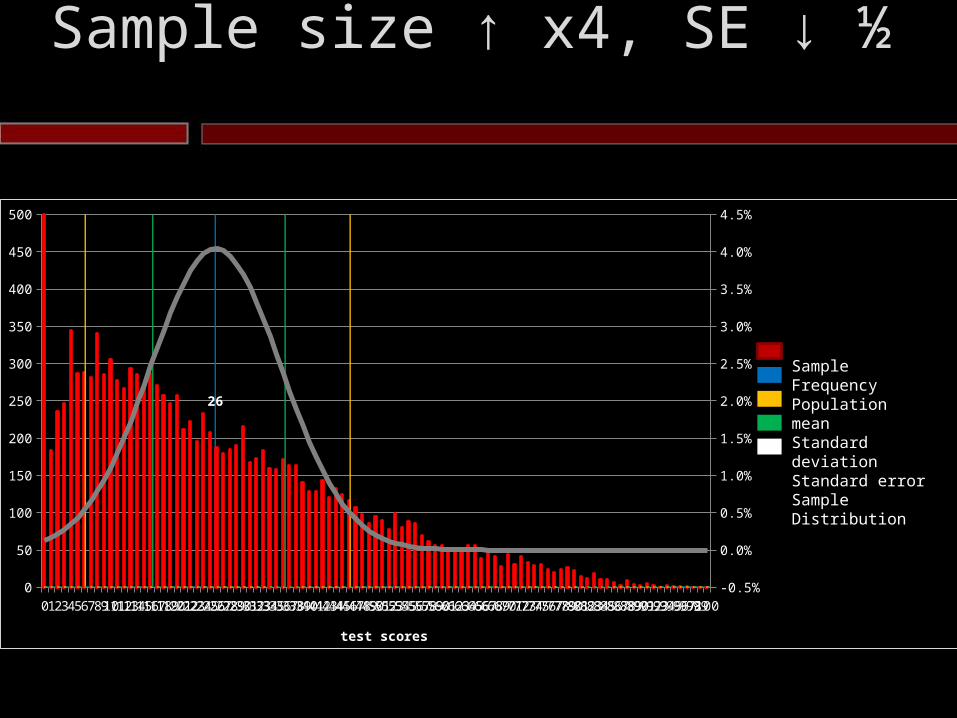
Sample size ↑ x4, SE ↓ ½
01234567891011121314151617181920212223242526272829303132333435363738394041424344454647484950515253545556575859606162636465666768697071727374757677787980818283848586878889909192939495969798991000
50
100
150
200
250
300
350
400
450
500
-0.5%
0.0%
0.5%
1.0%
1.5%
2.0%
2.5%
3.0%
3.5%
4.0%
4.5%
26
test scores
Sample Frequency Population mean Standard deviation Standard errorSample Distribution
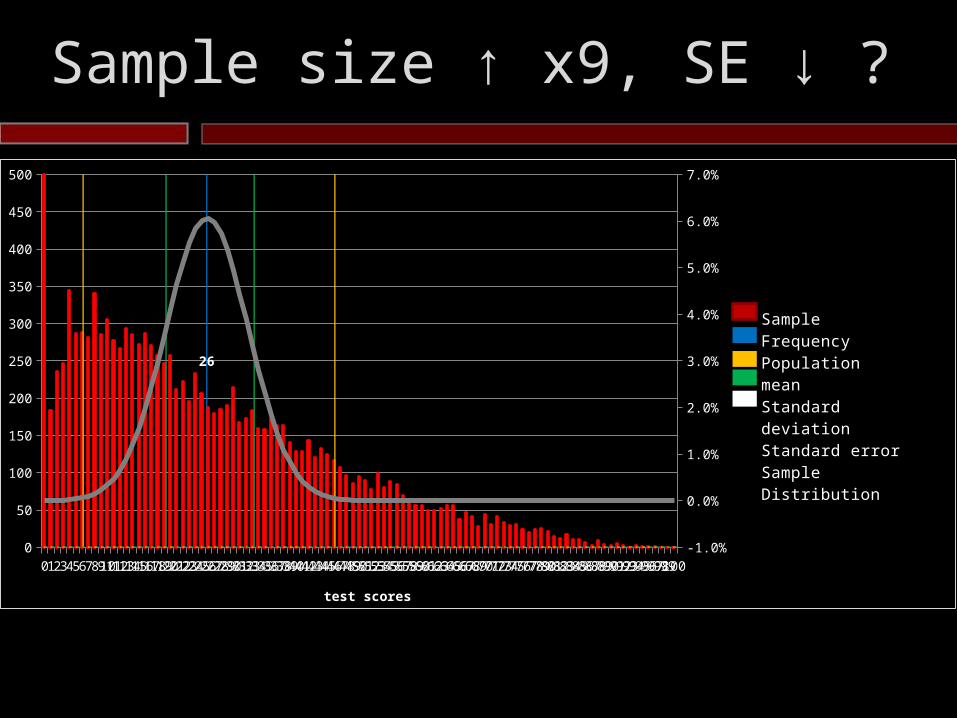
Sample size ↑ x9, SE ↓ ?
01234567891011121314151617181920212223242526272829303132333435363738394041424344454647484950515253545556575859606162636465666768697071727374757677787980818283848586878889909192939495969798991000
50
100
150
200
250
300
350
400
450
500
-1.0%
0.0%
1.0%
2.0%
3.0%
4.0%
5.0%
6.0%
7.0%
26
test scores
Sample Frequency Population mean Standard deviation Standard errorSample Distribution
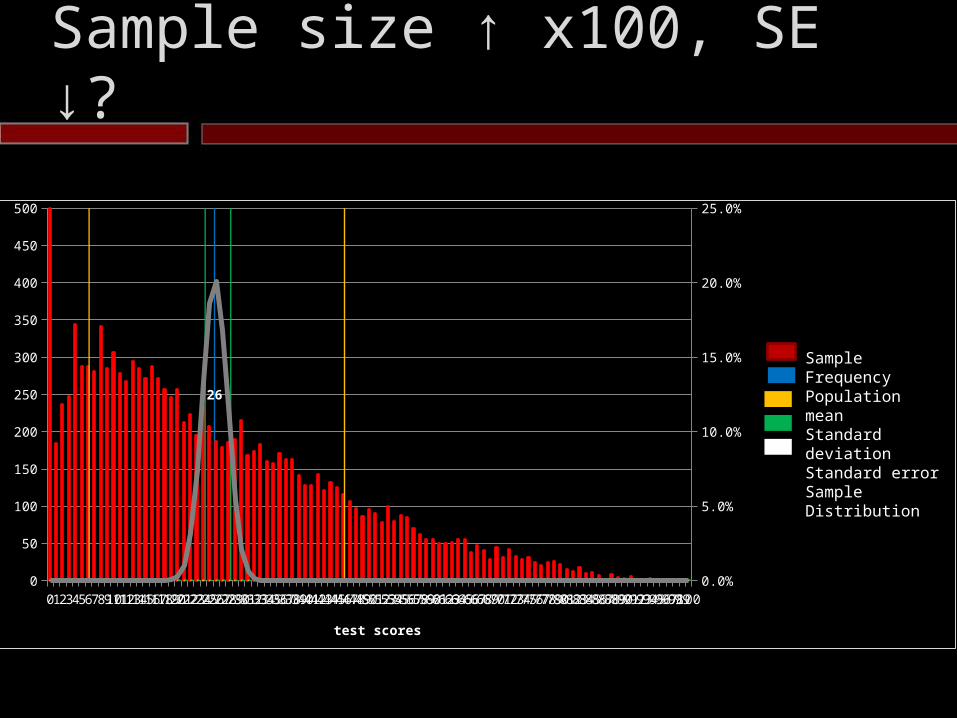
Sample size ↑ x100, SE ↓?
01234567891011121314151617181920212223242526272829303132333435363738394041424344454647484950515253545556575859606162636465666768697071727374757677787980818283848586878889909192939495969798991000
50
100
150
200
250
300
350
400
450
500
0.0%
5.0%
10.0%
15.0%
20.0%
25.0%
26
test scores
Sample Frequency Population mean Standard deviation Standard errorSample Distribution


![WHAT DRIVES YOUTH UNEMPLOYMENT AND WHAT … · (J-PAL); Vimal Ranchhod, Cecil Mlatsheni and Callie Ardington (Southern Africa Labour and Development Research Unit [SALDRU], UCT);](https://img.pdfslide.net/doc/110x75/5f0c97297e708231d4362947/what-drives-youth-unemployment-and-what-j-pal-vimal-ranchhod-cecil-mlatsheni.jpg)