Embed Size (px)
Citation preview

Road Traffic Accidents
Pravin Pisudde

Framework
• Introduction• Magnitude of the problem• Trends in RTA• Models for estimation of impact• Impacts • Epidemiological factors• Prevention• What we can do?• Studies in India• References

Introduction

Introduction
• First injury crash was supposedly suffered by a cyclist in New York City on 30 May 1896
• In 1974, the World Health Assembly adopted Resolution– road traffic accidents a major public health issue – Calling for Member States to address the problem.
• Past two decades, the World Bank also participated• WHO dedicated World Health Day for 2004 to Road Safety.• Other international organizations,
– the United Nations Economic Commission for Europe, – the United Nations Development Fund – United Nations Children’s Fund

Magnitude of the problem• Global– 1.3 million (2.2% of all deaths)– 20-50 million injured/disabled– 24 % of injury deaths

Projected deaths

Regional distribution
WHO region Low-income and middle-income countries
High-income countries
African region 28.3
Region of the Americas 16.2 14.8
South east asia region 18.6
European region 17.4 11
Eastern Mediterranean region
26.4 19
Western Pacific region 18.5 12

Indian distribution
• Latest estimated records from 2007 in india tells that– 1,25,000 deaths– 2,500,000 serious injuries– 6,250,000 mild injuries
• India has only 1% of vehicles in the world but accounts for nearly 6% of the total cases of unintentional injuries.
• accident rate corresponding to 45 per 100 000 population.

State wise distribution of RTIs in India, 2007 (Rate / 100,000 population; National average 10.1/ population)

Rate of RTI deaths in major cities (National Average 10.1/1,00,000)

Global and regional trends
• global and regional road fatality trends, 1987-1995

changes in road traffic fatality rates(death per 10 000 population), 1975-1998

Indian trends

Models for estimation of impactWHO Global Burden of Disease (GBD)
project• sixth place• Deaths: 0.99 million to 2.34 million
(representi ng 3.4% of all deaths).• 80% in low & middle-income
countries• decline by almost 30% in high-
income countries.• DALYs lost
– third leading.– second low & middle-income
countries.
• DALYs lost will increase worldwide from 34.3 million to 71.2 million (representing 5.1% of the global burden of disease).
World Bank’s Traffic Fatalities and Eco nomic Growth (TFEC) project
• South Asia largest growth in road traffic deaths, with increase of 144%.
• If the low-income and middle-income countries follow the general trend of the high-income countries.
• The model anticipates that India’s rate will not decline until 2042.
• Other low-income and middle-income country rates may begin to decline earlier, but their fatality rates will still be higher than those experi enced by high-income countries.

Impacts
• Economic impact– average annual cost of road crashes
• 1% of GNP in developing countries, • 1.5% in countries in economic transition • 2% in highly-motorized countries
– Low & middle-income countries: US$ 65 billion• Health impact– admission to a health facility
• Quarter of those injured severely: traumatic brain injury• 10% suffer open wounds, such as lacerations, and nearly• 20% expe rience fractures to the lower limbs
– 30%-86% of trauma admissions in LMIC
impacts
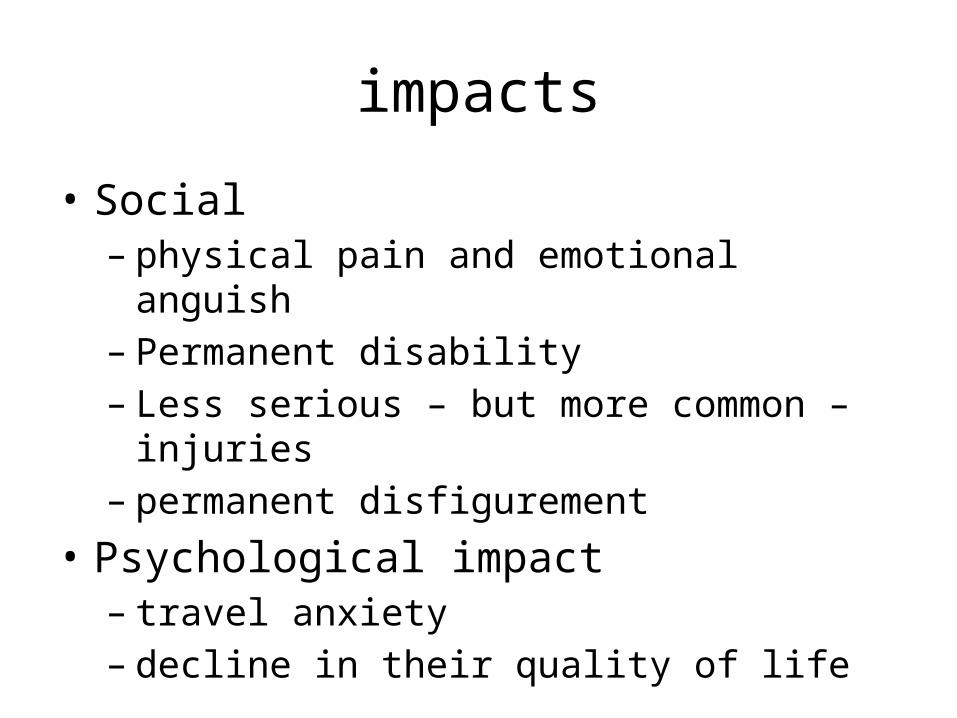
• Social– physical pain and emotional anguish– Permanent disability– Less serious – but more common – injuries– permanent disfigurement
• Psychological impact– travel anxiety– decline in their quality of life

Haddon matrixfactors
phase Human Vehicles & equipment enviroment
Pre crash Crash prevention
Information Attitudes Impairment Police
enforcement
Roadworthiness Lighting Braking Handling Speed management
Road design and road layout
Speed limits Pedestrian
facilities Crash Injury
prevention during the crash
Use of restraints
Impairment
Occupant restraints Other safety
devices Crash protective
design
Crash-protective
roadside objects
Post crash Life sustaining First-aid skill Access to
medics
Ease of access Fire risk
Rescue facilities Congestion

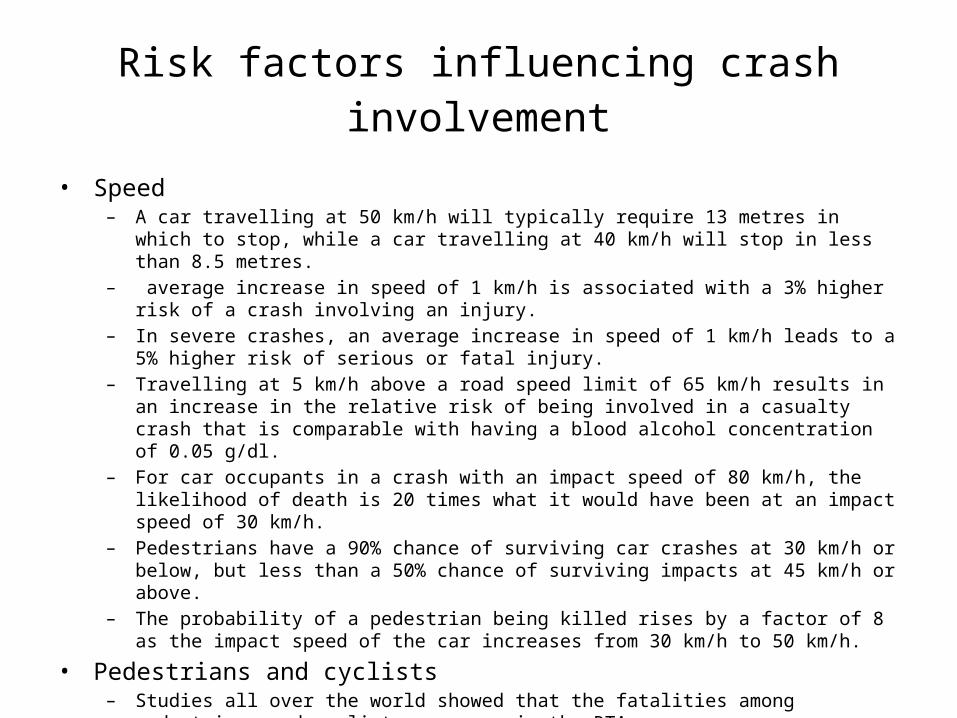
Risk factors influencing crash involvement
• Speed– Crash risk– Severity of crash injuries
• Pedestrians and cyclists• Young drivers and riders• Alcohol
– Crash risk– Age of drivers– Severity of crashes– Research on the role of alcohol in crashes– Perception of risk of being caught with excess alcohol– Pedestrians
• Medicinal and recreational drugs

Risk factors influencing crash involvement
• Driver fatigue• Hand-held mobile telephones• Inadequate visibility
– Cars and trucks– Motorized two-wheelers– Pedestrians and cyclists
• Road-related factors– Inattention to safety in planning new road networks– Inattention to safety in designing roads– Safety defects in existing roads– Lack of remedial action at high-risk crash sites
• Vehicle-related risk factors such as braking, handling and maintenance Defects in road design, layout and maintenance which can also lead to unsafe road user behaviour
• Being a vulnerable road user in urban and residential areas• Travelling in darkness• Poor road user eyesight
Risk factors influencing crash involvement
• Speed– A car travelling at 50 km/h will typically require 13 metres in which to stop, while a car travelling at
40 km/h will stop in less than 8.5 metres.– average increase in speed of 1 km/h is associated with a 3% higher risk of a crash involving an injury.– In severe crashes, an average increase in speed of 1 km/h leads to a 5% higher risk of serious or fatal
injury.– Travelling at 5 km/h above a road speed limit of 65 km/h results in an increase in the relative risk of
being involved in a casualty crash that is comparable with having a blood alcohol concentration of 0.05 g/dl.
– For car occupants in a crash with an impact speed of 80 km/h, the likelihood of death is 20 times what it would have been at an impact speed of 30 km/h.
– Pedestrians have a 90% chance of surviving car crashes at 30 km/h or below, but less than a 50% chance of surviving impacts at 45 km/h or above.
– The probability of a pedestrian being killed rises by a factor of 8 as the impact speed of the car increases from 30 km/h to 50 km/h.
• Pedestrians and cyclists– Studies all over the world showed that the fatalities among pedestrians and cyclists are more in the
RTA
• Young drivers and riders

Risk factors influencing crash involvement
• Alcohol– For the general driving population, as the blood alcohol content increases from zero, the risk of being involved in a crash starts
to rise significantly at a blood alcohol content of 0.04 g/dl.– Inexperienced young adults driving with a blood alcohol content of 0.05 g/dl have 2.5 times the risk of a crash compared with
more experienced drivers.– Drivers and motorcyclists with any blood alcohol content greater than zero are at higher risk of a crash than those whose blood
alcohol content is zero.– If a blood alcohol content limit is fixed at 0.10 g/dl, this will result in three times the risk of a crash than that at 0.05 g/dl, which
is the most common limit in high-income countries. If the legal limit stands at 0.08 g/dl, there will still be twice the risk than at 0.05 g/dl.
– Alcohol consumption by drivers puts pedestrians and riders of motorized two-wheelers at risk.
• Medicinal and recreational drugs• Driver fatigue
– Fatigue or sleepiness is associated with a range of factors. Some of these factors with relevance to road traffic are long-distance driving, sleep deprivation and the disruption of circadian rhythms.
– Three high risk groups have been identified:• young people, particularly males, aged 16–29 years;• shift workers whose sleep is disrupted by working at night or working long, irregular hours• people with untreated sleep apnoea syndrome or narcolepsy.
– Factors that substantially increase the risk of a fatal crash or a crash with serious injuries are:• driving while feeling sleepy;• driving after five hours of sleep;• driving between 02:00 and 05:00.

Risk factors influencing crash involvement• Hand-held mobile telephones
– The use of hand-held mobile telephones can adversely affect driver behaviour – as regards physical tasks as well as perception and decision making. The process of dialling influences a driver’s ability to keep to the course on the road. Results of studies on distraction and mental load show that driver reaction times are increased by 0.5–1.5 seconds when talking into a mobile telephone. Studies have shown that driver performance is particularly affected in maintaining the correct lane position and the headway between two vehicles travelling one behind the other, in keeping to an appropriate speed, and in judging and accepting safe gaps in the traffic. There is some evidence from studies that drivers who use mobile telephones while driving face a risk of a crash four times higher than the risk for drivers who do not use mobile telephones.
• Inadequate visibility– In low-income and middle-income countries, the phenomenon of pedestrians and vehicles not being
properly visible is frequently a serious problem. In many places, there are fewer roads with adequate illumination and some may not be lit at all. In addition, it is more common for large numbers of bicycles and other vehicles to have no lights or reflectors and for road space to be shared by fast-moving and slow-moving road users.
• Being a vulnerable road user in urban and residential areas• Travelling in darkness• Poor road user eyesight
Risk factors influencing crash involvement
• Road-related factors– Road crashes are not evenly distributed throughout the network. They may occur in clusters at single
sites, along particular sections of road, or scattered across whole residential neighbourhoods, especially in areas of social deprivation. While road engineering can greatly help in reducing the frequency and severity of road traffic crashes, it can also contribute to crashes. The road network has an effect on crash risk because it determines how road users perceive their environment, and it provides instructions for road users, through signs and traffic controls, on what they should be doing. Many traffic management and road safety engineering measures work through their influence on human behaviour. Road engineering factors include those where a road defect directly triggers a crash, where some element of the road environment misleads a road user and thereby creates error, or where some feasible physical alteration to the road would have made the crash less likely. In the planning, design and maintenance of the road network, the following four particular elements affecting road safety have been identified:• safety-awareness in the planning of new road networks;• the incorporation of safety features in the design of new roads;• safety improvements to existing roads;• remedial action at high-risk crash sites.
• Vehicle-related risk factors such as braking, handling and maintenance Defects in road design, layout and maintenance which can also lead to unsafe road user behaviour

Risk factors influencing injury severity• Lack of in-vehicle crash protection
– In low-income and middle-income countries, regulation of motor vehicle safety standards is not as systematic as in high-income countries. Many engineering advances to be found in vehicles available in high-income countries are not standard fittings in vehicles in low-income and middle-income countries. In addition, the majority of road casualties in low income and middle-income countries occur outside the car, affecting pedestrians, cyclists, motorized two-wheeled vehicle riders, or passengers in buses and trucks
– The main injury risks for car occupants arise from the way vehicles interact with each other and with the roadside in frontal and side-impact crashes. In fatal and serious crashes, head, chest and abdominal injuries are predominant. Among injuries that cause disability, those to the legs and neck are important.
• Non-use of crash helmets by two-wheeled vehicle users .– Non-helmeted users of motorized two-wheelers are three times more likely to sustain head injuries
in a crash compared to those wearing helmets.– Helmet-wearing rates vary from slightly over zero in some low-income countries to almost 100% in
places where laws on helmet use are effectively enforced. – Although helmets have generally been widely worn in most high-income countries, there is evidence
of a decline in usage in some countries.– More than half of adult riders of motorized two-wheelers in some low-income countries do not wear
their helmets properly secured.– Child passengers rarely wear helmets, or wear adult helmets that do not adequately protect them.

Risk factors influencing injury severity
• Non-use of seat-belts and child restraints in motor vehicles– most serious injuries occurring in frontal impacts to occupants unrestrained by
seatbelts are to the head.– Correctly used seat belt reduce the death in a crash by approximately 60%– The use of child restraints can reduce infant death in car crashes by 71% and toddler
deaths by 54%.• Roadside objects not crash protective
– Impacts between vehicles leaving the road and solid roadside objects such as trees, poles and road signs are a major road safety problem worldwide.
– single-vehicle crashes and frequently involve young drivers, excess or inappropriate speed, the use of alcohol or driver fatigue.
– Another problem related to impacts with objects off the road is the occurrence of crashes caused by restricted visibility, resulting from the poor siting of these objects.
• Human tolerance factors• Inappropriate or excessive speed• Presence of alcohol and other drugs
Risk factors influencing post-crash injury outcome
• Pre-hospital factors– Delay in detecting crash – Presence of fire resulting from collision– Leakage of hazardous materials– Presence of alcohol and other drugs– Difficulty rescuing and extracting people from vehicles– Difficulty evacuating people from buses and coaches
involved in crash• Hospital care factors
– Lack of appropriate care in the hospital emergency rooms– Lack of trained expertise in trauma care– Lack of equipment

Managing exposure to risk through transport and land-use policies
• Reducing motor vehicle traffic– Efficient land use– Safety impact assessments of transport and land-use plans– Providing shorter, safer routes– Trip reduction measures
• Encouraging use of safer modes of travel• Minimizing exposure to high-risk scenarios
– Restricting access to different parts of the road network– Giving priority in the road network to higher occupancy vehicles– Restrictions on speed and engine performance of motorized two-wheelers– Increasing the legal age for use of motorized two-wheelers
• Graduated driver licensing systems

Shaping the road network for road injury prevention
• Safety-awareness in planning road networks– Classifying roads and setting speed limits by their function
• Incorporating safety features into road design– Higher-speed roads– Single-lane carriageways– Residential access roads– Area-wide urban safety management– Safer routes for pedestrians and cyclists.
• Traffic-calming measures
– Safety audits– Crash-protective roadsides– Crash cushions
• Remedial action at high-risk crash sites

Providing visible, crash-protective, “smart” vehicles
• Improving the visibility of vehicles– Daytime running lights for cars– High-mounted stop lamps in cars– Daytime running lights for motorized two-wheelers– Improving the visibility of non-motorized vehicles
• Crash-protective vehicle design– Safer car fronts to protect pedestrians and cyclists– Safer bus and truck fronts– Car occupant protection
• Frontal and side impact protection• Occupant restraints• Protection against roadside objects
– Vehicle-to-vehicle compatibility– Front, rear and side under-run guards on trucks– Design of non-motorized vehicles
• “Intelligent” vehicles– “Smart”, audible seat-belt reminders– Speed adaptation– Alcohol interlocks– On-board electronic stability programmes

Setting and securing compliance with key road safety rules
• Setting and enforcing speed limits– Speed enforcement on rural roads– Speed cameras– Speed limiters in heavy goods and public transport vehicles
• Setting and enforcing alcohol impairment laws– Blood alcohol concentration limits– Blood alcohol concentration limits for the general driving population– Lower blood alcohol concentration limits for young or inexperienced drivers– Minimum drinking-age laws– Deterring excess alcohol offenders– Random breath testing and sobriety checkpoints– Mass media campaigns– Penalties for excess alcohol offenders– Interventions for high-risk offenders
• Medicinal and recreational drugs

Setting and securing compliance with key road safety rules
• Drivers’ hours of work in commercial and public transport• Cameras at traffic lights• Setting and enforcing seat-belt and child restraint use• Enforcement and publicity• Mandatory child restraint laws
– Child restraint loan programmes• Setting and enforcing mandatory crash helmet use
– Bicycle helmets– Motorcycle helmets– Mandatory laws on helmet wearing
• The role of education, information and publicity

Delivering post-crash care
• Chain of help for patients injured in road crashes• Pre-hospital care– Role of lay bystanders– Access to the emergency medical system
• The hospital setting– Human resources– Physical resources– Organization of trauma care
• Rehabilitation

What we can do?• Encourage governments to make the roads safe.• Identify local safety problems.• Help plan safe and efficient transport systems that accommodate
drivers as well as vulnerable road users, such as bicyclists and pedestrians.
• Demand the provision of safety features, such as seat-belts, in cars.• Encourage enforcement of traffic safety laws and regulations, and
campaign for firm and swift punishment for traffic offenders.• Behave responsibly by:
– abiding by the speed limit on roads;– never driving when over the legal alcohol limit;– always wearing a seat-belt and properly restraining children, even on
short trips; wearing a crash helmet when riding a two-wheeler.

REFERENCES
1. World report on road traffic injury prevention. World Health Organization 2004. Geneva.
2. National Crime Records Bureau. Accidental deaths and suicides in India. Ministry of Home Affairs, New Delhi, Government of India, 2007.
3. World Health Organization. Road traffic injury prevention : training manual. World Health Organization 2006.
4. Dr E.Krug World Health Organization. Road Traffic Injuries. Fact sheet. World Health Organization 2006.