Embed Size (px)
Citation preview

Transport for South Hampshire Evidence Base Road Traffic Model Calibration and Validation Summary Report 4
Report for Transport for South Hampshire
August 2011

This report, and information or advice which it contains, is provided by MVA Consultancy Ltd solely for internal use and reliance by its Client in performance of MVA Consultancy Ltd’s duties and liabilities under its contract with the Client. Any advice, opinions, or recommendations within this report should be read and relied upon only in the context of the report as a whole. The advice and opinions in this report are based upon the information made available to MVA Consultancy Ltd at the date of this report and on current UK standards, codes, technology and construction practices as at the date of this report. Following final delivery of this report to the Client, MVA Consultancy Ltd will have no further obligations or duty to advise the Client on any matters, including development affecting the information or advice provided in this report. This report has been prepared by MVA Consultancy Ltd in their professional capacity as Consultants. The contents of the report do not, in any way, purport to include any manner of legal advice or opinion. This report is prepared in accordance with the terms and conditions of MVA Consultancy Ltd’s contract with the Client. Regard should be had to those terms and conditions when considering and/or placing any reliance on this report. Should the Client wish to release this report to a Third Party for that party's reliance, MVA Consultancy Ltd may, at its discretion, agree to such release provided that: (a) MVA Consultancy Ltd's written agreement is obtained prior to such release, and (b) by release of the report to the Third Party, that Third Party does not acquire any rights, contractual or otherwise, whatsoever against MVA Consultancy Ltd and MVA Consultancy Ltd, accordingly, assume no duties, liabilities or obligations to that Third Party, and (c) MVA Consultancy Ltd accepts no responsibility for any loss or damage incurred by the Client or for any conflict of MVA Consultancy Ltd's interests arising out of the Client's release of this report to the Third Party.
Document Control
Project Title: Transport for South Hampshire Evidence Base
MVA Project Number: C39344
Document Type: Road Traffic Model Calibration and Validation Summary
Directory & File Name: J:\C39344_Transport_For_SOUTH_HAMPSHIRE_Model_Suite\MVA_Docs\Re
ports\R4 RTM Calibration And Validation Report\V2\Tfsh_R4_RTM
Calibration And Validation Report_V2a.Doc
Document Approval
Primary Author: Nick Benbow
Other Author(s): Ian Wilkinson, Rehan Mian, Eddie Strankalis, David Carter
Reviewer(s): Ian Burden, David Carter
Formatted by: Sally Watts
Distribution
Issue Date Distribution Comments
0 28/04/11 Steve Williamson Structure for comment with DC revisions
1 10/06/11 Evidence Base Progress Group Draft for comments
2 25/08/11 Evidence Base Progress Group Final Incorporating client comments
Contents

Contents
Road Traffic Model Calibration and Validation Summary Report 4 2
Foreword i
1 Introduction 1.1 1.1 Background 1.1 1.2 Context and Scope 1.1
2 Model Dimensions 2.1 2.1 Introduction 2.1 2.2 Model Areas 2.1 2.3 Zoning 2.2 2.4 Dimensions 2.3
3 Data Sources 3.1 3.1 Introduction 3.1 3.2 Summary of Data Sources 3.1 3.3 Data Collection Locations and Routes 3.3
4 Network Development 4.1 4.1 Introduction 4.1 4.2 Network Coding 4.1 4.3 Quality Assurance 4.4 4.4 Network Calibration 4.4 4.5 Network Validation 4.5
5 Matrix Development 5.1 5.1 Introduction 5.1 5.2 Partial Matrices 5.1 5.3 Trip Ends 5.3 5.4 Synthetic Matrices 5.4 5.5 LGV and HGV Matrices 5.5
6 Calibration and Validation 6.1 6.1 Introduction 6.1 6.2 Matrix Estimation 6.1 6.3 Assignment Process and Convergence 6.2 6.4 Validation Criteria 6.2 6.5 Traffic Flow Validation 6.4 6.6 Journey Time Validation 6.5
7 Fitness for Purpose 7.1

Contents
Road Traffic Model Calibration and Validation Summary Report 4 3
Tables
Table 2.1 Network Structure by Model Area 2.2 Table 3.1 Data Sources 3.1 Table 4.1 Default Main Line Saturation Flows 4.3 Table 5.1 Trip Purpose Segmentations 5.1 Table 6.1 Validation Criterion and Acceptability Guideline 6.3 Table 6.2 Screenline Validation Results 6.4 Table 6.3 Screenline Validation Results 6.4 Table 6.4 Journey Time Validation Results 6.5 Table 6.5 Relaxed Criteria Screenline Validation Results 6.5 Table 6.6 Relaxed Criteria Link Validation Results 6.6 Table 6.7 Relaxed Criteria Journey Time Validation Results 6.6
Figures
Figure 1.1 TfSH Sub-Regional Transport Model 1.2 Figure 2.1 Study Area of the RTM 2.1 Figure 2.2 SRTM Zone system around the Study Area 2.3 Figure 3.1 Location of RSI Sites and Screenlines 3.3 Figure 3.2 Automatic Number Plate Recognition Sites 3.4 Figure 3.3 Location of Calibration Screenlines 3.4 Figure 3.4 Map of Journey Time Assessment Routes 3.5 Figure 3.5 Saturation Flow Survey Junction Locations 3.5 Figure 3.6 Map of Journey Time Assessment Routes 3.6 Figure 4.1 Network Building Process 4.1 Figure 4.2 RTM Network 4.2

TfSH Evidence Base: Sub‐Regional Transport
Model
Foreword The TfSH Steering Group was formed in July 2009 and has met every two months to oversee and direct the development of the TfSH Evidence Base. The Steering Group’s first objective is:
• To develop an Evidence Base consisting of WebTAG compliant analysis and forecasting tools to define current and future problems and develop practical solutions of improvement schemes and interventions to resolve them and achieve local, regional and national objectives;
The development of the Evidence Base is centred on the Sub‐Regional Transport Model (SRTM) and has covered to date:
• Tender specification and appointment of Consultants; • 2010 Data Collection and R1 Report of Surveys; • Development of the SRTM Suite consisting of:
o Main Demand Model, o Local Economic Impact Model, o Road Traffic Model, o Public Transport Model, and o Gateway Demand Model.
This Report documents the development, calibration and validation of one or more of these models. An important objective of the consultant’s specification and subsequent role of the Steering Group has been to achieve the successful development of the SRTM to time and budget, and in accordance with current best practice and guidance laid down by the Department for Transport in its Transport Appraisal Guidance (webTAG). In so far as it has been feasible, the Steering Group is satisfied that the development of the SRTM described in this report meets its first objective. Signatories
1
Road Traffic Model Calibration and Validation Summary Report 4 1.1
1 Introduction
1.1 Background
1.1.1 MVA Consultancy and Hyder were commissioned, as part of a wider team, to support
Transport for South Hampshire (TfSH) with the development and application of a Sub-
Regional Transport Model Suite (SRTM) for this nationally important area.
1.1.2 The SRTM will be used to support a wide-ranging set of interventions across the TfSH sub-
region, and is specifically required to be capable of:
forecasting changes in travel demand, road traffic, public transport patronage and
active mode use over time as a result of changing economic conditions, land-use
policies and development, and transport improvement and interventions;
testing the impacts of land-use and transport policies and strategies within a
relatively short model run time; and
testing the impacts of individual transport interventions in the increased detail
necessary for preparing submissions for inclusion in funding programmes within
practical (but probably longer) run times.
1.1.3 This Report describes the development, calibration and validation of the Road Traffic Model
(RTM) within the SRTM.
1.2 Context and Scope
1.2.1 SRTM is a suite of linked models comprising the following components as shown in Figure
1.1:
the Main Demand Model (MDM) which predicts when (time of day), where
(destination choice) and how (choice of mode) journeys are made;
the Gateway Demand Model (GDM) which predicts demand for travel from ports and
airports;
the Road Traffic Model (RTM) which determines the routes taken by vehicles through
the road network and journey times, accounting for congestion;
the Public Transport Model (PTM) which determines routes and services chosen by
public transport passengers; and
an associated Local Economic Impact Model (LEIM) which uses inputs including
transport costs to forecast the quantum and location of households, populations and
jobs.

1 Introduction
Road Traffic Model Calibration and Validation Summary Report 4 1.2
Figure 1.1 TfSH Sub-Regional Transport Model
Main Demand ModelMDM
Road Traffic Model RTM
Public Transport Model PTM
HW
Dem
and
HW speeds
Bus Frequency
Gateway Demand Model
GDM
Sub-Regional Transport ModelSRTMLocal Economic
Impact Model LEIM
HW
Gen
Cos
t
PT G
en C
ost
PT D
eman
d
Costs
Port/Airport demand(HW & PT)
Costs
Population & Employment
Main Demand ModelMDM
Road Traffic Model RTM
Public Transport Model PTM
HW
Dem
and
HW speeds
Bus Frequency
Gateway Demand Model
GDM
Sub-Regional Transport ModelSRTMLocal Economic
Impact Model LEIM
HW
Gen
Cos
t
PT G
en C
ost
PT D
eman
d
Costs
Port/Airport demand(HW & PT)
Costs
Population & Employment
1.2.2 The RTM has been developed to represent the base year demand, route choices and costs on
the highway network. In terms of future scenarios, it will represent the network impacts of
different policy and infrastructure interventions.
1.2.3 It is important that the RTM includes the ability to model traffic behaviour at junctions,
including flow metering downstream from bottlenecks as well as blocking-back through
upstream junctions. As such SATURN was selected as the most appropriate software
package to use. SATURN is perhaps the most commonly used highway modelling software in
the UK, benefiting from a large user base, customer support and regular maintenance, and
has been used successfully for many applications since its first release in 1981.

Road Traffic Model Calibration and Validation Summary Report 4 2.1
2 Model Dimensions
2.1 Introduction
2.1.1 This chapter summarises the features of the RTM and includes the following sections:
Geographic scope;
Zoning system;
Time periods;
Modelled years; and
User classes.
2.2 Model Areas
2.2.1 The modelled area of the RTM is sub-divided into four regions, shown in Figure 2.1, which differ by zone
aggregation and modelling detail, as follows:
Core Fully Modelled Area (FMA) – the Transport for South Hampshire area (detailed
zoning);
Marginal Fully Modelled Area (detailed zoning);
Buffer Area (zones based on wards); and
External (zones based on districts).
Figure 2.1 Study Area of the RTM
2 Model Dimensions
Road Traffic Model Calibration and Validation Summary Report 4 2.2
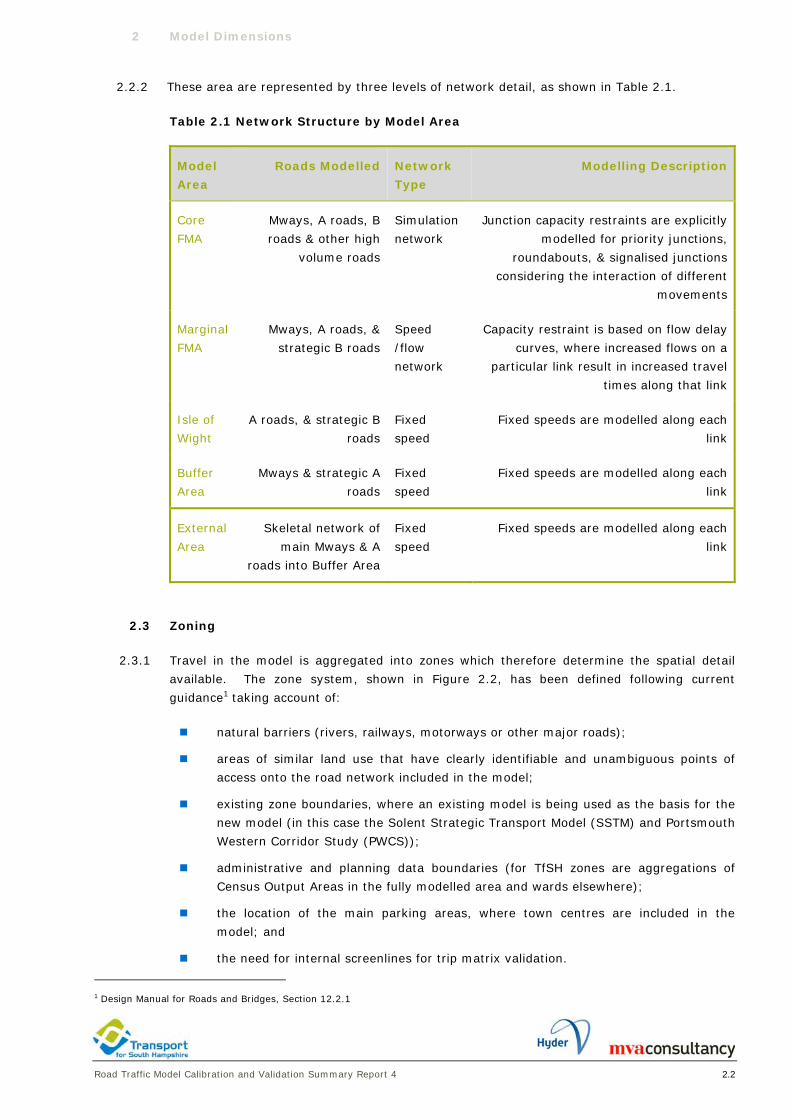
2.2.2 These area are represented by three levels of network detail, as shown in Table 2.1.
Table 2.1 Network Structure by Model Area
Model
Area
Roads Modelled Network
Type
Modelling Description
Core
FMA
Mways, A roads, B
roads & other high
volume roads
Simulation
network
Junction capacity restraints are explicitly
modelled for priority junctions,
roundabouts, & signalised junctions
considering the interaction of different
movements
Marginal
FMA
Mways, A roads, &
strategic B roads
Speed
/flow
network
Capacity restraint is based on flow delay
curves, where increased flows on a
particular link result in increased travel
times along that link
Isle of
Wight
A roads, & strategic B
roads
Fixed
speed
Fixed speeds are modelled along each
link
Buffer
Area
Mways & strategic A
roads
Fixed
speed
Fixed speeds are modelled along each
link
External
Area
Skeletal network of
main Mways & A
roads into Buffer Area
Fixed
speed
Fixed speeds are modelled along each
link
2.3 Zoning
2.3.1 Travel in the model is aggregated into zones which therefore determine the spatial detail
available. The zone system, shown in Figure 2.2, has been defined following current
guidance1 taking account of:
natural barriers (rivers, railways, motorways or other major roads);
areas of similar land use that have clearly identifiable and unambiguous points of
access onto the road network included in the model;
existing zone boundaries, where an existing model is being used as the basis for the
new model (in this case the Solent Strategic Transport Model (SSTM) and Portsmouth
Western Corridor Study (PWCS));
administrative and planning data boundaries (for TfSH zones are aggregations of
Census Output Areas in the fully modelled area and wards elsewhere);
the location of the main parking areas, where town centres are included in the
model; and
the need for internal screenlines for trip matrix validation.
1 Design Manual for Roads and Bridges, Section 12.2.1
2 Model Dimensions
Road Traffic Model Calibration and Validation Summary Report 4 2.3
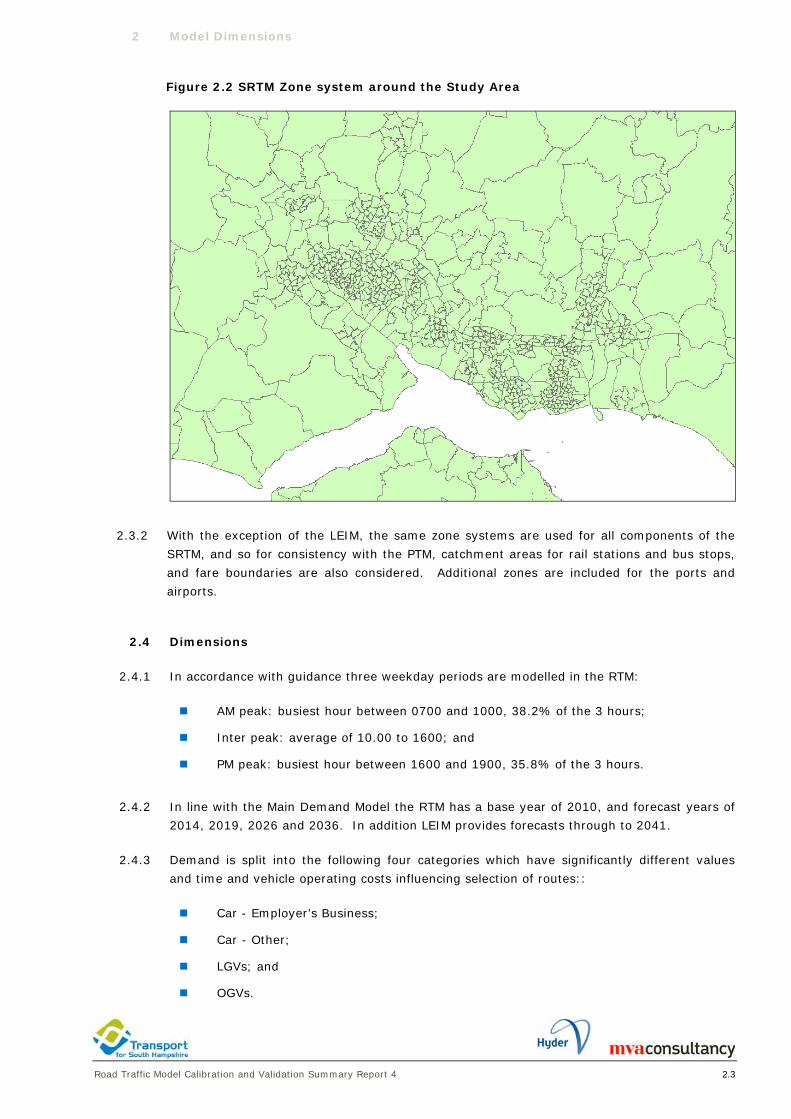
Figure 2.2 SRTM Zone system around the Study Area
2.3.2 With the exception of the LEIM, the same zone systems are used for all components of the
SRTM, and so for consistency with the PTM, catchment areas for rail stations and bus stops,
and fare boundaries are also considered. Additional zones are included for the ports and
airports.
2.4 Dimensions
2.4.1 In accordance with guidance three weekday periods are modelled in the RTM:
AM peak: busiest hour between 0700 and 1000, 38.2% of the 3 hours;
Inter peak: average of 10.00 to 1600; and
PM peak: busiest hour between 1600 and 1900, 35.8% of the 3 hours.
2.4.2 In line with the Main Demand Model the RTM has a base year of 2010, and forecast years of
2014, 2019, 2026 and 2036. In addition LEIM provides forecasts through to 2041.
2.4.3 Demand is split into the following four categories which have significantly different values
and time and vehicle operating costs influencing selection of routes::
Car - Employer’s Business;
Car - Other;
LGVs; and
OGVs.
Road Traffic Model Calibration and Validation Summary Report 4 3.1
3 Data Sources
3.1 Introduction
3.1.1 This chapter describes the data used to calibrate and validate the RTM.
3.2 Summary of Data Sources
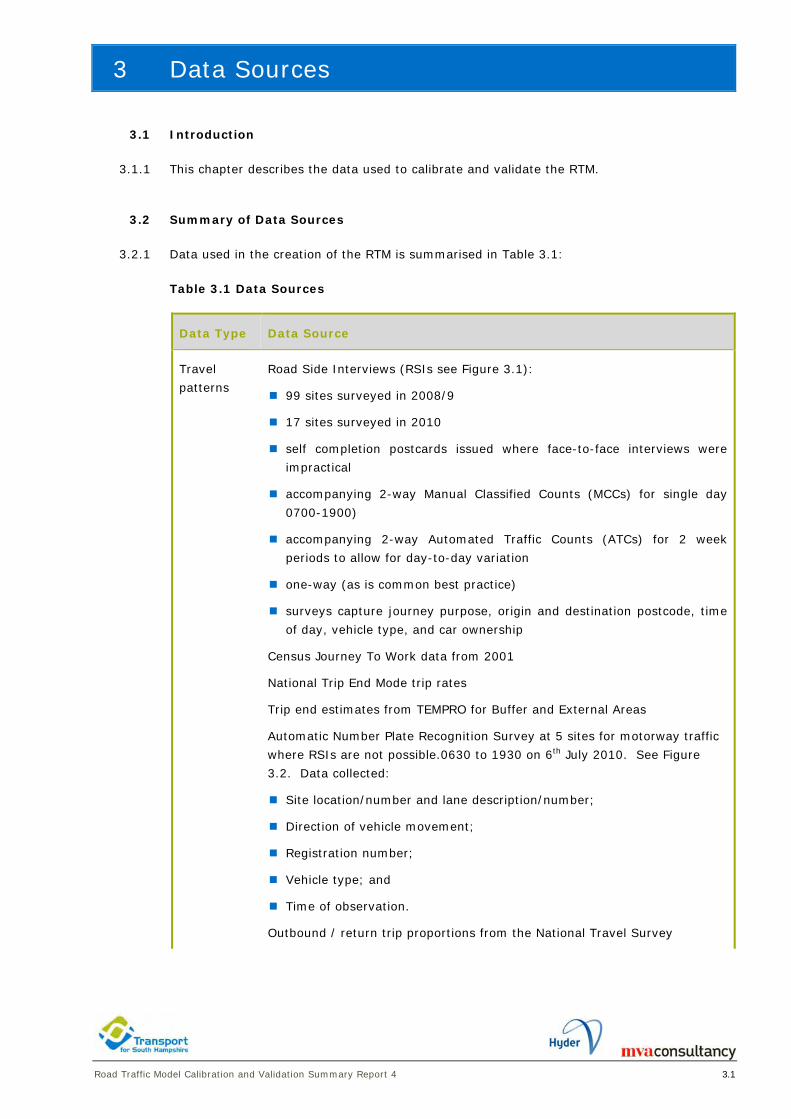
3.2.1 Data used in the creation of the RTM is summarised in Table 3.1:
Table 3.1 Data Sources
Data Type Data Source
Travel
patterns
Road Side Interviews (RSIs see Figure 3.1):
99 sites surveyed in 2008/9
17 sites surveyed in 2010
self completion postcards issued where face-to-face interviews were
impractical
accompanying 2-way Manual Classified Counts (MCCs) for single day
0700-1900)
accompanying 2-way Automated Traffic Counts (ATCs) for 2 week
periods to allow for day-to-day variation
one-way (as is common best practice)
surveys capture journey purpose, origin and destination postcode, time
of day, vehicle type, and car ownership
Census Journey To Work data from 2001
National Trip End Mode trip rates
Trip end estimates from TEMPRO for Buffer and External Areas
Automatic Number Plate Recognition Survey at 5 sites for motorway traffic
where RSIs are not possible.0630 to 1930 on 6th July 2010. See Figure
3.2. Data collected:
Site location/number and lane description/number;
Direction of vehicle movement;
Registration number;
Vehicle type; and
Time of observation.
Outbound / return trip proportions from the National Travel Survey
3 Data Sources
Road Traffic Model Calibration and Validation Summary Report 4 3.2
Data Type Data Source
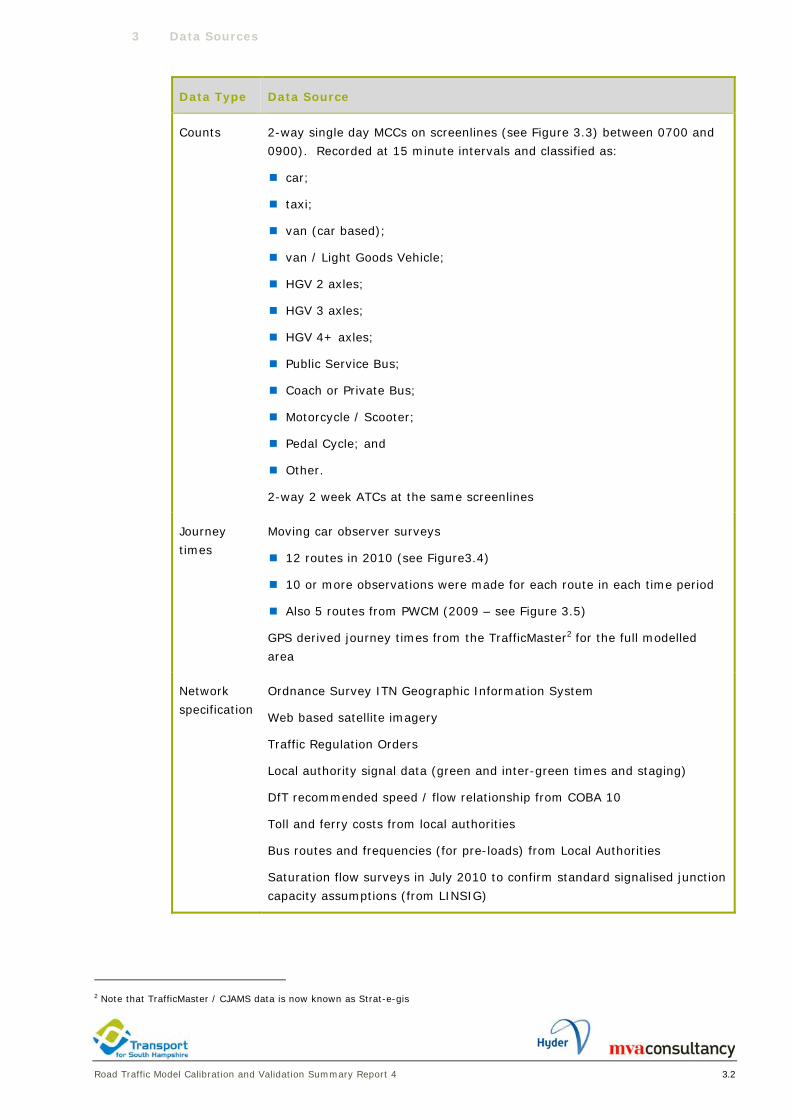
Counts 2-way single day MCCs on screenlines (see Figure 3.3) between 0700 and
0900). Recorded at 15 minute intervals and classified as:
car;
taxi;
van (car based);
van / Light Goods Vehicle;
HGV 2 axles;
HGV 3 axles;
HGV 4+ axles;
Public Service Bus;
Coach or Private Bus;
Motorcycle / Scooter;
Pedal Cycle; and
Other.
2-way 2 week ATCs at the same screenlines
Journey
times
Moving car observer surveys
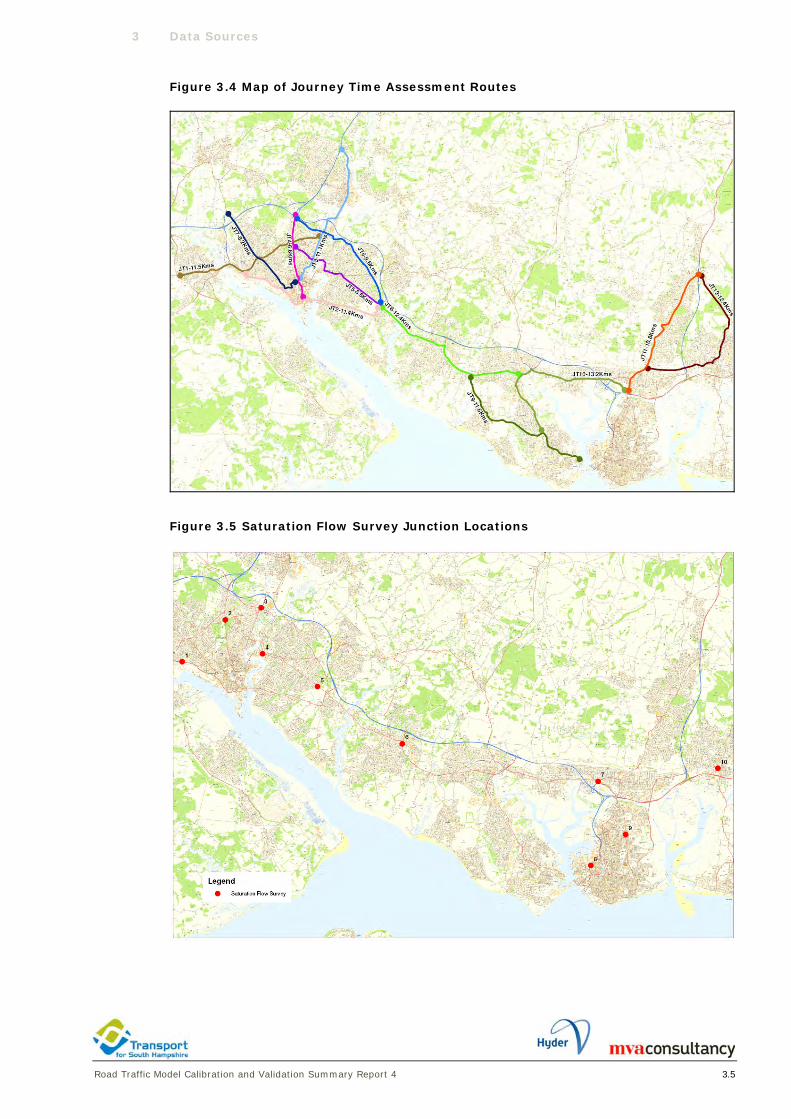
12 routes in 2010 (see Figure3.4)
10 or more observations were made for each route in each time period
Also 5 routes from PWCM (2009 – see Figure 3.5)
GPS derived journey times from the TrafficMaster2 for the full modelled
area
Network
specification
Ordnance Survey ITN Geographic Information System
Web based satellite imagery
Traffic Regulation Orders
Local authority signal data (green and inter-green times and staging)
DfT recommended speed / flow relationship from COBA 10
Toll and ferry costs from local authorities
Bus routes and frequencies (for pre-loads) from Local Authorities
Saturation flow surveys in July 2010 to confirm standard signalised junction
capacity assumptions (from LINSIG)
2 Note that TrafficMaster / CJAMS data is now known as Strat-e-gis

3 Data Sources
Road Traffic Model Calibration and Validation Summary Report 4 3.3
3.3 Data Collection Locations and Routes
3.3.1 The following figures, referenced in Table 3.1, illustrate the location of interview and count data, and
journey time routes.
Figure 3.1 Location of RSI Sites and Screenlines

3 Data Sources
Road Traffic Model Calibration and Validation Summary Report 4 3.4
Figure 3.2 Automatic Number Plate Recognition Sites
Figure 3.3 Location of Calibration Screenlines
3 Data Sources
Road Traffic Model Calibration and Validation Summary Report 4 3.5
Figure 3.4 Map of Journey Time Assessment Routes
Figure 3.5 Saturation Flow Survey Junction Locations

3 Data Sources
Road Traffic Model Calibration and Validation Summary Report 4 3.6
Figure 3.6 Map of Journey Time Assessment Routes

Road Traffic Model Calibration and Validation Summary Report 4 4.1
4 Network Development
4.1 Introduction
4.1.1 This chapter summarises the processes used to construct the highway network, and steps
followed to ensure its fitness for purpose.
4.2 Network Coding
4.2.1 A systematic approach was adopted to develop to RTM network using the data sources
described in Table 3.1. The approach followed the sequential steps shown in Figure 4.1.
Figure 4.1 Network Building Process
Develop road network structure
Define saturation flows
Define link types
Define gap acceptance parameters
Define speed flow curves
Identify junction types
Local Authority traffic signal data
Define core, marginal, buffer & external areas
Identify areas of buffer to be modelled using speed / flow relationships
Derive fixed speeds for the external area
Calculate fixed speeds for links not covered by TrafficMaster data by
calculating average speed by link type
Combine buffer & simulation network information to create whole network
Code vehicle specific banned turns
Code bus route / bus lane information
Code toll value information
Ordnance Survey ITN data
SRTM zoning system
Code number of entry lanes and flaring
Code no entries and one-way linksWeb based portal satellite imagery
Traffic Road Orders
Saturation Flow Surveys
Define location of centroid connectors
Code signalised junctions
TrafficMaster data
Code centroid connectors
Code link types
Code speed flow curves
Code fixed speeds
Code saturation flows
Code gap acceptance parametersExisting Local Models
COBA 10 DMRB V13 S1
Local Authority data
Key Data Definition Coding
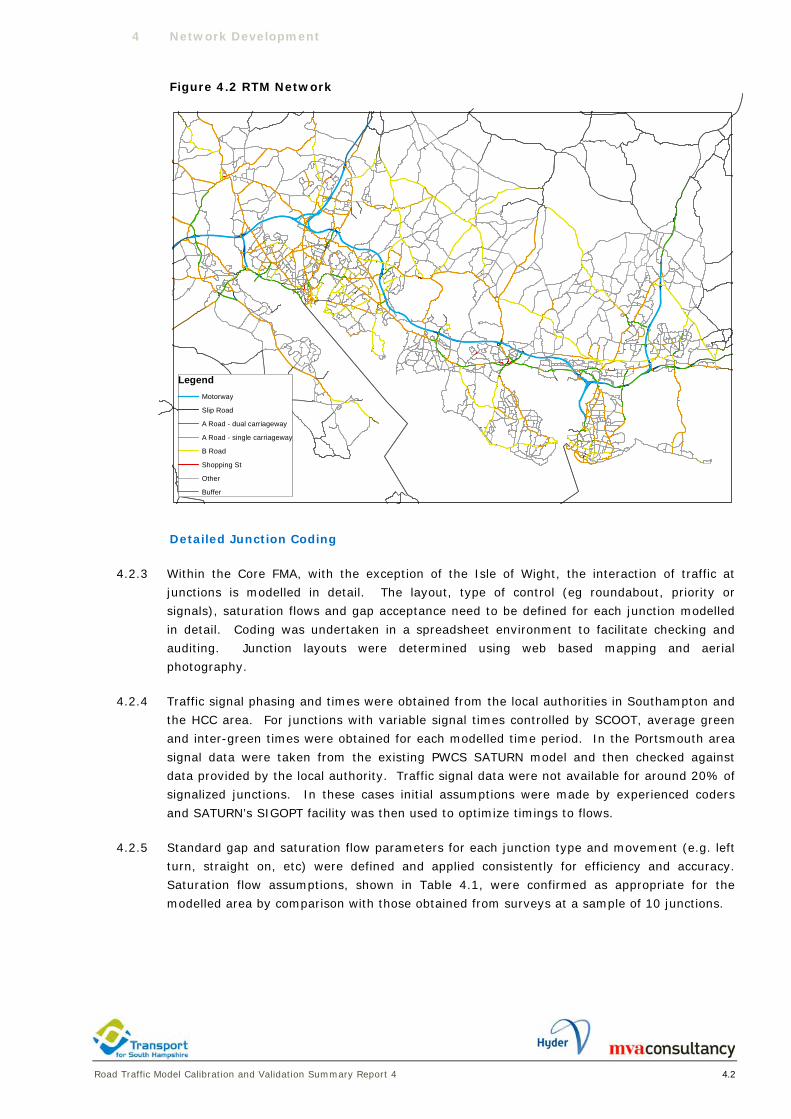
4.2.2 The structure of the road network used in the RTM is shown in Figure 4.2.
4 Network Development
Road Traffic Model Calibration and Validation Summary Report 4 4.2
Figure 4.2 RTM Network
LegendMotorway
Slip Road
A Road - dual carriageway
A Road - single carriageway
B Road
Shopping St
Other
Buffer
Detailed Junction Coding
4.2.3 Within the Core FMA, with the exception of the Isle of Wight, the interaction of traffic at
junctions is modelled in detail. The layout, type of control (eg roundabout, priority or
signals), saturation flows and gap acceptance need to be defined for each junction modelled
in detail. Coding was undertaken in a spreadsheet environment to facilitate checking and
auditing. Junction layouts were determined using web based mapping and aerial
photography.
4.2.4 Traffic signal phasing and times were obtained from the local authorities in Southampton and
the HCC area. For junctions with variable signal times controlled by SCOOT, average green
and inter-green times were obtained for each modelled time period. In the Portsmouth area
signal data were taken from the existing PWCS SATURN model and then checked against
data provided by the local authority. Traffic signal data were not available for around 20% of
signalized junctions. In these cases initial assumptions were made by experienced coders
and SATURN’s SIGOPT facility was then used to optimize timings to flows.
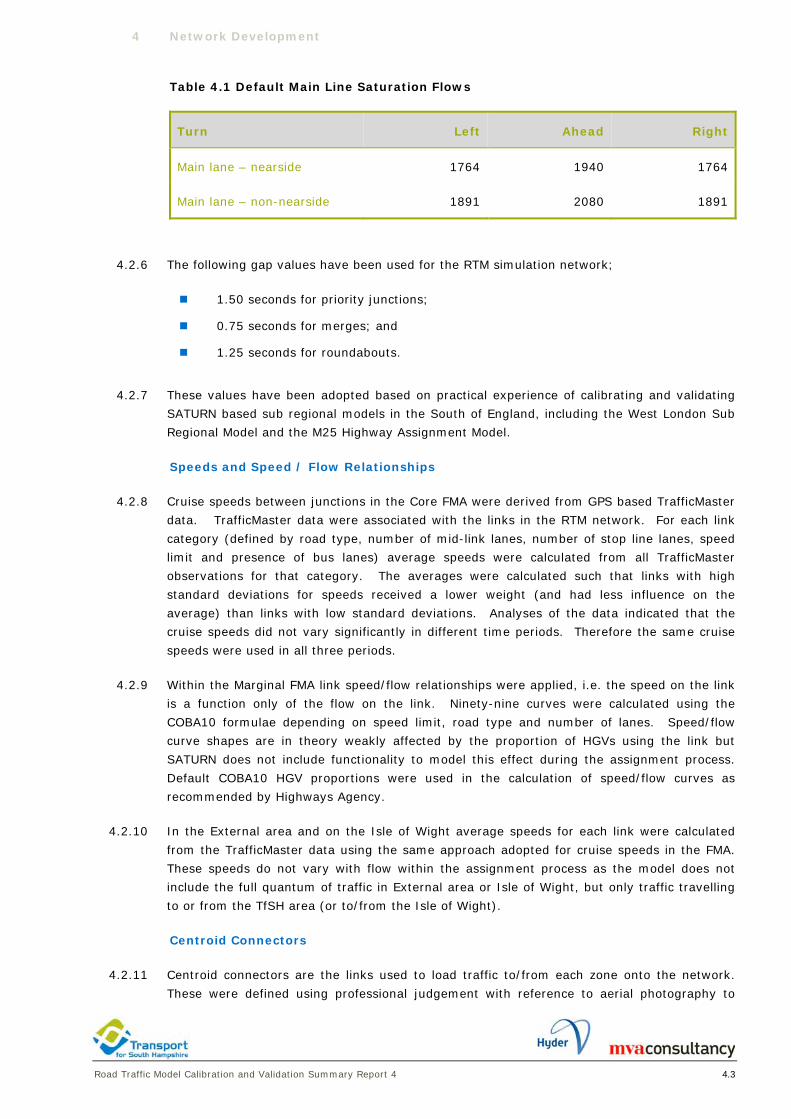
4.2.5 Standard gap and saturation flow parameters for each junction type and movement (e.g. left
turn, straight on, etc) were defined and applied consistently for efficiency and accuracy.
Saturation flow assumptions, shown in Table 4.1, were confirmed as appropriate for the
modelled area by comparison with those obtained from surveys at a sample of 10 junctions.
4 Network Development
Road Traffic Model Calibration and Validation Summary Report 4 4.3
Table 4.1 Default Main Line Saturation Flows
Turn Left Ahead Right
Main lane – nearside 1764 1940 1764
Main lane – non-nearside 1891 2080 1891
4.2.6 The following gap values have been used for the RTM simulation network;
1.50 seconds for priority junctions;
0.75 seconds for merges; and
1.25 seconds for roundabouts.
4.2.7 These values have been adopted based on practical experience of calibrating and validating
SATURN based sub regional models in the South of England, including the West London Sub
Regional Model and the M25 Highway Assignment Model.
Speeds and Speed / Flow Relationships
4.2.8 Cruise speeds between junctions in the Core FMA were derived from GPS based TrafficMaster
data. TrafficMaster data were associated with the links in the RTM network. For each link
category (defined by road type, number of mid-link lanes, number of stop line lanes, speed
limit and presence of bus lanes) average speeds were calculated from all TrafficMaster
observations for that category. The averages were calculated such that links with high
standard deviations for speeds received a lower weight (and had less influence on the
average) than links with low standard deviations. Analyses of the data indicated that the
cruise speeds did not vary significantly in different time periods. Therefore the same cruise
speeds were used in all three periods.
4.2.9 Within the Marginal FMA link speed/flow relationships were applied, i.e. the speed on the link
is a function only of the flow on the link. Ninety-nine curves were calculated using the
COBA10 formulae depending on speed limit, road type and number of lanes. Speed/flow
curve shapes are in theory weakly affected by the proportion of HGVs using the link but
SATURN does not include functionality to model this effect during the assignment process.
Default COBA10 HGV proportions were used in the calculation of speed/flow curves as
recommended by Highways Agency.
4.2.10 In the External area and on the Isle of Wight average speeds for each link were calculated
from the TrafficMaster data using the same approach adopted for cruise speeds in the FMA.
These speeds do not vary with flow within the assignment process as the model does not
include the full quantum of traffic in External area or Isle of Wight, but only traffic travelling
to or from the TfSH area (or to/from the Isle of Wight).
Centroid Connectors
4.2.11 Centroid connectors are the links used to load traffic to/from each zone onto the network.
These were defined using professional judgement with reference to aerial photography to

4 Network Development
Road Traffic Model Calibration and Validation Summary Report 4 4.4
determine where traffic was likely to join the modelled road network. In most cases in the
Core FMA notional links (known as spigots) are added joining the network between real
junctions representing multiple loading points such as driveways, car parks and side roads.
In a small number of instances real junctions were added as loading points where they have
a significant influence on the performance of the network.
4.3 Quality Assurance
4.3.1 Use of standardised and automated processes and assumptions to code networks, as
described above, is a key aspect of the quality assurance processed used for RTM. Further
checks were carried out using the following checklist:
check for appropriate junction types;
check that the appropriate number of entry lanes have been coded and that flaring of
approaches, where appropriate, are accounted for;
check that turn restrictions have been correctly identified (these may vary by time
period);
check that one-way roads and no entries have been correctly specified;
check that saturation flows are appropriate (particularly if turn rates appear
excessively high or low compared to straight ahead);
check that link lengths, link types and cruise speeds for both directions of a link are
consistent, and that the link type and cruise speed coding does not vary unjustifiably
along a series of links;
compare crow-fly link lengths against actual lengths and check that the coded link
lengths in the core modelled area for links greater than 500m in length are not
greater than 1.3 times the crow-fly distance, and inspect links which fall outside this
range;
checking the connectivity of the network to ensure that there are no gaps or isolated
areas; and
investigation of errors and warnings output by SATURN.
4.4 Network Calibration
4.4.1 Network calibration refers to the process of adjusting the network to remove any coding
errors or to fine tune standard assumptions to better represent individual links and junctions.
This step is undertaken following matrix construction (see Chapter 5) and initial assignment
(Chapter 6). Checks were made of speeds and flows where those observations (discussed in
Chapter 3) were available. Comparison of modelled and observed speeds were used to
identify junctions with excessive delay which could be due to incorrect coding. Flows were
compared with capacities to identify junctions where the capacity is lower than the traffic
count.
4.4.2 SATURN outputs statistics describe the convergence of flow and delay at junctions between
assignment iterations. Poor convergence can be a symptom of unrealistic junction coding.

4 Network Development
Road Traffic Model Calibration and Validation Summary Report 4 4.5
4.4.3 Remedial actions to address poor match to observed data included adjusting saturation flows,
flare lengths (where coded) and gap acceptance, and reviewing the location of centroid
connectors. Adjustments were only made when justified by the conditions at the problematic
junction or link.
4.5 Network Validation
4.5.1 Network validation consisted of checking modelled routes. No data was available against
which to compare model outputs, rather local knowledge and judgement was required. Pairs
of zones were selected using the criteria listed below for which routes were reviewed:
relate to significant numbers of trips;
are of significant length or cost (e.g. 20+ minutes);
pass through areas of interest (e.g. scheme impacted areas);
include both directions of travel (to sense check differences);
link different compass areas (e.g. north to south, east to west, etc.); and
coincide with journey time routes as appropriate.
4.5.2 Route checking included:
making a judgement on the plausibility of the modelled route;
comparing routes for uncongested networks with congested networks;
comparing routes for different time periods; and
comparing routes for the same journey in opposite directions.
4.5.3 Where the comparisons listed above indicated different routes choices, this could have been
due to legitimate congestion effects but could also have been symptomatic of coding errors,
which could then be corrected.
4.5.4 An automated process was developed to identify any instances where the path between a
zone pair used the same node more than once. This can be a legitimate result, e.g. where
there is a banned turn, but such instances were checked and a number of corrections made.

Road Traffic Model Calibration and Validation Summary Report 4 5.1
5 Matrix Development
5.1 Introduction
5.1.1 This section describes the methodology for the development of the base year trip matrices.
These matrices were later subjected to matrix estimation as part of the process of calibrating
the model; the matrix estimation process and results are reported in Chapter 6. The
matrices described in this section are referred to as ‘prior’ matrices.
5.1.2 The demand matrices contain estimates of all travel to, from and within the Core and
Marginal FMAs. The only trips included to and from the Buffer and External areas are those
which traverse the FMAs.
5.1.3 Demand segments used during the assignment were described in Chapter 2. These
segments were defined to group demand based on the factors that influence route choice.
Matrices were developed with a more disaggregate set of purposes than those used for use
in the MDM, as shown in Table 5.1.
Table 5.1 Trip Purpose Segmentations
Vehicle
Type Abbr. OD Demand Matrices
RTM Assignment
Matrices
Car HBB HB Employers Business Employers Business
Car NHB Non HB Employers Business
Car HBW HB Work
Commuting and Other Car HBE HB Education
Car HBO HB Other
Car NHO NHB Other
LGV LGV Light Goods Vehicles LGVs
HGV HGV Other Goods Vehicles OGVs
5.1.4 The remainder of this chapter is structured as follows:
processing of RSIs to produce partial observed matrices;
calculating trip ends of total demand to and from each zone;
producing synthetic matrices for the whole modelled area using gravity models,
which are then used for zone-pairs that are not captured by the RSIs; and
calculation of LGV and HGV matrices.
5.2 Partial Matrices
5.2.1 The partial matrices were developed from the RSI data described in Chapter 3. The following
steps were followed to develop the partial matrices:
5 Matrix Development
Road Traffic Model Calibration and Validation Summary Report 4 5.2
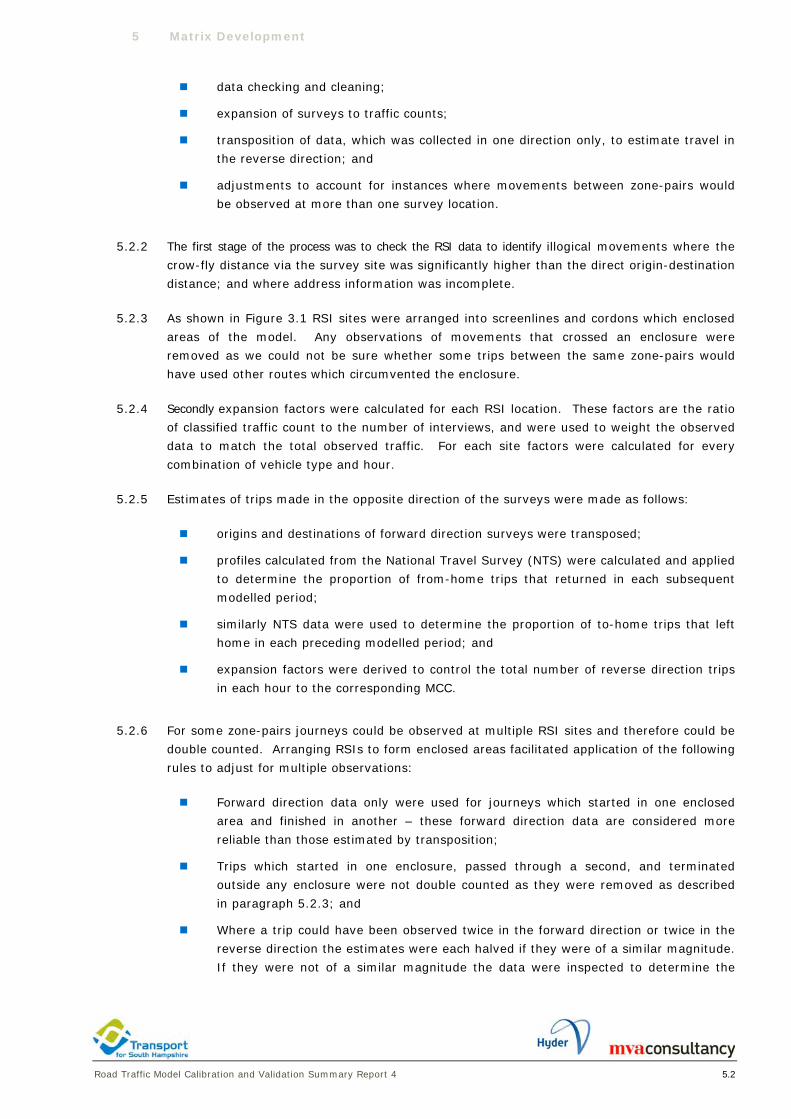
data checking and cleaning;
expansion of surveys to traffic counts;
transposition of data, which was collected in one direction only, to estimate travel in
the reverse direction; and
adjustments to account for instances where movements between zone-pairs would
be observed at more than one survey location.
5.2.2 The first stage of the process was to check the RSI data to identify illogical movements where the
crow-fly distance via the survey site was significantly higher than the direct origin-destination
distance; and where address information was incomplete.
5.2.3 As shown in Figure 3.1 RSI sites were arranged into screenlines and cordons which enclosed
areas of the model. Any observations of movements that crossed an enclosure were
removed as we could not be sure whether some trips between the same zone-pairs would
have used other routes which circumvented the enclosure.
5.2.4 Secondly expansion factors were calculated for each RSI location. These factors are the ratio
of classified traffic count to the number of interviews, and were used to weight the observed
data to match the total observed traffic. For each site factors were calculated for every
combination of vehicle type and hour.
5.2.5 Estimates of trips made in the opposite direction of the surveys were made as follows:
origins and destinations of forward direction surveys were transposed;
profiles calculated from the National Travel Survey (NTS) were calculated and applied
to determine the proportion of from-home trips that returned in each subsequent
modelled period;
similarly NTS data were used to determine the proportion of to-home trips that left
home in each preceding modelled period; and
expansion factors were derived to control the total number of reverse direction trips
in each hour to the corresponding MCC.
5.2.6 For some zone-pairs journeys could be observed at multiple RSI sites and therefore could be
double counted. Arranging RSIs to form enclosed areas facilitated application of the following
rules to adjust for multiple observations:
Forward direction data only were used for journeys which started in one enclosed
area and finished in another – these forward direction data are considered more
reliable than those estimated by transposition;
Trips which started in one enclosure, passed through a second, and terminated
outside any enclosure were not double counted as they were removed as described
in paragraph 5.2.3; and
Where a trip could have been observed twice in the forward direction or twice in the
reverse direction the estimates were each halved if they were of a similar magnitude.
If they were not of a similar magnitude the data were inspected to determine the

5 Matrix Development
Road Traffic Model Calibration and Validation Summary Report 4 5.3
most robust source, either based on the sample size or completeness and relevance
of the enclosure.
5.3 Trip Ends
5.3.1 The home-based purpose origin/destination person trip ends for zones within the FMA were
produced using the following steps:
Home-based production trip ends were estimated for all FMA zones by applying the
NTEM production trip rates to the population data. These trip ends represent the
‘outbound’ trip only;
Home-based attraction trip ends within the FMA were estimated by applying the
NTEM trip attraction trip rates to the employment data, and scaling total attractions
to match total productions for each purpose, mode (including active modes), time
period and car availability across the FMA;
The Outbound/Return factors were used to calculate the ratio of from-home and to-
home trips in each time period; these ratios were used to generate return trip ends
from the NTEM-based outbound trip ends;
Census Journey to Work data by zone was used to adjust the mode shares (including
active modes) for the home-based production/attraction trip ends so that they reflect
the accessibility of particular zones to public transport services. This was necessary
because NTEM-derived trip ends were not deemed representative at the sub-NTEM-
zone level; and
Origin/Destination trip ends were then derived from the production/attraction trip
ends by re-applying the Outbound/Return factors.
5.3.2 The non-home-based purpose origin/destination trip ends for zones within the FMA were
developed using home-based to non-home based trip rate factors derived from National
Travel Survey (NTS) data.
5.3.3 DfT’s TEMPRO software (version 5.4) was used to output 2010 origin/destination trip ends by
purpose, mode and time period for all zones outside the FMA. TEMPRO was also used to
generate car availability splitting factors for these zones.
5.3.4 An analysis of the NTEM trip ends, which are supposed to represent the full demand, showed
that there were actually less non home based employer’s business trips in the NTEM trip ends
than in the in the partially observed matrices. The NTEM trip ends were therefore adjusted to
increase the number of NHB EB trips, firstly to match the level of trips in the partial matrices,
and secondly to account for unobserved (e.g. intra-sector) movements not included in the
partial matrices.
5.3.5 In addition the trip ends were further adjusted, at a sector level, to ensure that they were
compatible with the synthetic matrices at the various enclosures.
5 Matrix Development
Road Traffic Model Calibration and Validation Summary Report 4 5.4
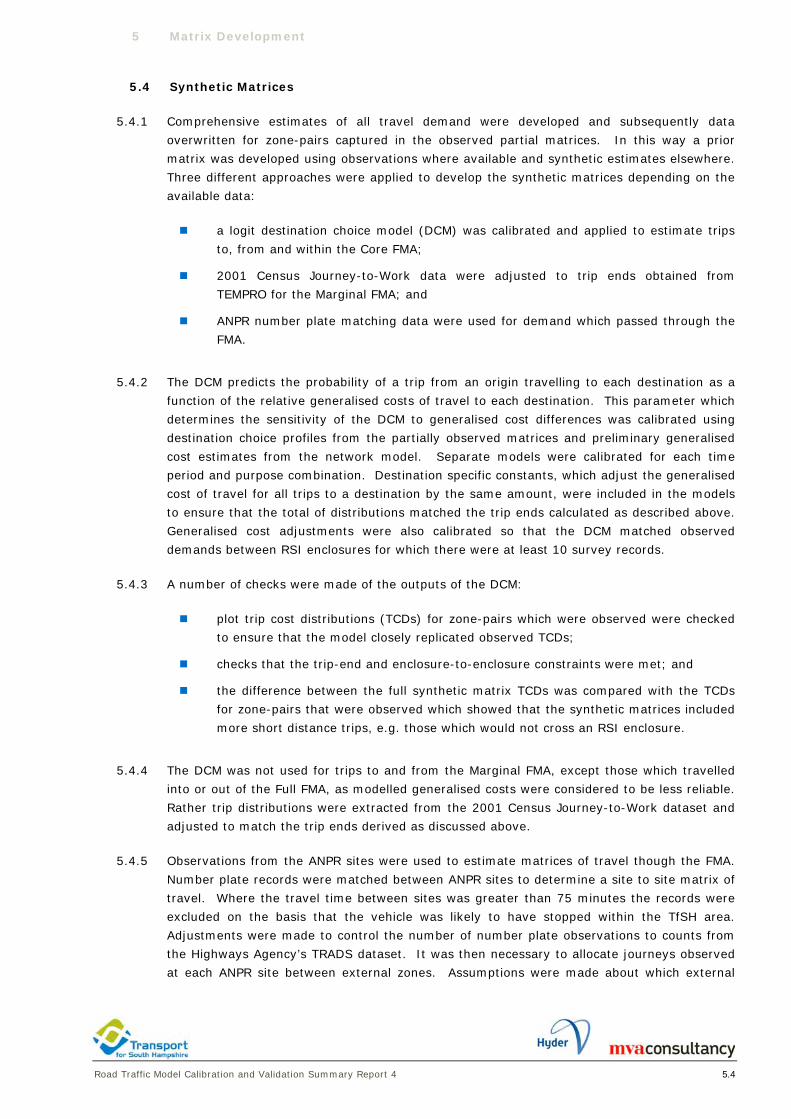
5.4 Synthetic Matrices
5.4.1 Comprehensive estimates of all travel demand were developed and subsequently data
overwritten for zone-pairs captured in the observed partial matrices. In this way a prior
matrix was developed using observations where available and synthetic estimates elsewhere.
Three different approaches were applied to develop the synthetic matrices depending on the
available data:
a logit destination choice model (DCM) was calibrated and applied to estimate trips
to, from and within the Core FMA;
2001 Census Journey-to-Work data were adjusted to trip ends obtained from
TEMPRO for the Marginal FMA; and
ANPR number plate matching data were used for demand which passed through the
FMA.
5.4.2 The DCM predicts the probability of a trip from an origin travelling to each destination as a
function of the relative generalised costs of travel to each destination. This parameter which
determines the sensitivity of the DCM to generalised cost differences was calibrated using
destination choice profiles from the partially observed matrices and preliminary generalised
cost estimates from the network model. Separate models were calibrated for each time
period and purpose combination. Destination specific constants, which adjust the generalised
cost of travel for all trips to a destination by the same amount, were included in the models
to ensure that the total of distributions matched the trip ends calculated as described above.
Generalised cost adjustments were also calibrated so that the DCM matched observed
demands between RSI enclosures for which there were at least 10 survey records.
5.4.3 A number of checks were made of the outputs of the DCM:
plot trip cost distributions (TCDs) for zone-pairs which were observed were checked
to ensure that the model closely replicated observed TCDs;
checks that the trip-end and enclosure-to-enclosure constraints were met; and
the difference between the full synthetic matrix TCDs was compared with the TCDs
for zone-pairs that were observed which showed that the synthetic matrices included
more short distance trips, e.g. those which would not cross an RSI enclosure.
5.4.4 The DCM was not used for trips to and from the Marginal FMA, except those which travelled
into or out of the Full FMA, as modelled generalised costs were considered to be less reliable.
Rather trip distributions were extracted from the 2001 Census Journey-to-Work dataset and
adjusted to match the trip ends derived as discussed above.
5.4.5 Observations from the ANPR sites were used to estimate matrices of travel though the FMA.
Number plate records were matched between ANPR sites to determine a site to site matrix of
travel. Where the travel time between sites was greater than 75 minutes the records were
excluded on the basis that the vehicle was likely to have stopped within the TfSH area.
Adjustments were made to control the number of number plate observations to counts from
the Highways Agency’s TRADS dataset. It was then necessary to allocate journeys observed
at each ANPR site between external zones. Assumptions were made about which external

5 Matrix Development
Road Traffic Model Calibration and Validation Summary Report 4 5.5
zones would use each ANPR site and trips distributed between the zones based on
proportions calculated from trips to and from the FMA.
5.5 LGV and HGV Matrices
5.5.1 LGV and HGV partial matrices were developed using the same process applied for cars. At
some RSI sites the number of goods vehicle observations were very low and so these were
grouped prior to expansion to reduce sample bias. NTS does not include information on
outbound/return factors for goods vehicles and therefore we assumed that the return trip was
in the same period as the outbound trip. Trip rates were not available to develop goods
vehicle trips ends, and so no trip ends were available to apply a DCM to. Rather ratios of LGV
and HGV trips to home based work and other car trips for each time period were calculated
and applied to the prior car matrices.

Road Traffic Model Calibration and Validation Summary Report 4 6.1
6 Calibration and Validation
6.1 Introduction
6.1.1 This chapter describes:
trip matrix estimation, including checks of significance of differences between prior
and estimated trip matrices;
the assignment process applied using SATURN and model convergence;
validation criteria set out in DfT and HA guidance;
validation of traffic flows; and
validation of journey times.
6.2 Matrix Estimation
6.2.1 Matrix estimation is an automated process where the number of trips between each zone-pair
can be adjusted to improve the match between assigned flows and traffic counts. The
primary purpose of matrix estimation is to refine estimates of trips not intercepted in surveys
and which have therefore been synthesised. This is why counts on screenlines independent
of the roadside interview cordons and screenlines are required.
6.2.2 SATURN’s ME2 can be used to match flows on individual links or total flows on groups of links
(screenlines or mini-screenlines). For TfSH counts have been grouped into mini-screenlines
wherever possible to reduce scope for inappropriately modifying the matrix to compensate for
network coding simplifications or errors. Locations of count sites are shown in Figures 3.1 to
3.3. Counts used in matrix estimation were derived from two-week ATCs split by vehicle
class using proportions calculated from MCC data.
6.2.3 ME2 requires modelled paths between each zone pair to be input. These paths are a function
of travel times and delays which in turn are influenced by the scale and distribution of trips in
the matrix. For this reason we have applied an iterative process where an initial set of paths
is input to ME2; the resulting matrix is then assigned to produce refined paths; these paths
are then input to a further run of ME2, etc. A total of six iterations of assignment and
estimation have been run.
6.2.4 The XAMAX parameter has been set to 2.5 to limit change in trips for each zone-pair to a
factor of 2.5 or 0.4 (1/2.5).
6.2.5 A number of checks and analyses have been undertaken to assess the reasonableness of the
matrix estimation process:
for cars and LGVs matrix totals change by 7.5% or less;
for HGVs, which account for about 2% of total trips and for which there was relatively
little observed data, matrix totals change by up to 35.5%;
linear regression analysis, comparing pre- and post-ME2 trip end totals, show a
strong correlation with R2 values in excess of 0.92 in all cases, and gradients are all

6 Calibration and Validation
Road Traffic Model Calibration and Validation Summary Report 4 6.2
between 1.02 and 1.09 indicating that there has generally been a modest increase in
trips;
plots of trip cost distributions were compared which showed that the distribution of
trips was not unduly distorted;
mean trip lengths changed by no more than 17%; and
sectored matrices were compared which confirmed that ME2 did not distort the
distribution of trips.
6.3 Assignment Process and Convergence
6.3.1 The deterministic user equilibrium method implemented in the SATURN software is used.
This assumes that users have perfect knowledge of the time taken to pass through the
network from their origin to destination.
6.3.2 SATURN measures the convergence, i.e. how speeds and flows change on links, between
iterations. For model outputs to be stable and reliable, in particular for use in social cost
benefit appraisal, a high level of convergence is required. For the RTM we have ensured
much tighter convergence than suggested by guidance (DMRB) because our experience tells
us that the DMRB standards are insufficient to ensure that model “noise” is smaller than the
benefits which are being measured.
6.3.3 RTM SATURN is configured to stop when the %Gap measure falls below 0.1%. For the base
year models this equates to flow and delays changing by 1% or less on 99% of links for four
consecutive iterations.
6.3.4 The value of time and vehicle operating cost coefficients used for assignment were derived
from TAG Unit 3.5.6.
6.4 Validation Criteria
6.4.1 Guidance on validation of highway assignment models is provided in the Highways Agency’s
Design Manual for Roads and Bridges and summarised in Table 6.1.
6 Calibration and Validation
Road Traffic Model Calibration and Validation Summary Report 4 6.3
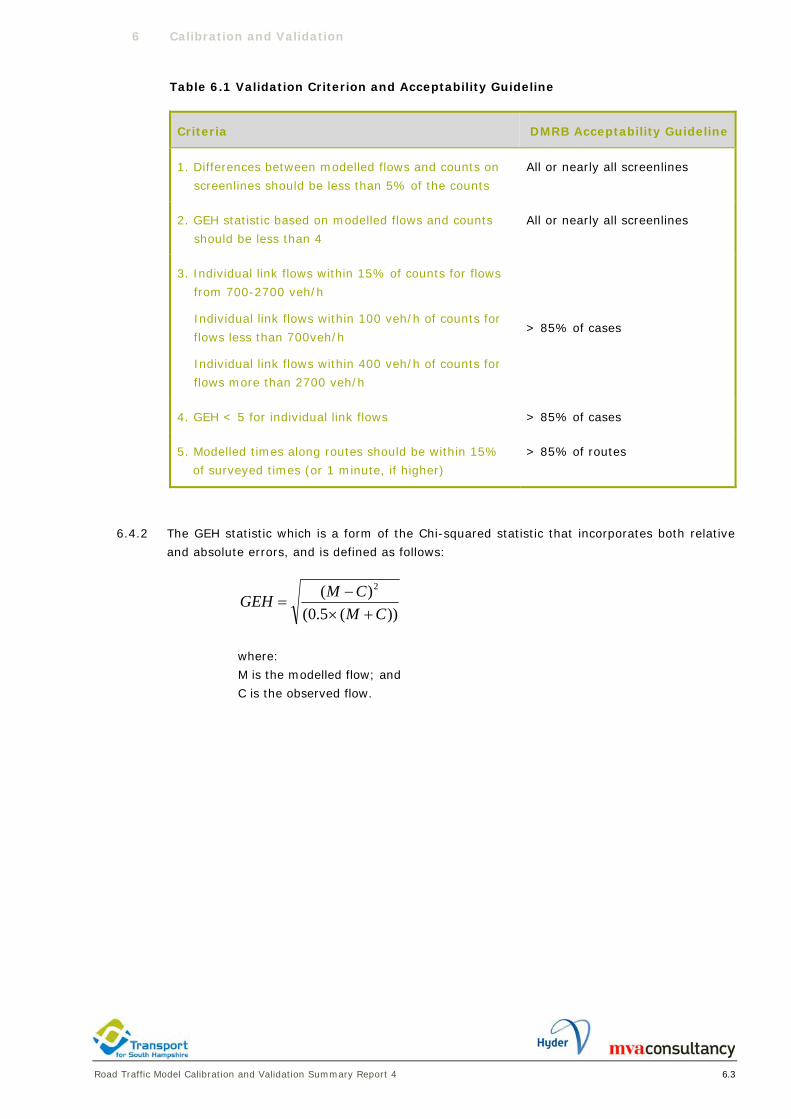
Table 6.1 Validation Criterion and Acceptability Guideline
Criteria DMRB Acceptability Guideline
1. Differences between modelled flows and counts on
screenlines should be less than 5% of the counts
All or nearly all screenlines
2. GEH statistic based on modelled flows and counts
should be less than 4
All or nearly all screenlines
3. Individual link flows within 15% of counts for flows
from 700-2700 veh/h
Individual link flows within 100 veh/h of counts for
flows less than 700veh/h
Individual link flows within 400 veh/h of counts for
flows more than 2700 veh/h
> 85% of cases
4. GEH < 5 for individual link flows > 85% of cases
5. Modelled times along routes should be within 15%
of surveyed times (or 1 minute, if higher)
> 85% of routes
6.4.2 The GEH statistic which is a form of the Chi-squared statistic that incorporates both relative
and absolute errors, and is defined as follows:
))(5.0()( 2
CMCMGEH+×
−=
where:
M is the modelled flow; and C is the observed flow.

6 Calibration and Validation
Road Traffic Model Calibration and Validation Summary Report 4 6.4
6.5 Traffic Flow Validation
6.5.1 Screenline validation results summarised in Table 6.2 show a good fit between modelled and
observed traffic at over 80% of screenlines meeting criteria 1 in Table 6.1, and over 74%
meeting criteria 2.
Table 6.2 Screenline Validation Results
Time Period Screenlines within 5% GEH < 4
AM Peak 64 of 80 80% 59 of 80 74%
Inter Peak 70 of 80 88% 69 of 80 86%
PM Peak 64 of 80 80% 62 of 80 78%
6.5.2 Validation results for individual links are shown in Table 6.3.
Table 6.3 Individual Link Validation Results
Time Period Individual Link Flows within
% or veh/hr of criteria*
GEH < 5 for individual link
flows
AM Peak 54% 47%
Inter Peak 65% 56%
PM Peak 54% 45%
*Individual flows within 15% of counts for flows from 700 to 2700 veh/h
Individual flows within 100 veh/h of counts for flows less than 700 veh/h
Individual flows within 400 veh/h of counts for flows more than 2700 veh/h
6.5.3 The individual link flow validation is not as good as the screenline validation. However as
discussed in more detail in paragraph 6.7.2 it is more critical that the screenline validation
performs well, as it ensures overall demand is correct, whereas individual link flow validation
is less significant as routing can vary from day to day.

6 Calibration and Validation
Road Traffic Model Calibration and Validation Summary Report 4 6.5
6.6 Journey Time Validation
6.6.1 Journey time validation results are summarised in Table 6.4.
Table 6.4 Journey Time Validation Results
Time Period Routes within 15% or 1 minute if higher
AM Peak 21 out of 34 62%
Inter Peak 23 out of 34 68%
PM Peak 17 out of 34 50%
6.6.2 Detailed investigation of journey time validation results by route showed that the slope of the
observed and modelled journey times are generally similar and that the model representation
of observed conditions on the surveyed network is relatively accurate. These profiles are
therefore a good indication that the model is capturing network delay accurately and that
there is no systematic bias towards either low or high speeds.
6.7 Relaxed Validation Criteria
6.7.1 It is often considered that the WebTAG thresholds of acceptability are more suited to less
complex models, and as such it is argued that a certain level of flexibility is acceptable given
the scale and complexity of the SRTM. Tables 6.5 to 6.7 therefore presents the equivalent
results as shown in Tables 6.2 to 6.4, with slightly relaxed criteria, more appropriate for a bi-
centric, sub-regional area. The results demonstrate that although the WebTAG criteria are
not fully met, the model performance is in general good.
Table 6.5 Relaxed Criteria Screenline Validation Results
Time Period Screenlines within 10%
AM Peak 70 of 80 88%
Inter Peak 74 of 80 93%
PM Peak 69 of 80 86%
6 Calibration and Validation
Road Traffic Model Calibration and Validation Summary Report 4 6.6
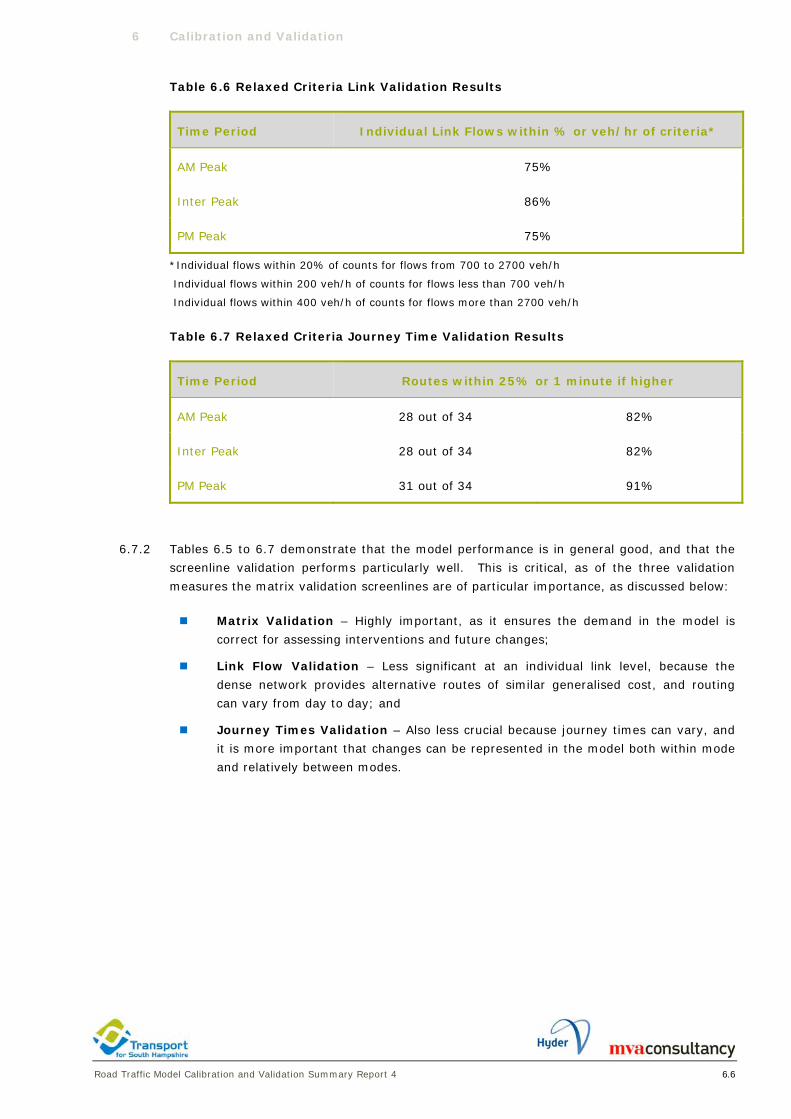
Table 6.6 Relaxed Criteria Link Validation Results
Time Period Individual Link Flows within % or veh/hr of criteria*
AM Peak 75%
Inter Peak 86%
PM Peak 75%
*Individual flows within 20% of counts for flows from 700 to 2700 veh/h
Individual flows within 200 veh/h of counts for flows less than 700 veh/h
Individual flows within 400 veh/h of counts for flows more than 2700 veh/h
Table 6.7 Relaxed Criteria Journey Time Validation Results
Time Period Routes within 25% or 1 minute if higher
AM Peak 28 out of 34 82%
Inter Peak 28 out of 34 82%
PM Peak 31 out of 34 91%
6.7.2 Tables 6.5 to 6.7 demonstrate that the model performance is in general good, and that the
screenline validation performs particularly well. This is critical, as of the three validation
measures the matrix validation screenlines are of particular importance, as discussed below:
Matrix Validation – Highly important, as it ensures the demand in the model is
correct for assessing interventions and future changes;
Link Flow Validation – Less significant at an individual link level, because the
dense network provides alternative routes of similar generalised cost, and routing
can vary from day to day; and
Journey Times Validation – Also less crucial because journey times can vary, and
it is more important that changes can be represented in the model both within mode
and relatively between modes.
Road Traffic Model Calibration and Validation Summary Report 4 7.1
7 Fitness for Purpose
7.1.1 The SRTM model system covers a wide geographic area and contains a significant number of
strategic motorways, primary routes and complex urban road networks. An unusual feature
of the model is that it includes two main conurbations, Southampton and Portsmouth,
significant district centres such as Fareham and Gosport, a number of peninsulas, and a third
geographically distinct centre on the Isle of Wight. More typically traffic models are
developed for either single corridors, free-standing cities or conurbations. The strategic
validation of the Road Traffic Model needs to be considered in this context, i.e. a model of
multiple, often parallel, corridors and multiple centres that generate urban and inter-urban
trips combined with strategic road access routes using the Motorway and trunk road network.
7.1.2 The model has been constructed according to WebTAG recommendations, and validated
against DMRB guidelines. The calibration process did not reveal any significant problems or
shortcomings in the base year model. The quality of validation of the model is in general
good, with the screenline validation performing particularly well. This is critical, as it ensures
the demand in the model is correct for assessing multi-modal interventions and future
changes.
7.1.3 The journey time validation and the patterns of junction delay appear consistent and
plausible, although the link flow and journey time validation do not meet the WebTAG
criteria. However, these recommended criteria mask a good model performance that is close
to the meeting the acceptability guidelines.
7.1.4 The calibration and validation suggest that the model is fit for the purpose of representing
the highway traffic patterns in the base year, as part of the SRTM.
7.1.5 The model encompasses a large geographic area at different levels of detail and is expected
to be used to consider a range of strategic and specific interventions, e.g. representing the
main highway movements, the impact of major highway and public transport interventions on
those movements, and providing controlled and consistent inputs to local or more detailed
models.
7.1.6 It is acknowledged that whilst fit for general purpose, depending on the nature and scope of
the intervention being tested, additional local validation checks may be beneficial for model
application for specific interventions at a local level.

MVA Consultancy provides advice on transport, to central, regional and local government, agencies, developers, operators and financiers. A diverse group of results-oriented people, we are part of a strong team of professionals worldwide. Through client business planning, customer research and strategy development we create solutions that work for real people in the real world. For more information visit www.mvaconsultancy.com
Email: [email protected]
Offices also in
Bangkok, Beijing, Hong Kong, Shenzhen and Singapore
Abu Dhabi
AS Business Centre, Suite 201, Al Ain Road, Umm al
Nar, P.O. Box 129865, Abu Dhabi, UAE
T: +971 2 510 2402 F: +971 2 510 2403
Birmingham
Second Floor, 37a Waterloo Street
Birmingham B2 5TJ United Kingdom
T: +44 (0)121 233 7680 F: +44 (0)121 233 7681
Dublin
First Floor, 12/13 Exchange Place
Custom House Docks, IFSC, Dublin 1, Ireland
T: +353 (0)1 542 6000 F: +353 (0)1 542 6001
Edinburgh
Second Floor, Prospect House, 5 Thistle Street,
Edinburgh EH2 1DF United Kingdom
T: +44 (0)131 220 6966 F: +44 (0)131 220 6087
Glasgow
Seventh Floor, 78 St Vincent Street
Glasgow G2 5UB United Kingdom
T: +44 (0)141 225 4400 F: +44 (0)141 225 4401
London
Second Floor, 17 Hanover Square
London W1S 1HU United Kingdom
T: +44 (0)20 7529 6500 F: +44 (0)20 7529 6556
Lyon
11, rue de la République, 69001 Lyon, France
T: +33 (0)4 72 10 29 29 F: +33 (0)4 72 10 29 28
Manchester
25th Floor, City Tower, Piccadilly Plaza
Manchester M1 4BT United Kingdom
T: +44 (0)161 236 0282 F: +44 (0)161 236 0095
Marseille
76, rue de la République, 13002 Marseille, France
T: +33 (0)4 91 37 35 15 F: +33 (0)4 91 91 90 14
Paris
12-14, rue Jules César, 75012 Paris, France
T: +33 (0)1 53 17 36 00 F: +33 (0)1 53 17 36 01
Woking
Dukes Court, Duke Street, Woking
Surrey GU21 5BH United Kingdom
T: +44 (0)1483 728051 F: +44 (0)1483 755207