Embed Size (px)
Citation preview
R. Fontana, G. Decad – IBM Systems September 9, 2015
Roadmaps and Technology Reality (HDD, TAPE, NAND Flash, OpKcal)
© 2015 IBM CorporaKon

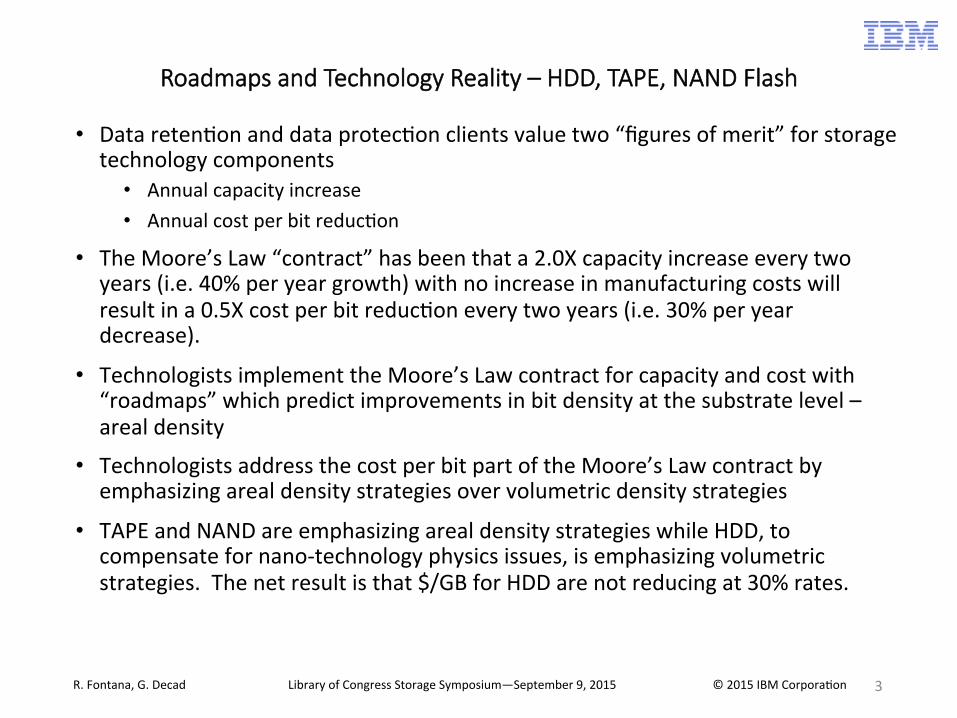
Roadmaps and Technology Reality – HDD, TAPE, NAND Flash
• Storage Technology Roadmaps and Figures of Merit
• 2015 Storage Landscape • Tape Roadmap and Technology Strategy
• HDD Roadmap and Technology Strategy
• NAND Flash Roadmap and Technology Strategy
• Volumetric Density vs Areal Density
• Summary
• Key Points • HDD areal density slowing – Capacity achieved with more plaVers per drive • TAPE areal density conKnues growing at 30% per year using evoluKonary technology • NAND Flash moving to novel process intensive 3D cell structures to sustain density
growth of 40% per year
R. Fontana, G. Decad Library of Congress Storage Symposium—September 9, 2015 © 2015 IBM CorporaKon 2
Roadmaps and Technology Reality – HDD, TAPE, NAND Flash
• Data retenKon and data protecKon clients value two “figures of merit” for storage technology components
• Annual capacity increase • Annual cost per bit reducKon
• The Moore’s Law “contract” has been that a 2.0X capacity increase every two years (i.e. 40% per year growth) with no increase in manufacturing costs will result in a 0.5X cost per bit reducKon every two years (i.e. 30% per year decrease).
• Technologists implement the Moore’s Law contract for capacity and cost with “roadmaps” which predict improvements in bit density at the substrate level – areal density
• Technologists address the cost per bit part of the Moore’s Law contract by emphasizing areal density strategies over volumetric density strategies
• TAPE and NAND are emphasizing areal density strategies while HDD, to compensate for nano-‐technology physics issues, is emphasizing volumetric strategies. The net result is that $/GB for HDD are not reducing at 30% rates.
3 R. Fontana, G. Decad Library of Congress Storage Symposium—September 9, 2015 © 2015 IBM CorporaKon

Areal Density – More Reality
1
10
100
1000
10000
20092010201120122013201420152016201720182019202020212022
Areal Density (G
bit/in
2 )
Year
Areal Density -‐-‐ Products and Projections
TAPE HDD NAND
TAPE HDD NAND
Product Areal Density Annual Increase (2010 to 2015)
33%/YR 10%/YR 40%/YR
Roadmap Areal Density Annual Increase (2016 to 2022)
33%/YR 30%/YR 40%/YR
HDD anKcipates a technology enabler, i.e. heat assisted magneKc recording, to provide a “step” increase in density growth
OPTICAL
?
4 R. Fontana, G. Decad Library of Congress Storage Symposium—September 9, 2015 © 2015 IBM CorporaKon

Bit Cells in 2015 – HDD, TAPE, NAND Flash
• Bits shown at scale
TAPE 7 Gbit/in² 2000nm x 47nm
HDD 1100 Gbit/in² 55nm x 11nm
NAND -‐ MLC 1120 Gbit/in² 24nm x 24nm
NAND -‐ TLC 1600 Gbit/in² 19nm x 19nm NAND moves from 19 nm to 16 nm lithography and from 2 bit per
cell (MLC) to 3 bit per cell (TLC) for planar cell designs with issues of adjacent cell interference and lower endurance designs. Strategy is to transiKon to larger cells with verKcal (3d) stacking
HDD issues with the stability of wriKng small magneKc grains requires either novel thermal wriKng (HAMR) or aggressive use of shingled recording (SMR). The laVer changes the processes for over-‐wriKng exisKng data.
Tape’s successful migraKon to 10 TB cartridges with large bit cells relaKve to HDD and NAND suggests there is room for growth
5 R. Fontana, G. Decad Library of Congress Storage Symposium—September 9, 2015 © 2015 IBM CorporaKon

Technology Trends – HDD, TAPE, NAND Flash
1. LTO6 introduced December 2012 2. HDD Shingle MagneKc Recording introduced late 2013 3. NAND technology moves to TLC (3 bit/cell) designs
YE 2008 YE2009 YE2010 YE2011 YE2012¹ YE2013² YE2014³HDDUnits (HDDs millions) 540 557 652 620 577 551 564
PB Shipped (PB) 125000 200000 330000 335000 380000 470000 549000
Areal Density (Gb/in²) 380 530 635 750 750 750(900) 900
Revenue ($ billions) 34.0 34.0 33.0 33.5 37.5 33.4 33.4
$/GB Shipped 0.272 0.170 0.100 0.100 0.100 0.071 0.061
NANDUnits (2GBs millions) 1500 2715 5232 9326 14000 19500 312500
PB Shipped (PB) 3000 5430 10464 18600 28000 39000 62500
Areal Density (Gb/in²) 200 280 330 550 550 850 12003
Revenue ($ billions) 10.0 12.1 18.5 21.5 22.0 24.0 32.2
$/GB Shipped 3.33 2.23 1.77 1.16 0.78 0.615 0.515
LTO TAPEUnits (Cart. millions) 20 24 25 25 22.7 20.4 19.6
PB Shipped (PB) 10400 12165 15300 17800 19500 22500 26160
Areal Density (Gb/in²) 0.9 0.9 1.2 1.2 1.2(2.1) 2.1 2.1
Revenue ($ billions) 1.0 0.7 0.7 0.7 0.62 0.54 0.50
$/GB Shipped 0.093 0.061 0.046 0.038 0.032 0.024 0.0192
6 R. Fontana, G. Decad Library of Congress Storage Symposium—September 9, 2015 © 2015 IBM CorporaKon

© Copyright IBM Corporation 2015
HDD Roadmap
7
• ASTC* roadmap shows 2015 -‐ 2017 areal density increase is ~ 1.4X or 18% per year. Aoerwards, revoluKonary technologies are needed
2
3
4
5
* OperaKng within the exisKng IDEMA framework, ASTC is a forum for collaboraKve joint R&D efforts among storage industry parKcipants, customers, suppliers, universiKes and laboratories with a goal to shorten the Kme from invenKon to producKzaKon.
• Smaller bit cells are thermally unstable
• Smaller bit cells have fewer grains
• Smaller bit cells require improved sensors
R. Fontana, G. Decad Library of Congress Storage Symposium—September 9, 2015 © 2015 IBM CorporaKon
8
bit cell
magnetic grains
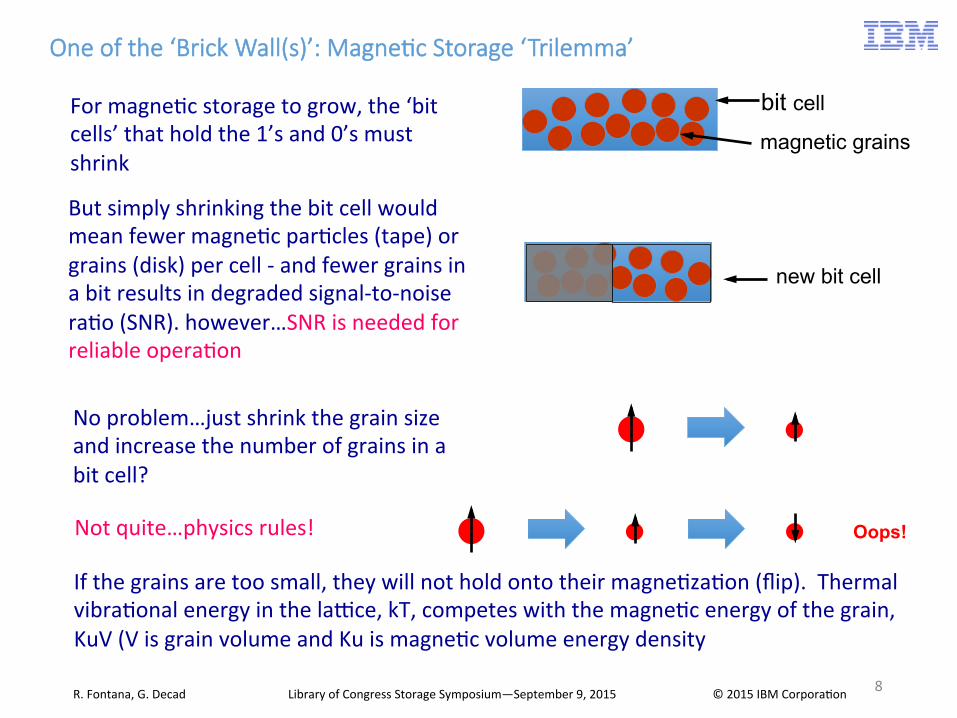
One of the ‘Brick Wall(s)’: MagneNc Storage ‘Trilemma’
For magneKc storage to grow, the ‘bit cells’ that hold the 1’s and 0’s must shrink
new bit cell
But simply shrinking the bit cell would mean fewer magneKc parKcles (tape) or grains (disk) per cell -‐ and fewer grains in a bit results in degraded signal-‐to-‐noise raKo (SNR). however…SNR is needed for reliable operaKon
No problem…just shrink the grain size and increase the number of grains in a bit cell?
Oops! Not quite…physics rules!
If the grains are too small, they will not hold onto their magneKzaKon (flip). Thermal vibraKonal energy in the lawce, kT, competes with the magneKc energy of the grain, KuV (V is grain volume and Ku is magneKc volume energy density
R. Fontana, G. Decad Library of Congress Storage Symposium—September 9, 2015 © 2015 IBM CorporaKon

• Some magneKc physics
• Stable grains require that KuV > 60 kT Physics rules again!!!
• Increasing Ku (not trivial) makes the grains harder to magneKze, i.e. the write head must be able to provide sufficient magneKc field to magneKze the bits
• But magneKc field from write heads is limited by Ms of available write head materials and is not large enough for high Ku disk material So
• Use heat to locally reduce the Ku during the write process with a localized heat spot from a laser excited radiator. THIS IS HAMR or Heat Assisted MagneKc Recording (HAMR)
9
Trilemma (conclusion)
R. Fontana, G. Decad Library of Congress Storage Symposium—September 9, 2015 © 2015 IBM CorporaKon

lasermirror reflector
slider
suspension
M. Re, “Has HAMR reached a criKcal mass”, The InformaKon Storage Industry ConsorKum Symposium on AlternaKve Storage Technologies, April 2009, www.insic.org
10
HAMR
The slider is about the size of a large grain of sand
• HAMR manufacturability requires new (and complex) recording components • Laser on each slider/suspension • Heater embedded into the head structure • New disk media • Overcoat protecKon for media and heater transducer for thermal cycle reliability
• Reliability and cost are issues • Scaling has not been demonstrated to higher densiKes
• HAMR achieving 30% per year annual density growth can be quesKoned
R. Fontana, G. Decad Library of Congress Storage Symposium—September 9, 2015 © 2015 IBM CorporaKon

NAND has three strategies for increasing bits per unit area in a silicon chip 1 Lithographic scaling of the bit cell (x, y) dimensions by reducing F* -‐ 20nm to 16nm è 1.56X more density -‐ 16nm to 13nm è 1.51X more density
2 Increasing the number of bits per cell -‐ 1 bit per cell to MLC (2 bits per cell) è 2.00x increase -‐ MLC to TLC (3 bits per cell) è 1.50x increase
3 3D stacking (larger bit cell but mulKple layers of cells) Example: 16 nm goes to 48 nm and cell design goes from 4F2 to 6F2 so cell area increases 13.5x But by using 27 layers the effecKve density on the surface of the wafer increases by 2.00x (27/13.5)
3D Design Example -‐ Basic Cell 2F x 3F (F is minimum feature) -‐ 12 cells per layer -‐ 4 layers -‐ 2 bits or 3 bits per cell -‐ 96 bits or 144 bits
2F 3F Basic Cell
F
NAND Areal Density
*The basic NAND cell has an area of 4F2 , where F is the minimum paVerned feature forming the cell
11
Yes, 128 Gb chips today
No, Inter-‐cell interference, insufficient charge
Yes, 128 Gb chips today Yes, 128 Gb chips today
Yes, the future of ≥ 128 Gb chips
R. Fontana, G. Decad Library of Congress Storage Symposium—September 9, 2015 © 2015 IBM CorporaKon

0.0
1.0
2.0
3.0
4.0
5.0
6.0
7.0
8.0
9.0
2013 2014 2015 2016 2017 2018 2019 2020 2021 2022
Normalized
Value
s (20
14 re
ference)
Year
3D NAND ROADMAP (ITRS)
Normalized Capacity Normalized Layer Number Normalized Bits/Cell
Flash Roadmap Strategy (ITRS)
• TransiKon aoer the 16 nm node planar cell design to a 3D cell design relying on increasing bits per cell by 2X and layers by 4X in a 6 year to 8 year period, i.e. 40% to 50% annual density increases
128 Gb
256 Gb
512 Gb
1024 Gb
2 Bits/Cell 4 Bits/Cell 3 Bits/Cell 24 Layers
96 Layers
48 Layers
12 R. Fontana, G. Decad Library of Congress Storage Symposium—September 9, 2015 © 2015 IBM CorporaKon

The Real NAND Issue – Scaling the number of layers by 4X
2.5 um 10 um
TODAY (2015) 32 Layer Structure Layer Pitch ~ 67 nm Via/Trench Opening ~ 83 nm Trench Aspect raKo ~ 30:1!!!
?
TOMMOROW (2020) 128 Layer Structure Layer Pitch ~ 67 nm Via/Trench Opening ~ 83 nm Trench Aspect raKo ~ 120:1!!!
• 4X increase in layer number likely achieved only with 4 sequenKal process steps
• Impact is $/GB reducKon
13 R. Fontana, G. Decad Library of Congress Storage Symposium—September 9, 2015 © 2015 IBM CorporaKon

• 2015 (Today): 100 GB Disk • 3 layers on one disk surface • areal density per disk surface ~ 75 Gbit/in2
• 2016 (?): 200 GB Disk • 6 layers: 3 on top disk surface and 3 on
boVom disk surface • Areal density per disk surface unchanged ~
75 Gbit/in2
• 201X (?): 300 GB Disk • Land and groove recording to increase
tracks -‐-‐ PHYSICS • Areal density per layer changes by 1.5X to ~
~ 112 Gbit/in2
• 202Y (?): 500 GB Disk • Channel algorithms to reduce bit length to
increase bits along the track • Areal density per layer changes by 1.67X to ~
~ 187 Gbit/in2
• 202Z (?): 1000 GB Disk • 2 bit per cell recording by wri[ng bits at 3
different powers -‐-‐ PHYSICS • Areal density per layer changes by 2.0X to ~
375 Gbit/in2
OpNcal Recording Roadmap (Technology with No Time Line)
TIME (?)
14 R. Fontana, G. Decad Library of Congress Storage Symposium—September 9, 2015 © 2015 IBM CorporaKon

OpNcal Recording and Physics
• “Land and Groove” recording: Inter-‐track interference (reading and wriKng)
• 2 bit per cell recording: Use variable laser power to “crystalize” the phase change material into three disKnct structures with reproducible reflecKvity
• Issue: Historical annual areal density increase for opKcal recording ~ 12%/year so the combinaKon of land and groove recording and 2 bit per cell recording represents a 3X increase; adding channel invenKon represents a 5X increase. What are reasonable expectaKons for density increases from history?
• 3X increase implies 24%/yr for 5 years, 16%/yr for 7 years, 12%/yr for 9 years • 5X increase implies 38%/yr for 5 years, 25%/yr for 7 years, 20%/yr for 9 years
100% 66% 33% 0%
15 R. Fontana, G. Decad Library of Congress Storage Symposium—September 9, 2015 © 2015 IBM CorporaKon

Tape Roadmaps
1.0
10.0
100.0
2010 2012 2014 2016 2018 2020 2022 2024
Areal Desnity (G
b/in
2 )
Year
Tape Roadmap -‐-‐ Areal Density
Present enterprise products
• Tape roadmaps established in 2013 by INSIC (InternaKonal Storage Industrial ConsorKum) project 33% annual areal density increases. 2015 projecKons are being saKsfied!!
• Why: The large bit cell!!!
7 Gb/in2
28 Gb/in2 14 Gb/in2 1100 Gb/in2 for HDD (today)
16 R. Fontana, G. Decad Library of Congress Storage Symposium—September 9, 2015 © 2015 IBM CorporaKon

Density Confidence Reflected in the Published 10 GeneraKons LTO Roadmap
• Tape density growth is assured by the development of evolu[onary technology • Improved track edge definiKon (TPI increases) • Improved “writeablity” of smaller size grains with high Hk (high moment heads) • Sensors to detect smaller bit cell widths • Media to support smaller bit cells
17
LTO 3 LTO 4 LTO 5 LTO 6 LTO 7 LTO 8 LTO 9 LTO 10
Year 2004 2007 2010 2012 2015
NaKve Capacity (TB) 0.4 0.8 1.5 2.5 6.4* 12.8 25.0 48.0
NaKve Data Rate (MB/s) 80 120 140 160 315* 472 708 1100
Compression RaKo 2.0 2.0 2.0 2.5 2.5 2.5 2.5 2.5
Compressed Cap (TB) 0.8 1.6 3.0 6.25 16.0 32.0 62.5 120.0
Compressed Data Rate (MB/s) 160 240 280 400 788 1180 1770 2750
*LTO7 TBD
Future
R. Fontana, G. Decad Library of Congress Storage Symposium—September 9, 2015 © 2015 IBM CorporaKon

© Copyright IBM Corporation 2015
Example 1: Trimmed Writer for BeVer Track Edge DefiniKon
18
ConvenKonal write head Trimmed write head
Curved transiKons due to fringing fields in write heads limit achievable future track densiKes
Straight transiKons
MagneKc Force Microscopy of WriVen Tracks on Tape
IBM ConfidenKal R. Fontana, G. Decad Library of Congress Storage Symposium—September 9, 2015 © 2015 IBM CorporaKon
© Copyright IBM Corporation 2015
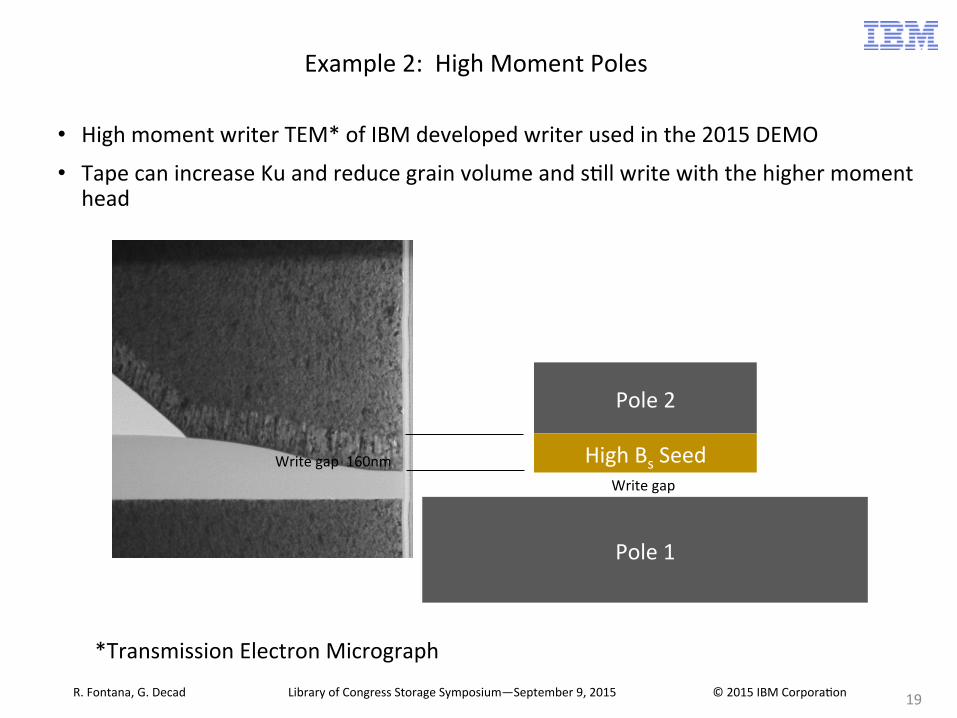
Example 2: High Moment Poles
• High moment writer TEM* of IBM developed writer used in the 2015 DEMO
• Tape can increase Ku and reduce grain volume and sKll write with the higher moment head
19
Pole 1
Pole 2
High Bs Seed Write gap
*Transmission Electron Micrograph
Write gap 160nm
IBM ConfidenKal R. Fontana, G. Decad Library of Congress Storage Symposium—September 9, 2015 © 2015 IBM CorporaKon

© Copyright IBM Corporation 2015
Example 3: Tunnel MagnetoresisKve (TMR) Sensor for Smaller Bit Cell DetecKon
• TMR* gives >4x more signal than GMR when tested under similar condiKons
20
Same test pla�orm Same size populaKons Same track width, bias Same tape type Similar spacing
*IBM 2015 Tape Demo used an HDD TMR
Higher output gives be`er reading performance Ul[mately enables growth beyond 10-‐15 TB cartridge
IBM ConfidenKal
Today’s GMR
Tape TMR
12.4 dB (4.2x)
Head Readb
ack Outpu
t (dB
)
R. Fontana, G. Decad Library of Congress Storage Symposium—September 9, 2015 © 2015 IBM CorporaKon

21
Example 4: Media Development SupporKng Smaller Grains
CoPtX 148Gb/in2 Sputtered Media (i.e. like HDD Media)
BaFe >80Gb/in2 Particulate Media
IBM Zurich DemonstraKon
IBM Zurich DemonstraKon
R. Fontana, G. Decad Library of Congress Storage Symposium—September 9, 2015 © 2015 IBM CorporaKon

© Copyright IBM Corporation 2015
MagneKc Storage Strategies
22
ContrasKng strategies between HDD and TAPE in transiKoning to 10 TB components
-‐ HDD -‐ Add plaVers (with helium) vs increase areal density (so far via shingling) -‐ TAPE -‐ Increase areal density (e.g. EDGE2015 Demo) vs thinner, longer tape
0
20
40
60
80
100
120
Seagate 8TB HDD
HGST 8 TBHDD
HGST 10 TBHDD
IBM 10 TBTAPE
Relativ
e Increases
from
4 TB Co
mpo
net
(%)
Componets
Density and Media Volume Trends for Storage Components Referenced to 4 TB Components
Relative Media Increase Relative AD Increase
R. Fontana, G. Decad Library of Congress Storage Symposium—September 9, 2015 © 2015 IBM CorporaKon
© Copyright IBM Corporation 2015
Future of NAND, Disk and Tape
23
• HDD areal density has been growing 20% per year, at best, over the last 3 to 4 years and is now introducing SMR. RevoluKonary technology like HAMR faces extendibility (Moore's Law) challenges and is not yet proven in manufacturing.
• NAND has a near term horizon of increasing density by 2X to 3X and a long term
horizon of 6X to 8X. If 8x is achieved in 6 years then this is 43% per year (aggressive), if 8 years then 30% per year. NAND areal density increases rely on transiKon to 3D cells and require new processing strategies with potenKal addiKve process costs as 3d layers increase. However, processing is a core experKse of the semiconductor industry so success will follow.
• Tape areal density has been growing at approximately 30% per year using
evoluKonary technologies and is backed up with a consistent record of demonstraKons.
• OpKcal – Unknown Kme line with aggressive technology nodes
• In the next 3 years it is much more likely that tape cartridge capacity will double from 10 TB to 20 TB than 3.5” HDD disc drive capacity will double from 8 TB to 16 TB è HDD has limited ability to add more plaVers while TAPE has a metered ~5%/yr strategy to increase tape length coupled with established areal density growth.
R. Fontana, G. Decad Library of Congress Storage Symposium—September 9, 2015 © 2015 IBM CorporaKon


![NAND Flash Memory - Digi-Key Sheets/Micron Technology Inc...nand flash memory mt29f16g08ababa, mt29f32g08afaba, mt29f64g08a[j/k/m]aba, mt29f128g08auaba, mt29f16g08abcbb, mt29f32g08aecbb,](https://img.pdfslide.net/doc/110x75/5aece0407f8b9a3b2e8fb6f1/nand-flash-memory-digi-key-sheetsmicron-technology-incnand-flash-memory-mt29f16g08ababa.jpg)


![Emerging Challenges in NAND Flash Technology FG NAND cell has been scaled down over 18 years. [ Year ] MLC SLC? 9 Presentation Agenda NAND Flash Market Overview Technology Scaling](https://img.pdfslide.net/doc/110x75/5ad528727f8b9a075a8c8fef/emerging-challenges-in-nand-flash-technology-fg-nand-cell-has-been-scaled-down-over.jpg)