Embed Size (px)
Citation preview

1
ROANOKE-CHOWAN COMMUNITY COLLEGE
AHOSKIE, NORTH CAROLINA FINANCIAL STATEMENT AUDIT REPORT FOR THE YEAR ENDED JUNE 30, 2018
A COMPONENT UNIT OF THE STATE OF NORTH CAROLINA
STATE OF NORTH CAROLINA OFFICE OF THE STATE AUDITOR
BETH A. WOOD, CPA
STATE OF NORTH CAROLINA Office of the State Auditor
Beth A. Wood, CPA
State Auditor
2 S. Salisbury Street
20601 Mail Service Center Raleigh, NC 27699-0600
Telephone: (919) 807-7500 Fax: (919) 807-7647
http://www.ncauditor.net
AUDITOR’S TRANSMITTAL
The Honorable Roy Cooper, Governor The General Assembly of North Carolina Board of Trustees, Roanoke-Chowan Community College
We have completed a financial statement audit of Roanoke-Chowan Community College for the year ended June 30, 2018, and our audit results are included in this report. You will note from the independent auditor’s report that we determined that the financial statements are presented fairly in all material respects.
The results of our tests disclosed no deficiencies in internal control over financial reporting that we consider to be material weaknesses in relation to our audit scope or any instances of noncompliance or other matters that are required to be reported under Government Auditing Standards.
North Carolina General Statutes require the State Auditor to make audit reports available to the public. Copies of audit reports issued by the Office of the State Auditor may be obtained through one of the options listed in the back of this report.
Beth A. Wood, CPA State Auditor
TABLE OF CONTENTS
PAGE
INDEPENDENT AUDITOR’S REPORT ................................................................ 1
MANAGEMENT’S DISCUSSION AND ANALYSIS .................................................. 3
BASIC FINANCIAL STATEMENTS
COLLEGE EXHIBITS
A-1 STATEMENT OF NET POSITION .................................................. 8
A-2 STATEMENT OF REVENUES, EXPENSES, AND CHANGES IN NET POSITION ............................................................................. 10
A-3 STATEMENT OF CASH FLOWS .................................................. 11
NOTES TO THE FINANCIAL STATEMENTS ................................................. 13
REQUIRED SUPPLEMENTARY INFORMATION
B-1 SCHEDULE OF THE PROPORTIONATE NET PENSION LIABILITY (TEACHERS’ AND STATE EMPLOYEES’ RETIREMENT SYSTEM) ...... 42
B-2 SCHEDULE OF COLLEGE CONTRIBUTIONS (TEACHERS’ AND STATE EMPLOYEES’ RETIREMENT SYSTEM) ...... 43
NOTES TO REQUIRED SUPPLEMENTARY INFORMATION (TEACHERS’ AND STATE EMPLOYEES’ RETIREMENT SYSTEM) ............. 44
B-3 SCHEDULE OF THE PROPORTIONATE NET OPEB LIABILITY OR ASSET (COST-SHARING, MULTIPLE-EMPLOYER, DEFINED BENEFIT OPEB PLANS) ......................................................................... 45
B-4 SCHEDULE OF COLLEGE CONTRIBUTIONS (COST-SHARING, MULTIPLE-EMPLOYER, DEFINED BENEFIT OPEB PLANS) ......................................................................... 46
NOTES TO REQUIRED SUPPLEMENTARY INFORMATION (COST-SHARING, MULTIPLE-EMPLOYER, DEFINED BENEFIT OPEB PLANS) ................................................................................. 47
INDEPENDENT AUDITOR’S REPORT ON INTERNAL CONTROL OVER FINANCIAL REPORTING AND ON COMPLIANCE AND OTHER MATTERS BASED ON AN AUDIT OF FINANCIAL STATEMENTS PERFORMED IN ACCORDANCE WITH GOVERNMENT AUDITING STANDARDS ................................................................................ 48
ORDERING INFORMATION ............................................................................ 50
Beth A. Wood, CPA
State Auditor
Article V, Chapter 147 of the North Carolina General Statutes, gives the Auditor broad powers to examine all books, records, files, papers, documents, and financial affairs of every state agency and any organization that receives public funding. The Auditor also has the power to summon people to produce records and to answer questions under oath.
INDEPENDENT
AUDITOR’S REPORT

STATE OF NORTH CAROLINA Office of the State Auditor
Beth A. Wood, CPA
State Auditor
1
2 S. Salisbury Street
20601 Mail Service Center Raleigh, NC 27699-0600
Telephone: (919) 807-7500 Fax: (919) 807-7647
http://www.ncauditor.net
INDEPENDENT AUDITOR’S REPORT
Board of Trustees Roanoke-Chowan Community College Ahoskie, North Carolina
Report on the Financial Statements We have audited the accompanying financial statements of Roanoke-Chowan Community College (College), a component unit of the State of North Carolina, as of and for the year ended June 30, 2018, and the related notes to the financial statements, which collectively comprise the College’s basic financial statements as listed in the table of contents.
Management’s Responsibility for the Financial Statements Management is responsible for the preparation and fair presentation of these financial statements in accordance with accounting principles generally accepted in the United States of America; this includes the design, implementation, and maintenance of internal control relevant to the preparation and fair presentation of financial statements that are free from material misstatement, whether due to fraud or error.
Auditor’s Responsibility Our responsibility is to express an opinion on these financial statements based on our audit. We conducted our audit in accordance with auditing standards generally accepted in the United States of America and the standards applicable to financial audits contained in Government Auditing Standards, issued by the Comptroller General of the United States. Those standards require that we plan and perform the audit to obtain reasonable assurance about whether the financial statements are free from material misstatement.
An audit involves performing procedures to obtain audit evidence about the amounts and disclosures in the financial statements. The procedures selected depend on the auditor’s judgment, including the assessment of the risks of material misstatement of the financial statements, whether due to fraud or error. In making those risk assessments, the auditor considers internal control relevant to the College’s preparation and fair presentation of the financial statements in order to design audit procedures that are appropriate in the circumstances, but not for the purpose of expressing an opinion on the effectiveness of the College’s internal control. Accordingly, we express no such opinion. An audit also includes evaluating the appropriateness of accounting policies used and the reasonableness of significant accounting estimates made by management, as well as evaluating the overall presentation of the financial statements.

2
INDEPENDENT AUDITOR’S REPORT
We believe that the audit evidence we have obtained is sufficient and appropriate to provide a basis for our audit opinion.
Opinion In our opinion, the financial statements referred to above present fairly, in all material respects, the financial position of Roanoke-Chowan Community College, as of June 30, 2018, and the changes in financial position and cash flows thereof for the year then ended in accordance with accounting principles generally accepted in the United States of America.
Emphasis of Matter
As discussed in Note 16 to the financial statements, during the year ended June 30, 2018, Roanoke-Chowan Community College adopted new accounting guidance, Governmental Accounting Standards Board Statement No. 75, Accounting and Financial Reporting for Postemployment Benefits Other Than Pensions, as amended by Governmental Accounting Standards Board Statement No. 85, Omnibus 2017. Our opinion is not modified with respect to this matter.
Other Matters – Required Supplementary Information Accounting principles generally accepted in the United States of America require that the Management’s Discussion and Analysis and other required supplementary information, as listed in the table of contents, be presented to supplement the basic financial statements. Such information, although not a part of the basic financial statements, is required by the Governmental Accounting Standards Board who considers it to be an essential part of financial reporting for placing the basic financial statements in an appropriate operational, economic, or historical context. We have applied certain limited procedures to the required supplementary information in accordance with auditing standards generally accepted in the United States of America, which consisted of inquiries of management about the methods of preparing the information and comparing the information for consistency with management’s responses to our inquiries, the basic financial statements, and other knowledge we obtained during our audit of the basic financial statements. We do not express an opinion or provide any assurance on the information because the limited procedures do not provide us with sufficient evidence to express an opinion or provide any assurance.
Other Reporting Required by Government Auditing Standards In accordance with Government Auditing Standards, we have also issued our report dated March 25, 2019 on our consideration of the College’s internal control over financial reporting and on our tests of its compliance with certain provisions of laws, regulations, contracts, and grant agreements and other matters. The purpose of that report is to describe the scope of our testing of internal control over financial reporting and compliance and the results of that testing, and not to provide an opinion on internal control over financial reporting or on compliance. That report is an integral part of an audit performed in accordance with Government Auditing Standards in considering the College’s internal control over financial reporting and compliance.
Beth A. Wood, CPA State Auditor
Raleigh, North Carolina
March 25, 2019

MANAGEMENT’S DISCUSSION AND
ANALYSIS

3
MANAGEMENT’S DISCUSSION AND ANALYSIS
This section of Roanoke-Chowan Community College’s (College) financial report represents Management’s Discussion and Analysis of the College’s financial activity during the fiscal year ended June 30, 2018 with comparative data for the fiscal year ended June 30, 2017. College management has prepared this discussion along with the financial statements and notes to the financial statements. This section should be read in conjunction with and is qualified in its entirety by, the financial statements and notes to the financial statements. The financial statements, notes to the financial statements, and this discussion are the responsibility of College management.
Financial Statement Presentation
The College’s basic financial statements include: Statement of Net Position, Statement of Revenues, Expenses and Changes in Net Position, Statement of Cash Flows, and Notes to the Financial Statements. The College’s component unit, the Roanoke-Chowan Community College Foundation, Inc. (Foundation), is blended with the financial information of the College in the following financial statements.
The Statement of Net Position includes all assets, deferred outflows of resources, liabilities, and deferred inflows of resources. This statement combines and consolidates current financial resources (short-term consumable resources) with capital assets. The increase or decrease in net position is an indicator of the improvement or erosion of the College’s financial condition.
The Statement of Revenues, Expenses, and Changes in Net Position is designed to be similar to the bottom line results for the College. This statement focuses on both gross and net costs of college activities that are supported mainly by state, local, federal, and other revenues. This approach is intended to simplify the user’s analysis of the cost of various college services to students and the public.
The Statement of Cash Flows presents information detailing the sources and uses of cash from operating activities, capital and noncapital financing activities, and investing activities.
Statement of Net Position
The Statement of Net Position presents assets, deferred outflows of resources, liabilities, deferred inflows of resources, and net position of the College for the fiscal year ended June 30, 2018. From the data presented, readers of the Statement of Net Position are able to determine the assets (current and noncurrent) available to continue the operations of the College along with how much the College owes vendors (current and noncurrent). Ultimately, the Statement of Net Position provides users of these statements a snapshot of the net position (assets plus deferred outflows minus liabilities and deferred inflows) and their availability for expenditures by the College.
Net Position is divided into three major categories. The first category, net investment in capital assets, provides the equity in property, plant and equipment owned by the institution, and construction payables. Capital assets for the College are comprised of nondepreciable and depreciable assets. Nondepreciable assets include land and construction in progress. Depreciable assets include buildings, general infrastructure, and machinery and equipment.
The next net position category is restricted expendable net position, which are subject to external restrictions on how they may be used. The final category is unrestricted net position, which is available to the College for any lawful purpose of the institution.

4
MANAGEMENT’S DISCUSSION AND ANALYSIS
Condensed Statement of Net Position
AssetsCurrent Assets $ 1,313,813 $ 1,037,589 $ 276,224Noncurrent Assets 51,751 135,573 (83,822)Capital Assets 5,672,181 6,018,737 (346,556)
Total Assets 7,037,745 7,191,899 (154,154)
Deferred Outflows of ResourcesDeferred Outflows Related to Pensions 1,058,390 1,717,290 (658,900)Deferred Outflows Related to OPEB 234,657 235,555 (898)
Total Deferred Outflows 1,293,047 1,952,845 (659,798)
LiabilitiesCurrent
Current Liabilities 553,290 450,674 102,616Long-Term Liabilities - Current Potion 53,451 60,942 (7,491)
Noncurrent Long-Term Liabilities 9,641,468 13,491,355 (3,849,887)
Total Liabilities 10,248,209 14,002,971 (3,754,762)
Deferred Inflows of ResourcesDeferred Inflows Related to Pensions 157,799 144,513 13,286Deferred Inflows Related to OPEB 3,320,533 3,320,533
Total Deferred Inflows 3,478,332 144,513 3,333,819
Net PositionNet Investment in Capital Assets 5,649,158 6,018,738 (369,580)Restricted 401,463 421,404 (19,941)Unrestricted (11,446,370) (11,442,881) (3,489)
Total Net Position $ (5,395,749) $ (5,002,739) $ (393,010)
2018 (as Restated)2017
(Decrease)Increase
As seen in the comparison of current fiscal year and prior fiscal year information, there was a decrease in total assets of approximately $154,154. Current assets increased $276,224 primarily due to an increase in cash and cash equivalents. This increase can be attributed in part to the College preparing for a proposed three percent county appropriation reduction in FY 2018-2019 by withholding a larger fund balance at June 30, 2018. The College also collected more revenue in student fee accounts than was expended for the year which resulted in an increase in cash availability. Noncurrent Assets decreased $83,822 due to HVAC upgrades across the campus for approximately $62,000 from funds received from the Cannon Foundation in a prior period. Capital assets decreased by $346,556 due to current year depreciation expense of $383,179 offset by purchases of machinery and equipment and construction in progress of $36,624. Capital assets are further discussed in the capital asset section below.
Deferred outflows related to pensions decreased $658,900 due to a change in actuarial assumptions and the net difference between projected and actual earnings on plan investments.
Total liabilities decreased approximately $3,754,762. Current liabilities increased due to accrued payroll that was attributed to more part-time employees and off-load contracts due at June 30, 2018. The decrease to long-term liabilities resulted from changes related to the net

5
MANAGEMENT’S DISCUSSION AND ANALYSIS
June 30, 2018. The decrease to long-term liabilities resulted from changes related to the net pension liability and net other postemployment benefits liability, $544,348 and $3,318,150, respectively.
In response to the GASB Statement No. 75 - Accounting and Financial Reporting for Postemployment Benefits Other Than Pensions, the College recorded an inflow of $3,320,533 in deferred inflows related to OPEB that is new for FY 2017-2018.
The only significant change to net position was the $369,580 decrease in net investment in capital assets. Those changes are discussed below in the capital assets section.
Statement of Revenues, Expenses, and Changes in Net Position
The change in total net position as presented on the Statement of Net Position is based on activity offered in the Statement of Revenues, Expenses, and Changes in Net Position. The purpose of the statement is to present the revenues and expenses of the College, distinguishing between the operating and nonoperating revenues and expenses.
Condensed Statement of Revenues, Expenses, and Changes in Net Position
Operating RevenuesStudent Tuition and Fees, Net $ 343,733 $ 319,883 $ 23,850Sales and Services 33,857 37,188 (3,331)Other Operating Revenues 4,209 12,443 (8,234)
Total Operating Revenues 381,799 369,514 12,285
Operating ExpensesSalaries and Benefits 6,538,454 6,524,534 13,920Supplies and Materials 930,473 640,734 289,739Services 895,342 979,629 (84,287)Scholarships and Fellowships 1,022,314 1,161,376 (139,062)Utilities 225,275 236,088 (10,813)Depreciation 383,180 380,825 2,355
Total Operating Expenses 9,995,038 9,923,186 71,852
Operating Loss (9,613,239) (9,553,672) (59,567)
Nonoperating RevenuesState Aid 5,512,672 5,538,421 (25,749)County Appropriations 1,090,165 993,059 97,106Noncapital Grants and Gifts 2,211,859 2,523,179 (311,320)Other Nonoperating Revenues 34,831 22,940 11,891
Capital Aid and Capital Grants 370,703 341,054 29,649
Total Nonoperating and Other Revenues 9,220,230 9,418,653 (198,424)
Change in Net Position (393,009) (135,019) (257,990)
Net Position - Beginning of Year (5,002,740) 5,653,194
Restatement (10,520,915)
Net Position - End of Year $ (5,395,749) $ (5,002,740)
Fiscal Year 2017-2018 total revenues are $9,602,029 and total expenses are $9,995,038.Fiscal Year 2016-2017 total revenues are $9,788,167 and total expenses are $9,923,186.* Note: The year ended June 30, 2017 column is not restated above for changes related to GASB 75, because actuarial calculations performed relative to the implementation of GASB 75 do not provide sufficient information to restate these amounts.
2018 (as Restated)* (Decrease)2017 Increase

6
MANAGEMENT’S DISCUSSION AND ANALYSIS
Operating expenses increased $71,852 from the previous year. The $289,739 increase to supplies and materials was due to a $140,000 repair to HVAC systems on campus and a $85,000 roof replacement to the Student Services Building. Scholarships and fellowships decreased due to lower full-time equivalents and services decreased from less accreditation expenses and advertising campaigns than in the prior year.
The $198,424 decrease in nonoperating revenues is attributed to a decrease in funding from several sources. A $311,320 reduction in noncapital grants and gifts is related to having fewer full-time equivalents who received financial aid. The increase in county appropriations of $97,106 primarily because Northhampton County appropriated $40,000 more in FY 2017-2018 than in 2016-2017. Also, Bertie County appropriated an additional $40,000 for facility repairs.
Analysis of Net Capital Assets
The table below shows the classifications of the College’s capital assets as of June 30, 2018. The only addition to machinery and equipment totaling $13,600 was an ambulance to be used in the Emergency Medical Science program. The addition to construction in progress totaling $23,024 is expenditures for the construction of a Fine Arts building and a greenhouse. The Fine Arts building will house college transfer classes and the culinary arts program. The greenhouse is needed for the new farm-to-table program that the College is starting in conjunction with the culinary program. Accumulated depreciation also increased as a result of yearly depreciation.
Condensed Statement of Capital Assets
Capital AssetsLand $ 34,805 $ 34,805 $ 0Construction in Progress 23,024 23,024Buildings 11,694,720 11,694,720Machinery and Equipment 1,637,749 1,624,149 13,600General Infrastructure 242,311 242,311
Total 13,632,609 13,595,985 36,624
Less: Accumulated Depreciation 7,960,428 7,577,248 383,180
Net Capital Assets $ 5,672,181 $ 6,018,737 $ (346,556)
2018 2017 (Decrease)Increase
Economic Outlook
The level of state support is one of the key factors influencing the College’s financial condition and its ability to expand programs, undertake new initiatives, and meet its core mission and on-going operational needs. In addition, there is a direct relationship between the level of state support and tuition increases, as declines in state support have resulted in increased tuition and/or mandatory budget reversions.
Like many other community colleges in the State of North Carolina, the College has experienced a reduction in enrollment but continues to be proactive in recruiting to increase enrollment growth and community support. Enrollment projections for 2018-2019 show a decline even though the College continues to increase marketing efforts and community

7
MANAGEMENT’S DISCUSSION AND ANALYSIS
outreach. The economic position of the College is closely tied to that of the State of North Carolina and the service areas of Hertford, Bertie, and Northampton counties.
The direct impact of the local and national economy on the appropriations for the College is uncertain. Management feels that by using a conservative, realistic approach in handling its resources, the College will be able to continue supporting the educational needs of its students in a quality-learning environment.
The College is affirmed by the Southern Association of Colleges and Schools Commissions on Colleges (SACSCOC). SACSCOC affirmation affords the College continued credibility with the community and availability of financial resources from significant funding agencies.

FINANCIAL
STATEMENTS

Exhibit A-1Page 1 of 2
Current Assets:Cash and Cash Equivalents $ 613,266.58Restricted Cash and Cash Equivalents 368,219.38Receivables, Net (Note 4) 237,079.78Inventories 27,999.11Prepaid Items 65,580.79Notes Receivable, Net (Note 4) 1,667.06
Total Current Assets 1,313,812.70
Noncurrent Assets:Restricted Cash and Cash Equivalents 38,377.65Net Other Postemployment Benefits Asset 13,373.00Capital Assets - Nondepreciable (Note 5) 57,828.80Capital Assets - Depreciable, Net (Note 5) 5,614,352.54
Total Noncurrent Assets 5,723,931.99
Total Assets 7,037,744.69
Deferred Outflows Related to Pensions 1,058,390.00Deferred Outflows Related to Other Postemployment Benefits (Note 13) 234,657.00
Total Deferred Outflows of Resources 1,293,047.00
Current Liabilities:Accounts Payable and Accrued Liabilities (Note 6) 506,811.12Unearned Revenue 16,376.59Funds Held for Others 30,102.74Long-Term Liabilities - Current Portion (Note 7) 53,451.02
Total Current Liabilities 606,741.47
Noncurrent Liabilities:Long-Term Liabilities (Note 7) 9,641,467.65
Total Liabilities 10,248,209.12
Deferred Inflows Related to Pensions 157,799.00Deferred Inflows Related to Other Postemployment Benefits (Note 13) 3,320,533.00
Total Deferred Inflows of Resources 3,478,332.00
DEFERRED OUTFLOWS OF RESOURCES
Roanoke-Chowan Community College
ASSETS
Statement of Net PositionJune 30, 2018
LIABILITIES
DEFERRED INFLOWS OF RESOURCES
8
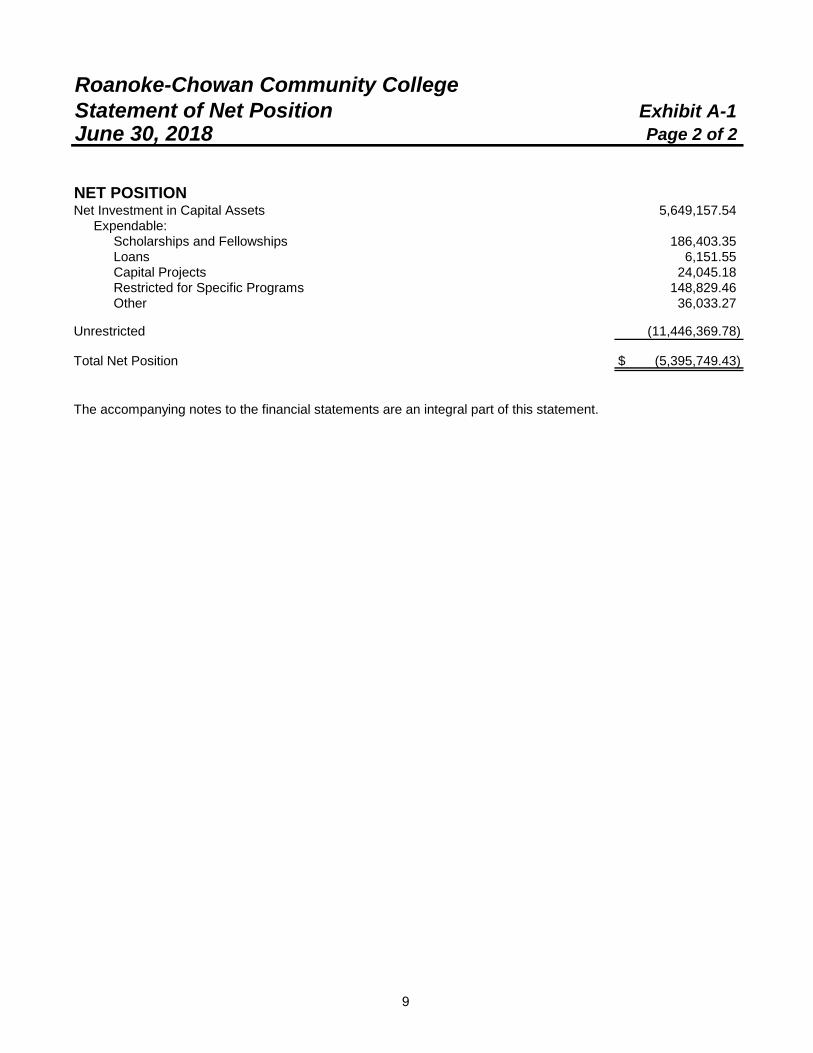
Exhibit A-1Page 2 of 2
Net Investment in Capital Assets 5,649,157.54Expendable:
Scholarships and Fellowships 186,403.35Loans 6,151.55Capital Projects 24,045.18Restricted for Specific Programs 148,829.46Other 36,033.27
Unrestricted (11,446,369.78)
Total Net Position $ (5,395,749.43)
The accompanying notes to the financial statements are an integral part of this statement.
NET POSITION
Roanoke-Chowan Community College
June 30, 2018Statement of Net Position
9

Roanoke-Chowan Community CollegeStatement of Revenues, Expenses, and
Changes in Net PositionFor the Fiscal Year Ended June 30, 2018 Exhibit A-2
REVENUES
Student Tuition and Fees, Net (Note 10) $ 343,733.24Sales and Services 33,856.88Other Operating Revenues 4,208.54
Total Operating Revenues 381,798.66
EXPENSES
Salaries and Benefits 6,538,453.60Supplies and Materials 930,473.45Services 895,342.59Scholarships and Fellowships 1,022,313.79Utilities 225,274.76Depreciation 383,179.52
Total Operating Expenses 9,995,037.71
Operating Loss (9,613,239.05)
NONOPERATING REVENUESState Aid 5,512,672.32County Appropriations 1,090,165.35Noncapital Grants - Student Financial Aid 1,662,171.16Noncapital Grants 523,880.92Noncapital Gifts 25,807.00Investment Income 2,016.22Other Nonoperating Revenues 32,815.05
Net Nonoperating Revenues 8,849,528.02
Loss Before Other Revenues (763,711.03)
State Capital Aid 66,526.69County Capital Aid 276,673.65Capital Grants 27,501.54
Decrease in Net Position (393,009.15)
NET POSITIONNet Position, July 1, 2017 as Restated (Note 17) (5,002,740.28)
Net Position, June 30, 2018 $ (5,395,749.43)
The accompanying notes to the financial statements are an integral part of this statement.
Operating Expenses:
Operating Revenues:
10
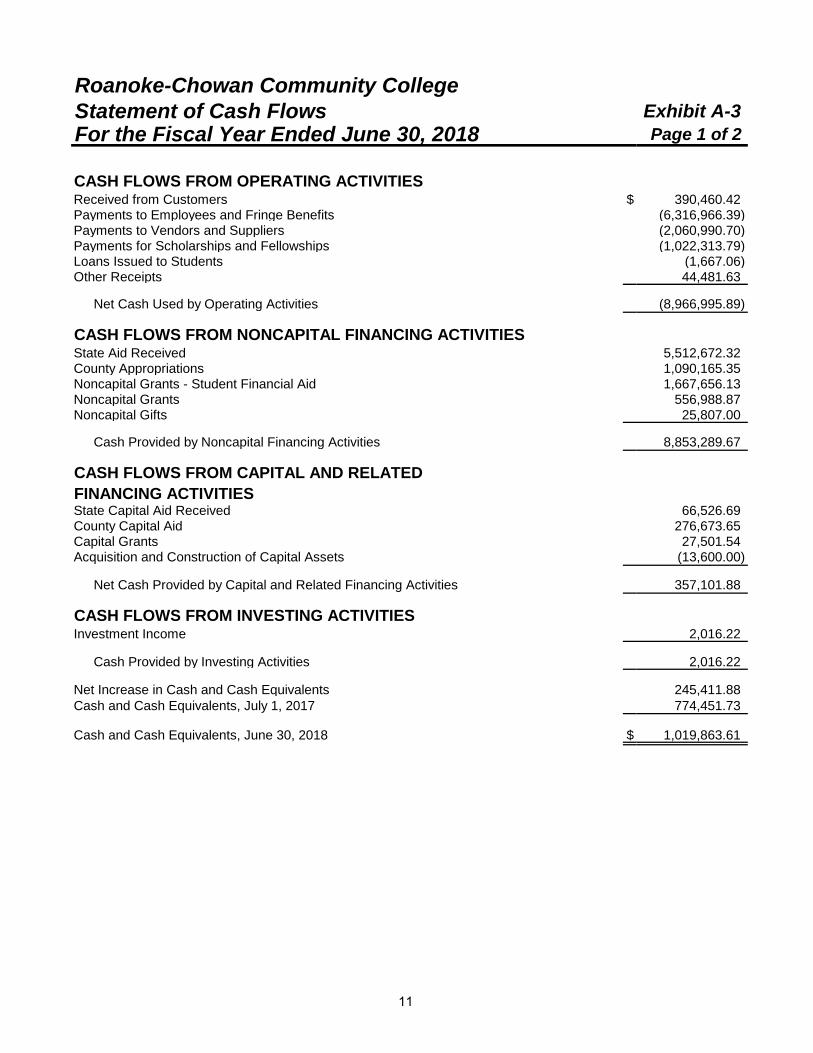
Roanoke-Chowan Community CollegeStatement of Cash Flows Exhibit A-3For the Fiscal Year Ended June 30, 2018 Page 1 of 2
Received from Customers $ 390,460.42Payments to Employees and Fringe Benefits (6,316,966.39)Payments to Vendors and Suppliers (2,060,990.70)Payments for Scholarships and Fellowships (1,022,313.79)Loans Issued to Students (1,667.06)Other Receipts 44,481.63
Net Cash Used by Operating Activities (8,966,995.89)
State Aid Received 5,512,672.32County Appropriations 1,090,165.35Noncapital Grants - Student Financial Aid 1,667,656.13Noncapital Grants 556,988.87Noncapital Gifts 25,807.00
Cash Provided by Noncapital Financing Activities 8,853,289.67
FINANCING ACTIVITIESState Capital Aid Received 66,526.69County Capital Aid 276,673.65Capital Grants 27,501.54Acquisition and Construction of Capital Assets (13,600.00)
Net Cash Provided by Capital and Related Financing Activities 357,101.88
Investment Income 2,016.22
Cash Provided by Investing Activities 2,016.22
Net Increase in Cash and Cash Equivalents 245,411.88Cash and Cash Equivalents, July 1, 2017 774,451.73
Cash and Cash Equivalents, June 30, 2018 $ 1,019,863.61
CASH FLOWS FROM OPERATING ACTIVITIES
CASH FLOWS FROM NONCAPITAL FINANCING ACTIVITIES
CASH FLOWS FROM CAPITAL AND RELATED
CASH FLOWS FROM INVESTING ACTIVITIES
11
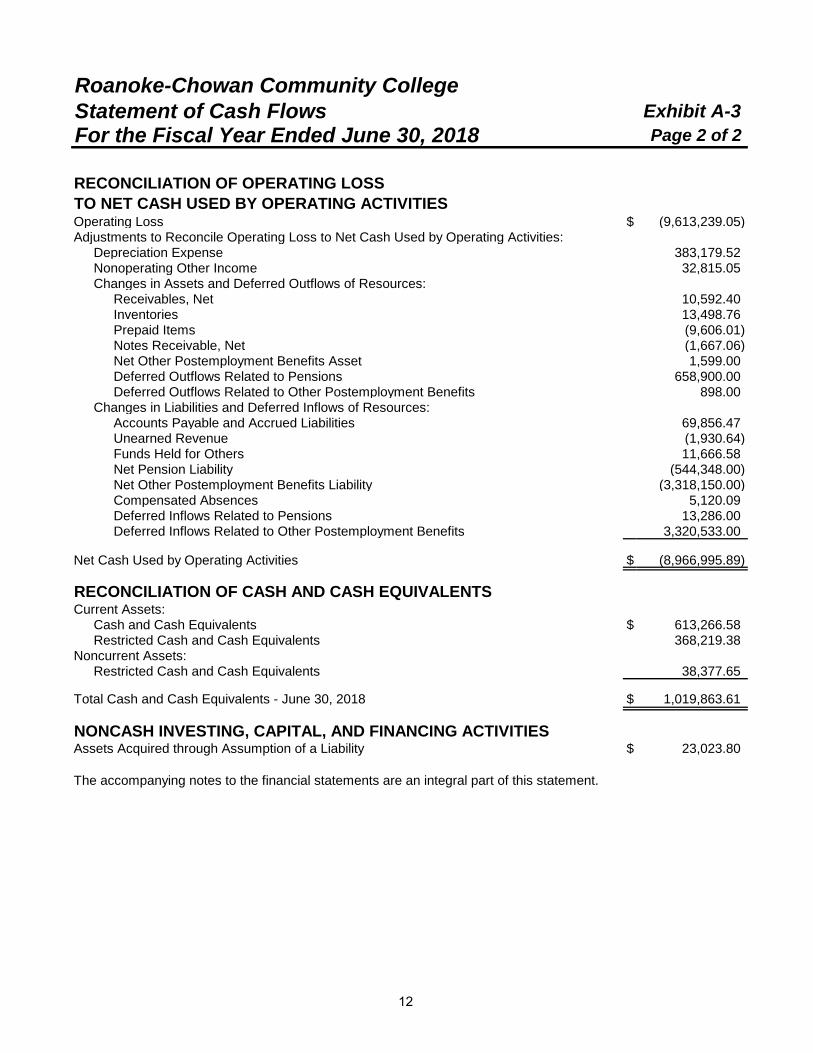
Roanoke-Chowan Community CollegeStatement of Cash Flows Exhibit A-3For the Fiscal Year Ended June 30, 2018 Page 2 of 2
RECONCILIATION OF OPERATING LOSSTO NET CASH USED BY OPERATING ACTIVITIESOperating Loss $ (9,613,239.05)Adjustments to Reconcile Operating Loss to Net Cash Used by Operating Activities:
Depreciation Expense 383,179.52Nonoperating Other Income 32,815.05Changes in Assets and Deferred Outflows of Resources:
Receivables, Net 10,592.40Inventories 13,498.76Prepaid Items (9,606.01)Notes Receivable, Net (1,667.06)Net Other Postemployment Benefits Asset 1,599.00Deferred Outflows Related to Pensions 658,900.00Deferred Outflows Related to Other Postemployment Benefits 898.00
Changes in Liabilities and Deferred Inflows of Resources:Accounts Payable and Accrued Liabilities 69,856.47Unearned Revenue (1,930.64)Funds Held for Others 11,666.58Net Pension Liability (544,348.00)Net Other Postemployment Benefits Liability (3,318,150.00)Compensated Absences 5,120.09Deferred Inflows Related to Pensions 13,286.00Deferred Inflows Related to Other Postemployment Benefits 3,320,533.00
Net Cash Used by Operating Activities $ (8,966,995.89)
RECONCILIATION OF CASH AND CASH EQUIVALENTSCurrent Assets:
Cash and Cash Equivalents $ 613,266.58Restricted Cash and Cash Equivalents 368,219.38
Noncurrent Assets:Restricted Cash and Cash Equivalents 38,377.65
Total Cash and Cash Equivalents - June 30, 2018 $ 1,019,863.61
NONCASH INVESTING, CAPITAL, AND FINANCING ACTIVITIESAssets Acquired through Assumption of a Liability $ 23,023.80
The accompanying notes to the financial statements are an integral part of this statement.
12

NOTES TO THE
FINANCIAL STATEMENTS

13
NOTES TO THE FINANCIAL STATEMENTS
NOTE 1 - SIGNIFICANT ACCOUNTING POLICIES
A. Financial Reporting Entity - The concept underlying the definition of the financial reporting entity is that elected officials are accountable to their constituents for their actions. As required by accounting principles generally accepted in the United States of America (GAAP), the financial reporting entity includes both the primary government and all of its component units. An organization other than a primary government serves as a nucleus for a reporting entity when it issues separate financial statements. Roanoke-Chowan Community College (College) is a component unit of the State of North Carolina and an integral part of the State’s Comprehensive Annual Financial Report.
The accompanying financial statements present all funds of the College and its component unit for which the College’s Board of Trustees is financially accountable. The College’s component unit is blended in the College’s financial statements. See below for further discussion of the College’s component unit. Other related foundations and similar nonprofit corporations for which the College is not financially accountable are not part of the accompanying financial statements.
Blended Component Unit - Although legally separate, Roanoke-Chowan Community College Foundation, Inc. is reported as if it was part of the College. The Foundation is governed by a 13 member board consisting of one ex officio director and 12 elected directors. The Foundation’s purpose is to aid, support, and promote teaching, research, and service in the various educational, scientific, scholarly, professional, artistic, and creative endeavors of the College. Because the elected directors of the Foundation are appointed by the members of the Roanoke-Chowan Community College Board of Trustees and the Foundation’s sole purpose is to benefit Roanoke-Chowan Community College, its financial statements have been blended with those of the College.
Separate financial statements for the Foundation may be obtained from the College Controller’s Office, 109 Community College Road, Ahoskie, NC 27910, or by calling 252-862-1316.
Condensed combining information regarding the blended component unit is provided in Note 15.
B. Basis of Presentation - The accompanying financial statements are presented in accordance with accounting principles generally accepted in the United States of America as prescribed by the GASB.
Pursuant to the provisions of GASB Statement No. 34, Basic Financial Statements - and Management’s Discussion and Analysis - for State and Local Governments, as amended by GASB Statement No. 35, Basic Financial Statements - and Management’s Discussion and Analysis - for Public Colleges and Universities, the full scope of the College’s activities is considered to be a single business-type activity and accordingly, is reported within a single column in the basic financial statements.
14
NOTES TO THE FINANCIAL STATEMENTS
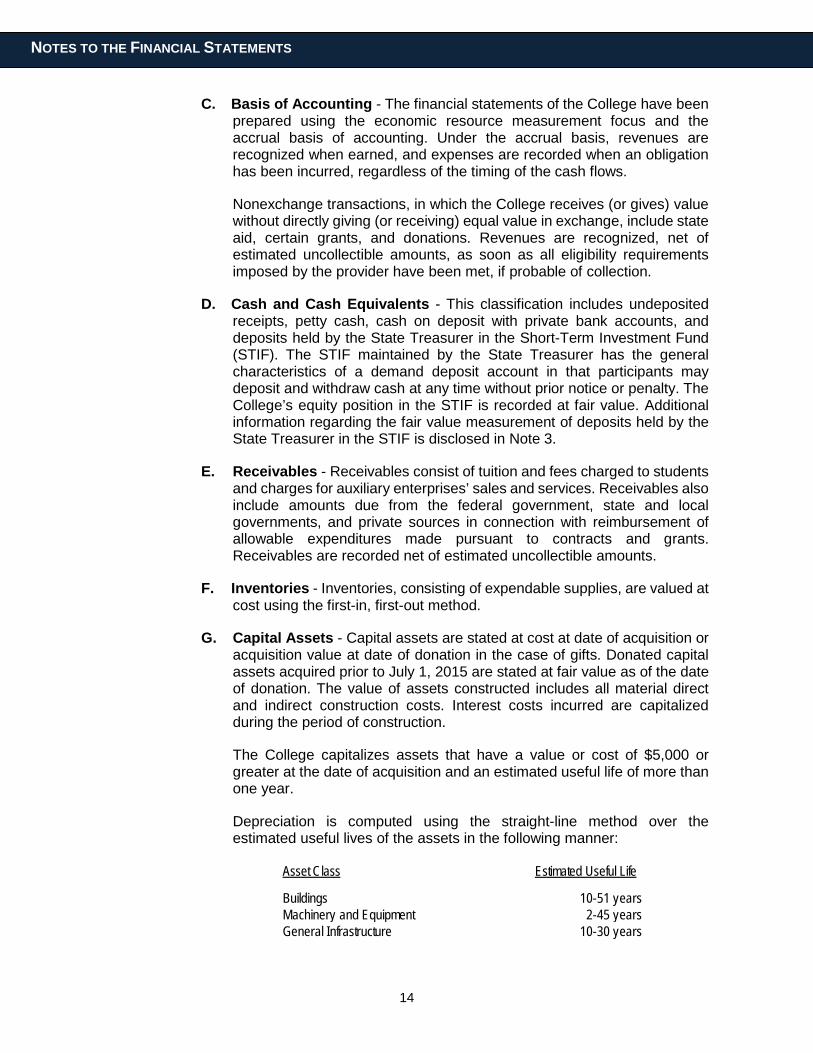
C. Basis of Accounting - The financial statements of the College have been prepared using the economic resource measurement focus and the accrual basis of accounting. Under the accrual basis, revenues are recognized when earned, and expenses are recorded when an obligation has been incurred, regardless of the timing of the cash flows.
Nonexchange transactions, in which the College receives (or gives) value without directly giving (or receiving) equal value in exchange, include state aid, certain grants, and donations. Revenues are recognized, net of estimated uncollectible amounts, as soon as all eligibility requirements imposed by the provider have been met, if probable of collection.
D. Cash and Cash Equivalents - This classification includes undeposited receipts, petty cash, cash on deposit with private bank accounts, and deposits held by the State Treasurer in the Short-Term Investment Fund (STIF). The STIF maintained by the State Treasurer has the general characteristics of a demand deposit account in that participants may deposit and withdraw cash at any time without prior notice or penalty. The College’s equity position in the STIF is recorded at fair value. Additional information regarding the fair value measurement of deposits held by the State Treasurer in the STIF is disclosed in Note 3.
E. Receivables - Receivables consist of tuition and fees charged to students and charges for auxiliary enterprises’ sales and services. Receivables also include amounts due from the federal government, state and local governments, and private sources in connection with reimbursement of allowable expenditures made pursuant to contracts and grants. Receivables are recorded net of estimated uncollectible amounts.
F. Inventories - Inventories, consisting of expendable supplies, are valued at cost using the first-in, first-out method.
G. Capital Assets - Capital assets are stated at cost at date of acquisition or acquisition value at date of donation in the case of gifts. Donated capital assets acquired prior to July 1, 2015 are stated at fair value as of the date of donation. The value of assets constructed includes all material direct and indirect construction costs. Interest costs incurred are capitalized during the period of construction.
The College capitalizes assets that have a value or cost of $5,000 or greater at the date of acquisition and an estimated useful life of more than one year.
Depreciation is computed using the straight-line method over the estimated useful lives of the assets in the following manner:
Asset Class Estimated Useful Life
Buildings 10-51 yearsMachinery and Equipment 2-45 yearsGeneral Infrastructure 10-30 years

15
NOTES TO THE FINANCIAL STATEMENTS
H. Restricted Assets - Certain resources are reported as restricted assets because restrictions on asset use change the nature or normal understanding of the availability of the asset. Resources that are not available for current operations and are reported as restricted include resources restricted for the acquisition or construction of capital assets and resources whose use is limited by external parties or statute.
I. Noncurrent Long-Term Liabilities - Noncurrent long-term liabilities include compensated absences, net pension liability, and net other postemployment benefits (OPEB) liability that will not be paid within the next fiscal year.
The net pension liability represents the College’s proportionate share of the collective net pension liability reported in the State of North Carolina’s 2017 Comprehensive Annual Financial Report. This liability represents the College’s portion of the collective total pension liability less the fiduciary net position of the Teachers’ and State Employees’ Retirement System. See Note 12 for further information regarding the College’s policies for recognizing liabilities, expenses, deferred outflows of resources, and deferred inflows of resources related to pensions.
The net OPEB liability represents the College’s proportionate share of the collective net OPEB liability reported in the State of North Carolina’s 2017 Comprehensive Annual Financial Report. This liability represents the College’s portion of the collective total OPEB liability less the fiduciary net position of the Retiree Health Benefit Fund. See Note 13 for further information regarding the College’s policies for recognizing liabilities, expenses, deferred outflows of resources, and deferred inflows of resources related to OPEB.
J. Compensated Absences - The College’s policy is to record the cost of vacation leave when earned. The policy provides for a maximum accumulation of unused vacation leave of 30 days which can be carried forward each January 1 or for which an employee can be paid upon termination of employment. When classifying compensated absences into current and noncurrent, leave is considered taken using a last-in, first-out (LIFO) method. Also, any accumulated vacation leave in excess of 30 days at year-end is converted to sick leave. Under this policy, the accumulated vacation leave for each employee at June 30 equals the leave carried forward at the previous December 31 plus the leave earned, less the leave taken between January 1 and June 30.
In addition to the vacation leave described above, compensated absences include the accumulated unused portion of the special annual leave bonuses awarded by the North Carolina General Assembly. The bonus leave balance on December 31 is retained by employees and transferred into the next calendar year. It is not subject to the limitation on annual leave carried forward described above and is not subject to conversion to sick leave.
16
NOTES TO THE FINANCIAL STATEMENTS
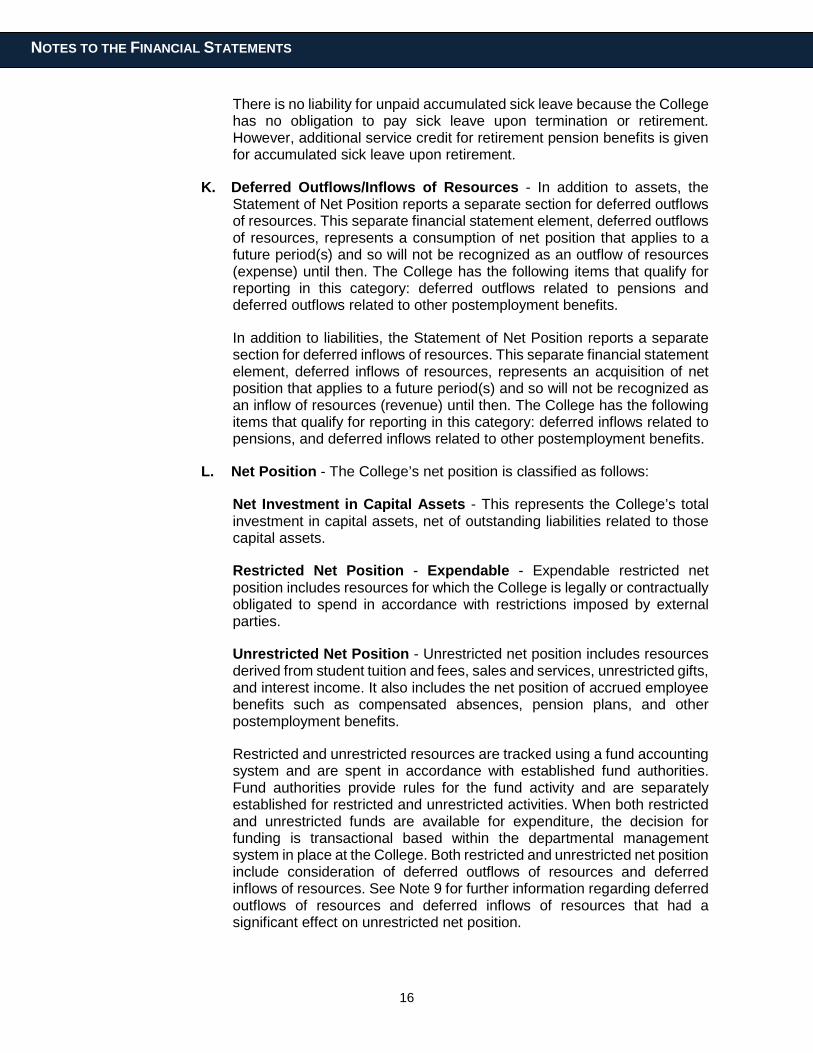
There is no liability for unpaid accumulated sick leave because the College has no obligation to pay sick leave upon termination or retirement. However, additional service credit for retirement pension benefits is given for accumulated sick leave upon retirement.
K. Deferred Outflows/Inflows of Resources - In addition to assets, the Statement of Net Position reports a separate section for deferred outflows of resources. This separate financial statement element, deferred outflows of resources, represents a consumption of net position that applies to a future period(s) and so will not be recognized as an outflow of resources (expense) until then. The College has the following items that qualify for reporting in this category: deferred outflows related to pensions and deferred outflows related to other postemployment benefits.
In addition to liabilities, the Statement of Net Position reports a separate section for deferred inflows of resources. This separate financial statement element, deferred inflows of resources, represents an acquisition of net position that applies to a future period(s) and so will not be recognized as an inflow of resources (revenue) until then. The College has the following items that qualify for reporting in this category: deferred inflows related to pensions, and deferred inflows related to other postemployment benefits.
L. Net Position - The College’s net position is classified as follows:
Net Investment in Capital Assets - This represents the College’s total investment in capital assets, net of outstanding liabilities related to those capital assets.
Restricted Net Position - Expendable - Expendable restricted net position includes resources for which the College is legally or contractually obligated to spend in accordance with restrictions imposed by external parties.
Unrestricted Net Position - Unrestricted net position includes resources derived from student tuition and fees, sales and services, unrestricted gifts, and interest income. It also includes the net position of accrued employee benefits such as compensated absences, pension plans, and other postemployment benefits.
Restricted and unrestricted resources are tracked using a fund accounting system and are spent in accordance with established fund authorities. Fund authorities provide rules for the fund activity and are separately established for restricted and unrestricted activities. When both restricted and unrestricted funds are available for expenditure, the decision for funding is transactional based within the departmental management system in place at the College. Both restricted and unrestricted net position include consideration of deferred outflows of resources and deferred inflows of resources. See Note 9 for further information regarding deferred outflows of resources and deferred inflows of resources that had a significant effect on unrestricted net position.
17
NOTES TO THE FINANCIAL STATEMENTS
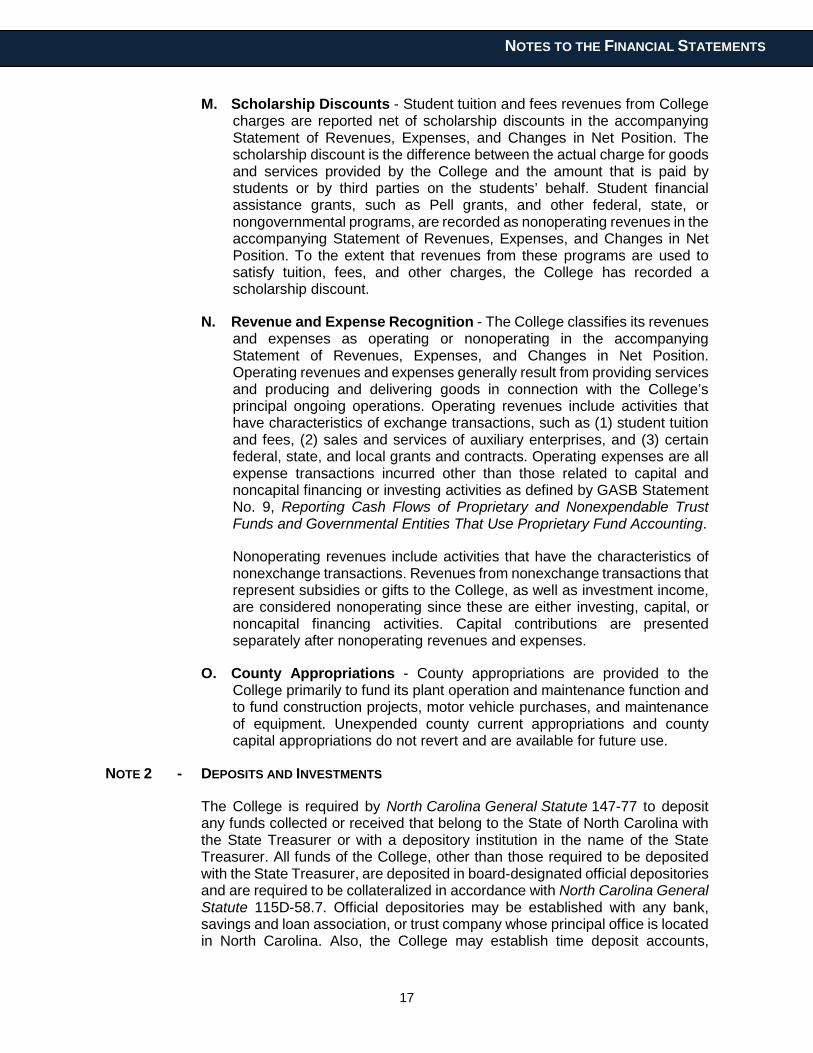
M. Scholarship Discounts - Student tuition and fees revenues from College charges are reported net of scholarship discounts in the accompanying Statement of Revenues, Expenses, and Changes in Net Position. The scholarship discount is the difference between the actual charge for goods and services provided by the College and the amount that is paid by students or by third parties on the students’ behalf. Student financial assistance grants, such as Pell grants, and other federal, state, or nongovernmental programs, are recorded as nonoperating revenues in the accompanying Statement of Revenues, Expenses, and Changes in Net Position. To the extent that revenues from these programs are used to satisfy tuition, fees, and other charges, the College has recorded a scholarship discount.
N. Revenue and Expense Recognition - The College classifies its revenues and expenses as operating or nonoperating in the accompanying Statement of Revenues, Expenses, and Changes in Net Position. Operating revenues and expenses generally result from providing services and producing and delivering goods in connection with the College’s principal ongoing operations. Operating revenues include activities that have characteristics of exchange transactions, such as (1) student tuition and fees, (2) sales and services of auxiliary enterprises, and (3) certain federal, state, and local grants and contracts. Operating expenses are all expense transactions incurred other than those related to capital and noncapital financing or investing activities as defined by GASB Statement No. 9, Reporting Cash Flows of Proprietary and Nonexpendable Trust Funds and Governmental Entities That Use Proprietary Fund Accounting.
Nonoperating revenues include activities that have the characteristics of nonexchange transactions. Revenues from nonexchange transactions that represent subsidies or gifts to the College, as well as investment income, are considered nonoperating since these are either investing, capital, or noncapital financing activities. Capital contributions are presented separately after nonoperating revenues and expenses.
O. County Appropriations - County appropriations are provided to the College primarily to fund its plant operation and maintenance function and to fund construction projects, motor vehicle purchases, and maintenance of equipment. Unexpended county current appropriations and county capital appropriations do not revert and are available for future use.
NOTE 2 - DEPOSITS AND INVESTMENTS
The College is required by North Carolina General Statute 147-77 to deposit any funds collected or received that belong to the State of North Carolina with the State Treasurer or with a depository institution in the name of the State Treasurer. All funds of the College, other than those required to be deposited with the State Treasurer, are deposited in board-designated official depositories and are required to be collateralized in accordance with North Carolina General Statute 115D-58.7. Official depositories may be established with any bank, savings and loan association, or trust company whose principal office is located in North Carolina. Also, the College may establish time deposit accounts,

18
NOTES TO THE FINANCIAL STATEMENTS
money market accounts, and certificates of deposit. The amount shown on the Statement of Net Position as cash and cash equivalents includes cash on hand totaling $720.00, and deposits in private financial institutions with a carrying value of $866,958.22 and a bank balance of $1,073,873.54.
The North Carolina Administrative Code (20 NCAC 7) requires all depositories to collateralize public deposits in excess of federal depository insurance coverage by using one of two methods, dedicated or pooled. Under the dedicated method, a separate escrow account is established by each depository in the name of each local governmental unit and the responsibility of monitoring collateralization rests with the local unit. Under the pooling method, each depository establishes an escrow account in the name of the State Treasurer to secure all of its public deposits. This method shifts the monitoring responsibility from the local unit to the State Treasurer.
Custodial credit risk is the risk that in the event of a bank failure, the College’s deposits may not be returned to it. As of June 30, 2018, the College’s bank balance in excess of federal depository insurance coverage was covered under the pooling method.
The College is authorized to invest idle funds as provided by G.S. 115D-58.6. In accordance with this statute, the College and the Board of Trustees manage investments to ensure they can be converted into cash when needed.
Generally, funds belonging to the College may be invested in any form of investment established or managed by certain investment advisors pursuant to G.S. 115D-58.6(d1) or in the form of investments pursuant to G.S. 159-30(c), as follows: a commingled investment pool established and administered by the State Treasurer pursuant to G.S. 147-69.3 (STIF); obligations of or fully guaranteed by the United States; obligations of the State of North Carolina; bonds and notes of any North Carolina local government or public authority; obligations of certain nonguaranteed federal agencies; prime quality commercial paper bearing specified ratings; specified bills of exchange; certain savings certificates; The North Carolina Capital Management Trust, an SEC registered mutual fund; repurchase agreements; and evidences of ownership of, or fractional undivided interests in, future interest and principal payments on either direct obligations of or fully guaranteed by the United States government, which are held by a specified bank or trust company or any state in the capacity of custodian.
At June 30, 2018, the amount shown on the Statement of Net Position as cash and cash equivalents includes $152,185.39, which represents the College’s equity position in the State Treasurer’s Short-Term Investment Fund (STIF). The STIF (a portfolio within the State Treasurer’s Investment Pool, an external investment pool that is not registered with the Securities and Exchange Commission or subject to any other regulatory oversight and does not have a credit rating) had a weighted average maturity of 1.4 years as of June 30, 2018. Assets and shares of the STIF are valued at fair value. Deposit and investment risks associated with the State Treasurer’s Investment Pool (which includes the State Treasurer’s STIF) are included in the North Carolina Department of State Treasurer Investment Programs’ separately issued audit report. This separately

19
NOTES TO THE FINANCIAL STATEMENTS
issued report can be obtained from the Department of State Treasurer, 3200 Atlantic Avenue, Raleigh, NC 27604 or can be accessed from the Department of State Treasurer’s website at https://www.nctreasurer.com/ in the Audited Financial Statements section.
NOTE 3 - FAIR VALUE MEASUREMENTS
To the extent available, the College’s investments are recorded at fair value as of June 30, 2018. GASB Statement No. 72, Fair Value Measurement and Application, defines fair value as the price that would be received to sell an asset or paid to transfer a liability in an orderly transaction between market participants at the measurement date. This statement establishes a hierarchy of valuation inputs based on the extent to which the inputs are observable in the marketplace. Inputs are used in applying the various valuation techniques and take into account the assumptions that market participants use to make valuation decisions. Inputs may include price information, credit data, interest and yield curve data, and other factors specific to the financial instrument. Observable inputs reflect market data obtained from independent sources. In contrast, unobservable inputs reflect the entity’s assumptions about how market participants would value the financial instrument. Valuation techniques should maximize the use of observable inputs to the extent available.
A financial instrument’s level within the fair value hierarchy is based on the lowest level of any input that is significant to the fair value measurement. The following describes the hierarchy of inputs used to measure fair value and the primary valuation methodologies used for financial instruments measured at fair value on a recurring basis:
Level 1 Investments whose values are based on quoted prices (unadjusted) for identical assets in active markets that a government can access at the measurement date.
Level 2 Investments with inputs – other than quoted prices included within Level 1 – that are observable for an asset, either directly or indirectly.
Level 3 Investments classified as Level 3 have unobservable inputs and may require a degree of professional judgment.
Short-Term Investment Fund - At year-end, all of the College’s investments valued at $152,185.39 were held in the STIF. Ownership interest of the STIF is determined on a fair market valuation basis as of fiscal year end in accordance with the STIF operating procedures. Valuation of the underlying assets is performed by the custodian. Pool investments are measured at fair value in accordance with GASB 72. The College’s position in the pool is measured and reported at fair value and the STIF is not required to be categorized within the fair value hierarchy.

20
NOTES TO THE FINANCIAL STATEMENTS
NOTE 4 - RECEIVABLES
Receivables at June 30, 2018, were as follows:
LessAllowance
Gross for Doubtful NetReceivables Accounts Receivables
Current Receivables:Students $ 478,230.74 $ 429,506.99 $ 48,723.75Student Sponsors 129,789.28 7,074.76 122,714.52Accounts 2,964.42 2,964.42Intergovernmental 62,677.09 62,677.09
Total Current Receivables $ 673,661.53 $ 436,581.75 $ 237,079.78
Notes Receivable:Notes Receivable - Current:
Institutional Student Loan Programs $ 14,950.78 $ 13,283.72 $ 1,667.06
NOTE 5 - CAPITAL ASSETS
A summary of changes in the capital assets for the year ended June 30, 2018, is presented as follows:
Balance BalanceJuly 1, 2017 Increases Decreases June 30, 2018
Capital Assets, Nondepreciable:Land $ 34,805.00 $ 0.00 $ 0.00 $ 34,805.00Construction in Progress 23,023.80 23,023.80
Total Capital Assets, Nondepreciable 34,805.00 23,023.80 57,828.80
Capital Assets, Depreciable:Buildings 11,694,720.15 11,694,720.15Machinery and Equipment 1,624,148.82 13,600.00 1,637,748.82General Infrastructure 242,311.00 242,311.00
Total Capital Assets, Depreciable 13,561,179.97 13,600.00 13,574,779.97
Less Accumulated Depreciation for:Buildings 6,537,744.24 278,732.52 6,816,476.76Machinery and Equipment 831,615.87 93,669.80 925,285.67General Infrastructure 207,887.80 10,777.20 218,665.00
Total Accumulated Depreciation 7,577,247.91 383,179.52 7,960,427.43
Total Capital Assets, Depreciable, Net 5,983,932.06 (369,579.52) 5,614,352.54
Capital Assets, Net $ 6,018,737.06 $ (346,555.72) $ 0.00 $ 5,672,181.34

21
NOTES TO THE FINANCIAL STATEMENTS
NOTE 6 - ACCOUNTS PAYABLE AND ACCRUED LIABILITIES
Accounts payable and accrued liabilities at June 30, 2018, were as follows:
Amount
Current Accounts Payable and Accrued Liabilities:Accounts Payable $ 52,335.57Accounts Payable - Capital Assets 23,023.80Accrued Payroll 431,451.75
Total Current Accounts Payable and Accrued Liabilities $ 506,811.12
NOTE 7 - LONG-TERM LIABILITIES
A summary of changes in the long-term liabilities for the year ended June 30, 2018, is presented as follows:
Compensated Absences $ 238,614.58 $ 226,943.03 $ 221,822.94 $ 243,734.67 $ 53,451.02Net Pension Liability 2,542,240.00 544,348.00 1,997,892.00Net Other Postemployment Benefits Liability 10,771,442.00 3,318,150.00 7,453,292.00
Total Long-Term Liabilities $ 13,552,296.58 $ 226,943.03 $ 4,084,320.94 $ 9,694,918.67 $ 53,451.02
Additional information regarding the net pension liability is included in Note 12.Additional information regarding the net other postemployment benefits liability is included in Note 13.
BalanceCurrentPortion
July 1, 2017(as Restated) Additions Reductions June 30, 2018
Balance
NOTE 8 - OPERATING LEASE OBLIGATIONS
The College entered into operating leases for copiers. Future minimum lease payments under noncancelable operating leases consist of the following at June 30, 2018:
Fiscal Year Amount
2019 $ 65,119.562020 54,266.30
Total Minimum Lease Payments $ 119,385.86
Rental expense for all operating leases during the year was $65,119.56.

22
NOTES TO THE FINANCIAL STATEMENTS
NOTE 9 - NET POSITION
The deficit in unrestricted net position of $11,446,369.78 has been significantly affected by transactions that resulted in the recognition of deferred outflows of resources and deferred inflows of resources. A summary of the balances reported within unrestricted net position relating to the reporting of net pension liability and net other postemployment benefits (OPEB) liability, and the related deferred outflows of resources and deferred inflows of resources is presented as follows:
Deferred Outflows Related to Pensions $ 1,058,390.00 $ 0.00 $ 1,058,390.00Deferred Outflows Related to OPEB* 221,098.00 221,098.00
Noncurrent Liabilities:Long-Term Liabilities:
Net Pension Liability 1,997,892.00 1,997,892.00Net OPEB Liability 7,453,292.00 7,453,292.00
Deferred Inflows Related to Pensions 157,799.00 157,799.00Deferred Inflows Related to OPEB 3,320,533.00 3,320,533.00
Net Effect on Unrestricted Net Position $ (1,097,301.00) $ (10,552,727.00) $ (11,650,028.00)
TSERS Benefit Fund TotalRetiree Health
See Notes 12 and 13 for detailed information regarding the amortization of the deferred outflows of resources and deferred inflows of resources relating to pensions and OPEB, respectively.
NOTE 10 - REVENUES
A summary of eliminations and allowances by revenue classification is presented as follows:
Less LessGross Scholarship Allowance for Net
Revenues Discounts Uncollectibles Revenues
Operating Revenues:Student Tuition and Fees, Net $ 1,032,070.98 $ 657,993.91 $ 30,343.83 $ 343,733.24

23
NOTES TO THE FINANCIAL STATEMENTS
NOTE 11 - OPERATING EXPENSES BY FUNCTION
The College’s operating expenses by functional classification are presented as follows:
Salaries Supplies Scholarshipsand and and
Benefits Materials Services Fellowships Utilities Depreciation Total
Instruction $ 3,004,160.33 $ 174,917.89 $ 64,925.02 $ 0.00 $ 0.00 $ 0.00 $ 3,244,003.24Academic Support 788,995.06 38,581.55 21,163.17 848,739.78Student Services 334,915.98 66,738.12 14,128.90 7,869.17 423,652.17Institutional Support 1,603,666.86 222,129.34 622,246.28 7,688.75 2,455,731.23Operations and Maintenance of Plant 381,221.07 379,990.01 148,975.11 225,274.76 1,135,460.95Student Financial Aid 425,494.30 47,065.20 23,904.11 1,006,755.87 1,503,219.48Auxiliary Enterprises 1,051.34 1,051.34Depreciation 383,179.52 383,179.52
Total Operating Expenses $ 6,538,453.60 $ 930,473.45 $ 895,342.59 $ 1,022,313.79 $ 225,274.76 $ 383,179.52 $ 9,995,037.71
NOTE 12 - PENSION PLANS
Defined Benefit Plan Plan Administration: The State of North Carolina administers the Teachers’ and State Employees’ Retirement System (TSERS) plan. This plan is a cost-sharing, multiple-employer, defined benefit pension plan established by the State to provide pension benefits for general employees and law enforcement officers (LEOs) of the State, general employees and LEOs of its component units, and employees of Local Education Agencies (LEAs) and charter schools not in the reporting entity. Membership is comprised of employees of the State (state agencies and institutions), universities, community colleges, and certain proprietary component units along with the LEAs and charter schools that elect to join the Retirement System. Benefit provisions are established by General Statute 135-5 and may be amended only by the North Carolina General Assembly.
Benefits Provided: TSERS provides retirement and survivor benefits. Retirement benefits are determined as 1.82% of the member’s average final compensation times the member’s years of creditable service. A member’s average final compensation is calculated as the average of a member’s four highest consecutive years of compensation. General employee plan members are eligible to retire with full retirement benefits at age 65 with five years of creditable service, at age 60 with 25 years of creditable service, or at any age with 30 years of creditable service. General employee plan members are eligible to retire with partial retirement benefits at age 50 with 20 years of creditable service or at age 60 with five years of creditable service. Survivor benefits are available to eligible beneficiaries of general members who die while in active service or within 180 days of their last day of service and who also have either completed 20 years of creditable service regardless of age, or have completed five years of service and have reached age 60. Eligible beneficiaries may elect to receive a monthly Survivor’s Alternate Benefit for life or a return of the member’s contributions. The plan does not provide for automatic

24
NOTES TO THE FINANCIAL STATEMENTS
post-retirement benefit increases. Increases are contingent upon actuarial gains of the plan.
Contributions: Contribution provisions are established by General Statute 135-8 and may be amended only by the North Carolina General Assembly. Employees are required to contribute 6% of their annual pay. The contribution rate for employers is set each year by the North Carolina General Assembly in the Appropriations Act based on the actuarially-determined rate recommended by the actuary. The College’s contractually-required contribution rate for the year ended June 30, 2018 was 10.78% of covered payroll. Employee contributions to the pension plan were $219,270.29, and the College’s contributions were $393,955.62 for the year ended June 30, 2018.
The TSERS plan’s financial information, including all information about the plan’s assets, deferred outflows of resources, liabilities, deferred inflows of resources, and fiduciary net position, is included in the State of North Carolina’s fiscal year 2017 Comprehensive Annual Financial Report. An electronic version of this report is available on the North Carolina Office of the State Controller’s website at https://www.osc.nc.gov/ or by calling the State Controller’s Financial Reporting Section at (919) 707-0500.
TSERS Basis of Accounting: The financial statements of the TSERS plan were prepared using the accrual basis of accounting. Plan member contributions are recognized in the period in which the contributions are due. Employer contributions are recognized when due and the employer has a legal requirement to provide the contributions. Benefits and refunds are recognized when due and payable in accordance with the terms of each plan. The plan’s fiduciary net position was determined on the same basis used by the pension plan.
Methods Used to Value TSERS Investment: Pursuant to North Carolina General Statutes, the State Treasurer is the custodian and administrator of the retirement systems. The State Treasurer maintains various investment portfolios in its External Investment Pool. TSERS and other pension plans of the State of North Carolina are the sole participants in the Long-Term Investment, Fixed Income Investment, Equity Investment, Real Estate Investment, Alternative Investment, Opportunistic Fixed Income Investment, and Inflation Sensitive Investment Portfolios. The Fixed Income Asset Class includes the Long-Term Investment and Fixed Income Investment Portfolios. The Global Equity Asset Class includes the Equity Investment Portfolio. The investment balance of each pension trust fund represents its share of the fair market value of the net position of the various portfolios within the External Investment Pool. Detailed descriptions of the methods and significant assumptions regarding investments of the State Treasurer are provided in the 2017 Comprehensive Annual Financial Report.
Net Pension Liability: At June 30, 2018, the College reported a liability of $1,997,892.00 for its proportionate share of the collective net pension liability. The net pension liability was measured as of June 30, 2017. The total pension liability used to calculate the net pension liability was determined by an actuarial valuation as of December 31, 2016, and update procedures were used to roll

25
NOTES TO THE FINANCIAL STATEMENTS
forward the total pension liability to June 30, 2017. The College’s proportion of the net pension liability was based on the present value of future salaries for the College relative to the present value of future salaries for all participating employers, actuarially-determined. As of June 30, 2017, the College’s proportion was 0.02518%, which was an decrease of 0.00248 from its proportion measured as of June 30, 2016, which was 0.02766%.
Actuarial Assumptions: The following table presents the actuarial assumptions used to determine the total pension liability for the TSERS plan at the actuarial valuation date:
Valuation Date 12/31/2016Inflation 3%Salary Increases* 3.50% - 8.10%Investment Rate of Return** 7.20%
* Salary increases include 3.5% inflation and productivity factor.** Investment rate of return includes inflation assumption and is of pension plan investment expense.
TSERS currently uses mortality tables that vary by age, gender, employee group (i.e. teacher, general, law enforcement officer) and health status (i.e. disabled and healthy). The current mortality rates are based on published tables and based on studies that cover significant portions of the U.S. population. The mortality rates also contain a provision to reflect future mortality improvements.
The actuarial assumptions used in the December 31, 2016 valuations were based on the results of an actuarial experience review for the period January 1, 2010 through December 31, 2014.
Future ad hoc Cost of Living Adjustment amounts are not considered to be substantively automatic and are therefore not included in the measurement.
The projected long-term investment returns and inflation assumptions are developed through review of current and historical capital markets data, sell-side investment research, consultant whitepapers, and historical performance of investment strategies. Fixed income return projections reflect current yields across the U.S. Treasury yield curve and market expectations of forward yields projected and interpolated for multiple tenors and over multiple year horizons. Global public equity return projections are established through analysis of the equity risk premium and the fixed income return projections. Other asset categories and strategies’ return projections reflect the foregoing and historical data analysis. These projections are combined to produce the long-term expected rate of return by weighting the expected future real rates of return by the target asset allocation percentage and by adding expected inflation. Best estimates of arithmetic real rates of return for each major asset class included in the pension plan’s target asset allocation as of June 30, 2017 (the valuation date) are summarized in the following table:

26
NOTES TO THE FINANCIAL STATEMENTS
Asset ClassLong-Term Expected Real Rate of Return
Fixed Income 1.4%Global Equity 5.3%Real Estate 4.3%Alternatives 8.9%Opportunistic Fixed Income 6.0%Inflation Sensitive 4.0%
The information in the preceding table is based on 30-year expectations developed with the consulting actuary and is part of the asset, liability, and investment policy of the North Carolina Retirement Systems. The long-term nominal rates of return underlying the real rates of return are arithmetic annualized figures. The real rates of return are calculated from nominal rates by multiplicatively subtracting a long-term inflation assumption of 3.05%. Return projections do not include any excess return expectations over benchmark averages. All rates of return and inflation are annualized. The long-term expected real rate of return for the Bond Index Investment Pool as of June 30, 2017 is 1.3%.
Discount Rate: The discount rate used to measure the total pension liability was lowered from 7.25% to 7.20% for the December 31, 2016 valuation. This discount rate is in line with the long-term nominal expected return on pension plan investments. The calculation of the net pension liability is a present value calculation of the future net pension payments. These net pension payments assume that contributions from plan members will be made at the current statutory contribution rate and that contributions from employers will be made at the contractually required rates, actuarially determined. Based on those assumptions, the pension plan’s fiduciary net position was projected to be available to make all projected future benefit payments of the current plan members. Therefore, the long-term expected rate of return on pension plan investments was applied to all periods of projected benefit payments to determine the total pension liability.
Sensitivity of the Net Pension Liability to Changes in the Discount Rate: The following presents the net pension liability of the plan at June 30, 2017 calculated using the discount rate of 7.20%, as well as what the net pension liability would be if it were calculated using a discount rate that is 1-percentage point lower (6.20%) or 1-percentage point higher (8.20%) than the current rate:
$ 4,112,489.00 $ 1,997,892.00 $ 226,129.00
Net Pension Liability1% Decrease (6.20%) Current Discount Rate (7.20%) 1% Increase (8.20%)
Deferred Outflows of Resources and Deferred Inflows of Resources Related to Pensions: For the year ended June 30, 2018, the College recognized pension expense of $521,413.00. At June 30, 2018, the College reported deferred

27
NOTES TO THE FINANCIAL STATEMENTS
outflows of resources and deferred inflows of resources related to pensions from the following sources:
Deferred Outflows Deferred Inflowsof Resources of Resources
Difference Between Actual and Expected Experience $ 43,311.00 $ 65,361.00
Changes of Assumptions 315,637.00
Net Difference Between Projected andActual Earnings on Plan Investments 270,383.38
Change in Proportion and DifferencesBetween Employer's Contributions andProportionate Share of Contributions 35,103.00 92,438.00
Contributions Subsequent to the Measurement Date 393,955.62
Total $ 1,058,390.00 $ 157,799.00
Employer Balances of Deferred Outflows of Resources and Deferred Inflows ofResources Related to Pensions by Classification:
The amount of $393,955.62 reported as deferred outflows of resources related to contributions subsequent to the measurement date will be included as a reduction of the net pension liability in the fiscal year ended June 30, 2019. Other amounts reported as deferred outflows of resources and deferred inflows of resources related to pensions will be recognized as pension expense as follows:
Year Ended June 30:
2019 $ 91,752.002020 360,341.002021 162,750.002022 (108,207.62)
Total $ 506,635.38
Amount
Schedule of the Net Amount of the Employer's Balances ofDeferred Outflows of Resources and Deferred Inflows ofResources That will be Recognized in Pension Expense:
28
NOTES TO THE FINANCIAL STATEMENTS
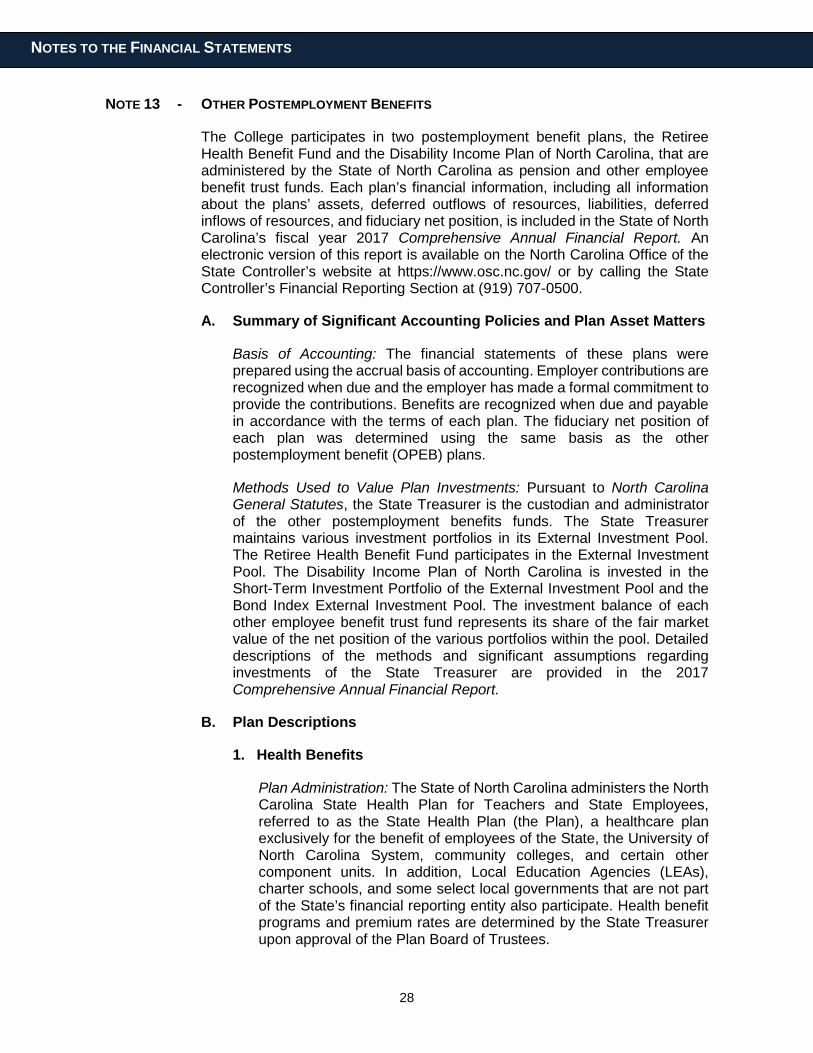
NOTE 13 - OTHER POSTEMPLOYMENT BENEFITS
The College participates in two postemployment benefit plans, the Retiree Health Benefit Fund and the Disability Income Plan of North Carolina, that are administered by the State of North Carolina as pension and other employee benefit trust funds. Each plan’s financial information, including all information about the plans’ assets, deferred outflows of resources, liabilities, deferred inflows of resources, and fiduciary net position, is included in the State of North Carolina’s fiscal year 2017 Comprehensive Annual Financial Report. An electronic version of this report is available on the North Carolina Office of the State Controller’s website at https://www.osc.nc.gov/ or by calling the State Controller’s Financial Reporting Section at (919) 707-0500.
A. Summary of Significant Accounting Policies and Plan Asset Matters
Basis of Accounting: The financial statements of these plans were prepared using the accrual basis of accounting. Employer contributions are recognized when due and the employer has made a formal commitment to provide the contributions. Benefits are recognized when due and payable in accordance with the terms of each plan. The fiduciary net position of each plan was determined using the same basis as the other postemployment benefit (OPEB) plans.
Methods Used to Value Plan Investments: Pursuant to North Carolina General Statutes, the State Treasurer is the custodian and administrator of the other postemployment benefits funds. The State Treasurer maintains various investment portfolios in its External Investment Pool. The Retiree Health Benefit Fund participates in the External Investment Pool. The Disability Income Plan of North Carolina is invested in the Short-Term Investment Portfolio of the External Investment Pool and the Bond Index External Investment Pool. The investment balance of each other employee benefit trust fund represents its share of the fair market value of the net position of the various portfolios within the pool. Detailed descriptions of the methods and significant assumptions regarding investments of the State Treasurer are provided in the 2017 Comprehensive Annual Financial Report.
B. Plan Descriptions
1. Health Benefits
Plan Administration: The State of North Carolina administers the North Carolina State Health Plan for Teachers and State Employees, referred to as the State Health Plan (the Plan), a healthcare plan exclusively for the benefit of employees of the State, the University of North Carolina System, community colleges, and certain other component units. In addition, Local Education Agencies (LEAs), charter schools, and some select local governments that are not part of the State’s financial reporting entity also participate. Health benefit programs and premium rates are determined by the State Treasurer upon approval of the Plan Board of Trustees.

29
NOTES TO THE FINANCIAL STATEMENTS
The Retiree Health Benefit Fund (RHBF) has been established as a fund to provide health benefits to retired and disabled employees and their applicable beneficiaries. RHBF is established by General Statute 135-7, Article 1. RHBF is a cost-sharing, multiple-employer, defined benefit healthcare plan, exclusively for the benefit of eligible former employees of the State, the University of North Carolina System, and community colleges. In addition, LEAs, charter schools, and some select local governments that are not part of the State’s financial reporting entity also participate.
By statute, RHBF is administered by the Board of Trustees of the Teachers’ and State Employees’ Retirement System (TSERS). RHBF is supported by a percent of payroll contribution from participating employing units. Each year the percentage is set in legislation, as are the maximum per retiree contributions from RHBF to the Plan. The State Treasurer, with the approval of the Plan Board of Trustees, then sets the employer contributions (subject to the legislative cap) and the premiums to be paid by retirees, as well as the health benefits to be provided through the Plan.
Benefits Provided: Plan benefits received by retired employees and disabled employees from RHBF are OPEB. The healthcare benefits for retired and disabled employees who are not eligible for Medicare are the same as for active employees as described in Note 14. The plan options change when former employees become eligible for Medicare. Medicare retirees have the option of selecting one of two fully-insured Medicare Advantage/Prescription Drug Plan options or the self-funded Traditional 70/30 Preferred Provider Organization plan option that is also offered to non-Medicare members. If the Traditional 70/30 Plan is selected by a Medicare retiree, the self-funded State Health Plan coverage is secondary to Medicare.
Those former employees who are eligible to receive medical benefits from RHBF are long-term disability beneficiaries of the Disability Income Plan of North Carolina and retirees of TSERS, the Consolidated Judicial Retirement System, the Legislative Retirement System, the University Employees’ Optional Retirement Program (ORP), and a small number of local governments, with five or more years of contributory membership service in their retirement system prior to disability or retirement, with the following exceptions: for employees first hired on or after October 1, 2006, and members of the General Assembly first taking office on or after February 1, 2007, future coverage as retired employees and retired members of the General Assembly is subject to the requirement that the future retiree have 20 or more years of retirement service credit in order to receive coverage on a noncontributory basis. Employees first hired on or after October 1, 2006 and members of the General Assembly first taking office on or after February 1, 2007 with 10 but less than 20 years of retirement service credit are eligible for coverage on a partially contributory basis. For such future retirees, the State will pay 50% of the State Health Plan’s total noncontributory premium.

30
NOTES TO THE FINANCIAL STATEMENTS
The Plan’s and RHBF’s benefit and contribution provisions are established by Chapter 135-7, Article 1, and Chapter 135, Article 3B of the General Statutes and may be amended only by the North Carolina General Assembly. RHBF does not provide for automatic post-retirement benefit increases.
Contributions: Contribution rates to RHBF, which are intended to finance benefits and administrative expenses on a pay-as-you-go basis, are determined by the General Assembly in the Appropriations Bill. The College’s contractually-required contribution rate for the year ended June 30, 2018 was 6.05% of covered payroll. The College’s contributions to the RHBF were $221,097.54 for the year ended June 30, 2018.
2. Disability Income
Plan Administration: As discussed in Note 14, short-term and long-term disability benefits are provided through the Disability Income Plan of North Carolina (DIPNC), a cost-sharing, multiple-employer, defined benefit plan, to the eligible members of TSERS which includes employees of the State, the University of North Carolina System, community colleges, certain participating component units, LEAs which are not part of the reporting entity, and the University Employees’ ORP. By statute, DIPNC is administered by the Department of State Treasurer and the Board of Trustees of TSERS.
Benefits Provided: Long-term disability benefits are payable as an OPEB from DIPNC after the conclusion of the short-term disability period or after salary continuation payments cease, whichever is later, for as long as an employee is disabled. An employee is eligible to receive long-term disability benefits provided the following requirements are met: (1) the employee has five or more years of contributing membership service in TSERS or the University Employees’ ORP, earned within 96 months prior to the end of the short-term disability period or cessation of salary continuation payments, whichever is later; (2) the employee must make application to receive long-term benefits within 180 days after the conclusion of the short-term disability period or after salary continuation payments cease or after monthly payments for Workers’ Compensation cease (excluding monthly payments for permanent partial benefits), whichever is later; (3) the employee must be certified by the Medical Board to be mentally or physically disabled for the further performance of his/her usual occupation; (4) the disability must have been continuous, likely to be permanent, and incurred at the time of active employment; (5) the employee must not be eligible to receive an unreduced retirement benefit from TSERS; and (6) the employee must terminate employment as a permanent, full-time employee. An employee is eligible to receive an unreduced retirement benefit from TSERS after (1) reaching the age of 65 and completing five years of membership service, or (2) reaching the age of 60 and completing 25

31
NOTES TO THE FINANCIAL STATEMENTS
years of creditable service, or (3) completing 30 years of creditable service, at any age.
For employees who had five or more years of membership service as of July 31, 2007, during the first 36 months of the long-term disability period, the monthly long-term disability benefit is equal to 65% of one-twelfth of an employee’s annual base rate of compensation last payable to the participant or beneficiary prior to the beginning of the short-term disability period, plus the like percentage of one-twelfth of the annual longevity payment and local supplements to which the participant or beneficiary would be eligible. The monthly benefits are subject to a maximum of $3,900 per month reduced by any primary Social Security disability benefits and by monthly payments for Workers’ Compensation to which the participant or beneficiary may be entitled, but the benefits payable shall be no less than $10 a month. After the first 36 months of the long-term disability, the long-term benefit is calculated in the same manner as described above except the monthly benefit is reduced by an amount equal to a monthly primary Social Security disability benefit to which the participant or beneficiary might be entitled had Social Security disability benefits been awarded. When an employee qualifies for an unreduced service retirement allowance from TSERS, the benefits payable from DIPNC will cease, and the employee will commence retirement under TSERS or the University Employees’ ORP.
For employees who had less than five years of membership service as of July 31, 2007, and meet the requirements for long-term disability on or after August 1, 2007, during the first 36 months of the long-term disability period, the monthly long-term benefit shall be reduced by an amount equal to the monthly primary Social Security retirement benefit to which the employee might be entitled should the employee become age 62 during the first 36 months. This reduction becomes effective as of the first day of the month following the month of initial entitlement to Social Security benefits. After the first 36 months of the long-term disability, no further benefits are payable under the terms of this section unless the employee has been approved and is in receipt of primary Social Security disability benefits.
Contributions: Although DIPNC operates on a calendar year, disability income benefits are funded by actuarially determined employer contributions that are established in the Appropriations Bill by the General Assembly and coincide with the State’s fiscal year. The College’s contractually-required contribution rate for the year ended June 30, 2018 was 0.14% of covered payroll. The College’s contributions to DIPNC were $5,116.31 for the year ended June 30, 2018.
C. Net OPEB Liability (Asset)
Net OPEB Liability: At June 30, 2018, the College reported a liability of $7,453,292.00 for its proportionate share of the collective net OPEB

32
NOTES TO THE FINANCIAL STATEMENTS
liability for RHBF. The net OPEB liability was measured as of June 30, 2017. The total OPEB liability used to calculate the net OPEB liability was determined by an actuarial valuation as of December 31, 2016, and update procedures were used to roll forward the total OPEB liability to June 30, 2017. The College’s proportion of the net OPEB liability was based on the present value of future salaries for the College relative to the present value of future salaries for all participating employers, actuarially-determined. As of June 30, 2017, the College’s proportion was 0.02273%, which was an decrease of 0.00203 from its proportion measured as of June 30, 2016, which was 0.02476%.
Net OPEB Asset: At June 30, 2018, the College reported an asset of $13,373.00 for its proportionate share of the collective net OPEB asset for DIPNC. The net OPEB asset was measured as of June 30, 2017. The total OPEB asset used to calculate the net OPEB asset was determined by an actuarial valuation as of December 31, 2016, and update procedures were used to roll forward the total OPEB asset to June 30, 2017. The College’s proportion of the net OPEB asset was based on the present value of future salaries for the College relative to the present value of future salaries for all participating employers, actuarially-determined. As of June 30, 2017, the College’s proportion was 0.02188%, which was a decrease of 0.00223 from its proportion measured as of June 30, 2016, which was 0.02411%.
Actuarial Assumptions: The total OPEB liabilities (assets) for RHBF and DIPNC were determined by actuarial valuations as of December 31, 2016, using the following actuarial assumptions, applied to all periods included in the measurement, unless otherwise specified. The total OPEB liabilities (assets) were then rolled forward to June 30, 2017 utilizing update procedures incorporating the actuarial assumptions.
Retiree DisabilityHealth Benefit Income Plan
Fund of N.C.
Valuation Date 12/31/2016 12/31/2016Inflation 2.75% 3.00%Salary Increases* 3.50% - 8.10% 3.50% - 8.10%Investment Rate of Return** 7.20% 3.75%Healthcare Cost Trend Rate - Medical 5.00% - 6.50% N/AHealthcare Cost Trend Rate - Prescription Drug 5.00% - 7.25% N/AHealthcare Cost Trend Rate - Medicare Advantage 4.00% - 5.00% N/AHealthcare Cost Trend Rate - Administrative 3.00% N/A
* Salary increases include 3.5% inflation and productivity factor.** Investment rate of return is net of pension plan investment expense, including inflation.N/A - Not Applicable

33
NOTES TO THE FINANCIAL STATEMENTS
The OPEB plans currently use mortality tables that vary by age, gender, employee group (i.e. teacher, general, law enforcement officer) and health status (i.e. disabled and healthy). The current mortality rates are based on published tables and studies that cover significant portions of the U.S. population. The healthy mortality rates also contain a provision to reflect future mortality improvements.
The projected long-term investment returns and inflation assumptions are developed through a review of current and historical capital markets data, sell-side investment research, consultant whitepapers, and historical performance of investment strategies. Fixed income return projections reflect current yields across the U.S. Treasury yield curve and market expectations of forward yields projected and interpolated for multiple tenors and over multiple year horizons. Global public equity return projects are established through analysis of the equity risk premium and the fixed income return projections. Other asset categories and strategies’ return projections reflect the foregoing and historical data analysis. These projections are combined to produce the long-term expected rate of return by weighting the expected future real rates of return by the target asset allocation percentage and by adding expected inflation. DIPNC is primarily invested in the Bond Index Investment Pool as of June 30, 2017.
Best estimates of real rates of return for each major asset class included in RHBF’s target asset allocation as of June 30, 2017 (the valuation date) are summarized in the following table:
Long-Term ExpectedAsset Class Real Rate of Return
Fixed Income 1.4%Global Equity 5.3%Real Estate 4.3%Alternatives 8.9%Opportunistic Fixed Income 6.0%Inflation Sensitive 4.0%
The information in the preceding table is based on 30-year expectations developed with the consulting actuary and is part of the asset, liability, and investment policy of the North Carolina Retirement Systems. The long-term nominal rates of return underlying the real rates of return are arithmetic annualized figures. The real rates of return are calculated from nominal rates by multiplicatively subtracting a long-term inflation assumption of 3.05%. Return projections do not include any excess return expectations over benchmark averages. All rates of return and inflation are annualized. The long-term expected real rate of return for the Bond Index Investment Pool as of June 30, 2017 is 1.3%.
Actuarial valuations of the plans involve estimates of the value of reported amounts and assumptions about the probability of occurrence of events
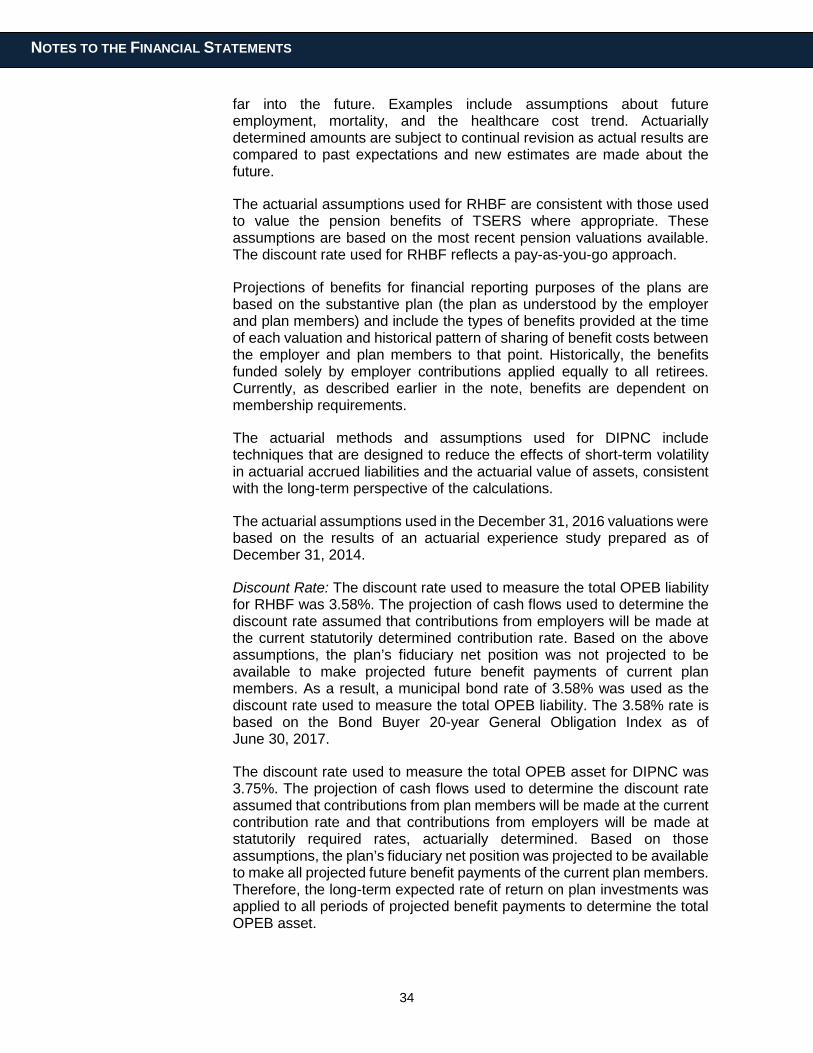
34
NOTES TO THE FINANCIAL STATEMENTS
far into the future. Examples include assumptions about future employment, mortality, and the healthcare cost trend. Actuarially determined amounts are subject to continual revision as actual results are compared to past expectations and new estimates are made about the future.
The actuarial assumptions used for RHBF are consistent with those used to value the pension benefits of TSERS where appropriate. These assumptions are based on the most recent pension valuations available. The discount rate used for RHBF reflects a pay-as-you-go approach.
Projections of benefits for financial reporting purposes of the plans are based on the substantive plan (the plan as understood by the employer and plan members) and include the types of benefits provided at the time of each valuation and historical pattern of sharing of benefit costs between the employer and plan members to that point. Historically, the benefits funded solely by employer contributions applied equally to all retirees. Currently, as described earlier in the note, benefits are dependent on membership requirements.
The actuarial methods and assumptions used for DIPNC include techniques that are designed to reduce the effects of short-term volatility in actuarial accrued liabilities and the actuarial value of assets, consistent with the long-term perspective of the calculations.
The actuarial assumptions used in the December 31, 2016 valuations were based on the results of an actuarial experience study prepared as of December 31, 2014.
Discount Rate: The discount rate used to measure the total OPEB liability for RHBF was 3.58%. The projection of cash flows used to determine the discount rate assumed that contributions from employers will be made at the current statutorily determined contribution rate. Based on the above assumptions, the plan’s fiduciary net position was not projected to be available to make projected future benefit payments of current plan members. As a result, a municipal bond rate of 3.58% was used as the discount rate used to measure the total OPEB liability. The 3.58% rate is based on the Bond Buyer 20-year General Obligation Index as of June 30, 2017.
The discount rate used to measure the total OPEB asset for DIPNC was 3.75%. The projection of cash flows used to determine the discount rate assumed that contributions from plan members will be made at the current contribution rate and that contributions from employers will be made at statutorily required rates, actuarially determined. Based on those assumptions, the plan’s fiduciary net position was projected to be available to make all projected future benefit payments of the current plan members. Therefore, the long-term expected rate of return on plan investments was applied to all periods of projected benefit payments to determine the total OPEB asset.

35
NOTES TO THE FINANCIAL STATEMENTS
Sensitivity of the Net OPEB Liability (Asset) to Changes in the Discount Rate: The following presents the College’s proportionate share of the net OPEB liability (asset) of the plans, as well as what the plans’ net OPEB liability (asset) would be if it were calculated using a discount rate that is 1-percentage point lower or 1-percentage point higher than the current discount rate:
RHBF $ 8,890,285.00 $ 7,453,292.00 $ 6,311,953.00
DIPNC $ (11,369.00) $ (13,373.00) $ (15,382.00)
Net OPEB Liability (Asset)
1% Decrease (2.75%) Current Discount Rate (3.75%) 1% Increase (4.75%)
1% Decrease (2.58%) Current Discount Rate (3.58%) 1% Increase (4.58%)
Sensitivity of the Net OPEB Liability (Asset) to Changes in the Healthcare Cost Trend Rates: The following presents the net OPEB liability (asset) of the plans, as well as what the plans’ net OPEB liability (asset) would be if it were calculated using healthcare cost trend rates that are 1-percentage point lower or 1-percentage point higher than the current healthcare cost trend rates:
Current Healthcare1% Decrease Cost Trend Rates 1% Increase
(Medical - 4.00 - 5.50%, (Medical - 5.00 - 6.50%, (Medical - 6.00 - 7.50%,Pharmacy - 4.00 - 6.25%, Pharmacy - 5.00 - 7.25%, Pharmacy - 6.00 - 8.25%,
Med. Advantage - 3.00 - 4.00%, Med. Advantage - 4.00 - 5.00%, Med. Advantage - 5.00 - 6.00%,Administrative - 2.00%) Administrative - 3.00%) Administrative - 4.00%)
RHBF Net OPEB Liability $ 6,087,924.00 $ 7,453,292.00 $ 9,265,962.00
DIPNC Net OPEB Asset N/A N/A N/A

36
NOTES TO THE FINANCIAL STATEMENTS
Deferred Outflows of Resources and Deferred Inflows of Resources Related to OPEB: For the year ended June 30, 2018, the College recognized OPEB expense of $223,374.00 for RHBF and $7,720.00 for DIPNC. At June 30, 2018, the College reported deferred outflows of resources and deferred inflows of resources related to OPEB from the following sources:
RHBF DIPNC Total
Differences Between Actual and Expected Experience $ 0.00 $ 3,667.00 $ 3,667.00
Changes of Assumptions
Net Difference Between Projected andActual Earnings on Plan Investments 2,931.15 2,931.15
Changes in Proportion and DifferencesBetween Employer's Contributions andProportionate Share of Contributions 1,845.00 1,845.00
Contributions Subsequent to the Measurement Date 221,097.54 5,116.31 226,213.85
Total $ 221,097.54 $ 13,559.46 $ 234,657.00
Employer Balances of Deferred Outflows of Resources Related to OPEB by Classification:
RHBF DIPNC Total
Differences Between Actual and Expected Experience $ 534,415.00 $ 0.00 $ 534,415.00
Changes of Assumptions 2,052,603.00 2,052,603.00
Net Difference Between Projected andActual Earnings on Plan Investments 2,770.00 2,770.00
Changes in Proportion and DifferencesBetween Employer's Contributions andProportionate Share of Contributions 730,745.00 730,745.00
Total $ 3,320,533.00 $ 0.00 $ 3,320,533.00
Employer Balances of Deferred Inflows of Resources Related to OPEB by Classification:

37
NOTES TO THE FINANCIAL STATEMENTS
Amounts reported as deferred outflows of resources related to contributions subsequent to the measurement date will be recognized as a reduction of the net OPEB liability related to RHBF and an increase of the net OPEB asset related to DIPNC in the fiscal year ended June 30, 2019. Other amounts reported as deferred outflows of resources and deferred inflows of resources related to OPEB will be recognized in OPEB expense as follows:
Year Ended June 30:
2019 $ (664,245.00) $ 2,570.002020 (664,245.00) 2,570.002021 (664,245.00) 2,570.002022 (664,245.00) 733.152023 (663,553.00)
Total $ (3,320,533.00) $ 8,443.15
RHBF DIPNC
Schedule of the Net Amount of the Employer's Balances of Deferred Outflowsof Resources and Deferred Inflows of Resources That will be Recognized inOPEB Expense:
NOTE 14 - RISK MANAGEMENT
The College is exposed to various risks of loss related to torts; theft of, damage to, and destruction of assets; errors and omissions; injuries to employees; and natural disasters. These exposures to loss are handled via a combination of methods, including participation in state-administered insurance programs, purchase of commercial insurance, and self-retention of certain risks. There have been no significant reductions in insurance coverage from the previous year and settled claims have not exceeded coverage in any of the past three fiscal years.
A. Employee Benefit Plans
1. State Health Plan
College employees are provided comprehensive major medical care benefits. Coverage is funded by contributions to the State Health Plan (Plan), a discretely presented component unit of the State of North Carolina. The Plan is funded by employer contributions. Certain plans also require contributions from employees. The Plan has contracted with third parties to process claims. See Note 13, Other Postemployment Benefits, for additional information regarding retiree health benefits.
2. Death Benefit Plan of North Carolina
Term life insurance (death benefits) of $25,000 to $50,000 is provided to eligible workers. This Death Benefit Plan is administered by the

38
NOTES TO THE FINANCIAL STATEMENTS
State Treasurer and funded via employer contributions. The employer contribution rate was 0.16% for the current fiscal year.
3. Disability Income Plan
Short-term and long-term disability benefits are provided to College employees through the Disability Income Plan of North Carolina (DIPNC), part of the State’s Pension and Other Employee Benefit Trust Funds. Short-term benefits are paid by the College up to the first six months of benefits and reimbursed by DIPNC for any additional short-term benefits. As discussed in Note 13, long-term disability benefits are payable as other postemployment benefits from DIPNC after the conclusion of the short-term disability period or after salary continuation payments cease, whichever is later, for as long as an employee is disabled.
B. Other Risk Management and Insurance Activities
1. Automobile, Fire, and Other Property Losses
Fire and other property losses are covered by contracts with private insurance companies. There have been no significant reductions in insurance coverage from the previous year and settled claims have not exceeded coverage in any of the past three fiscal years.
State-owned vehicles are covered by liability insurance through a private insurance company and handled by the North Carolina Department of Insurance. The liability limits for losses are $1,000,000 per claim and $10,000,000 per occurrence. The College pays premiums to the North Carolina Department of Insurance for the coverage. Liability insurance for other College-owned vehicles is covered by contracts with private insurance companies.
2. Public Officers’ and Employees’ Liability Insurance
The risk of tort claims of up to $1,000,000 per claimant is retained under the authority of the State Tort Claims Act. In addition, the State provides excess public officers’ and employees’ liability insurance up to $10,000,000 via contract with a private insurance company. The North Carolina Community College System Office pays the premium, based on a composite rate, directly to the private insurer.
3. Employee Dishonesty and Computer Fraud
The College is protected for losses from employee dishonesty and computer fraud for employees paid in whole or in part from state funds. This coverage is with a private insurance company and is handled by the North Carolina Department of Insurance. North Carolina Community College System Office is charged a premium by the private insurance company. Coverage limit is $5,000,000 per occurrence. The private insurance company pays 90% of each loss less a $100,000

39
NOTES TO THE FINANCIAL STATEMENTS
deductible. The College is protected from losses from employee dishonesty and computer fraud for employees paid entirely from county or institutional funds by contracts with private insurance companies.
4. Statewide Workers’ Compensation Program
The State Board of Community Colleges makes the necessary arrangements to carry out the provisions of the Workers’ Compensation Act which are applicable to employees whose wages are paid in whole or in part from state funds. The College purchases workers’ compensation insurance for employees whose salaries or wages are paid by the Board entirely from county or institutional funds.
Additional details on the state-administered risk management programs are disclosed in the State’s Comprehensive Annual Financial Report, issued by the Office of the State Controller.
NOTE 15 - BLENDED COMPONENT UNIT
Condensed combining information for the College’s blended component unit for the year ended June 30, 2018, is presented as follows:
Condensed Statement of Net Position
R-CCCR-CCC Foundation, Inc. Eliminations Total
ASSETSCurrent Assets $ 1,089,822.08 $ 223,990.62 $ 0.00 $ 1,313,812.70Capital Assets, Net 5,672,181.34 5,672,181.34Other Noncurrent Assets 13,373.00 38,377.65 51,750.65
Total Assets 6,775,376.42 262,368.27 7,037,744.69
TOTAL DEFERRED OUTFLOWS OF RESOURCES 1,293,047.00 1,293,047.00
LIABILITIESCurrent Liabilities 606,741.47 606,741.47Long-Term Liabilities 9,641,467.65 9,641,467.65
Total Liabilities 10,248,209.12 10,248,209.12
TOTAL DEFERRED INFLOWS OF RESOURCES 3,478,332.00 3,478,332.00
NET POSITIONNet Investment in Capital Assets 5,649,157.54 5,649,157.54Restricted - Expendable 208,536.40 192,926.41 401,462.81Unrestricted (11,515,811.64) 69,441.86 (11,446,369.78)
Total Net Position $ (5,658,117.70) $ 262,368.27 $ 0.00 $ (5,395,749.43)
June 30, 2018

40
NOTES TO THE FINANCIAL STATEMENTS
Condensed Statement of Revenues, Expenses, andChanges in Net Position
For the Fiscal Year Ended June 30, 2018R-CCC
R-CCC Foundation, Inc. Eliminations TotalOPERATING REVENUES
Student Tuition and Fees, Net $ 343,733.24 $ 0.00 $ 0.00 $ 343,733.24Sales and Services 33,856.88 33,856.88Contributions 14,557.00 (14,557.00)Other 4,208.54 4,208.54
Total Operating Revenues 381,798.66 14,557.00 (14,557.00) 381,798.66
OPERATING EXPENSESOperating Expenses 9,543,222.22 68,635.97 9,611,858.19Depreciation 383,179.52 383,179.52
Total Operating Expenses 9,926,401.74 68,635.97 9,995,037.71
Operating Loss (9,544,603.08) (54,078.97) (14,557.00) (9,613,239.05)
NONOPERATING REVENUES
State Aid 5,512,672.32 5,512,672.32County Appropriations 1,090,165.35 1,090,165.35Noncapital Grants 2,186,052.08 2,186,052.08Noncapital Gifts 11,250.00 14,557.00 25,807.00Inevestment Income 2,016.22 2,016.22Other Nonoperating Revenues 32,815.05 32,815.05
Net Nonoperating Revenues 8,832,954.80 2,016.22 14,557.00 8,849,528.02
Capital Grants and Aid 370,701.88 370,701.88Decrease in Net Position (340,946.40) (52,062.75) (393,009.15)
NET POSITIONNet Position, July 1, 2017 as Restated (5,317,171.30) 314,431.02 (5,002,740.28)
Net Position, June 30, 2018 $ (5,658,117.70) $ 262,368.27 $ 0.00 $ (5,395,749.43)
Condensed Statement of Cash Flows
R-CCCR-CCC Foundation, Inc. Total
Net Cash Used by Operating Activities $ (8,892,428.23) $ (74,567.66) $ (8,966,995.89)Cash Provided by Noncapital Financing Activities 8,838,732.67 14,557.00 8,853,289.67Net Cash Provided by Capital and Related Financing Activities 357,101.88 357,101.88Cash Provided by Investing Activities 2,016.22 2,016.22
Net Increase (Decrease) in Cash and Cash Equivalents 303,406.32 (57,994.44) 245,411.88
Cash and Cash Equivalents, July 1, 2017 454,203.78 320,247.95 774,451.73
Cash and Cash Equivalents, June 30, 2018 $ 757,610.10 $ 262,253.51 $ 1,019,863.61
June 30, 2018

41
NOTES TO THE FINANCIAL STATEMENTS
NOTE 16 - CHANGES IN FINANCIAL ACCOUNTING AND REPORTING
For the fiscal year ended June 30, 2018, the College implemented the following pronouncements issued by the Governmental Accounting Standards Board (GASB):
GASB Statement No. 75, Accounting and Financial Reporting for Postemployment Benefits Other Than Pensions
GASB Statement No. 85, Omnibus 2017
GASB Statement No. 75 improves accounting and financial reporting requirements by state and local governments for postemployment benefits other than pensions (OPEB). It also improves information provided by state and local governmental employers about financial support for OPEB that is provided by other entities. This Statement replaces the requirements of Statements No. 45, Accounting and Financial Reporting by Employers for Postemployment Benefits Other Than Pensions, as amended, and No. 57, OPEB Measurements by Agent Employers and Agent Multiple-Employer Plans, for OPEB. In addition, this Statement details the recognition and disclosure requirements for employers with payables to defined benefit OPEB plans that are administered through trusts that meet the specified criteria and for employers whose employees are provided with defined contribution OPEB.
GASB Statement No. 85 addresses practice issues that have been identified during implementation and application of certain GASB Statements. This Statement addresses a variety of topics including issues related to blending component units, goodwill, fair value measurement and application, and postemployment benefits (pensions and OPEB).
NOTE 17 - NET POSITION RESTATEMENTS
As of July 1, 2017, net position as previously reported was restated as follows:
Amount
July 1, 2017 Net Position as Previously Reported $ 5,638,468.55Restatements:Record the College's Net OPEB Asset and Liability and OPEB Related Deferred Outflows and Inflows of Resources Per GASB 75 Requirements. (10,520,915.00)Error in Prior Year Payroll Accrual. (120,293.83)
July 1, 2017 Net Position as Restated $ (5,002,740.28)

REQUIRED
SUPPLEMENTARY INFORMATION

Roanoke-Chowan Community CollegeRequired Supplementary InformationSchedule of the Proportionate Net Pension Liability Teachers' and State Employees' Retirement SystemLast Five Fiscal Years Exhibit B-1
Proportionate Share Percentage ofCollective Net Pension Liability 0.02518% 0.02766% 0.02738% 0.02880% 0.02880%
Proportionate Share of TSERSCollective Net Pension Liability $ 1,997,892.00 $ 2,542,240.00 $ 1,009,007.00 $ 337,657.00 $ 1,748,453.00
Covered Payroll $ 3,832,519.06 $ 4,312,327.17 $ 4,151,200.16 $ 4,179,871.20 $ 4,194,324.01
Net Pension Liability as a Percentage of Covered Payroll 52.13% 58.95% 24.31% 8.08% 41.69%
Plan Fiduciary Net Position as a Percentage of theTotal Pension Liability 89.51% 87.32% 94.64% 98.24% 90.60%
Note: Information is presented for all years that were measured in accordance with the requirements of GASB Statement No. 68, Accounting and FinancialReporting for Pensions - An Amendment of GASB Statement No. 27 , as amended.
2015 2014 201320162017
42

Roanoke-Chowan Community CollegeRequired Supplementary InformationSchedule of College ContributionsTeachers' and State Employees' Retirement SystemLast Ten Fiscal Years Exhibit B-2
Contractually Required Contribution $ 393,955.62 $ 382,485.40 $ 394,577.94 $ 379,834.81 $ 363,230.81
Contributions in Relation to theContractually Determined Contribution 393,955.62 382,485.40 394,577.94 379,834.81 363,230.81
Contribution Deficiency (Excess) $ 0.00 $ 0.00 $ 0.00 $ 0.00 $ 0.00
Covered Payroll $ 3,654,504.87 $ 3,832,519.06 $ 4,312,327.17 $ 4,151,200.16 $ 4,179,871.20
Contributions as a Percentage ofCovered Payroll 10.78% 9.98% 9.15% 9.15% 8.69%
Contractually Required Contribution $ 349,387.19 $ 307,358.52 $ 221,757.05 $ 157,231.47 $ 150,725.04
Contributions in Relation to theContractually Determined Contribution 349,387.19 307,358.52 221,757.05 157,231.47 150,725.04
Contribution Deficiency (Excess) $ 0.00 $ 0.00 $ 0.00 $ 0.00 $ 0.00
Covered Payroll $ 4,194,324.01 $ 4,131,162.94 $ 4,498,114.60 $ 4,404,242.89 $ 4,485,864.29
Contributions as a Percentage ofCovered Payroll 8.33% 7.44% 4.93% 3.57% 3.36%
Note: Changes in benefit terms, methods, and assumptions are presented in the Notes to Required Supplementary Information (RSI) schedule following thepension RSI tables.
2016 2015 2014
2013 2012 2011 2010 2009
2018 2017
43
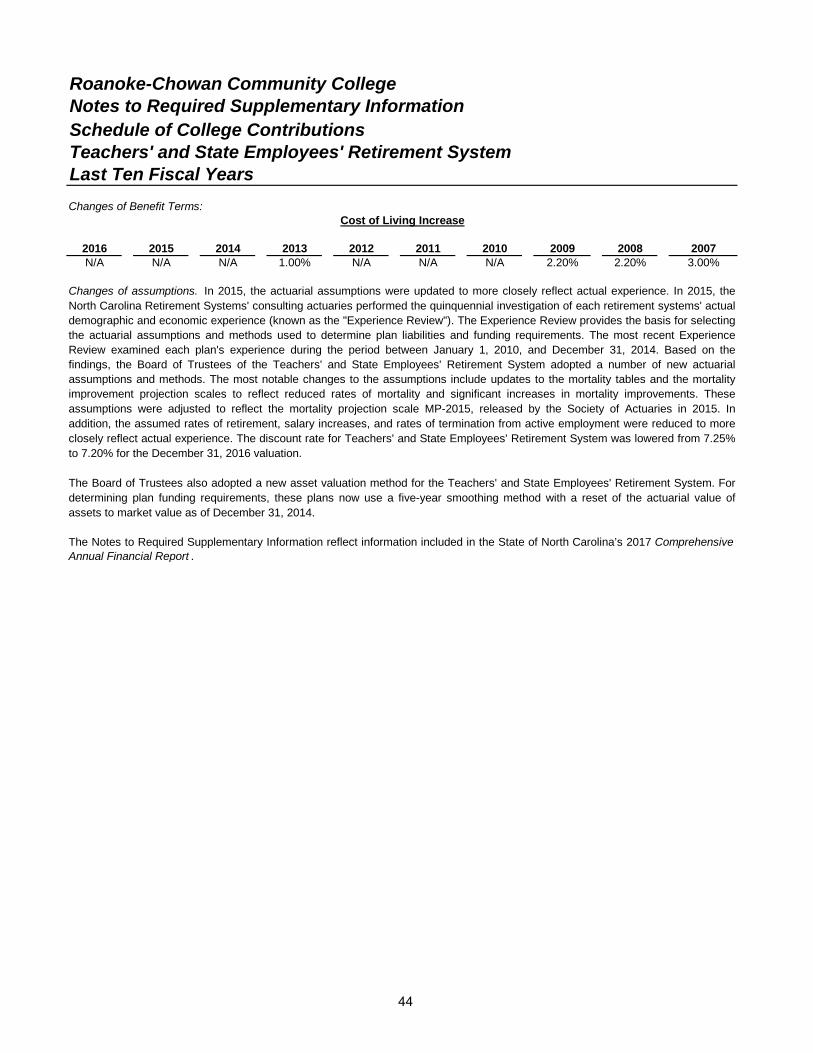
Roanoke-Chowan Community CollegeNotes to Required Supplementary InformationSchedule of College ContributionsTeachers' and State Employees' Retirement SystemLast Ten Fiscal YearsChanges of Benefit Terms:
2016 2015 2014 2013 2012 2011 2010 2009 2008 2007N/A N/A N/A 1.00% N/A N/A N/A 2.20% 2.20% 3.00%
Changes of assumptions. In 2015, the actuarial assumptions were updated to more closely reflect actual experience. In 2015, theNorth Carolina Retirement Systems' consulting actuaries performed the quinquennial investigation of each retirement systems' actualdemographic and economic experience (known as the "Experience Review"). The Experience Review provides the basis for selectingthe actuarial assumptions and methods used to determine plan liabilities and funding requirements. The most recent ExperienceReview examined each plan's experience during the period between January 1, 2010, and December 31, 2014. Based on thefindings, the Board of Trustees of the Teachers' and State Employees' Retirement System adopted a number of new actuarialassumptions and methods. The most notable changes to the assumptions include updates to the mortality tables and the mortalityimprovement projection scales to reflect reduced rates of mortality and significant increases in mortality improvements. Theseassumptions were adjusted to reflect the mortality projection scale MP-2015, released by the Society of Actuaries in 2015. Inaddition, the assumed rates of retirement, salary increases, and rates of termination from active employment were reduced to moreclosely reflect actual experience. The discount rate for Teachers' and State Employees' Retirement System was lowered from 7.25%to 7.20% for the December 31, 2016 valuation.
The Board of Trustees also adopted a new asset valuation method for the Teachers' and State Employees' Retirement System. Fordetermining plan funding requirements, these plans now use a five-year smoothing method with a reset of the actuarial value ofassets to market value as of December 31, 2014.
The Notes to Required Supplementary Information reflect information included in the State of North Carolina’s 2017 Comprehensive Annual Financial Report .
Cost of Living Increase
44

Roanoke-Chowan Community CollegeRequired Supplementary InformationSchedule of the Proportionate Net OPEB Liability or AssetCost-Sharing, Multiple-Employer, Defined Benefit OPEB PlansLast Two Fiscal Years Exhibit B-3
Retiree Health Benefit Fund
Proportionate Share Percentage ofCollective Net OPEB Liability 0.02273% 0.02476%
Proportionate Share of CollectiveNet OPEB Liability $ 7,453,292.00 $ 10,771,442.00
Covered Payroll $ 3,832,519.06 $ 4,312,327.17
Net OPEB Liability as a Percentageof Covered Payroll 194.48% 249.78%
Plan Fiduciary Net Position as a Percentage of theTotal OPEB Liability 3.52% 2.41%
Disability Income Plan of North Carolina
Proportionate Share Percentage ofCollective Net OPEB Asset 0.02188% 0.02411%
Proportionate Share of CollectiveNet OPEB Asset $ 13,373.00 $ 14,972.00
Covered Payroll $ 3,832,519.06 $ 4,312,327.17
Net OPEB Asset as a Percentageof Covered Payroll 0.35% 0.35%
Plan Fiduciary Net Position as a Percentage of theTotal OPEB Asset 116.23% 116.06%
2017 2016
Note: Information is presented for all years that were measured in accordance with the requirements of GASBStatement No. 75, Accounting and Financial Reporting for Postemployment Benefits Other Than Pensions .
45
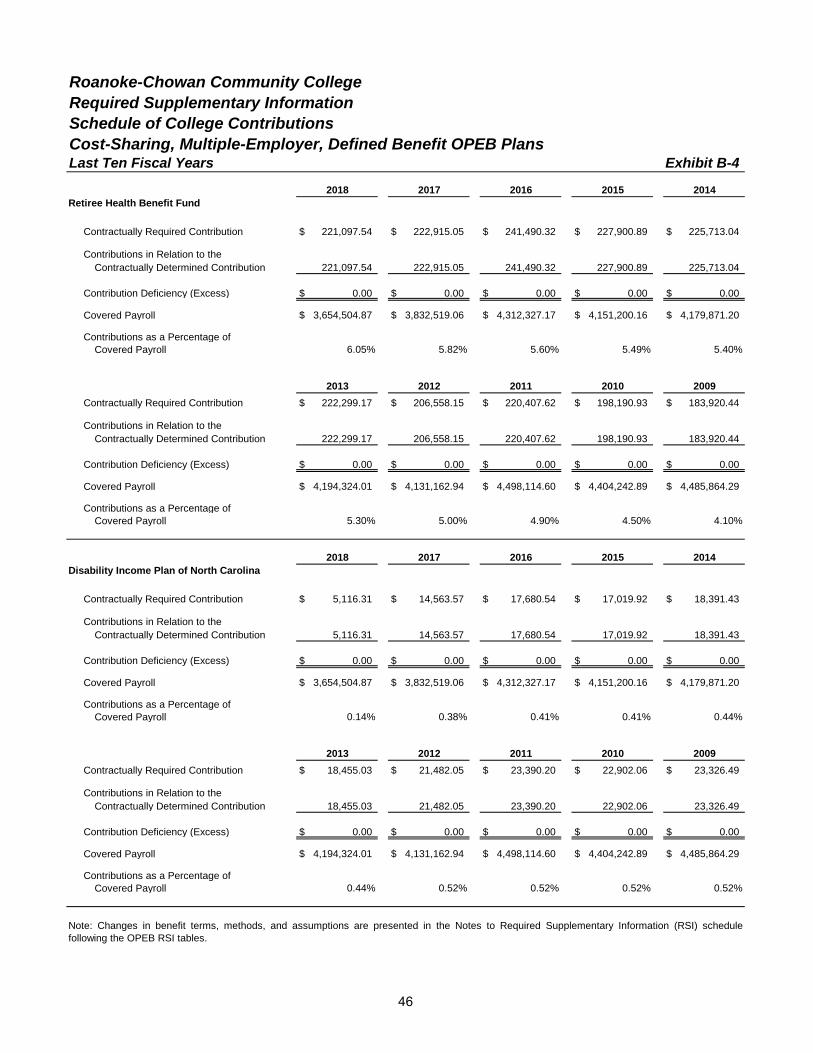
Roanoke-Chowan Community CollegeRequired Supplementary InformationSchedule of College ContributionsCost-Sharing, Multiple-Employer, Defined Benefit OPEB PlansLast Ten Fiscal Years Exhibit B-4
Retiree Health Benefit Fund
Contractually Required Contribution $ 221,097.54 $ 222,915.05 $ 241,490.32 $ 227,900.89 $ 225,713.04
Contributions in Relation to theContractually Determined Contribution 221,097.54 222,915.05 241,490.32 227,900.89 225,713.04
Contribution Deficiency (Excess) $ 0.00 $ 0.00 $ 0.00 $ 0.00 $ 0.00
Covered Payroll $ 3,654,504.87 $ 3,832,519.06 $ 4,312,327.17 $ 4,151,200.16 $ 4,179,871.20
Contributions as a Percentage ofCovered Payroll 6.05% 5.82% 5.60% 5.49% 5.40%
Contractually Required Contribution $ 222,299.17 $ 206,558.15 $ 220,407.62 $ 198,190.93 $ 183,920.44
Contributions in Relation to theContractually Determined Contribution 222,299.17 206,558.15 220,407.62 198,190.93 183,920.44
Contribution Deficiency (Excess) $ 0.00 $ 0.00 $ 0.00 $ 0.00 $ 0.00
Covered Payroll $ 4,194,324.01 $ 4,131,162.94 $ 4,498,114.60 $ 4,404,242.89 $ 4,485,864.29
Contributions as a Percentage ofCovered Payroll 5.30% 5.00% 4.90% 4.50% 4.10%
Disability Income Plan of North Carolina
Contractually Required Contribution $ 5,116.31 $ 14,563.57 $ 17,680.54 $ 17,019.92 $ 18,391.43
Contributions in Relation to theContractually Determined Contribution 5,116.31 14,563.57 17,680.54 17,019.92 18,391.43
Contribution Deficiency (Excess) $ 0.00 $ 0.00 $ 0.00 $ 0.00 $ 0.00
Covered Payroll $ 3,654,504.87 $ 3,832,519.06 $ 4,312,327.17 $ 4,151,200.16 $ 4,179,871.20
Contributions as a Percentage ofCovered Payroll 0.14% 0.38% 0.41% 0.41% 0.44%
Contractually Required Contribution $ 18,455.03 $ 21,482.05 $ 23,390.20 $ 22,902.06 $ 23,326.49
Contributions in Relation to theContractually Determined Contribution 18,455.03 21,482.05 23,390.20 22,902.06 23,326.49
Contribution Deficiency (Excess) $ 0.00 $ 0.00 $ 0.00 $ 0.00 $ 0.00
Covered Payroll $ 4,194,324.01 $ 4,131,162.94 $ 4,498,114.60 $ 4,404,242.89 $ 4,485,864.29
Contributions as a Percentage ofCovered Payroll 0.44% 0.52% 0.52% 0.52% 0.52%
Note: Changes in benefit terms, methods, and assumptions are presented in the Notes to Required Supplementary Information (RSI) schedulefollowing the OPEB RSI tables.
2014
2013 2012 2009
2018 2017 2016 2015
2011 2010
2013 2012 2011 2010 2009
2018 2017 2016 2015 2014
46

Roanoke-Chowan Community CollegeNotes to Required Supplementary InformationSchedule of College ContributionsCost-Sharing, Multiple-Employer, Defined Benefit OPEB PlansLast Ten Fiscal Years
Changes of Benefit Terms: Effective January 1, 2016, benefit terms related to copays, out-of-pocket maximums, and deductibles werechanged for three of four options of the Retiree Health Benefit Fund. Most of the changes were an increase in the amount from theprevious year.
Effective January 1, 2017, benefit terms related to copays, coinsurance maximums, out-of-pocket maximums, and deductibles werechanged for two of four options of the Retiree Health Benefit Fund. Most of the changes were an increase in the amount from the previousyear.
Method and Assumptions Used in Calculations of Actuarially Determined Contributions: An actuarial valuation is performed for each planeach year. The actuarially determined contribution rates in the Schedule of Employer Contributions are calculated by the actuary as aprojection of the required employer contribution for the fiscal year beginning six months following the date of the valuation results for theRetiree Health Benefit Fund. The actuarially determined contribution rates in the Schedule of Employer Contributions are calculated by theactuary as a projection of the required employer contribution for the fiscal year beginning 18 months following the date of the valuationresults for the Disability Income Plan of North Carolina. See Note 13 for more information on the specific assumptions for each plan. Theactuarially determined contributions for those items with covered payroll were determined using the actuarially determined contribution ratefrom the actuary and covered payroll as adjusted for timing differences and other factors such as differences in employee class. Otheractuarially determined contributions are disclosed in the schedule as expressed by the actuary in reports to the plans.
Changes of assumptions: In 2015, the North Carolina Retirement Systems' consulting actuaries performed the quinquennial investigationof each retirement system's actual demographic and economic experience (known as the "Experience Review"). The Experience Reviewprovides the basis for selecting the actuarial assumptions and methods used to determine plan liabilities and funding requirements. Themost recent experience review examined each plan's experience during the period between January 1, 2010, and December 31, 2014.Based on the findings, the Boards of Trustees of the Teachers’ and State Employees’ Retirement System and the State Health Planadopted a number of new actuarial assumptions and methods for the Retiree Health Benefit Fund and the Disability Income Plan of NorthCarolina. The most notable changes to the assumptions include updates to the mortality tables and the mortality improvement projectionscales to reflect reduced rates of mortality and significant increases in mortality improvements. These assumptions were adjusted to reflectthe mortality projection scale MP-2015, released by the Society of Actuaries in 2015. In addition, the assumed rates of retirement and ratesof termination from active employment were reduced to more closely reflect actual experience.
In 2017, the medical and prescription health trend rates used in the December 31, 2016 actuarial valuation of the Retiree Health BenefitFund were reduced based upon the plan’s most recent experience.
The Notes to Required Supplementary Information reflect information included in the State of North Carolina’s 2017 Comprehensive Annual Financial Report .
47

INDEPENDENT
AUDITOR’S REPORT

STATE OF NORTH CAROLINA Office of the State Auditor
Beth A. Wood, CPA
State Auditor
48
2 S. Salisbury Street
20601 Mail Service Center Raleigh, NC 27699-0600
Telephone: (919) 807-7500 Fax: (919) 807-7647
http://www.ncauditor.net
INDEPENDENT AUDITOR’S REPORT ON INTERNAL CONTROL OVER FINANCIAL REPORTING
AND ON COMPLIANCE AND OTHER MATTERS BASED ON AN AUDIT OF FINANCIAL STATEMENTS PERFORMED IN ACCORDANCE WITH
GOVERNMENT AUDITING STANDARDS
Board of Trustees Roanoke-Chowan Community College Ahoskie, North Carolina
We have audited, in accordance with the auditing standards generally accepted in the United States of America and the standards applicable to financial audits contained in Government Auditing Standards issued by the Comptroller General of the United States, the financial statements of Roanoke-Chowan Community College (College), a component unit of the State of North Carolina, as of and for the year ended June 30, 2018, and the related notes to the financial statements, which collectively comprise the College’s basic financial statements, and have issued our report thereon dated March 25, 2019.
Internal Control Over Financial Reporting In planning and performing our audit of the financial statements, we considered the College's internal control over financial reporting (internal control) to determine the audit procedures that are appropriate in the circumstances for the purpose of expressing our opinion on the financial statements, but not for the purpose of expressing an opinion on the effectiveness of the College’s internal control. Accordingly, we do not express an opinion on the effectiveness of the College’s internal control.
A deficiency in internal control exists when the design or operation of a control does not allow management or employees, in the normal course of performing their assigned functions, to prevent, or detect and correct, misstatements on a timely basis. A material weakness is a deficiency, or a combination of deficiencies, in internal control such that there is a reasonable possibility that a material misstatement of the College’s financial statements will not be prevented, or detected and corrected on a timely basis. A significant deficiency is a deficiency, or a combination of deficiencies, in internal control that is less severe than a material weakness, yet important enough to merit attention by those charged with governance.
Our consideration of internal control was for the limited purpose described in the first paragraph of this section and was not designed to identify all deficiencies in internal control that might be material weaknesses or significant deficiencies. Given these limitations, during our audit we

49
INDEPENDENT AUDITOR’S REPORT
did not identify any deficiencies in internal control that we consider to be material weaknesses. However, material weaknesses may exist that have not been identified.
Compliance and Other Matters As part of obtaining reasonable assurance about whether the College’s financial statements are free from material misstatement, we performed tests of its compliance with certain provisions of laws, regulations, contracts, and grant agreements, noncompliance with which could have a direct and material effect on the determination of financial statement amounts. However, providing an opinion on compliance with those provisions was not an objective of our audit, and accordingly, we do not express such an opinion. The results of our tests disclosed no instances of noncompliance or other matters that are required to be reported under Government Auditing Standards.
Purpose of this Report The purpose of this report is solely to describe the scope of our testing of internal control and compliance and the results of that testing, and not to provide an opinion on the effectiveness of the College’s internal control or on compliance. This report is an integral part of an audit performed in accordance with Government Auditing Standards in considering the College’s internal control and compliance. Accordingly, this communication is not suitable for any other purpose.
Beth A. Wood, CPA State Auditor
Raleigh, North Carolina
March 25, 2019
This audit required 383 hours at an approximate cost of $39,449.
50
ORDERING INFORMATION
COPIES OF THIS REPORT MAY BE OBTAINED BY CONTACTING:
Office of the State Auditor State of North Carolina
2 South Salisbury Street 20601 Mail Service Center
Raleigh, North Carolina 27699-0600
Telephone: 919-807-7500 Facsimile: 919-807-7647
Internet: http://www.ncauditor.net
To report alleged incidents of fraud, waste or abuse in state government contact the Office of the State Auditor Fraud Hotline: 1-800-730-8477
or download our free app.
https://play.google.com/store/apps/details?id=net.ncauditor.ncauditor
https://itunes.apple.com/us/app/nc-state-auditor-hotline/id567315745
For additional information contact: Brad Young
Director of External Affairs 919-807-7513