Embed Size (px)
Citation preview

Robert W. Baird
2013 Growth Stock Conference Chicago, IL
May 9, 2013
Certain information contained in this presentation and certain comments today constitute forward-looking statements for
purposes of the safe harbor provisions of The Private Securities Litigation Reform Act of 1995. These forward-looking
statements reflect the Company's current views with respect to future events and are subject to certain risks, uncertainties,
and assumptions. A number of important factors could cause actual results or events to differ materially from those
indicated by such forward-looking statements, including demand for our language learning solutions; the advantages of our
products, services, technology, brand and business model as compared to others; our strategic focus; our ability to
maintain effective internal controls or to remediate material weaknesses; our cash needs and expectations regarding cash
flow from operations; our product development plans; the appeal and efficacy of our products and services; our
expectations regarding capturing lifetime value and a broader range of market segments through such offerings; our plans
regarding expansion of our marketing initiatives and sales force; our international operations and growth plans; our plans
regarding our kiosks and retail relationships; our plans regarding our Institutional business; the impact of any revisions to
our pricing strategy; our ability to manage and grow our business and execute our business strategy; our financial
performance; our actions to realign our cost structure and revitalizing our go-to-market strategy; our plans to transition our
distribution to more online in the consumer space; our mergers and acquisitions plans; our plans with respect to
Livemocha; adverse trends in general economic conditions and the other factors including the “Risk Factors” more fully
described in the Company's filings with the U.S. Securities and Exchange Commission (SEC), including the Company’s
annual report on Form 10-K for the year period ended December 31, 2012, which is on file with the SEC. We encourage
you to review those factors before making any investment decision. You should not place undue reliance on forward-
looking statements because they involve factors that are, in some cases, beyond our control and that could materially
affect actual results, levels of activity, performance, or achievements.
Today’s presentation and discussion also contains references to non-GAAP financial measures. The full definition and
reconciliation of those measures is available in our Form 8-K filed with the SEC on May 8, 2013. Management uses these
non-GAAP measures to compare the Company's performance to that of prior periods for trend analyses, for purposes of
determining executive incentive compensation, and for budgeting and planning purposes. Management believes that the
use of these non-GAAP financial measures provides an additional tool for investors to use in evaluating ongoing operating
results and trends. Our definitions of non-GAAP measures may not be comparable to the definitions used by other
companies, and we encourage you to review and understand all our financial reporting before making any investment
decision.
Safe Harbor
2
Tom Pierno
Chief Financial Officer
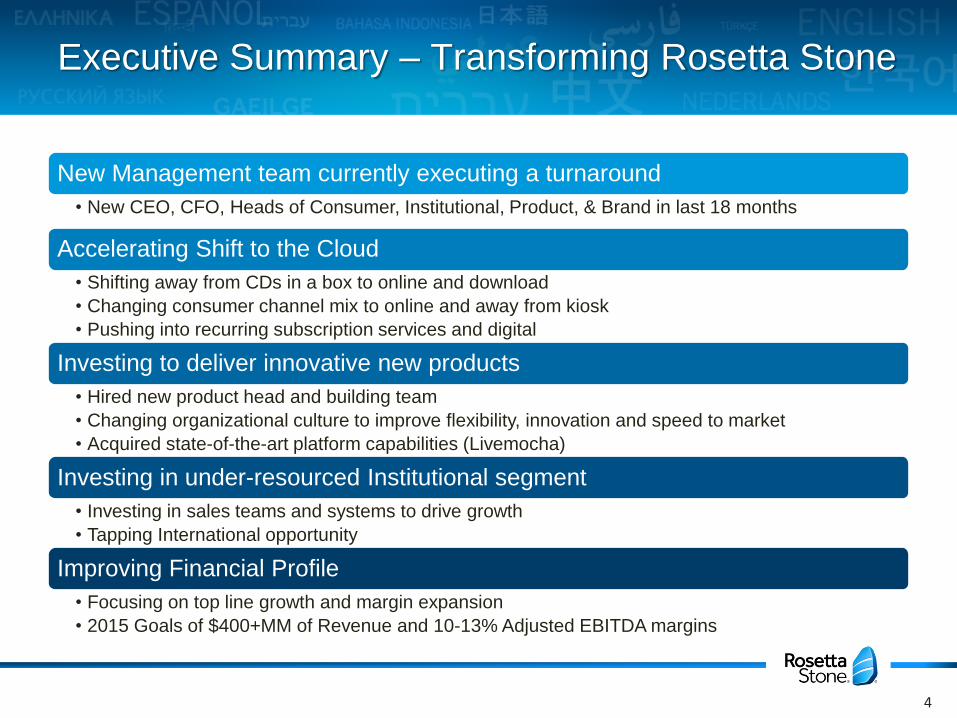
Executive Summary – Transforming Rosetta Stone
New Management team currently executing a turnaround
• New CEO, CFO, Heads of Consumer, Institutional, Product, & Brand in last 18 months
Accelerating Shift to the Cloud
• Shifting away from CDs in a box to online and download
• Changing consumer channel mix to online and away from kiosk
• Pushing into recurring subscription services and digital
Investing to deliver innovative new products
• Hired new product head and building team
• Changing organizational culture to improve flexibility, innovation and speed to market
• Acquired state-of-the-art platform capabilities (Livemocha)
Investing in under-resourced Institutional segment
• Investing in sales teams and systems to drive growth
• Tapping International opportunity
Improving Financial Profile
• Focusing on top line growth and margin expansion
• 2015 Goals of $400+MM of Revenue and 10-13% Adjusted EBITDA margins
4
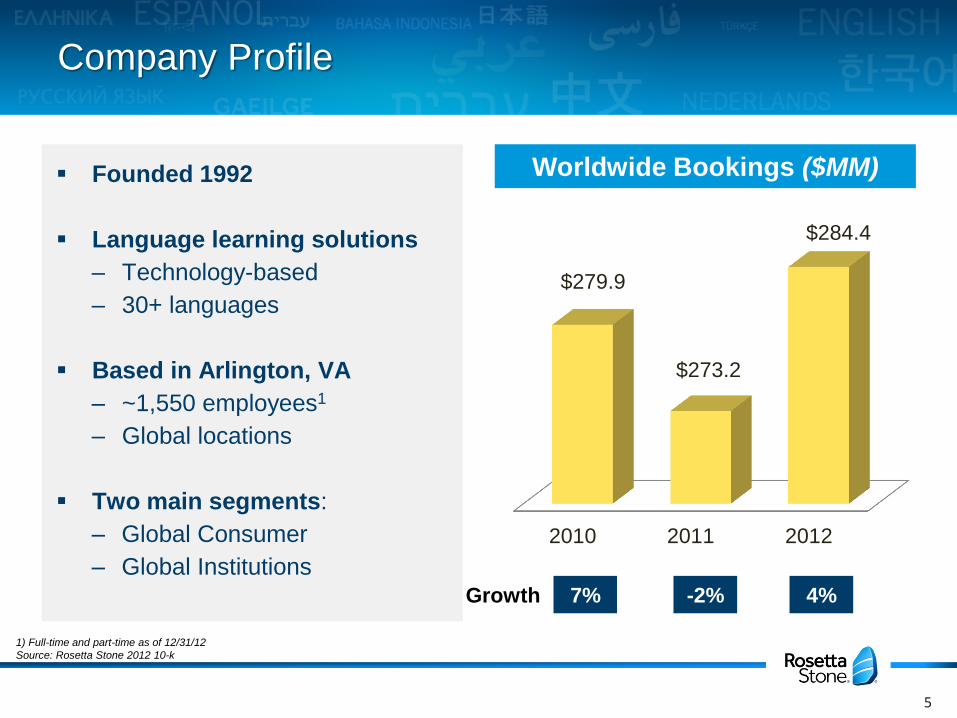
Company Profile
Founded 1992
Language learning solutions
‒ Technology-based
‒ 30+ languages
Based in Arlington, VA
‒ ~1,550 employees1
‒ Global locations
Two main segments:
– Global Consumer
– Global Institutions
1) Full-time and part-time as of 12/31/12
Source: Rosetta Stone 2012 10-k
Worldwide Bookings ($MM)
Growth 7% -2% 4%
5
2010 2011 2012
$279.9
$273.2
$284.4
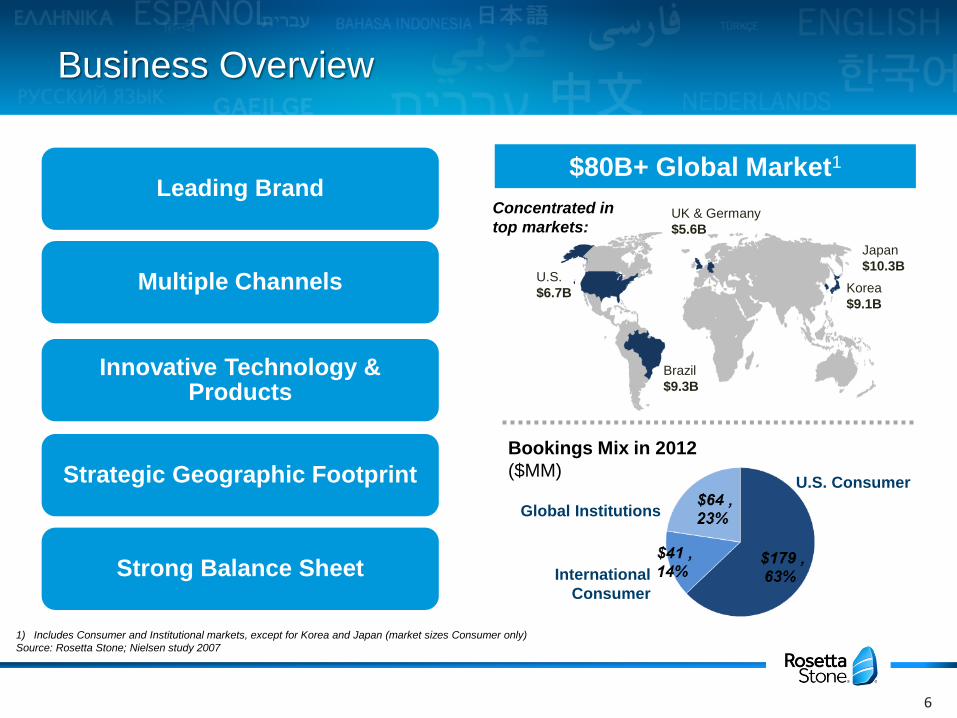
Business Overview
1) Includes Consumer and Institutional markets, except for Korea and Japan (market sizes Consumer only)
Source: Rosetta Stone; Nielsen study 2007
$80B+ Global Market1 Leading Brand
Multiple Channels
Innovative Technology & Products
Strategic Geographic Footprint
Strong Balance Sheet
U.S.
$6.7B
UK & Germany
$5.6B
Brazil
$9.3B
Japan
$10.3B
Korea
$9.1B
Bookings Mix in 2012
($MM)
Concentrated in
top markets:
International
Consumer
Global Institutions
U.S. Consumer
6
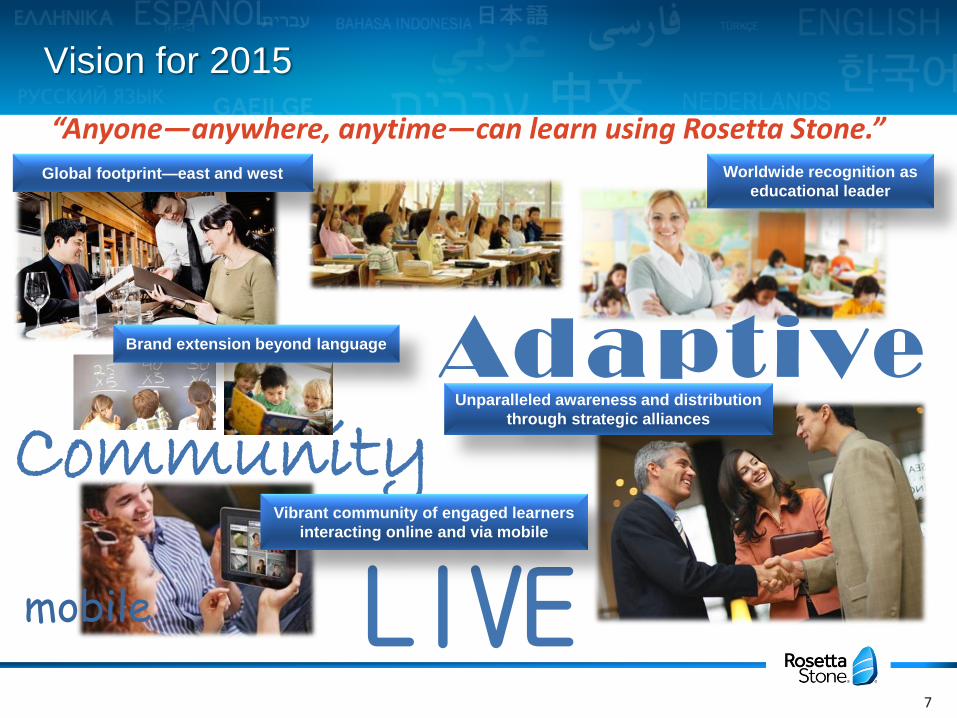
Vision for 2015
LIVE mobile
Community
Global footprint—east and west Worldwide recognition as
educational leader
Vibrant community of engaged learners
interacting online and via mobile
Unparalleled awareness and distribution
through strategic alliances
Adaptive
“Anyone—anywhere, anytime—can learn using Rosetta Stone.”
Brand extension beyond language
7
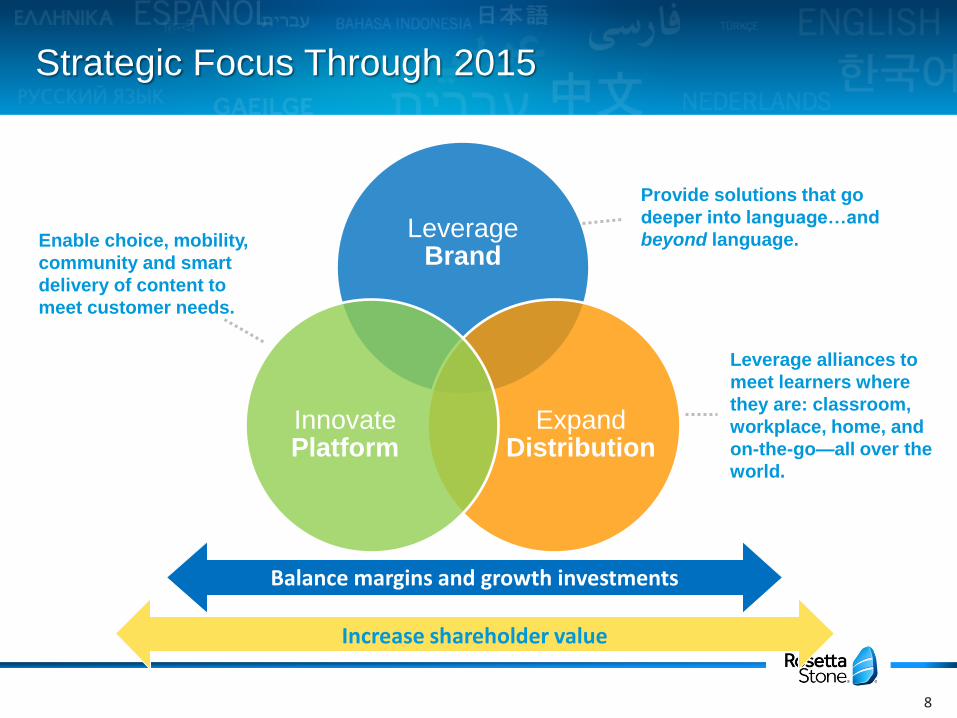
Strategic Focus Through 2015
Leverage Brand
Expand Distribution
Innovate Platform
Provide solutions that go
deeper into language…and
beyond language. Enable choice, mobility,
community and smart
delivery of content to
meet customer needs.
Leverage alliances to
meet learners where
they are: classroom,
workplace, home, and
on-the-go—all over the
world.
Balance margins and growth investments
8
Increase shareholder value
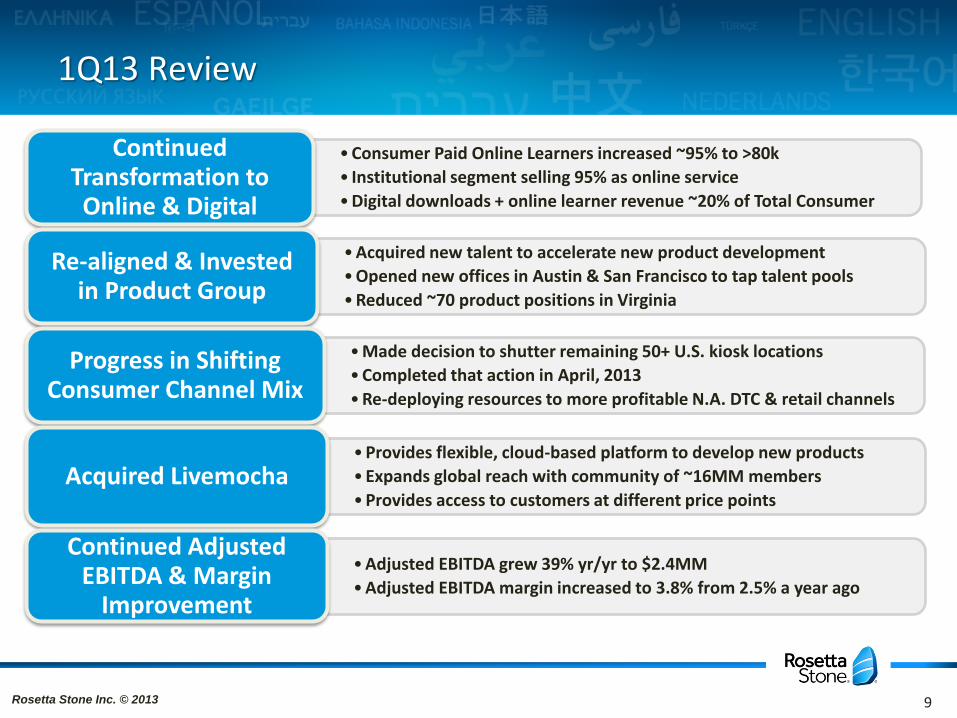
•Consumer Paid Online Learners increased ~95% to >80k
• Institutional segment selling 95% as online service
•Digital downloads + online learner revenue ~20% of Total Consumer
Continued Transformation to Online & Digital
•Acquired new talent to accelerate new product development
•Opened new offices in Austin & San Francisco to tap talent pools
•Reduced ~70 product positions in Virginia
Re-aligned & Invested in Product Group
•Made decision to shutter remaining 50+ U.S. kiosk locations
•Completed that action in April, 2013
•Re-deploying resources to more profitable N.A. DTC & retail channels
Progress in Shifting Consumer Channel Mix
•Provides flexible, cloud-based platform to develop new products
•Expands global reach with community of ~16MM members
•Provides access to customers at different price points Acquired Livemocha
•Adjusted EBITDA grew 39% yr/yr to $2.4MM
•Adjusted EBITDA margin increased to 3.8% from 2.5% a year ago
Continued Adjusted EBITDA & Margin
Improvement
1Q13 Review
Rosetta Stone Inc. © 2013 9
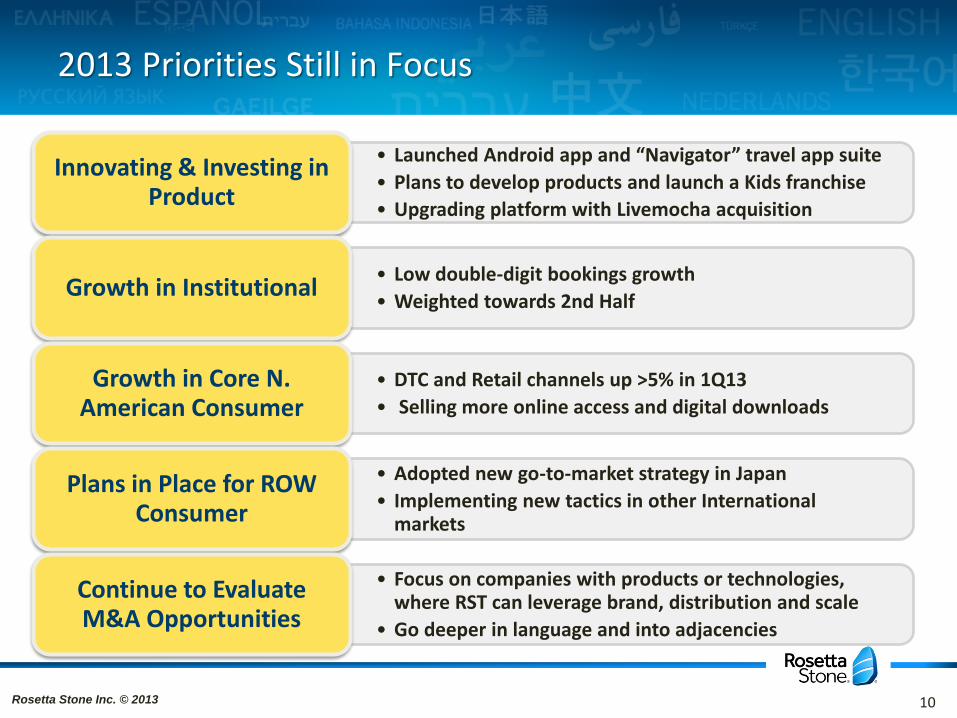
• Launched Android app and “Navigator” travel app suite
• Plans to develop products and launch a Kids franchise
• Upgrading platform with Livemocha acquisition
Innovating & Investing in Product
• Low double-digit bookings growth
• Weighted towards 2nd Half Growth in Institutional
• DTC and Retail channels up >5% in 1Q13
• Selling more online access and digital downloads
Growth in Core N. American Consumer
• Adopted new go-to-market strategy in Japan
• Implementing new tactics in other International markets
Plans in Place for ROW Consumer
• Focus on companies with products or technologies, where RST can leverage brand, distribution and scale
• Go deeper in language and into adjacencies
Continue to Evaluate M&A Opportunities
2013 Priorities Still in Focus
Rosetta Stone Inc. © 2013 10
1Q13 Financial Review
11
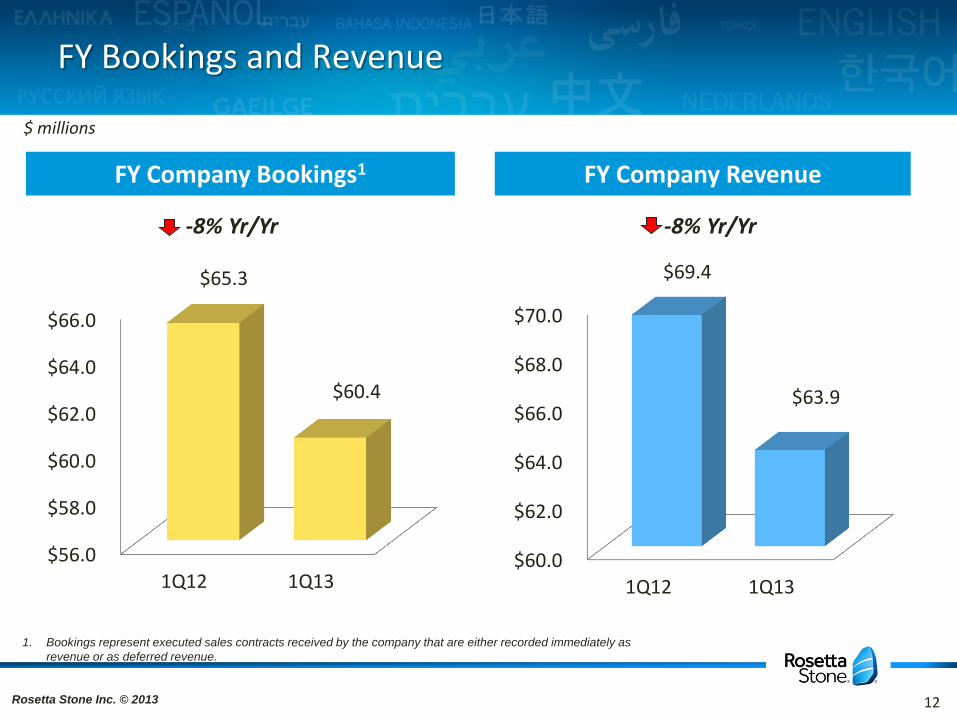
FY Bookings and Revenue
FY Company Bookings1 FY Company Revenue
-8% Yr/Yr -8% Yr/Yr
1. Bookings represent executed sales contracts received by the company that are either recorded immediately as
revenue or as deferred revenue.
$ millions
Rosetta Stone Inc. © 2013 12
$56.0
$58.0
$60.0
$62.0
$64.0
$66.0
1Q12 1Q13
$65.3
$60.4
$60.0
$62.0
$64.0
$66.0
$68.0
$70.0
1Q12 1Q13
$69.4
$63.9
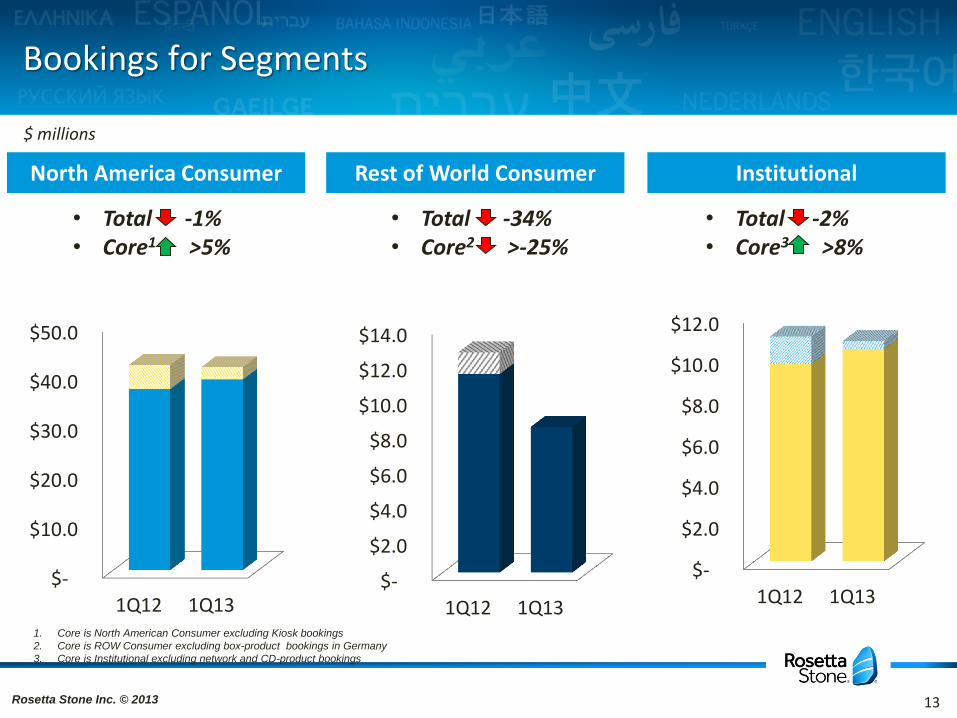
Bookings for Segments
$ millions
North America Consumer
• Total -1% • Core1 >5%
• Total -2% • Core3 >8%
Rest of World Consumer Institutional
• Total -34% • Core2 >-25%
Rosetta Stone Inc. © 2013 13
$-
$10.0
$20.0
$30.0
$40.0
$50.0
1Q12 1Q13 $-
$2.0
$4.0
$6.0
$8.0
$10.0
$12.0
$14.0
1Q12 1Q131. Core is North American Consumer excluding Kiosk bookings
2. Core is ROW Consumer excluding box-product bookings in Germany
3. Core is Institutional excluding network and CD-product bookings
$-
$2.0
$4.0
$6.0
$8.0
$10.0
$12.0
1Q12 1Q13
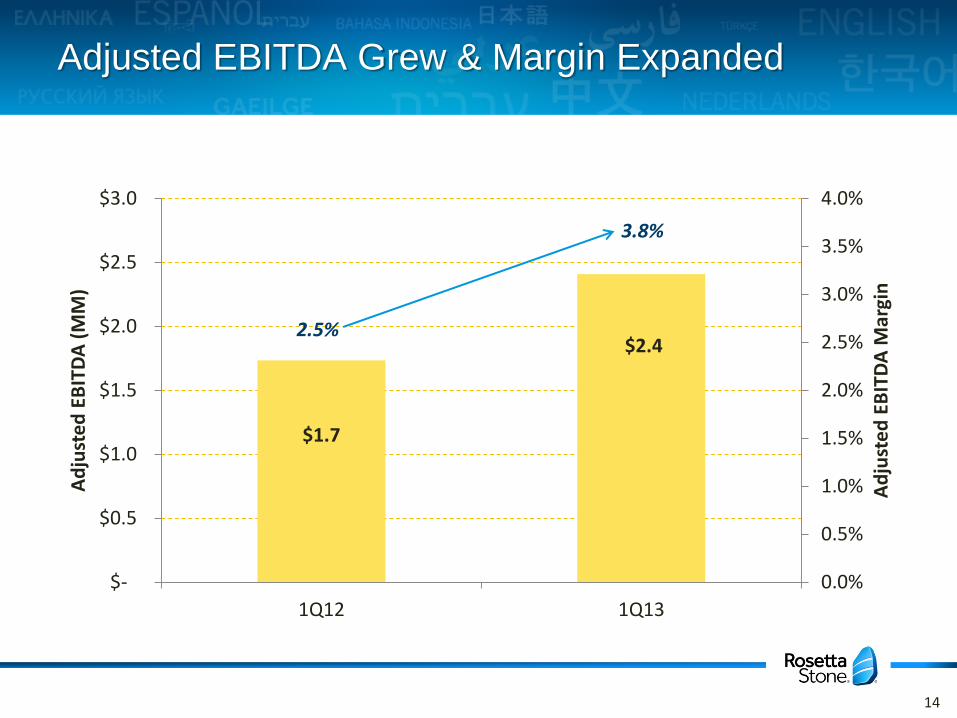
Adjusted EBITDA Grew & Margin Expanded
$1.7
$2.4 2.5%
3.8%
0.0%
0.5%
1.0%
1.5%
2.0%
2.5%
3.0%
3.5%
4.0%
$-
$0.5
$1.0
$1.5
$2.0
$2.5
$3.0
1Q12 1Q13
Ad
just
ed
EB
ITD
A M
argi
n
Ad
just
ed
EB
ITD
A (
MM
)
14
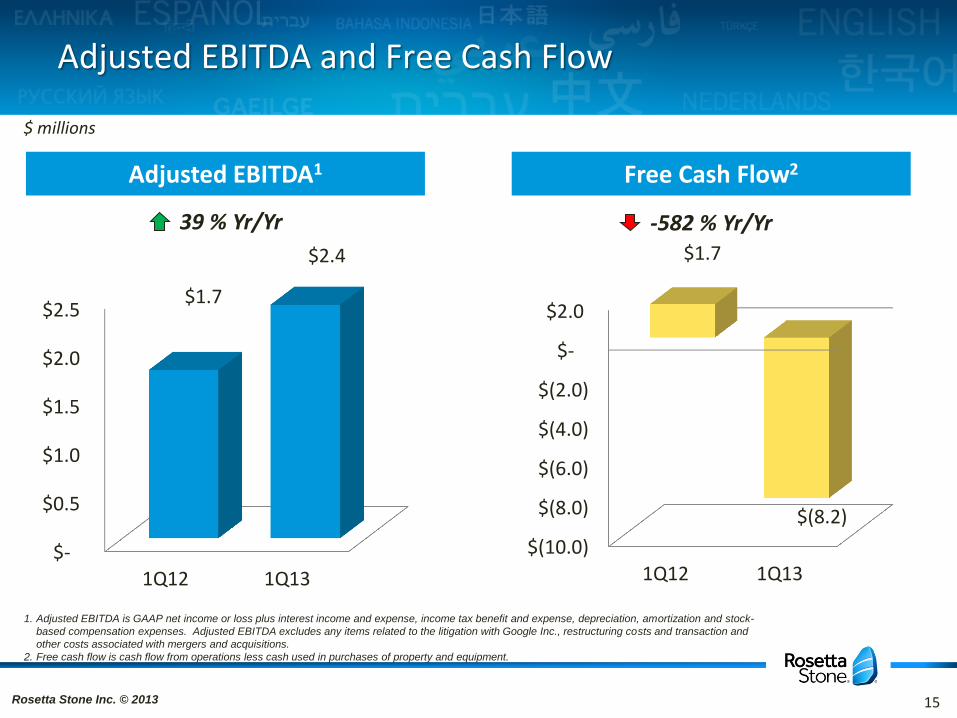
Adjusted EBITDA and Free Cash Flow
Adjusted EBITDA1 Free Cash Flow2
$ millions
Rosetta Stone Inc. © 2013 15
1. Adjusted EBITDA is GAAP net income or loss plus interest income and expense, income tax benefit and expense, depreciation, amortization and stock-
based compensation expenses. Adjusted EBITDA excludes any items related to the litigation with Google Inc., restructuring costs and transaction and
other costs associated with mergers and acquisitions.
2. Free cash flow is cash flow from operations less cash used in purchases of property and equipment.
$-
$0.5
$1.0
$1.5
$2.0
$2.5
1Q12 1Q13
$1.7
$2.4
$(10.0)
$(8.0)
$(6.0)
$(4.0)
$(2.0)
$-
$2.0
1Q12 1Q13
$1.7
$(8.2)
39 % Yr/Yr -582 % Yr/Yr
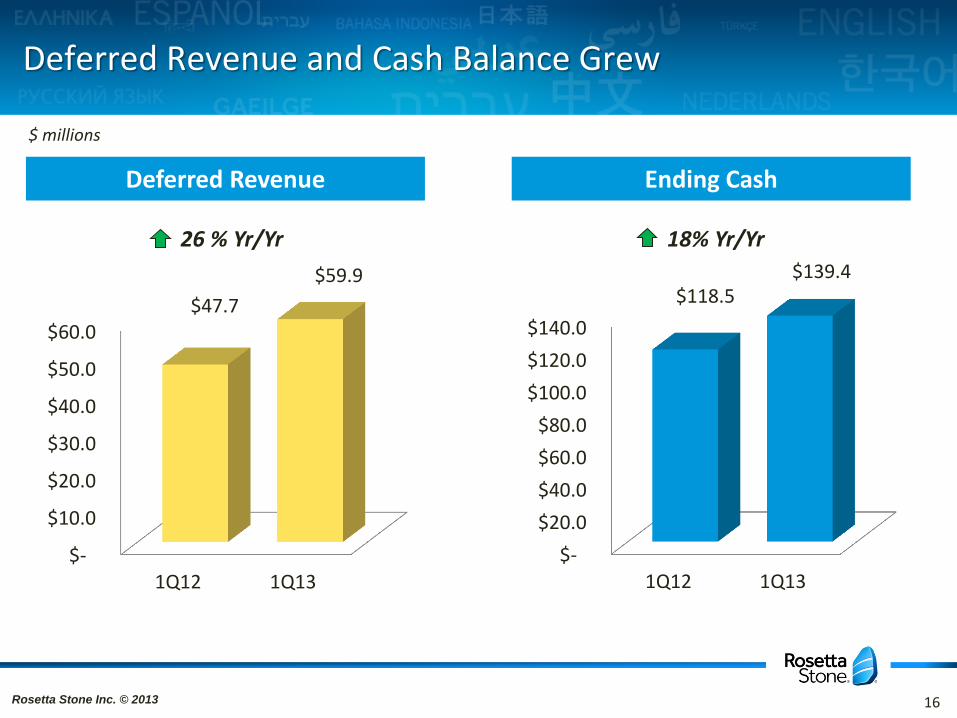
Deferred Revenue and Cash Balance Grew
$ millions
Deferred Revenue Ending Cash
26 % Yr/Yr 18% Yr/Yr
Rosetta Stone Inc. © 2013 16
$-
$10.0
$20.0
$30.0
$40.0
$50.0
$60.0
1Q12 1Q13
$47.7
$59.9
$-
$20.0
$40.0
$60.0
$80.0
$100.0
$120.0
$140.0
1Q12 1Q13
$118.5 $139.4
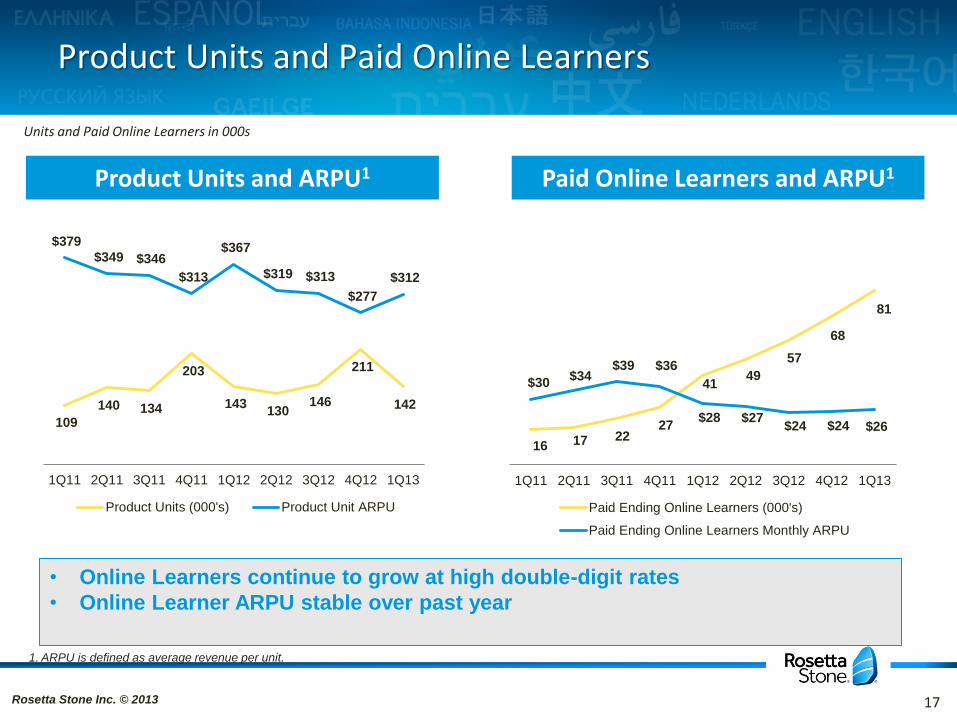
Product Units and Paid Online Learners
Product Units and ARPU1 Paid Online Learners and ARPU1
Rosetta Stone Inc. © 2013
1. ARPU is defined as average revenue per unit.
Units and Paid Online Learners in 000s
17
109
140 134
203
143 130
146
211
142
$379
$349 $346
$313
$367
$319 $313
$277
$312
1Q11 2Q11 3Q11 4Q11 1Q12 2Q12 3Q12 4Q12 1Q13
Product Units (000's) Product Unit ARPU
16 17 22 27
41 49
57
68
81
$30 $34
$39 $36
$28 $27 $24 $24 $26
1Q11 2Q11 3Q11 4Q11 1Q12 2Q12 3Q12 4Q12 1Q13
Paid Ending Online Learners (000's)
Paid Ending Online Learners Monthly ARPU
• Online Learners continue to grow at high double-digit rates
• Online Learner ARPU stable over past year
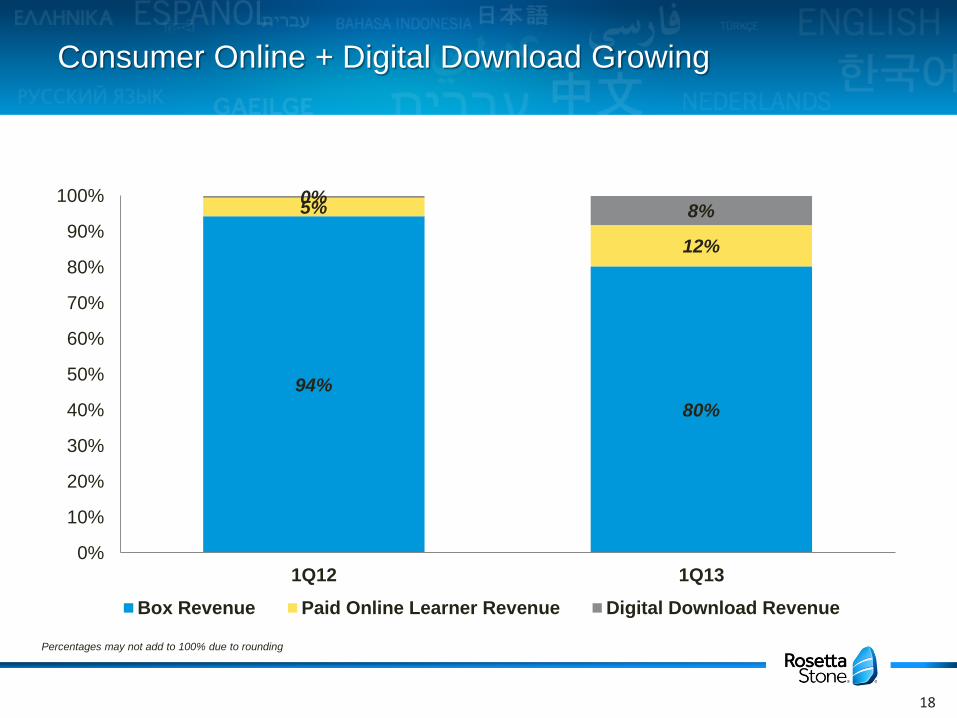
Consumer Online + Digital Download Growing
94%
80%
5%
12%
0% 8%
0%
10%
20%
30%
40%
50%
60%
70%
80%
90%
100%
1Q12 1Q13
Box Revenue Paid Online Learner Revenue Digital Download Revenue
Percentages may not add to 100% due to rounding
18
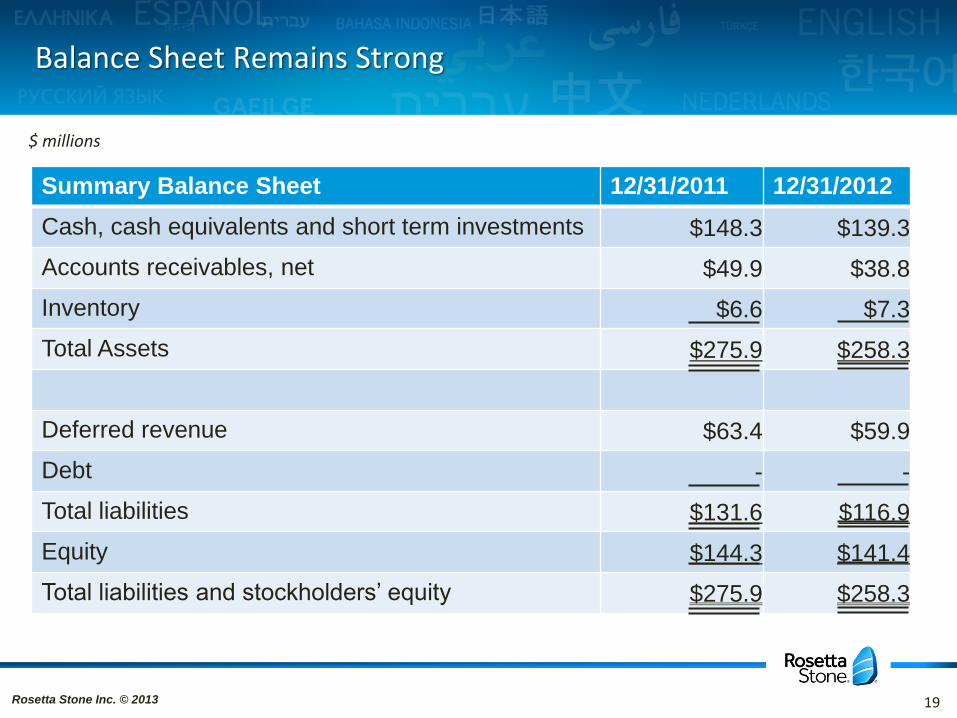
Summary Balance Sheet 12/31/2011 12/31/2012
Cash, cash equivalents and short term investments $148.3 $139.3
Accounts receivables, net $49.9 $38.8
Inventory $6.6 $7.3
Total Assets $275.9 $258.3
Deferred revenue $63.4 $59.9
Debt - -
Total liabilities $131.6 $116.9
Equity $144.3 $141.4
Total liabilities and stockholders’ equity $275.9 $258.3
$ millions
Balance Sheet Remains Strong
Rosetta Stone Inc. © 2013 19
Rosetta Stone Inc. © 2013
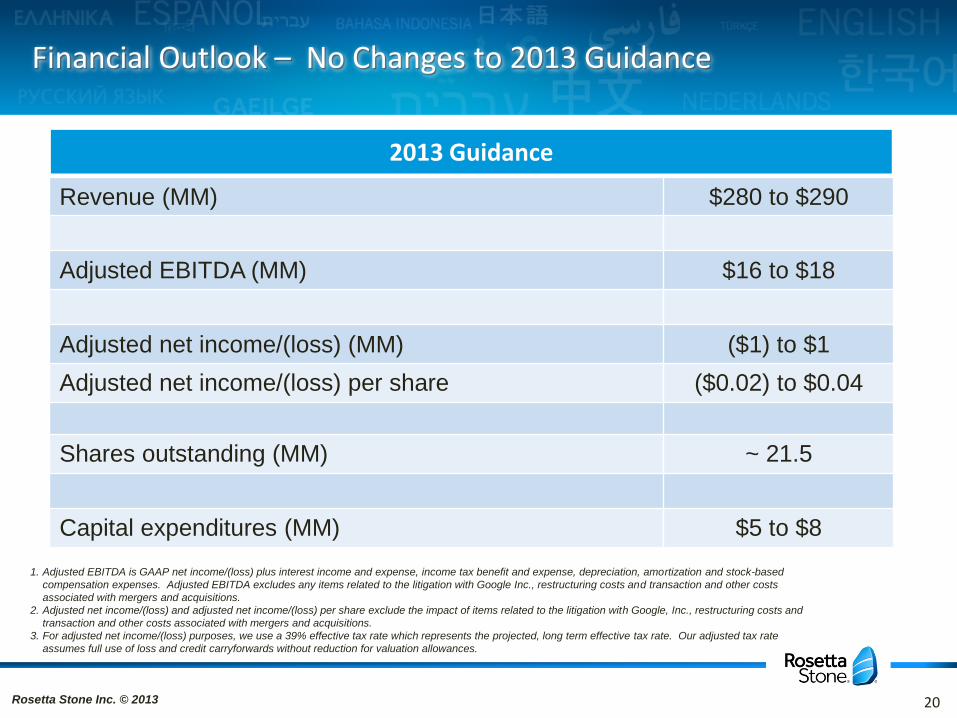
Financial Outlook – No Changes to 2013 Guidance
1. Adjusted EBITDA is GAAP net income/(loss) plus interest income and expense, income tax benefit and expense, depreciation, amortization and stock-based
compensation expenses. Adjusted EBITDA excludes any items related to the litigation with Google Inc., restructuring costs and transaction and other costs
associated with mergers and acquisitions.
2. Adjusted net income/(loss) and adjusted net income/(loss) per share exclude the impact of items related to the litigation with Google, Inc., restructuring costs and
transaction and other costs associated with mergers and acquisitions.
3. For adjusted net income/(loss) purposes, we use a 39% effective tax rate which represents the projected, long term effective tax rate. Our adjusted tax rate
assumes full use of loss and credit carryforwards without reduction for valuation allowances.
Revenue (MM) $280 to $290
Adjusted EBITDA (MM) $16 to $18
Adjusted net income/(loss) (MM) ($1) to $1
Adjusted net income/(loss) per share ($0.02) to $0.04
Shares outstanding (MM) ~ 21.5
Capital expenditures (MM) $5 to $8
2013 Guidance
20