Embed Size (px)
Citation preview
Robust estimation and forecasting of thelong-term seasonal component (LTSC) of
electricity spot prices
Jakub Nowotarski, Jakub Tomczyk, Rafał Weron
Wrocław University of Technology
Essen, 9 October 2013
Based on J. Nowotarski, J. Tomczyk, R. Weron (2013) Robust estimation and forecasting ofthe long-term seasonal component of electricity spot prices, Energy Economics 39, 13-27
Financed by NCN grant no. 2011/01/B/HS4/01077
Jakub Nowotarski, Jakub Tomczyk, Rafał Weron Robust estimation and forecasting of the LTSC

Introduction
When building electricity spot price models weshould address two questions:
How to estimate the trend-seasonal component?How to forecast it?
Why?
Jakub Nowotarski, Jakub Tomczyk, Rafał Weron Robust estimation and forecasting of the LTSC
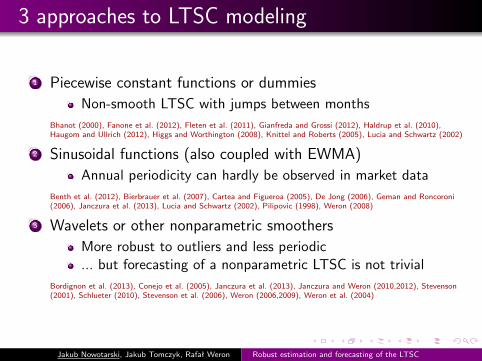
3 approaches to LTSC modeling
1 Piecewise constant functions or dummiesNon-smooth LTSC with jumps between months
Bhanot (2000), Fanone et al. (2012), Fleten et al. (2011), Gianfreda and Grossi (2012), Haldrup et al. (2010),Haugom and Ullrich (2012), Higgs and Worthington (2008), Knittel and Roberts (2005), Lucia and Schwartz (2002)
2 Sinusoidal functions (also coupled with EWMA)Annual periodicity can hardly be observed in market data
Benth et al. (2012), Bierbrauer et al. (2007), Cartea and Figueroa (2005), De Jong (2006), Geman and Roncoroni(2006), Janczura et al. (2013), Lucia and Schwartz (2002), Pilipovic (1998), Weron (2008)
3 Wavelets or other nonparametric smoothersMore robust to outliers and less periodic... but forecasting of a nonparametric LTSC is not trivial
Bordignon et al. (2013), Conejo et al. (2005), Janczura et al. (2013), Janczura and Weron (2010,2012), Stevenson(2001), Schlueter (2010), Stevenson et al. (2006), Weron (2006,2009), Weron et al. (2004)
Jakub Nowotarski, Jakub Tomczyk, Rafał Weron Robust estimation and forecasting of the LTSC
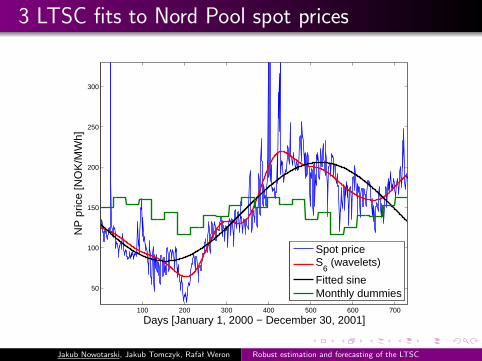
3 LTSC fits to Nord Pool spot prices
100 200 300 400 500 600 700
50
100
150
200
250
300
Days [January 1, 2000 − December 30, 2001]
NP
pric
e [N
OK
/MW
h]
Spot priceS
6 (wavelets)
Fitted sineMonthly dummies
Jakub Nowotarski, Jakub Tomczyk, Rafał Weron Robust estimation and forecasting of the LTSC

3 stochastic components (residuals)
0 100 200 300 400 500 600 7000
200
400Wavelet−based residuals
0 100 200 300 400 500 600 7000
200
400Sine−based residuals
0 100 200 300 400 500 600 7000
200
400Dummies−based residuals
Jakub Nowotarski, Jakub Tomczyk, Rafał Weron Robust estimation and forecasting of the LTSC
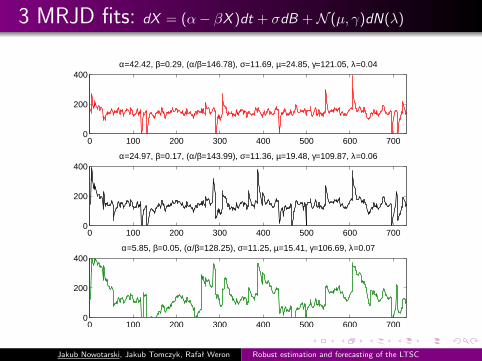
3 MRJD fits: dX = (α− βX )dt + σdB +N (µ, γ)dN(λ)
0 100 200 300 400 500 600 7000
200
400α=42.42, β=0.29, (α/β=146.78), σ=11.69, µ=24.85, γ=121.05, λ=0.04
0 100 200 300 400 500 600 7000
200
400α=24.97, β=0.17, (α/β=143.99), σ=11.36, µ=19.48, γ=109.87, λ=0.06
0 100 200 300 400 500 600 7000
200
400α=5.85, β=0.05, (α/β=128.25), σ=11.25, µ=15.41, γ=106.69, λ=0.07
Jakub Nowotarski, Jakub Tomczyk, Rafał Weron Robust estimation and forecasting of the LTSC

Agenda
Introduction
Datasets and modelsEstimating and forecasting the LTSC
Results
Conclusions
Jakub Nowotarski, Jakub Tomczyk, Rafał Weron Robust estimation and forecasting of the LTSC
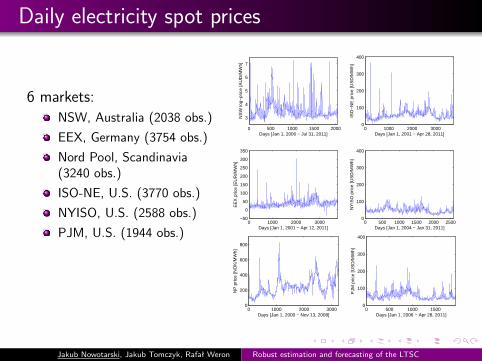
Daily electricity spot prices
6 markets:NSW, Australia (2038 obs.)
EEX, Germany (3754 obs.)
Nord Pool, Scandinavia(3240 obs.)
ISO-NE, U.S. (3770 obs.)
NYISO, U.S. (2588 obs.)
PJM, U.S. (1944 obs.)
0 500 1000 1500 2000
3
4
5
6
7
Days [Jan 1, 2006 − Jul 31, 2011]
NS
W lo
g−pr
ice
[AU
D/M
Wh]
0 1000 2000 30000
100
200
300
400
Days [Jan 1, 2001 − Apr 28, 2011]
ISO
−N
E p
rice
[US
D/M
Wh]
0 1000 2000 3000−50
0
50
100
150
200
250
300
350
Days [Jan 1, 2001 − Apr 12, 2011]E
EX
pric
e [E
UR
/MW
h]
0 500 1000 1500 2000 25000
100
200
300
400
Days [Jan 1, 2004 − Jan 31, 2011]
NY
ISO
pric
e [U
SD
/MW
h]
0 1000 2000 30000
200
400
600
800
Days [Jan 1, 2000 − Nov 13, 2008]
NP
pric
e [N
OK
/MW
h]
0 500 1000 15000
100
200
300
400
Days [Jan 1, 2006 − Apr 28, 2011]
PJM
pric
e [U
SD
/MW
h]Jakub Nowotarski, Jakub Tomczyk, Rafał Weron Robust estimation and forecasting of the LTSC
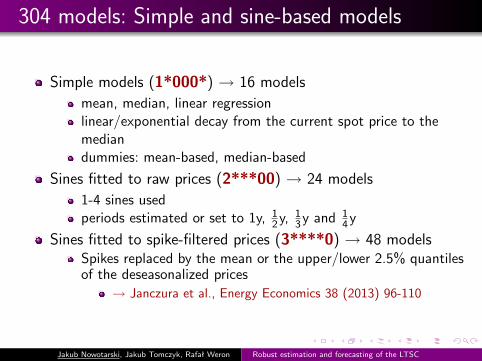
304 models: Simple and sine-based models
Simple models (1*000*) → 16 modelsmean, median, linear regressionlinear/exponential decay from the current spot price to themediandummies: mean-based, median-based
Sines fitted to raw prices (2***00) → 24 models1-4 sines usedperiods estimated or set to 1y, 12y, 13y and 14y
Sines fitted to spike-filtered prices (3****0) → 48 modelsSpikes replaced by the mean or the upper/lower 2.5% quantilesof the deseasonalized prices
→ Janczura et al., Energy Economics 38 (2013) 96-110
Jakub Nowotarski, Jakub Tomczyk, Rafał Weron Robust estimation and forecasting of the LTSC

304 models: Wavelet-based models
Wavelets with an exponential decay to the median fitted to rawprices (4***0*) → 48 models
4 types of wavelets (Daubechies, Coiflets)3 approximation levels (6, 7, 8)2 exponential decay constants
Wavelets with a linear decay to the median fitted to raw prices(5***00) → 24 modelsWavelets with an exponential decay to the median fitted tospike-filtered prices (6*****) → 96 models
Spikes replaced by the mean or the upper/lower 2.5% quantilesof the deseasonalized prices
Wavelets with an exponential decay to the median fitted tospike-filtered prices (7****0) → 48 models
Jakub Nowotarski, Jakub Tomczyk, Rafał Weron Robust estimation and forecasting of the LTSC
Agenda
Introduction
Datasets and models
Estimating and forecasting the LTSCResults
Conclusions
Jakub Nowotarski, Jakub Tomczyk, Rafał Weron Robust estimation and forecasting of the LTSC
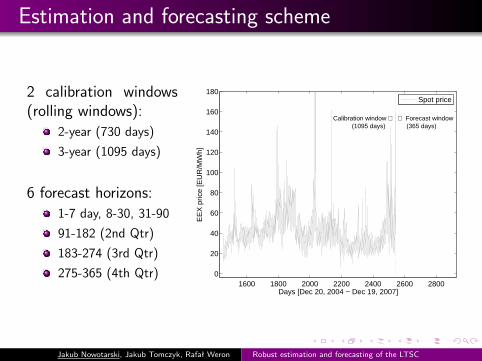
Estimation and forecasting scheme
2 calibration windows(rolling windows):
2-year (730 days)
3-year (1095 days)
6 forecast horizons:1-7 day, 8-30, 31-90
91-182 (2nd Qtr)
183-274 (3rd Qtr)
275-365 (4th Qtr)1600 1800 2000 2200 2400 2600 2800
0
20
40
60
80
100
120
140
160
180
Days [Dec 20, 2004 − Dec 19, 2007]
EE
X p
rice
[EU
R/M
Wh]
Calibration window ⇐ (1095 days)
⇒ Forecast window (365 days)
Spot price
Jakub Nowotarski, Jakub Tomczyk, Rafał Weron Robust estimation and forecasting of the LTSC
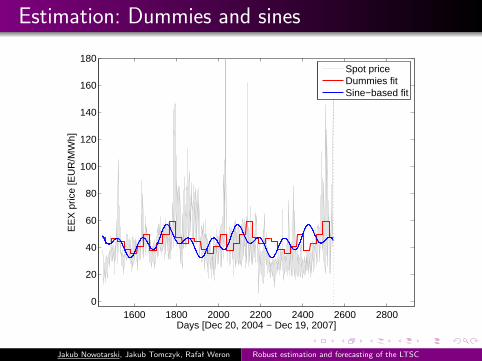
Estimation: Dummies and sines
1600 1800 2000 2200 2400 2600 28000
20
40
60
80
100
120
140
160
180
Days [Dec 20, 2004 − Dec 19, 2007]
EE
X p
rice
[EU
R/M
Wh]
Spot priceDummies fitSine−based fit
Jakub Nowotarski, Jakub Tomczyk, Rafał Weron Robust estimation and forecasting of the LTSC
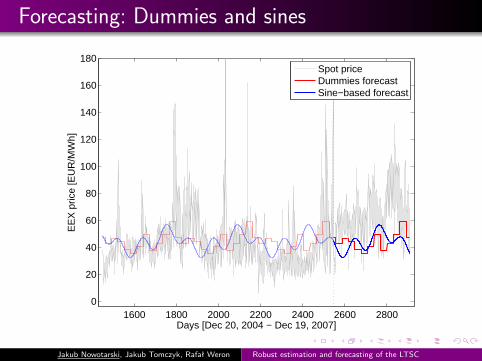
Forecasting: Dummies and sines
1600 1800 2000 2200 2400 2600 28000
20
40
60
80
100
120
140
160
180
Days [Dec 20, 2004 − Dec 19, 2007]
EE
X p
rice
[EU
R/M
Wh]
Spot priceDummies forecastSine−based forecast
Jakub Nowotarski, Jakub Tomczyk, Rafał Weron Robust estimation and forecasting of the LTSC

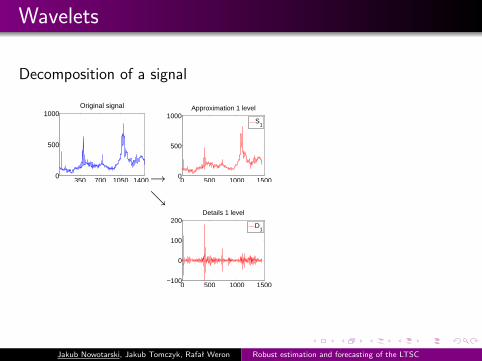
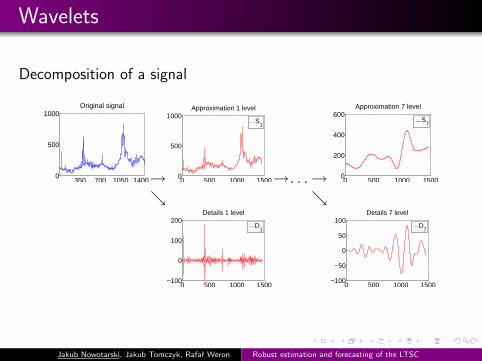
Wavelets
Decomposition of a signal
350 700 1050 14000
500
1000Original signal
→ 0 500 1000 15000
500
1000Approximation 1 level
S1
→. . .→ 0 500 1000 15000
200
400
600Approximation 7 level
S7
↘ ↘
0 500 1000 1500−100
0
100
200Details 1 level
D1
0 500 1000 1500−100
−50
0
50
100Details 7 level
D7
Jakub Nowotarski, Jakub Tomczyk, Rafał Weron Robust estimation and forecasting of the LTSC
Wavelets
Decomposition of a signal
350 700 1050 14000
500
1000Original signal
→ 0 500 1000 15000
500
1000Approximation 1 level
S1
→. . .→ 0 500 1000 15000
200
400
600Approximation 7 level
S7
↘
↘
0 500 1000 1500−100
0
100
200Details 1 level
D1
0 500 1000 1500−100
−50
0
50
100Details 7 level
D7
Jakub Nowotarski, Jakub Tomczyk, Rafał Weron Robust estimation and forecasting of the LTSC
Wavelets
Decomposition of a signal
350 700 1050 14000
500
1000Original signal
→ 0 500 1000 15000
500
1000Approximation 1 level
S1
→. . .→ 0 500 1000 15000
200
400
600Approximation 7 level
S7
↘ ↘
0 500 1000 1500−100
0
100
200Details 1 level
D1
0 500 1000 1500−100
−50
0
50
100Details 7 level
D7
Jakub Nowotarski, Jakub Tomczyk, Rafał Weron Robust estimation and forecasting of the LTSC
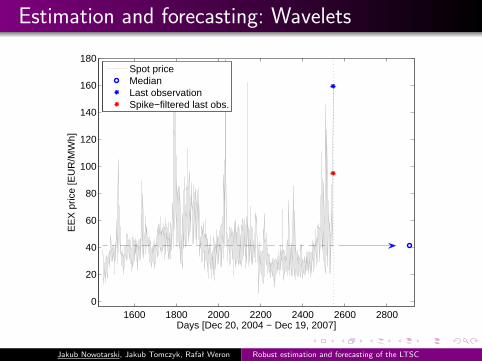
Estimation and forecasting: Wavelets
1600 1800 2000 2200 2400 2600 28000
20
40
60
80
100
120
140
160
180
Days [Dec 20, 2004 − Dec 19, 2007]
EE
X p
rice
[EU
R/M
Wh]
Spot priceMedianLast observationSpike−filtered last obs.
Jakub Nowotarski, Jakub Tomczyk, Rafał Weron Robust estimation and forecasting of the LTSC
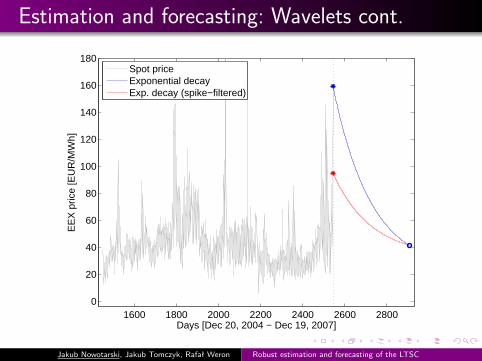
Estimation and forecasting: Wavelets cont.
1600 1800 2000 2200 2400 2600 28000
20
40
60
80
100
120
140
160
180
Days [Dec 20, 2004 − Dec 19, 2007]
EE
X p
rice
[EU
R/M
Wh]
Spot priceExponential decayExp. decay (spike−filtered)
Jakub Nowotarski, Jakub Tomczyk, Rafał Weron Robust estimation and forecasting of the LTSC
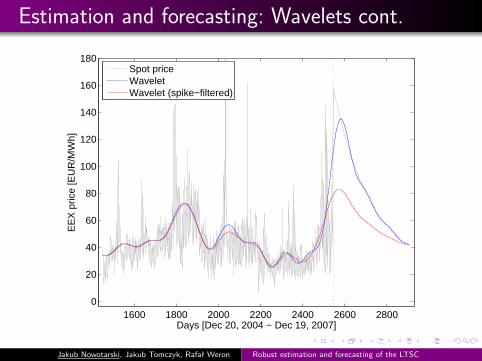
Estimation and forecasting: Wavelets cont.
1600 1800 2000 2200 2400 2600 28000
20
40
60
80
100
120
140
160
180
Days [Dec 20, 2004 − Dec 19, 2007]
EE
X p
rice
[EU
R/M
Wh]
Spot priceWaveletWavelet (spike−filtered)
Jakub Nowotarski, Jakub Tomczyk, Rafał Weron Robust estimation and forecasting of the LTSC
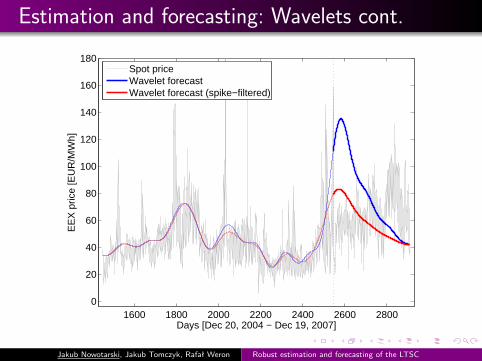
Estimation and forecasting: Wavelets cont.
1600 1800 2000 2200 2400 2600 28000
20
40
60
80
100
120
140
160
180
Days [Dec 20, 2004 − Dec 19, 2007]
EE
X p
rice
[EU
R/M
Wh]
Spot priceWavelet forecastWavelet forecast (spike−filtered)
Jakub Nowotarski, Jakub Tomczyk, Rafał Weron Robust estimation and forecasting of the LTSC

Agenda
Introduction
Datasets and models
Estimating and forecasting the LTSC
ResultsConclusions
Jakub Nowotarski, Jakub Tomczyk, Rafał Weron Robust estimation and forecasting of the LTSC

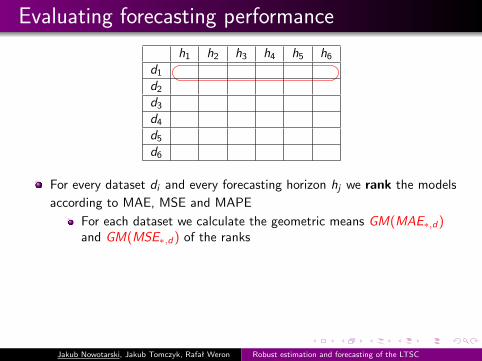
Evaluating forecasting performance
h1 h2 h3 h4 h5 h6d1d2d3d4d5d6
For every dataset di and every forecasting horizon hj we rank the modelsaccording to MAE, MSE and MAPE
For each dataset we calculate the geometric means GM(MAE∗,d)and GM(MSE∗,d) of the ranksFor each horizon we calculate the geometric means GM(MAEh,∗)and GM(MSEh,∗) of the ranksWe also calculate the global geometric means GM(MAE∗,∗) andGM(MSE∗,∗) of the ranks
Finally, we calculate MAPE∗,d , MAPEh,∗ and the global MAPE∗,∗
Jakub Nowotarski, Jakub Tomczyk, Rafał Weron Robust estimation and forecasting of the LTSC
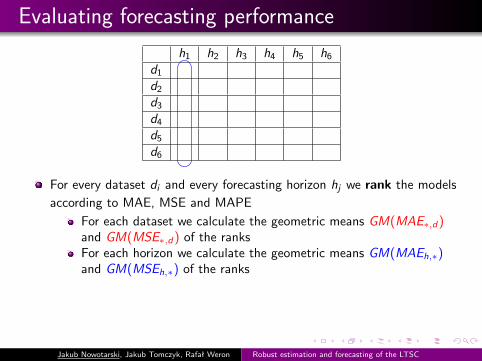
Evaluating forecasting performance
h1 h2 h3 h4 h5 h6d1d2d3d4d5d6
For every dataset di and every forecasting horizon hj we rank the modelsaccording to MAE, MSE and MAPE
For each dataset we calculate the geometric means GM(MAE∗,d)and GM(MSE∗,d) of the ranks
For each horizon we calculate the geometric means GM(MAEh,∗)and GM(MSEh,∗) of the ranksWe also calculate the global geometric means GM(MAE∗,∗) andGM(MSE∗,∗) of the ranks
Finally, we calculate MAPE∗,d , MAPEh,∗ and the global MAPE∗,∗
Jakub Nowotarski, Jakub Tomczyk, Rafał Weron Robust estimation and forecasting of the LTSC
Evaluating forecasting performance
h1 h2 h3 h4 h5 h6d1d2d3d4d5d6
For every dataset di and every forecasting horizon hj we rank the modelsaccording to MAE, MSE and MAPE
For each dataset we calculate the geometric means GM(MAE∗,d)and GM(MSE∗,d) of the ranksFor each horizon we calculate the geometric means GM(MAEh,∗)and GM(MSEh,∗) of the ranks
We also calculate the global geometric means GM(MAE∗,∗) andGM(MSE∗,∗) of the ranks
Finally, we calculate MAPE∗,d , MAPEh,∗ and the global MAPE∗,∗
Jakub Nowotarski, Jakub Tomczyk, Rafał Weron Robust estimation and forecasting of the LTSC

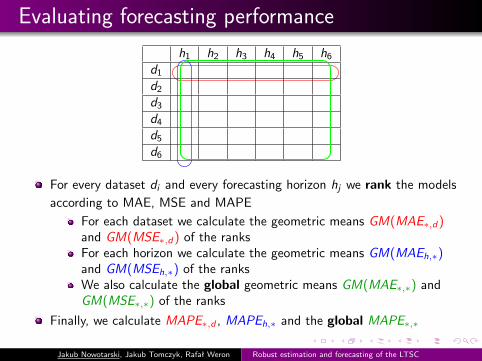
Evaluating forecasting performance
h1 h2 h3 h4 h5 h6d1d2d3d4d5d6
For every dataset di and every forecasting horizon hj we rank the modelsaccording to MAE, MSE and MAPE
For each dataset we calculate the geometric means GM(MAE∗,d)and GM(MSE∗,d) of the ranksFor each horizon we calculate the geometric means GM(MAEh,∗)and GM(MSEh,∗) of the ranksWe also calculate the global geometric means GM(MAE∗,∗) andGM(MSE∗,∗) of the ranks
Finally, we calculate MAPE∗,d , MAPEh,∗ and the global MAPE∗,∗
Jakub Nowotarski, Jakub Tomczyk, Rafał Weron Robust estimation and forecasting of the LTSC
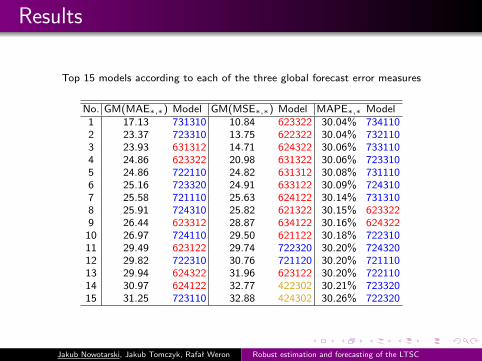
Results
Top 15 models according to each of the three global forecast error measures
No. GM(MAE∗,∗) Model GM(MSE∗,∗) Model MAPE∗,∗ Model1 17.13 731310 10.84 623322 30.04% 7341102 23.37 723310 13.75 622322 30.04% 7321103 23.93 631312 14.71 624322 30.06% 7331104 24.86 623322 20.98 631322 30.06% 7233105 24.86 722110 24.82 631312 30.08% 7311106 25.16 723320 24.91 633122 30.09% 7243107 25.58 721110 25.63 624122 30.14% 7313108 25.91 724310 25.82 621322 30.15% 6233229 26.44 623312 28.87 634122 30.16% 62432210 26.97 724110 29.50 621122 30.18% 72231011 29.49 623122 29.74 722320 30.20% 72432012 29.82 722310 30.76 721120 30.20% 72111013 29.94 624322 31.96 623122 30.20% 72211014 30.97 624122 32.77 422302 30.21% 72332015 31.25 723110 32.88 424302 30.26% 722320
Jakub Nowotarski, Jakub Tomczyk, Rafał Weron Robust estimation and forecasting of the LTSC
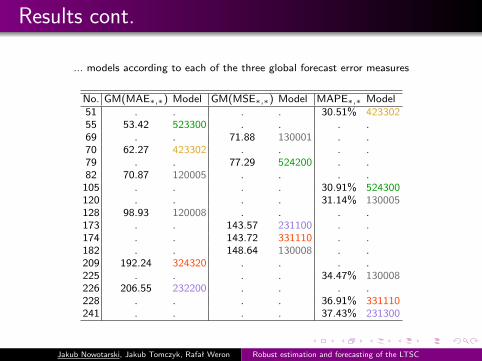
Results cont.
... models according to each of the three global forecast error measures
No. GM(MAE∗,∗) Model GM(MSE∗,∗) Model MAPE∗,∗ Model51 . . . . 30.51% 42330255 53.42 523300 . . . .69 . . 71.88 130001 . .70 62.27 423302 . . . .79 . . 77.29 524200 . .82 70.87 120005 . . . .105 . . . . 30.91% 524300120 . . . . 31.14% 130005128 98.93 120008 . . . .173 . . 143.57 231100 . .174 . . 143.72 331110 . .182 . . 148.64 130008 . .209 192.24 324320 . . . .225 . . . . 34.47% 130008226 206.55 232200 . . . .228 . . . . 36.91% 331110241 . . . . 37.43% 231300
Jakub Nowotarski, Jakub Tomczyk, Rafał Weron Robust estimation and forecasting of the LTSC

Results cont.
The number oftimes models from agiven family areranked in the top 5,20 and 50 of all 304models according toGM(MAEh,∗),GM(MSEh,∗) andMAPEh,∗ for eachof the six forecasthorizons h = 1,...,6
1 2 3 4 5 6 70
5
10
15
#tim
es in
"to
p 5"
GM(MAEh,*
)
1 2 3 4 5 6 70
15
30
45#t
imes
in "
top
20"
1 2 3 4 5 6 70
30
60
90
Model class
#tim
es in
"to
p 50
"
1 2 3 4 5 6 70
5
10
15
GM(MSEh,*
)
1 2 3 4 5 6 70
15
30
45
1 2 3 4 5 6 70
30
60
90
Model class
1 2 3 4 5 6 70
5
10
15
MAPEh,*
1 2 3 4 5 6 70
15
30
45
1 2 3 4 5 6 70
30
60
90
Model class
Expected2 year3 year
Jakub Nowotarski, Jakub Tomczyk, Rafał Weron Robust estimation and forecasting of the LTSC
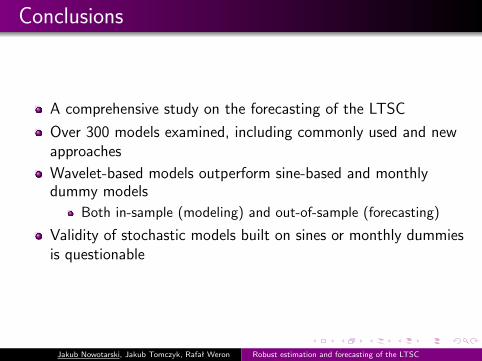
Conclusions
A comprehensive study on the forecasting of the LTSC
Over 300 models examined, including commonly used and newapproachesWavelet-based models outperform sine-based and monthlydummy models
Both in-sample (modeling) and out-of-sample (forecasting)
Validity of stochastic models built on sines or monthly dummiesis questionable
Jakub Nowotarski, Jakub Tomczyk, Rafał Weron Robust estimation and forecasting of the LTSC