Embed Size (px)
Citation preview
Nat. Hazards Earth Syst. Sci., 9, 2107–2118, 2009www.nat-hazards-earth-syst-sci.net/9/2107/2009/© Author(s) 2009. This work is distributed underthe Creative Commons Attribution 3.0 License.
Natural Hazardsand Earth
System Sciences
Rockfall travel distance analysis by using empirical models (Solad’Andorra la Vella, Central Pyrenees)
R. Copons1, J. M. Vilaplana2, and R. Linares3
1Georisc S.L.P. C/Dr. Gimbernat, 2, baixos 3, 43205 Reus, Catalonia, Spain2Risknat Research Group, Geodynamics and Geophysics Department, University of Barcelona, C/Martı Franques s.n., 08028Barcelona, Catalonia, Spain3Department of Geology (Geomorphology), Faculty of Science, Universitat Autonoma de Barcelona, 08193 Bellaterra(Cerdanyola del Valles), Catalonia, Spain
Received: 19 July 2005 – Revised: 24 September 2009 – Accepted: 4 November 2009 – Published: 14 December 2009
Abstract. The prediction of rockfall travel distance belowa rock cliff is an indispensable activity in rockfall suscep-tibility, hazard and risk assessment. Although the size ofthe detached rock mass may differ considerably at each spe-cific rock cliff, small rockfall (<100 m3) is the most frequentprocess. Empirical models may provide us with suitable in-formation for predicting the travel distance of small rock-falls over an extensive area at a medium scale (1:100 000–1:25 000). “Sola d’Andorra la Vella” is a rocky slope locatedclose to the town of Andorra la Vella, where the governmenthas been documenting rockfalls since 1999. This documen-tation consists in mapping the release point and the indi-vidual fallen blocks immediately after the event. The doc-umentation of historical rockfalls by morphological analysis,eye-witness accounts and historical images serve to increaseavailable information. In total, data from twenty small rock-falls have been gathered which reveal an amount of a hun-dred individual fallen rock blocks. The data acquired hasbeen used to check the reliability of the main empirical mod-els widely adopted (reach and shadow angle models) and toanalyse the influence of parameters which affecting the traveldistance (rockfall size, height of fall along the rock cliff andvolume of the individual fallen rock block). For predictingtravel distances in maps with medium scales, a method hasbeen proposed based on the “reach probability” concept. Theaccuracy of results has been tested from the line entailing thefarthest fallen boulders which represents the maximum traveldistance of past rockfalls. The paper concludes with a dis-cussion of the application of both empirical models to otherstudy areas.
Correspondence to:R. Copons([email protected])
1 Introduction
Rockfall is a slope process in which a rock mass detachesfrom a steep face of a rock cliff and descends extremely fastby falling and subsequently rolling, sliding and finally stop-ping (Varnes, 1978; Hutchinson, 1988; Cruden and Varnes,1996). Rock mass breaks up when impacting on the groundduring its descent. This breaking up produces individualrock blocks, or fragmental blocks, which move indepen-dently when the size of the detached rock mass is roughlyless than 105 m3 (Evans and Hungr, 1993).
Usually, sizes of detached rock mass range significantly ina rock cliff depending on the abundance and characteristicsof discontinuities (Rouiller et al., 1998; Dussuage-Peisser etal., 2002). Statistical analysis in database obtained in dif-ferent study areas reveals a heavy-tailed behaviour for thefrequency-size distribution (Dussuage-Peisser et al., 2002;Brunetti et al., 2009). Therefore, small rockfall (<100 m3)is the most frequent process in rockcliffs and is of particularinterest for hazard analysis and risk management, since suchevents could occurs on a span of time from years to decades.
A necessary step for rockfall hazard analysis is the delim-itation of the exposed area located below rock cliffs. Ele-ments at risk (i.e. urban areas, infrastructures, recreationalareas, etc.) are usually located below rock cliffs but not onthe same rock outcrop, therefore it is essential to establishaccurately the maximum rockfall travel distance. The lowerboundary can be established by a geomorphologic approachentailing the farthest fallen boulders from previous rockfalls(Copons, 2007; Copons and Vilaplana, 2008; Wieczorek etal., 2008) or forecasting maximum travel distance for futurerockfalls using heuristic, empirical or numerical models.
Published by Copernicus Publications on behalf of the European Geosciences Union.
2108 R. Copons et al.: Rockfall travel distance analysis by using empirical models
Several parameters (i.e. rockfall size, terrain elasticity androughness, etc.) involve the post-failure dynamic of rockfallsand contribute to travel distance. The type of model to be ap-plied for predicting travel distances will be chosen accordingto the extension of the study area, the mapping scale, the fi-nal purpose of the results and the available resources. Forareas of limited extent, the modern approach is to use com-puter codes applying these parameters numerically. Numeri-cal methods provide dynamic and cinematic results along therock block trajectories which are necessary to design protec-tive measures. Results have to be verified from past eventsincluded in a rockfall database. However, the practicalityof adopting numerical models undertaking extensive map-ping (thousands of km2) at medium scale (from 1:100 000to 1:25 000 according to Fell et al., 2008) could be uncertainbecause this demands intensive resources. In this case, em-pirical models, or statistical models (Soeters and Van Westen,1996), are easier to predict travel distances despite rough re-sults should be expected. Empirical models also require thepreparation of a database to be used by the statistical anal-ysis (Corominas, 1996; Finlay et al., 1999; Martin, 2008).There are two main basic empirical models widely adopted:the reach angle (Heim, 1932) and the shadow angle (Lied,1977; Evans and Hungr, 1993); nevertheless, empirical func-tions or values for predicting small rockfall travel distancesdiffer considerably.
The purpose of this paper is (i) to propose a method to pre-dict travel distance of small rockfalls (<100 m3) by using ba-sic empirical models (both reach and shadow angle models),(ii) to verify empirical results obtained, and (iii) to discussthe use of these results for other study areas. For accomplish-ing these purposes, a high quality database has been preparedin the study area of “Sola d’Andorra la Vella” (Andorra,Central Pyrenees) (henceforth Sola d’Andorra) (Figs. 1 and2) where the government is documenting rockfalls as soonas they occur (Copons et al., 2005; Copons, 2007). The dataacquired has been used for analyzing the possible presenceof parameters influencing rockfall travel distance, which isindispensable for checking the accuracy of the data acquiredand the limitations of the empirical results.
2 Main empirical statistical models: reach angle andshadow angle
An empirical model is based on data acquired in a studyarea which is analysed by statistical methods. Results canbe a function, or a single value, that can then predict rock-fall travel distances in the same study area, or at anothersite with similar conditions (Soeters and Van Westen, 1996).However, this does not attempt to explain rockfall behaviourduring the runout. If we assume that rockfall size and slopecharacteristics are constant over time, empirical models canpredict the travel distance of future rockfalls from the dataobtained of past events (Ayala-Carcedo et al., 2003). Empir-ical models are based on simplified assumptions in rockfall
scenarios and therefore have a margin of error that can beassumed and accepted in a work undertaken on an extensivearea at a medium scale.
In the literature, there are two main basic empirical modelswidely adopted for analysing the travel distance of rockfallsbased on geometrical approaches: the reach angle (Heim,1932; Shreve, 1968; Scheidegger, 1973; Hsu, 1975; Coromi-nas, 1996) and the shadow angle (Lied, 1977; Evans andHungr, 1993).
2.1 Reach angle model
Shreve (1968), Scheidegger (1973), and Hsu (1975) sug-gested the mobility indexH/L, whereH is the fall heightandL is the horizontal length of the landslide (Fig. 3). TheH/L ratio is equivalent to the arctangent of the dipping of theline connecting the rockfall source (scar) to the distal fallenrock block of a rockfall. This dip is known by several names:“Fahrboschung” angle (Heim, 1932), travel angle (Crudenand Varnes, 1996), reach angle (Corominas, 1996) and traveldistance angle (Hunter and Fell, 2003) amongst others.
The interpretation of the reach angle (A in Fig. 3) is basedon an energy line applied from the top of the rockfall sourceand dipping downslope. The rock block released from therock cliff will travel downslope with a kinetic energy equiv-alent to the height between slope surface and the energyline (Vaunat and Leroueil, 2002; Jaboyedoff and Labiouse,2003). The rock block stops at the intersection point of theenergy line with the topography where the energy has a valueof 0. Shreve (1968) and Scheidegger (1973) considered thatthe tangent of the reach angle is equivalent to the coefficientof friction of the ground surface where the rockfall slides.This tangent is the relationship between the vertical drop(H ) and the horizontal component of the travel distance (L)(Fig. 3). In this relationship, the longer the travel distance is,the lower the reach angle value will be (arctanH/L).
The reach angle method are widely adopted for rockavalanches (Scheidegger, 1973; Hsu, 1975; Erismann andAbele, 2001), rockfalls (Corominas, 1996; Petje et al., 2005),debris flows (Rickenmann, 1999), large landslides (Legros,2002) and small landslides in artificial slopes (Finlay et al.,1999).
2.2 Shadow angle model
The shadow angle (B in Fig. 3) is the dipping of the energyline which connects the farthest fallen boulder to the apex ofthe talus slope (Lied, 1977; Evans and Hungr., 1993). Geo-metrically, the shadow angle is the arctangent of the relation-shipHt/Lt (Fig. 3), whereHt is the height of fall on the talusslope (elevation difference between the apex of talus slopeand the farthest individual rock blocks of a rockfall) andLtis the travel distance on the talus slope (horizontal distancebetween the apex of talus slope and the farthest individualrock block of a rockfall).
Nat. Hazards Earth Syst. Sci., 9, 2107–2118, 2009 www.nat-hazards-earth-syst-sci.net/9/2107/2009/
R. Copons et al.: Rockfall travel distance analysis by using empirical models 2109
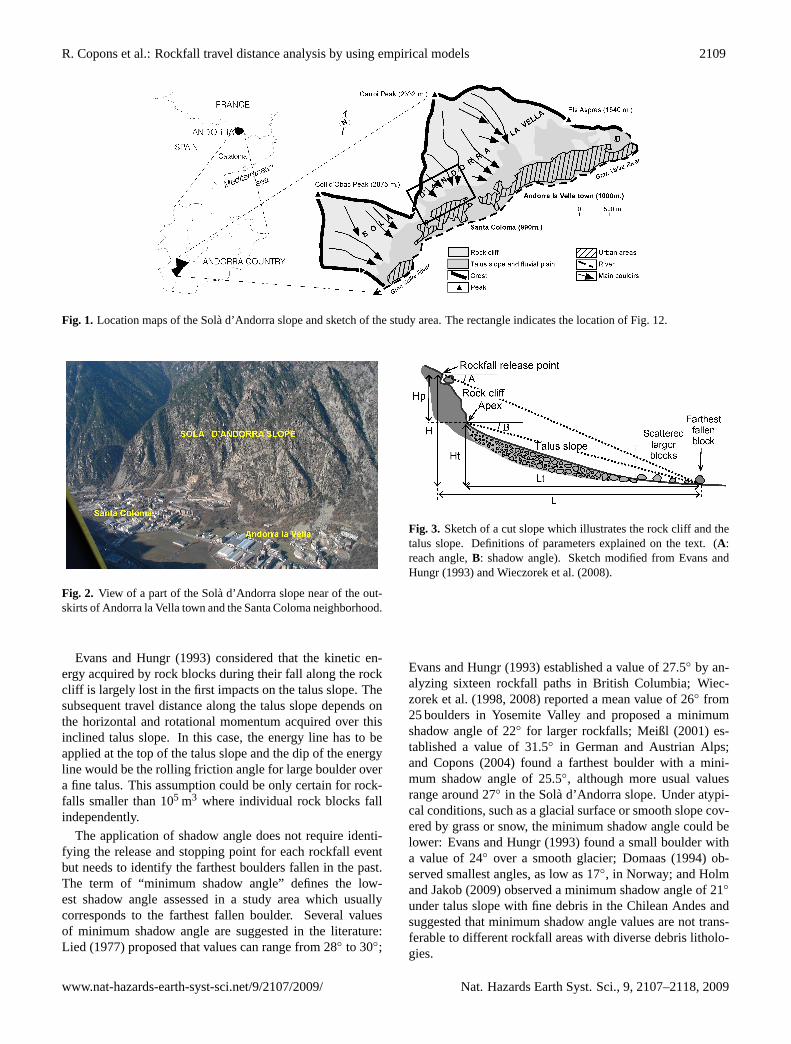
Fig. 1. Location maps of the Sola d’Andorra slope and sketch of the study area. The rectangle indicates the location of Fig. 12.
Fig. 2. View of a part of the Sola d’Andorra slope near of the out-skirts of Andorra la Vella town and the Santa Coloma neighborhood.
Evans and Hungr (1993) considered that the kinetic en-ergy acquired by rock blocks during their fall along the rockcliff is largely lost in the first impacts on the talus slope. Thesubsequent travel distance along the talus slope depends onthe horizontal and rotational momentum acquired over thisinclined talus slope. In this case, the energy line has to beapplied at the top of the talus slope and the dip of the energyline would be the rolling friction angle for large boulder overa fine talus. This assumption could be only certain for rock-falls smaller than 105 m3 where individual rock blocks fallindependently.
The application of shadow angle does not require identi-fying the release and stopping point for each rockfall eventbut needs to identify the farthest boulders fallen in the past.The term of “minimum shadow angle” defines the low-est shadow angle assessed in a study area which usuallycorresponds to the farthest fallen boulder. Several valuesof minimum shadow angle are suggested in the literature:Lied (1977) proposed that values can range from 28◦ to 30◦;
Fig. 3. Sketch of a cut slope which illustrates the rock cliff and thetalus slope. Definitions of parameters explained on the text. (A:reach angle,B: shadow angle). Sketch modified from Evans andHungr (1993) and Wieczorek et al. (2008).
Evans and Hungr (1993) established a value of 27.5◦ by an-alyzing sixteen rockfall paths in British Columbia; Wiec-zorek et al. (1998, 2008) reported a mean value of 26◦ from25 boulders in Yosemite Valley and proposed a minimumshadow angle of 22◦ for larger rockfalls; Meißl (2001) es-tablished a value of 31.5◦ in German and Austrian Alps;and Copons (2004) found a farthest boulder with a mini-mum shadow angle of 25.5◦, although more usual valuesrange around 27◦ in the Sola d’Andorra slope. Under atypi-cal conditions, such as a glacial surface or smooth slope cov-ered by grass or snow, the minimum shadow angle could belower: Evans and Hungr (1993) found a small boulder witha value of 24◦ over a smooth glacier; Domaas (1994) ob-served smallest angles, as low as 17◦, in Norway; and Holmand Jakob (2009) observed a minimum shadow angle of 21◦
under talus slope with fine debris in the Chilean Andes andsuggested that minimum shadow angle values are not trans-ferable to different rockfall areas with diverse debris litholo-gies.
www.nat-hazards-earth-syst-sci.net/9/2107/2009/ Nat. Hazards Earth Syst. Sci., 9, 2107–2118, 2009
2110 R. Copons et al.: Rockfall travel distance analysis by using empirical models
3 The study area and the rockfall database
The data used to support the analysis undertaken in thiswork has been acquired from both the documentation of re-cent rockfalls and the inventory of historical events at Solad’Andorra.
3.1 The Sola d’Andorra study area
Sola d’Andorra is a steep rock cliff located in a glaciallycarved valley in the country of Andorra (Figs. 1 and 2).“Sola” is a Catalan term that defines a high and sunny slopefacing south. The rock cliff exceeds 2000 m a.s.l., has aheight of 1200 m, covers an area of around 5 km2, and has alength of approximately 7.5 km. Rockfall is one of the mostdangerous phenomena. At the foot of the slope there are ex-tensive talus slope generated by rockfall dynamics. In talusslope, rock blocks display considerable volumes (from 0.01to 100 m3). Coarser boulders are located at the base of thetalus slope. Beyond the base of talus slope, largest bouldersare scattered over the fluvial plain.
The rock cliff contains a great amount of rockfall scars.One thousand of such rockfalls scars have been identifiedover a rock cliff surface of nearly 5 km2. The most frequentsize is smaller than 100 m3 (almost 90%). Some large rock-falls, which have about several thousands of cubic metres,and one rock avalanche have been identified (Copons, 2004).
Andorra la Vella, the capital of Andorra, is located close toSola of Andorra and several rockfalls have damaged a num-ber of buildings in recent years and infrastructures (Fig. 4).This prompted the Andorran Government to implement ac-tions in order to mitigate the risk (hazard zoning and regula-tions, protective structures, etc.) (Copons et al., 2005). Oneof these has been to document the recent rockfalls by meansof the Rockfall Surveillance Plan (Copons et al., 2005).
3.2 Rockfall documentation
Rockfall documentation consists in mapping on a1:1000 scale map (Fig. 5) the main rockfall character-istics immediately after the event such as scar, rockfalltrajectories and individual fallen rock blocks (position,volume, etc.). The size of the detached rock mass wasdetermined in different ways: (i) measuring the dimensionsof the scar if it is accessible, (ii) adding the volumes ofall individual fallen rock blocks, and (iii) comparing thedimensions of the scar to the nearest trees. Trajectories ofrockfall are reconstructed from the damaged vegetation andfrom impacts on the ground. Individual blocks are identifiedbecause of the freshly-broken surfaces and their volumes aremeasured.
From 1999 to 2008, approximately twenty rockfalls weredocumented in Sola d’Andorra. Fourteen rockfalls are se-lected for the empirical analysis undertaken in this work(see Table 1). Some of the documented rockfalls have been
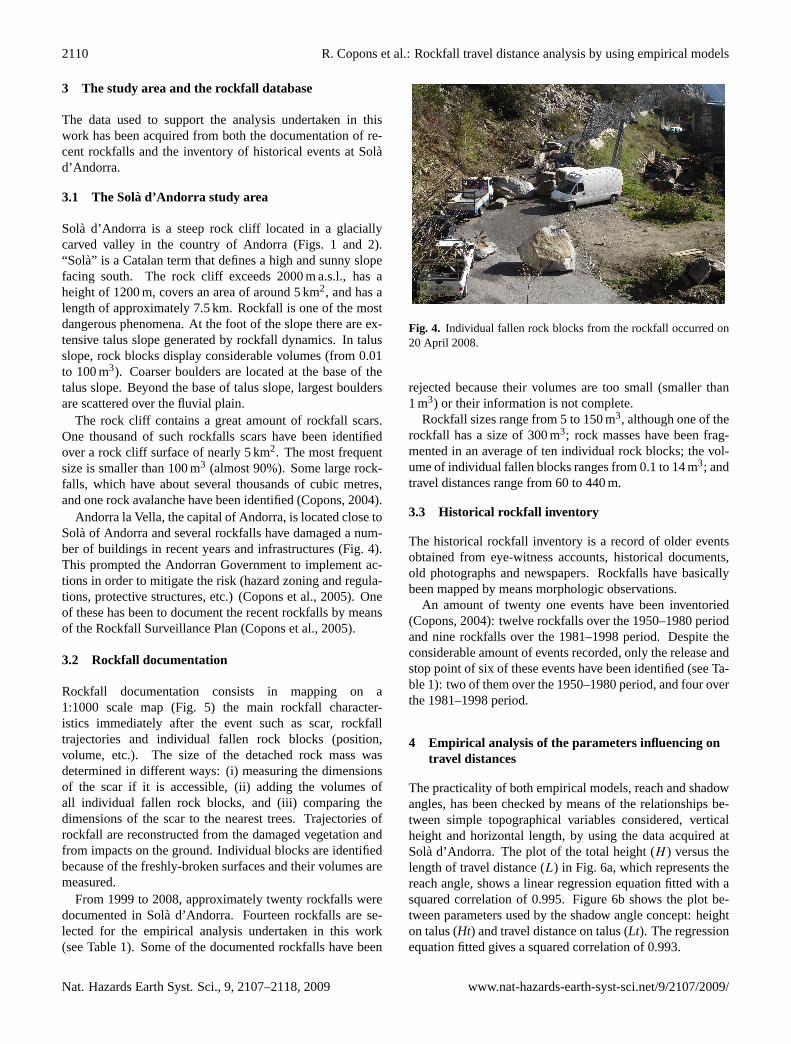
Fig. 4. Individual fallen rock blocks from the rockfall occurred on20 April 2008.
rejected because their volumes are too small (smaller than1 m3) or their information is not complete.
Rockfall sizes range from 5 to 150 m3, although one of therockfall has a size of 300 m3; rock masses have been frag-mented in an average of ten individual rock blocks; the vol-ume of individual fallen blocks ranges from 0.1 to 14 m3; andtravel distances range from 60 to 440 m.
3.3 Historical rockfall inventory
The historical rockfall inventory is a record of older eventsobtained from eye-witness accounts, historical documents,old photographs and newspapers. Rockfalls have basicallybeen mapped by means morphologic observations.
An amount of twenty one events have been inventoried(Copons, 2004): twelve rockfalls over the 1950–1980 periodand nine rockfalls over the 1981–1998 period. Despite theconsiderable amount of events recorded, only the release andstop point of six of these events have been identified (see Ta-ble 1): two of them over the 1950–1980 period, and four overthe 1981–1998 period.
4 Empirical analysis of the parameters influencing ontravel distances
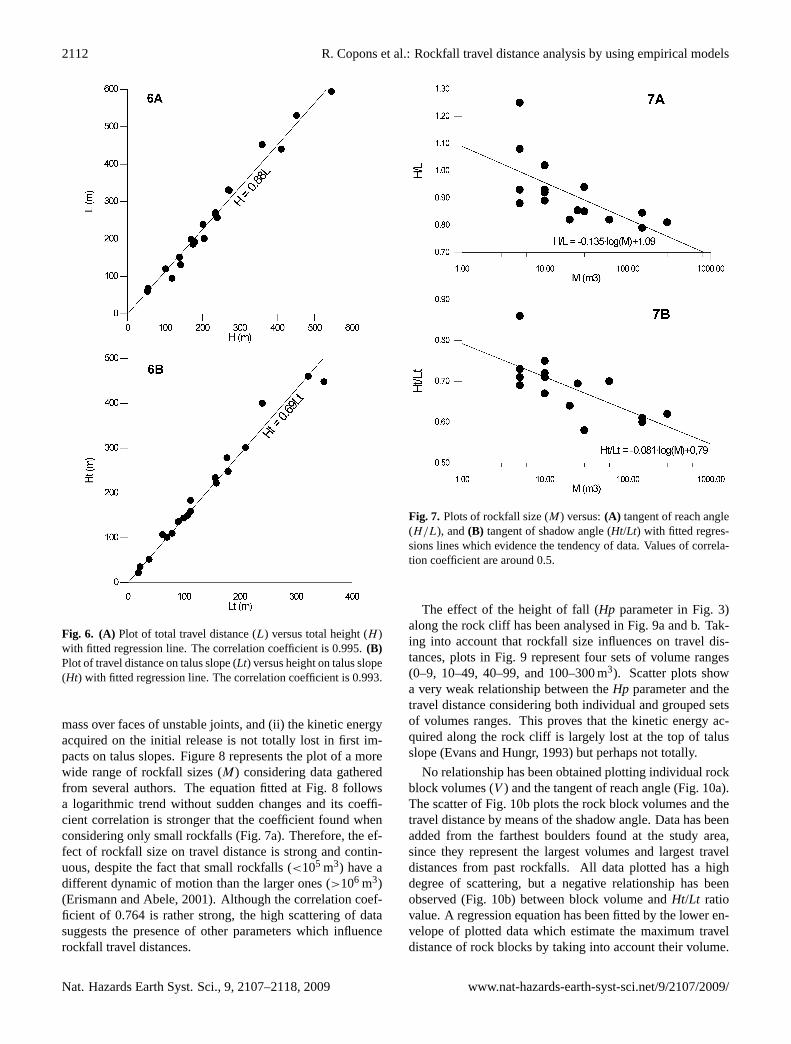
The practicality of both empirical models, reach and shadowangles, has been checked by means of the relationships be-tween simple topographical variables considered, verticalheight and horizontal length, by using the data acquired atSola d’Andorra. The plot of the total height (H ) versus thelength of travel distance (L) in Fig. 6a, which represents thereach angle, shows a linear regression equation fitted with asquared correlation of 0.995. Figure 6b shows the plot be-tween parameters used by the shadow angle concept: heighton talus (Ht) and travel distance on talus (Lt). The regressionequation fitted gives a squared correlation of 0.993.
Nat. Hazards Earth Syst. Sci., 9, 2107–2118, 2009 www.nat-hazards-earth-syst-sci.net/9/2107/2009/
R. Copons et al.: Rockfall travel distance analysis by using empirical models 2111
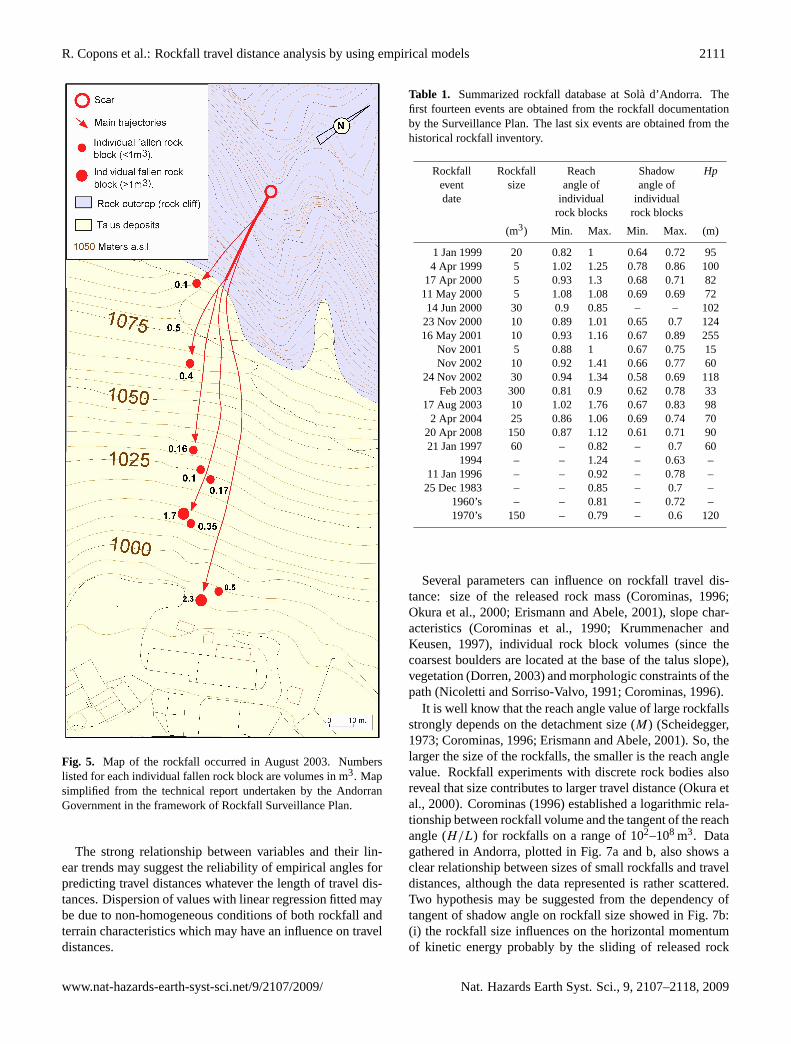
Fig. 5. Map of the rockfall occurred in August 2003. Numberslisted for each individual fallen rock block are volumes in m3. Mapsimplified from the technical report undertaken by the AndorranGovernment in the framework of Rockfall Surveillance Plan.
The strong relationship between variables and their lin-ear trends may suggest the reliability of empirical angles forpredicting travel distances whatever the length of travel dis-tances. Dispersion of values with linear regression fitted maybe due to non-homogeneous conditions of both rockfall andterrain characteristics which may have an influence on traveldistances.
Table 1. Summarized rockfall database at Sola d’Andorra. Thefirst fourteen events are obtained from the rockfall documentationby the Surveillance Plan. The last six events are obtained from thehistorical rockfall inventory.
Rockfall Rockfall Reach Shadow Hpevent size angle of angle ofdate individual individual
rock blocks rock blocks
(m3) Min. Max. Min. Max. (m)
1 Jan 1999 20 0.82 1 0.64 0.72 954 Apr 1999 5 1.02 1.25 0.78 0.86 100
17 Apr 2000 5 0.93 1.3 0.68 0.71 8211 May 2000 5 1.08 1.08 0.69 0.69 7214 Jun 2000 30 0.9 0.85 – – 102
23 Nov 2000 10 0.89 1.01 0.65 0.7 12416 May 2001 10 0.93 1.16 0.67 0.89 255
Nov 2001 5 0.88 1 0.67 0.75 15Nov 2002 10 0.92 1.41 0.66 0.77 60
24 Nov 2002 30 0.94 1.34 0.58 0.69 118Feb 2003 300 0.81 0.9 0.62 0.78 33
17 Aug 2003 10 1.02 1.76 0.67 0.83 982 Apr 2004 25 0.86 1.06 0.69 0.74 70
20 Apr 2008 150 0.87 1.12 0.61 0.71 9021 Jan 1997 60 – 0.82 – 0.7 60
1994 – – 1.24 – 0.63 –11 Jan 1996 – – 0.92 – 0.78 –25 Dec 1983 – – 0.85 – 0.7 –
1960’s – – 0.81 – 0.72 –1970’s 150 – 0.79 – 0.6 120
Several parameters can influence on rockfall travel dis-tance: size of the released rock mass (Corominas, 1996;Okura et al., 2000; Erismann and Abele, 2001), slope char-acteristics (Corominas et al., 1990; Krummenacher andKeusen, 1997), individual rock block volumes (since thecoarsest boulders are located at the base of the talus slope),vegetation (Dorren, 2003) and morphologic constraints of thepath (Nicoletti and Sorriso-Valvo, 1991; Corominas, 1996).
It is well know that the reach angle value of large rockfallsstrongly depends on the detachment size (M) (Scheidegger,1973; Corominas, 1996; Erismann and Abele, 2001). So, thelarger the size of the rockfalls, the smaller is the reach anglevalue. Rockfall experiments with discrete rock bodies alsoreveal that size contributes to larger travel distance (Okura etal., 2000). Corominas (1996) established a logarithmic rela-tionship between rockfall volume and the tangent of the reachangle (H/L) for rockfalls on a range of 102–108 m3. Datagathered in Andorra, plotted in Fig. 7a and b, also shows aclear relationship between sizes of small rockfalls and traveldistances, although the data represented is rather scattered.Two hypothesis may be suggested from the dependency oftangent of shadow angle on rockfall size showed in Fig. 7b:(i) the rockfall size influences on the horizontal momentumof kinetic energy probably by the sliding of released rock
www.nat-hazards-earth-syst-sci.net/9/2107/2009/ Nat. Hazards Earth Syst. Sci., 9, 2107–2118, 2009
2112 R. Copons et al.: Rockfall travel distance analysis by using empirical models
Fig. 6. (A) Plot of total travel distance (L) versus total height (H )with fitted regression line. The correlation coefficient is 0.995.(B)Plot of travel distance on talus slope (Lt) versus height on talus slope(Ht) with fitted regression line. The correlation coefficient is 0.993.
mass over faces of unstable joints, and (ii) the kinetic energyacquired on the initial release is not totally lost in first im-pacts on talus slopes. Figure 8 represents the plot of a morewide range of rockfall sizes (M) considering data gatheredfrom several authors. The equation fitted at Fig. 8 followsa logarithmic trend without sudden changes and its coeffi-cient correlation is stronger that the coefficient found whenconsidering only small rockfalls (Fig. 7a). Therefore, the ef-fect of rockfall size on travel distance is strong and contin-uous, despite the fact that small rockfalls (<105 m3) have adifferent dynamic of motion than the larger ones (>106 m3)(Erismann and Abele, 2001). Although the correlation coef-ficient of 0.764 is rather strong, the high scattering of datasuggests the presence of other parameters which influencerockfall travel distances.
Fig. 7. Plots of rockfall size (M) versus:(A) tangent of reach angle(H/L), and(B) tangent of shadow angle (Ht/Lt) with fitted regres-sions lines which evidence the tendency of data. Values of correla-tion coefficient are around 0.5.
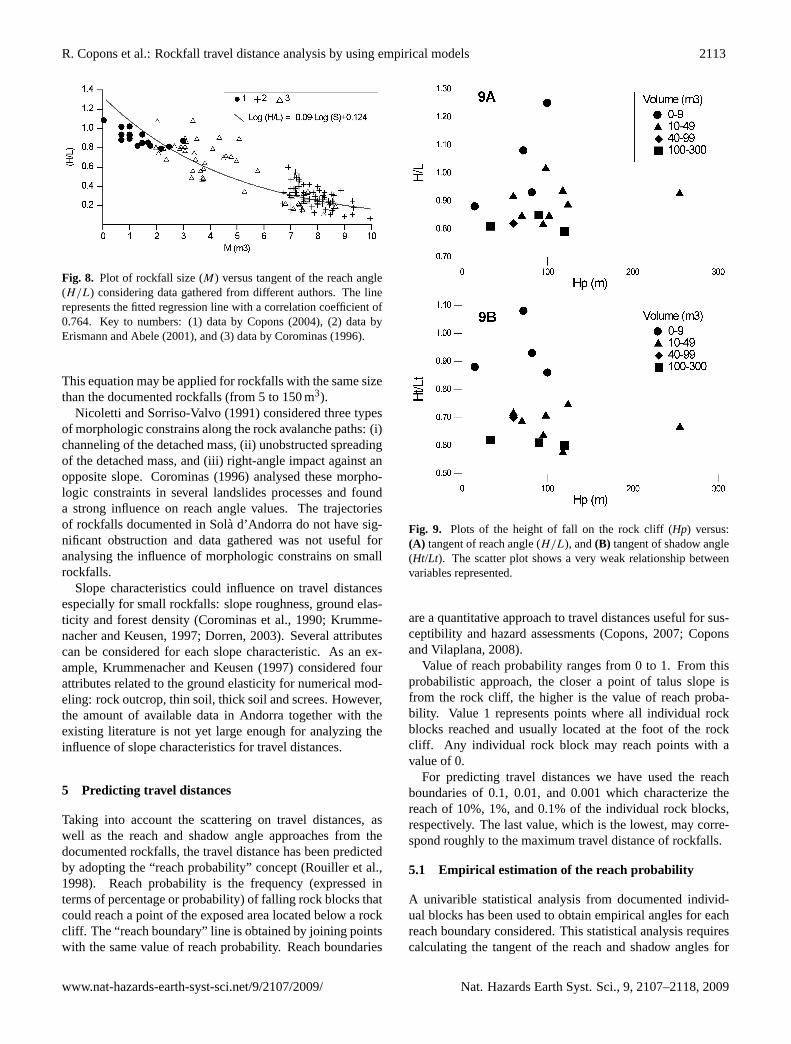
The effect of the height of fall (Hp parameter in Fig. 3)along the rock cliff has been analysed in Fig. 9a and b. Tak-ing into account that rockfall size influences on travel dis-tances, plots in Fig. 9 represent four sets of volume ranges(0–9, 10–49, 40–99, and 100–300 m3). Scatter plots showa very weak relationship between theHp parameter and thetravel distance considering both individual and grouped setsof volumes ranges. This proves that the kinetic energy ac-quired along the rock cliff is largely lost at the top of talusslope (Evans and Hungr, 1993) but perhaps not totally.
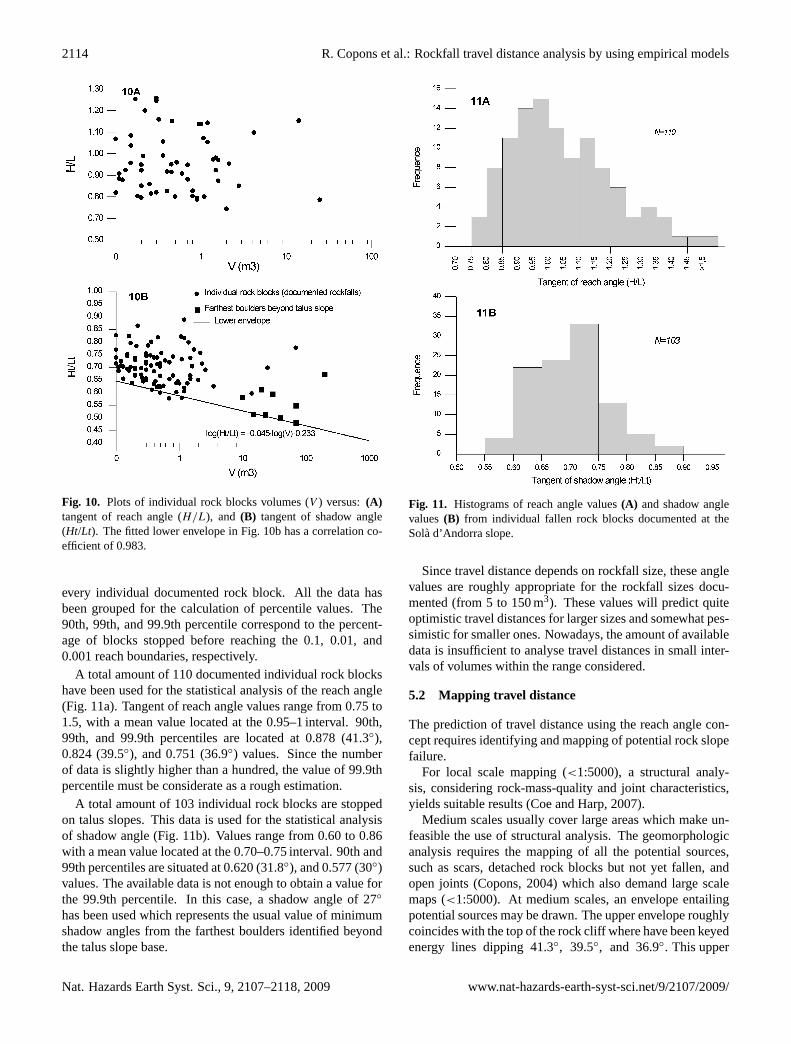
No relationship has been obtained plotting individual rockblock volumes (V ) and the tangent of reach angle (Fig. 10a).The scatter of Fig. 10b plots the rock block volumes and thetravel distance by means of the shadow angle. Data has beenadded from the farthest boulders found at the study area,since they represent the largest volumes and largest traveldistances from past rockfalls. All data plotted has a highdegree of scattering, but a negative relationship has beenobserved (Fig. 10b) between block volume andHt/Lt ratiovalue. A regression equation has been fitted by the lower en-velope of plotted data which estimate the maximum traveldistance of rock blocks by taking into account their volume.
Nat. Hazards Earth Syst. Sci., 9, 2107–2118, 2009 www.nat-hazards-earth-syst-sci.net/9/2107/2009/
R. Copons et al.: Rockfall travel distance analysis by using empirical models 2113
Fig. 8. Plot of rockfall size (M) versus tangent of the reach angle(H/L) considering data gathered from different authors. The linerepresents the fitted regression line with a correlation coefficient of0.764. Key to numbers: (1) data by Copons (2004), (2) data byErismann and Abele (2001), and (3) data by Corominas (1996).
This equation may be applied for rockfalls with the same sizethan the documented rockfalls (from 5 to 150 m3).
Nicoletti and Sorriso-Valvo (1991) considered three typesof morphologic constrains along the rock avalanche paths: (i)channeling of the detached mass, (ii) unobstructed spreadingof the detached mass, and (iii) right-angle impact against anopposite slope. Corominas (1996) analysed these morpho-logic constraints in several landslides processes and founda strong influence on reach angle values. The trajectoriesof rockfalls documented in Sola d’Andorra do not have sig-nificant obstruction and data gathered was not useful foranalysing the influence of morphologic constrains on smallrockfalls.
Slope characteristics could influence on travel distancesespecially for small rockfalls: slope roughness, ground elas-ticity and forest density (Corominas et al., 1990; Krumme-nacher and Keusen, 1997; Dorren, 2003). Several attributescan be considered for each slope characteristic. As an ex-ample, Krummenacher and Keusen (1997) considered fourattributes related to the ground elasticity for numerical mod-eling: rock outcrop, thin soil, thick soil and screes. However,the amount of available data in Andorra together with theexisting literature is not yet large enough for analyzing theinfluence of slope characteristics for travel distances.
5 Predicting travel distances
Taking into account the scattering on travel distances, aswell as the reach and shadow angle approaches from thedocumented rockfalls, the travel distance has been predictedby adopting the “reach probability” concept (Rouiller et al.,1998). Reach probability is the frequency (expressed interms of percentage or probability) of falling rock blocks thatcould reach a point of the exposed area located below a rockcliff. The “reach boundary” line is obtained by joining pointswith the same value of reach probability. Reach boundaries
Fig. 9. Plots of the height of fall on the rock cliff (Hp) versus:(A) tangent of reach angle (H/L), and(B) tangent of shadow angle(Ht/Lt). The scatter plot shows a very weak relationship betweenvariables represented.
are a quantitative approach to travel distances useful for sus-ceptibility and hazard assessments (Copons, 2007; Coponsand Vilaplana, 2008).
Value of reach probability ranges from 0 to 1. From thisprobabilistic approach, the closer a point of talus slope isfrom the rock cliff, the higher is the value of reach proba-bility. Value 1 represents points where all individual rockblocks reached and usually located at the foot of the rockcliff. Any individual rock block may reach points with avalue of 0.
For predicting travel distances we have used the reachboundaries of 0.1, 0.01, and 0.001 which characterize thereach of 10%, 1%, and 0.1% of the individual rock blocks,respectively. The last value, which is the lowest, may corre-spond roughly to the maximum travel distance of rockfalls.
5.1 Empirical estimation of the reach probability
A univarible statistical analysis from documented individ-ual blocks has been used to obtain empirical angles for eachreach boundary considered. This statistical analysis requirescalculating the tangent of the reach and shadow angles for
www.nat-hazards-earth-syst-sci.net/9/2107/2009/ Nat. Hazards Earth Syst. Sci., 9, 2107–2118, 2009
2114 R. Copons et al.: Rockfall travel distance analysis by using empirical models
Fig. 10. Plots of individual rock blocks volumes (V ) versus:(A)tangent of reach angle (H/L), and (B) tangent of shadow angle(Ht/Lt). The fitted lower envelope in Fig. 10b has a correlation co-efficient of 0.983.
every individual documented rock block. All the data hasbeen grouped for the calculation of percentile values. The90th, 99th, and 99.9th percentile correspond to the percent-age of blocks stopped before reaching the 0.1, 0.01, and0.001 reach boundaries, respectively.
A total amount of 110 documented individual rock blockshave been used for the statistical analysis of the reach angle(Fig. 11a). Tangent of reach angle values range from 0.75 to1.5, with a mean value located at the 0.95–1 interval. 90th,99th, and 99.9th percentiles are located at 0.878 (41.3◦),0.824 (39.5◦), and 0.751 (36.9◦) values. Since the numberof data is slightly higher than a hundred, the value of 99.9thpercentile must be considerate as a rough estimation.
A total amount of 103 individual rock blocks are stoppedon talus slopes. This data is used for the statistical analysisof shadow angle (Fig. 11b). Values range from 0.60 to 0.86with a mean value located at the 0.70–0.75 interval. 90th and99th percentiles are situated at 0.620 (31.8◦), and 0.577 (30◦)values. The available data is not enough to obtain a value forthe 99.9th percentile. In this case, a shadow angle of 27◦
has been used which represents the usual value of minimumshadow angles from the farthest boulders identified beyondthe talus slope base.
Fig. 11. Histograms of reach angle values(A) and shadow anglevalues(B) from individual fallen rock blocks documented at theSola d’Andorra slope.
Since travel distance depends on rockfall size, these anglevalues are roughly appropriate for the rockfall sizes docu-mented (from 5 to 150 m3). These values will predict quiteoptimistic travel distances for larger sizes and somewhat pes-simistic for smaller ones. Nowadays, the amount of availabledata is insufficient to analyse travel distances in small inter-vals of volumes within the range considered.
5.2 Mapping travel distance
The prediction of travel distance using the reach angle con-cept requires identifying and mapping of potential rock slopefailure.
For local scale mapping (<1:5000), a structural analy-sis, considering rock-mass-quality and joint characteristics,yields suitable results (Coe and Harp, 2007).
Medium scales usually cover large areas which make un-feasible the use of structural analysis. The geomorphologicanalysis requires the mapping of all the potential sources,such as scars, detached rock blocks but not yet fallen, andopen joints (Copons, 2004) which also demand large scalemaps (<1:5000). At medium scales, an envelope entailingpotential sources may be drawn. The upper envelope roughlycoincides with the top of the rock cliff where have been keyedenergy lines dipping 41.3◦, 39.5◦, and 36.9◦. This upper
Nat. Hazards Earth Syst. Sci., 9, 2107–2118, 2009 www.nat-hazards-earth-syst-sci.net/9/2107/2009/
R. Copons et al.: Rockfall travel distance analysis by using empirical models 2115
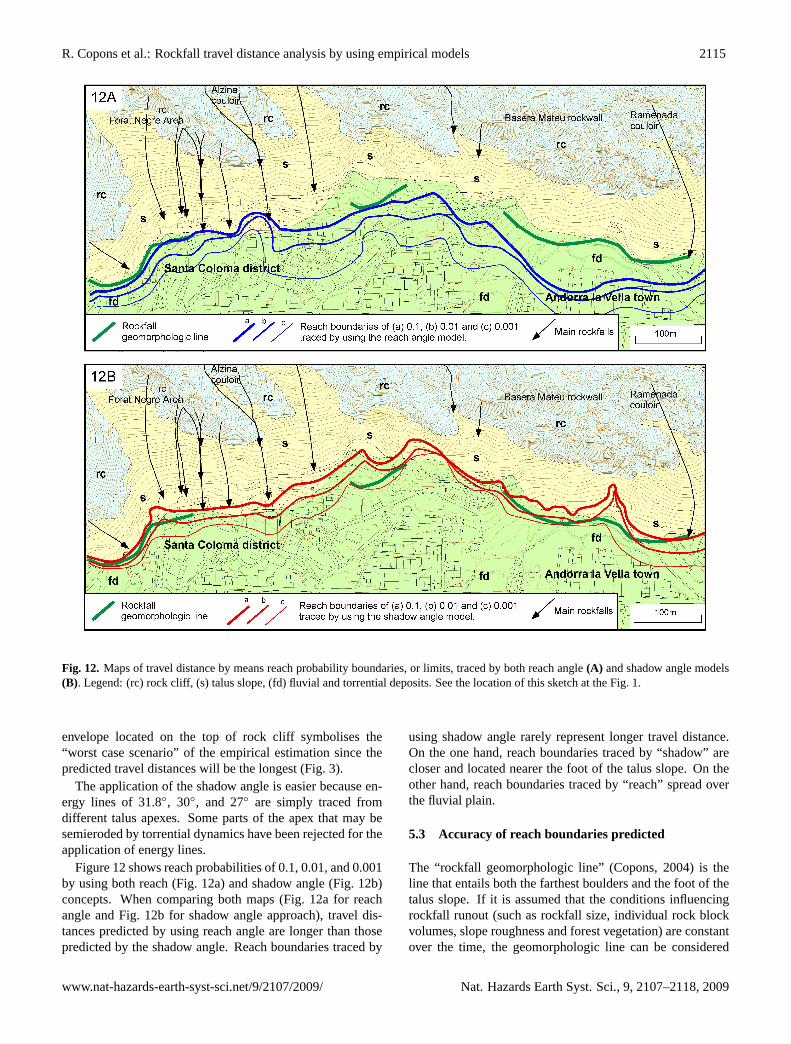
Fig. 12. Maps of travel distance by means reach probability boundaries, or limits, traced by both reach angle(A) and shadow angle models(B). Legend: (rc) rock cliff, (s) talus slope, (fd) fluvial and torrential deposits. See the location of this sketch at the Fig. 1.
envelope located on the top of rock cliff symbolises the“worst case scenario” of the empirical estimation since thepredicted travel distances will be the longest (Fig. 3).
The application of the shadow angle is easier because en-ergy lines of 31.8◦, 30◦, and 27◦ are simply traced fromdifferent talus apexes. Some parts of the apex that may besemieroded by torrential dynamics have been rejected for theapplication of energy lines.
Figure 12 shows reach probabilities of 0.1, 0.01, and 0.001by using both reach (Fig. 12a) and shadow angle (Fig. 12b)concepts. When comparing both maps (Fig. 12a for reachangle and Fig. 12b for shadow angle approach), travel dis-tances predicted by using reach angle are longer than thosepredicted by the shadow angle. Reach boundaries traced by
using shadow angle rarely represent longer travel distance.On the one hand, reach boundaries traced by “shadow” arecloser and located nearer the foot of the talus slope. On theother hand, reach boundaries traced by “reach” spread overthe fluvial plain.
5.3 Accuracy of reach boundaries predicted
The “rockfall geomorphologic line” (Copons, 2004) is theline that entails both the farthest boulders and the foot of thetalus slope. If it is assumed that the conditions influencingrockfall runout (such as rockfall size, individual rock blockvolumes, slope roughness and forest vegetation) are constantover the time, the geomorphologic line can be considered
www.nat-hazards-earth-syst-sci.net/9/2107/2009/ Nat. Hazards Earth Syst. Sci., 9, 2107–2118, 2009

2116 R. Copons et al.: Rockfall travel distance analysis by using empirical models
as the envelope of future rockfall maximum travel distances.Therefore, the geomorphologic line has been used to verifythe accuracy of reach probability boundaries traced by bothempirical models (reach and shadow angle).
Sola d’Andorra has similar characteristics to a typicalrockfall scenario (Rapp, 1960; Evans and Hungr, 1993;Wieczorek et al., 2008): (i) an extensive talus slope locatedbelow the rock cliff, (ii) an area with the largest scatteredboulders over a fluvial plain located beyond the base of thetalus, and (iii) a fluvial plain without any geomorphologic ev-idence of rockfalls. However, part of the talus slope foot hasbeen altered by old quarries and the outskirts of the “Andorrala Vella” town are settled in the area with the largest scatteredboulders. So, development has erased a large part of the far-thest rockfall deposits and only some sections of the rockfallgeomorphologic line has been able to be drawn (Fig. 12).
None of the documented rockfalls crossed sections of thegeomorphologic line. Reach boundaries traced by shadowangle are located close to the rockfall geomorphologic line,whereas reach boundaries traced by reach angle are locatedfurther and usually over the fluvial plain without rockfall ev-idences. Therefore, the reach angle model, applied on thetop of a rock cliff, may predict an excessive travel distance,whereas the shadow angle model may be more suitable sinceit shows more acceptable results.
5.4 Performance of empirical models
The rockfall database at Sola d’Andorra yields high qualityinformation for checking the use of empirical models usedto predict the exposed area as well as providing empiricalvalues for reach boundaries. However, the wide range ofminimum shadow angle values existing in the literature (seeSect. 2.2) proves that the results obtained at Sola d’Andorraare not directly applicable to the overall rockfall scenariosas a general rule. It should be taken into account that Solad’Andorra represents large screes with a mean “angle of re-pose” (Carson, 1977) of approximately 34◦. For mature andstable talus slopes, the angle of repose ranges from 32◦ to 36◦
and the exact value will depend on slope conditions such asthe size, shape and roughness of the debris (Goudie, 2004).Therefore, the location of the apex could be rather arbitraryin areas with talus slopes not matured enough; in these cases,shadow angle values obtained in this work cannot be di-rectely transferable (Guzzetti el al., 2003).
In areas with immatured talus slopes, the appropriate taskwould be the preparation of a rockfall database. However, itis difficult to obtain sufficient number of cases for determin-ing empirical values for reach boundaries as events must berecent enough to allow for the identification of both sourceand fallen rock blocks (Hungr et al., 2005). In this case, anabsolute maximum travel distance for future rockfalls maybe assessed by the minimum shadow angle approach fromthe recognition of farthest boulders over the terrain.
If the study area is devoid of talus slopes then the reachangle model is needed. In this case, a geomorphologic anal-ysis of the rock cliff is required in order to identify poten-tial rockfall sources and to determine potential rockfall sizes.The suitable angle of reach could be selected from regressionequations fitted in Sect. 3 (Fig. 8). It should also be borne inmind that the small amount of data in the existing databaseas yet impedes us obtaining regression equations applicableas a rule for the overall slope characteristics. Therefore, itis necessary to consider a large oversimplification of thesecharacteristics and to assume a certain error.
6 Conclusions
The travel distance of small rockfalls (<100 m3) has beenanalysed by using the main basic empirical models existingin the literature: reach and shadow angle models. The reasonfor adopting these models is that they are easier to handlein the application “energy lines” to predict travel distancesdespite their rough results. Hence, empirical models are suit-able tools for predicting travel distances in extensive areas atmedium scales (from 1:100 000 to 1:25 000). However, therequirement of a consistent database, which includes a sig-nificant number of data indispensable for the statistical anal-ysis, proves difficult to achieve the accurate use of empiricalmodels.
Nevertheless, at Sola d’Andorra, a rockfall database withhigh quality information has been achieved by the contin-uous documentation of rockfall events and the inventory ofhistorical rockfalls. Six historical rockfalls, which occurredbetween 1950 and 1998, and fourteen rockfall events doc-umented since 1999, provide a sufficient amount of preciseinformation for the empirical analysis and for proposing em-pirical values to predict travel distances.
A logarithmic regression is fitted from small rockfalls doc-umented in Andorra and from those of larger rockfalls exist-ing in the literature by using the reach angle model concept.This regression equation which covers a huge range of sizes,from 5 to 108 m3, verifies a strong and constant influence ofthe detached rock mass size on travel distances. Moreover,the volume of individual rock blocks, which comes from thefragmentation of the detached rock mass, could have a sec-ondary influence on travel distance. No relationship has beendetected between the height of fall over the rock cliff and thetravel distance. These results give evidence that the horizon-tal momentum of kinetic energy acquired in the first move-ment of the rockfall release may influence on the travel dis-tance of individual fallen rock blocks. Nevertheless, the ver-tical momentum of kinetic energy acquired at the fall alongthe rock cliff is largely lost in the first impacts on talus slope.
Travel distance has been predicted by using the “reachprobability” concept which is the frequency, expressed interms of probability, of individual fallen rock blocks thatcould reach a point located below a rock cliff. The “reach
Nat. Hazards Earth Syst. Sci., 9, 2107–2118, 2009 www.nat-hazards-earth-syst-sci.net/9/2107/2009/

R. Copons et al.: Rockfall travel distance analysis by using empirical models 2117
boundary” line is obtained by joining points with the samevalue of reach probability. Reach probabilities of 0.1, 0.01,and 0.001 have been used for analyzing and mapping traveldistances. Result of the basic statistical analysis achievedprovides reach angles values of 41.3◦, 39.5◦, and 36.9◦, andshadow angles of 31.8◦, 30◦, and 27◦, to the 0.1, 0.01, and0.001 reach probabilities, respectively. The adoption of the“reach probability” concept described in this paper repre-sents advancement in the prediction of travel distances byusing empirical models.
The line entailing the farthest boulders, here known as the“rockfall geomorphologic line”, has been used to verify theaccuracy of reach probability boundaries. The verificationreveals that the shadow angle model yields results more suit-able in our study area characterized by a mature talus slope.Results by using the reach angle approach, where energylines are applied from the top of rock cliff, predicts exces-sive travel distance.
Empirical results obtained at Sola d’Andorra are not di-rectly transferable to other rockfalls scenarios. In areas withmature talus slopes, the literature differs on the “minimumshadow angle” because slope characteristics strongly influ-ence on travel distances. In areas where the talus slope isnot mature enough, the location of the apex could be arbi-trary and the prediction of travel distances by using unveri-fied shadow angle values could be inaccurate. In areas with-out talus slopes, the reach angle approach is needed to pre-dict travel distances and this requires identifying potentialrockfall sources over the rock cliff and having suitable em-pirical values according to the local characteristics (expectedrockfall sizes, forest vegetation, terrain roughness, groundelasticity and morphologic constrains). Further advances inthe application of basic empirical models in large areas arenecessary and will require the preparation of a consistentdatabase made from studies undertaken of overall of rockfallscenarios.
Acknowledgements.The Andorran Ministry for Land Use andPublic Works (Andorran Government) supported rockfall doc-umentation undertaken at Sola d’Andorra. Authors gratefullyacknowledge Euroconsult Andorra S.A. Company which nowadaysis documenting rockfalls events. This research has been carriedin the framework of the project SAXUM with reference number2008ITT00004 (Work Community of the Pyrenees: Catalonia andAndorra). We are grateful to Thomas Glade for his helpful andeditorial handling. Comments from anonymous reviewers helpedto improve the original manuscript.
Edited by: T. GladeReviewed by: two anonymous referees
References
Ayala-Carcedo, F.J., Cubillo-Nielsen, S., Alvarez, A., Domınguez,M., Laın, L., Laın, R., and Ortiz, G.: Large Scale Rockfall ReachSusceptibility Maps in La Cabrera Sierra (Madrid) performed
with GIS and Dynamic Analysis at 1:5000, Nat. Hazards, 30(3),325–340, 2003.
Brunetti, M. T., Guzzetti, F., and Rossi, M.: Probability distri-butions of landslide volumes, Nonlin. Processes Geophys., 16,179–188, 2009,http://www.nonlin-processes-geophys.net/16/179/2009/.
Carson, M. A.: Angles of repose, angles of shearing resistance andangles of talus slopes, Earth Surf. Proc. Land., 4(2), 363–380,1977.
Coe, J. A. and Harp, E. L.: Influence of tectonic folding on rockfallsusceptibility, American Fork Canyon, Utah, USA, Nat. HazardsEarth Syst. Sci., 7, 1–14, 2007,http://www.nat-hazards-earth-syst-sci.net/7/1/2007/.
Copons, R.: Avaluacio de la perillositat de caigudes de blocs aAndorra la Vella (Principat d’Andorra). Department of Geodi-namycs and Geophysics, University of Barcelona, Ph.D. thesis,244 pp., 12 plates, 2004 (in Catalan).
Copons, R.: Avaluacio de la perillositat de caigudes de blocs ro-cosos al Sola d’Andorra la Vella, Andorra Research Institute,St. Julia de Loria, Principality of Andorra, 214 pp., 2007 (inCatalan).
Copons, R., Vilaplana, J. M., Corominas, J., Altimir, J., and Amigo,J.: Rockfall hazard management policy in urban areas: the An-dorran experience, in: Landslide Hazard and Risk, edited by:Glade, T., Anderson, M., and Crozier, M., John Wiley & SonsPress, Chichester, 675–698, 2005.
Copons, R. and Vilaplana, J. M.: Rockfall susceptibility zoning ata large scale: From geomorphological inventory to preliminaryland use planning, Eng. Geol., 102, 142–151, 2008.
Corominas, J.: The angle of reach as a mobility index for small andlarge landslides, Can. Geotech. J., 33, 260–271, 1996.
Corominas, J; Esgleas, J., and Baeza, C.: Risk mapping in the Pyre-nees area: a case Study, in: Hidrology in mountains regions, IIIAHS, 194, 425–428, 1990.
Cruden, D. M. and Varnes, D. J.: Landslide types and processes,in: Landslides. Investigation and Mitigation, edited by: Tuner,A. K. and Schuster, R. L., Special report of the TransportationResearch Brand. Natural Research Council, National AcademyPress, Washington DC, 36–75, 1996.
Domaas, U.: Geometrical methods of calculating rockfall range,Norwegian Geotechnical Institute, Report 585910-1, 21 pp.,1994.
Dorren, L.: A review of rockfall mechanics and modelling ap-proaches, Prog. Phys. Geog., 27(1), 69–87, 2003.
Dussauge-Peisser, C., Helmstetter, A., Grasso, J.-R., Hantz, D.,Desvarreux, P., Jeannin, M., and Giraud, A.: Probabilistic ap-proach to rock fall hazard assessment: potential of historical dataanalysis, Nat. Hazards Earth Syst. Sci., 2, 15–26, 2002,http://www.nat-hazards-earth-syst-sci.net/2/15/2002/.
Evans, S. G. and Hungr, O.: The assessment of rockfall hazard atthe base of talus slopes, Can. Geotech. J., 30, 620–636, 1993.
Erismann, T. and Abele, G.: Dynamics of Rockslides and Rockfalls,Springer, Berlin, 316 pp., 2001.
Fell, R., Corominas, J., Bonnard, C., Cascini, L., Leroi, E., andSavage, W.: Guidelines for landslide susceptibility, hazard andrisk zoning for land use planning, Eng. Geol., 102, 85–98, 2008.
Finlay, P. J., Mostyn, G. R., and Fell, R.: Landslide risk assess-ment: prediction of travel distance, Can. Geotech. J., 36, 556–562, 1999.
www.nat-hazards-earth-syst-sci.net/9/2107/2009/ Nat. Hazards Earth Syst. Sci., 9, 2107–2118, 2009

2118 R. Copons et al.: Rockfall travel distance analysis by using empirical models
Goudie, A. S.: Encyclopedia of geomorphology, Routledge, 2,1156 pp., 2004.
Guzzetti, F., Reichenbach, P., and Wieczorek, G. F.: Rockfall haz-ard and risk assessment in the Yosemite Valley, California, USA,Nat. Hazards Earth Syst. Sci., 3, 491–503, 2003,http://www.nat-hazards-earth-syst-sci.net/3/491/2003/.
Heim, A.: Bergsturz und Menschenleben, Beiblatt zur Viertel-jahrsschrift der Naturforschenden Gesellschaft in Zurich, 77,218 pp., 1932.
Holm, K. and Jakob, M.: Long rockfall runout, Pascua Lama, Chile,Can. Geotech. J., 46, 225–230, 2009.
Hsu, K. J.: Catastrophic debris streams generated by rockfalls,Geol. Soc. Am. Bull. 86, 129–140, 1975.
Hungr, O., Corominas, J., and Eberhardt, E.: Estimating landslidemotion mechanism, travel distance and velocity, in: Landsliderisk management, edited by: Hungr, O., Fell, R., Couture, R.,and Eberhardt, E., Taylor & Francis Group, London, 99–128,2005.
Hunter, G. and Fell, R.: Travel distance angle for “rapid” land-slides in constructed and natural soil slopes, Can. Geotech. J.,40, 1123–1141, 2003.
Hutchinson, J. N.: Morphological and geotechnical parameters oflandslide in relation to geology and hydrogeology, in: 5th inter-national symposium on landslides, Lausanne, edited by: Bon-nard, C., A.A. Balkema, 1, 3–35, 1988.
Jaboyedoff, M. and Labiouse, V.: Preliminary assessment ofrockfall hazard based on GIS data, ISRM 2003 – Technologyroadmap for rock mechanics, South African Institute of Miningand Metallurgy, 1, 575–578, 2003.
Krummenacher, B. and Keusen, H. R.: Steinschlag-Sturzbahnen– Modell und Realitat. Stienschlagmodellierung mit Hilfe derComputersimulationen, in: Instabilites de falaises rocheuses,chutes de blocs et ouvrages de protection, Publications de laSociete Suisse de Mecanique des sols et des roches, 135, 17–23,1997 (in German).
Legros, F.: The mobility of long-runout landslides, Eng. Geol., 63,301–331, 2002.
Lied, K.: Rockfall problems in Norway, in: Rockfall dynamics andprotective work effectiveness, Instituto Sperimentale Modelli eStructture (ISMES), Bergamo, Italy, 90, 51–53, 1977.
Martin, N.: Modelling of rockfall runout range. Employing em-pirical and dynamical methods, Faculty of mathematics andnatural sciences, University of Oslo, Ph.D. thesis, 79 pp.,available at: http://www.duo.uio.no/publ/geofag/2008/82211/Thesis34.pdf, 2008.
Meißl, G.: Modelling the runout distances of rockfalls using a geo-graphic information system, Zeitschrift fur Geomorpologie Sup-plementband, 125, 129–137, 2001.
Nicoletti, P. G. and Sorriso-Valvo, M.: Geomorphic controls of theshape and mobility of rock avalanches, Geol. Soc. Am. Bull.,103, 1365–1373, 1991.
Okura, Y., Kitahara, H., Sammori, T., and Kawanami, A.: The ef-fects of rockfall volume on runout distance, Eng. Geol., 58, 109–124, 2000.
Petje, U., Ribicic, M., and Mikos, M.: Computer simulation ofstone falls and rockfalls, Acta Geogr. Slov., 45(2), 93–120, 2005.
Rapp, A.: Talus slopes and mountain walls at Tempelfjorden, Spits-bergen, Norsk Polarinstitut Skrifter, 119, 1–96, 1960.
Rickenmann, D.: Empirical Relationships for Debris Flows, Nat.Hazards, 19, 47–77, 1999.
Rouiller, J. D., Jaboyedoff, M., Marro, Ch., Philippossian, F., andMamin, M.: Pentes instables dans le Pennique valaisan, vdfHochschulverlag AG and ETH, Zurich., Rapport final du Pro-gramme National de Recherche PNR 31/CREALP, 98, 239 pp.,1998 (in French).
Scheidegger, A. E.: On the prediction of the reach and velocity ofcatastrophic landslides, Rock Mech., 5, 231–236, 1973.
Shreve, R. L.: The Blackhawk landslide, Geol. Soc. Am. S.,108 pp., 1968.
Soeters, R. and van Westen, C. J.: Slope instability recognition,analysis and zonation, in: Landslides. Investigation and Mitiga-tion, edited by: Turner, A. K. and Schuster, R. L., TransportationResearch Board, National Research Council, Washington, spe-cial report 247, 129–177, 1996,
Varnes, D. J.: Slope movement types and processes, in: Landslides:analysis and control, edited by: Schuster, R. L. and Krizek, R.L., Transportation Research Board, National Research Council,Washington, special report 176, 11–33, 1978.
Vaunat, J. and Leroueil, S.: Analysis of Post-Failure Slope Move-ments within the Framework of Hazard and Risk Analysis, Nat.Hazards, 26, 83–109, 2002.
Wieczorek, G. F., Morrissey, M. M., Iovine, G., and Godt,J.: Rock-fall hazards in the Yosemite Valley, US Geo-logical Survey Open-file Report 98-467, 1:12 000, 7 pp.,available at:http://greenwood.cr.usgs.gov/pub/open-file-reports/ofr-98-0467, 1998.
Wieczorek, G. F., Stock, G. M., Reichenbach, P., Snyder, J. B.,Borchers, J. W., and Godt, J. W.: Investigation and hazard assess-ment of the 2003 and 2007 Staircase Falls rock falls, YosemiteNational Park, California, USA, Nat. Hazards Earth Syst. Sci., 8,421–432, 2008,http://www.nat-hazards-earth-syst-sci.net/8/421/2008/.
Nat. Hazards Earth Syst. Sci., 9, 2107–2118, 2009 www.nat-hazards-earth-syst-sci.net/9/2107/2009/