Embed Size (px)
Citation preview

Planning, Running, and Analyzing Controlled Experiments on the Web Roger Longbotham, Principal Statistician, Microsoft
Part 2

Planning and Analysis of Online Experiments
What to measureHow to compare Treatment to ControlHow long to run testStart up optionsGood test designData validation and cleansingBefore your first experimentCommon errorsMultiVariable TestsAdvanced Topics
What to Measure
Start with objectiveOf the site (content, ecommerce, marketing, help/support,…)Of the experiment
What can you measure to tell you if you met your objective?
Content site: clicks/user, pageviews/user, time on siteEcommerce: rev/visitor, units purchased/visitor, cart-adds/visitorMarketing: referrals/visitor, time on siteHelp/support: Pct of users engaged, Pct of users who print, email or download content, time on site
What to Measure
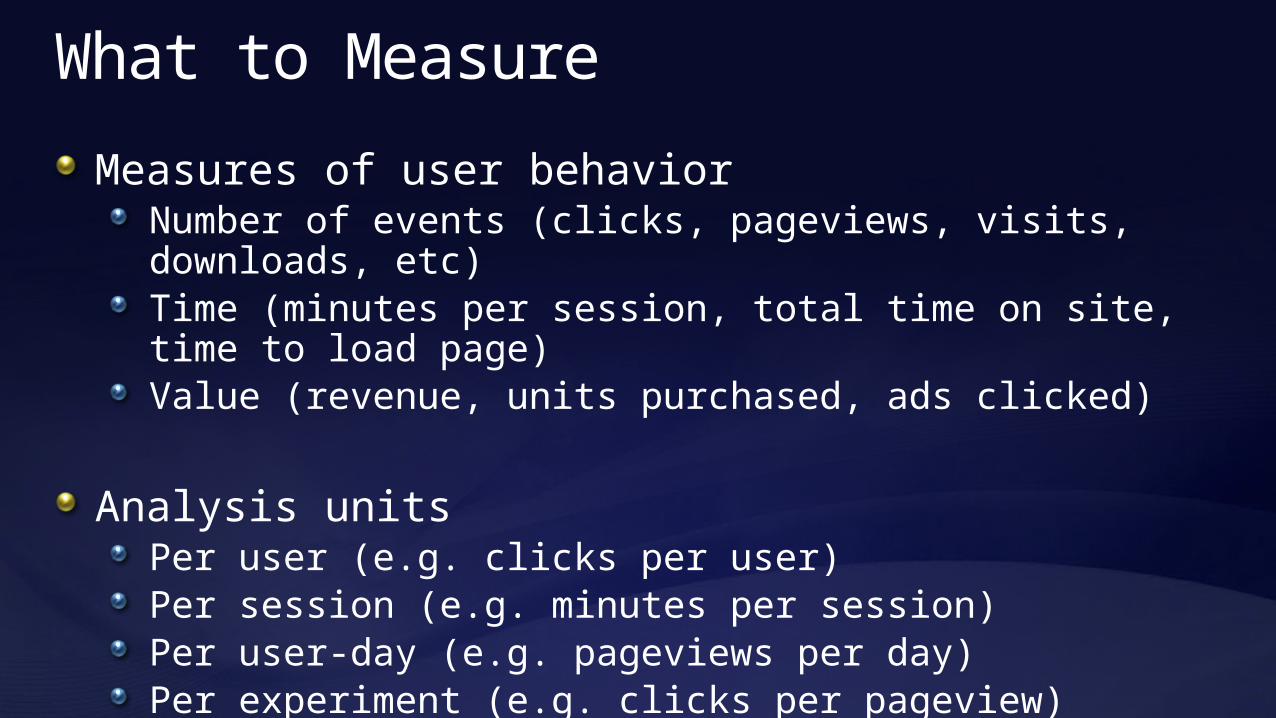
Measures of user behaviorNumber of events (clicks, pageviews, visits, downloads, etc)Time (minutes per session, total time on site, time to load page)Value (revenue, units purchased, ads clicked)
Analysis unitsPer user (e.g. clicks per user)Per session (e.g. minutes per session)Per user-day (e.g. pageviews per day)Per experiment (e.g. clicks per pageview)
Overall Evaluation Criterion
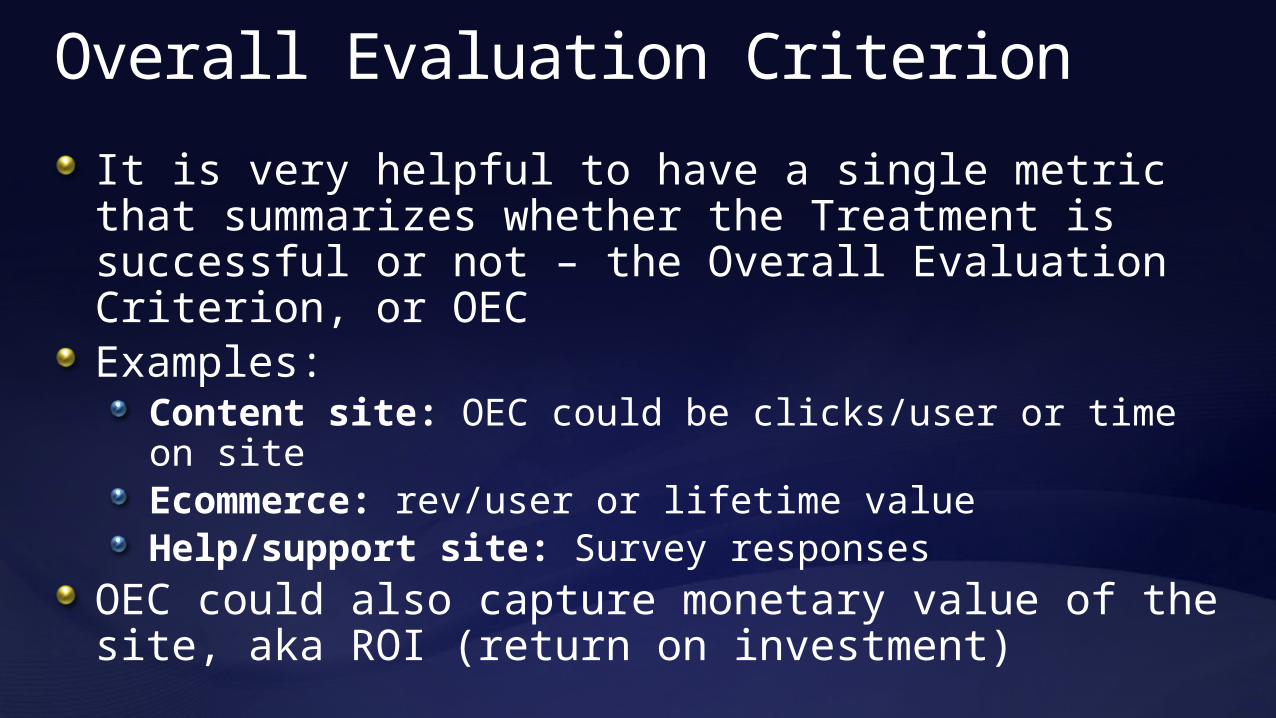
It is very helpful to have a single metric that summarizes whether the Treatment is successful or not – the Overall Evaluation Criterion, or OECExamples:
Content site: OEC could be clicks/user or time on siteEcommerce: rev/user or lifetime valueHelp/support site: Survey responses
OEC could also capture monetary value of the site, aka ROI (return on investment)
Comparing Treatment to Control
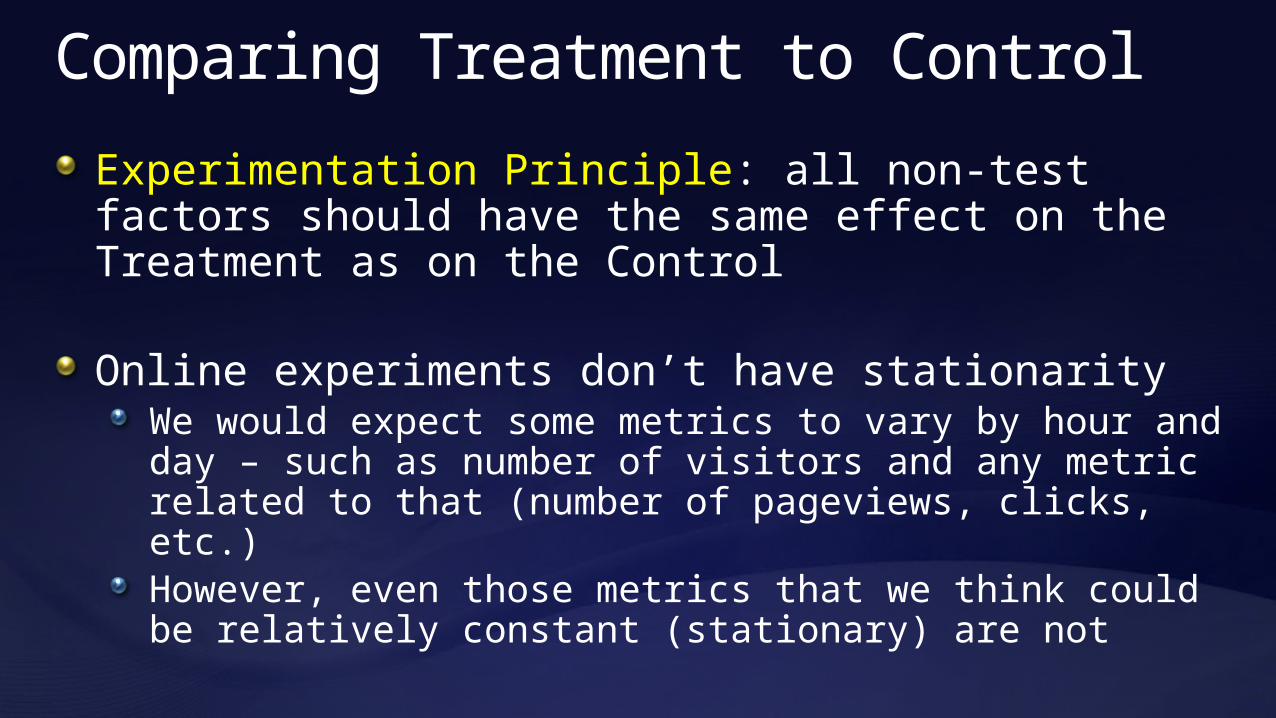
Experimentation Principle: all non-test factors should have the same effect on the Treatment as on the Control
Online experiments don’t have stationarityWe would expect some metrics to vary by hour and day – such as number of visitors and any metric related to that (number of pageviews, clicks, etc.)However, even those metrics that we think could be relatively constant (stationary) are not

Example of Web Data NonstationarityMetric plotted is number of clicks in an hour divided by the number of pageviews
Comparing Treatment to Control
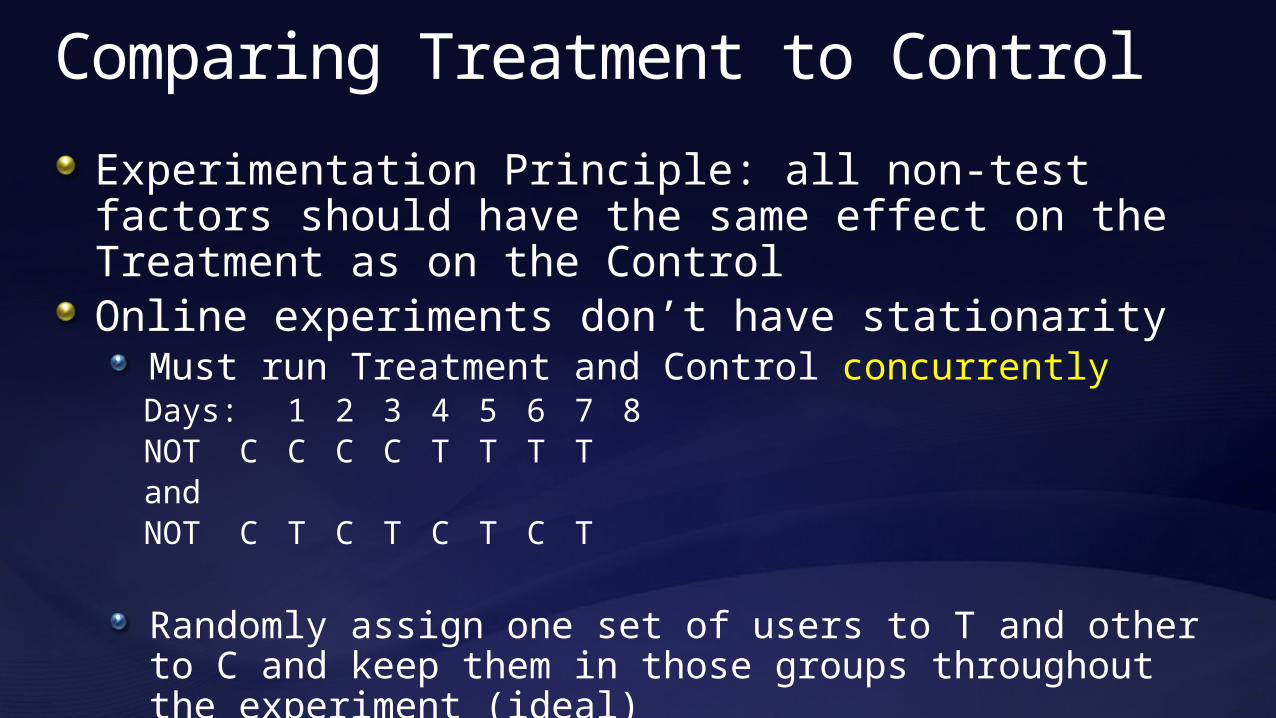
Experimentation Principle: all non-test factors should have the same effect on the Treatment as on the ControlOnline experiments don’t have stationarity
Must run Treatment and Control concurrentlyDays: 1 2 3 4 5 6 7 8NOT C C C C T T T TandNOT C T C T C T C T
Randomly assign one set of users to T and other to C and keep them in those groups throughout the experiment (ideal)

Comparing Treatment to ControlTook a valid experiment that ran for two weeks (50% in T, 50% in C)
Treatment effect in week 1: +1.93%Treatment effect in week 2: +2.09%
For same experimentCompare Treatment week 2 to Control week 1: +11.38% Difference was due to uncontrolled differences between weeks 1 and 2
Comparing Treatment to Control
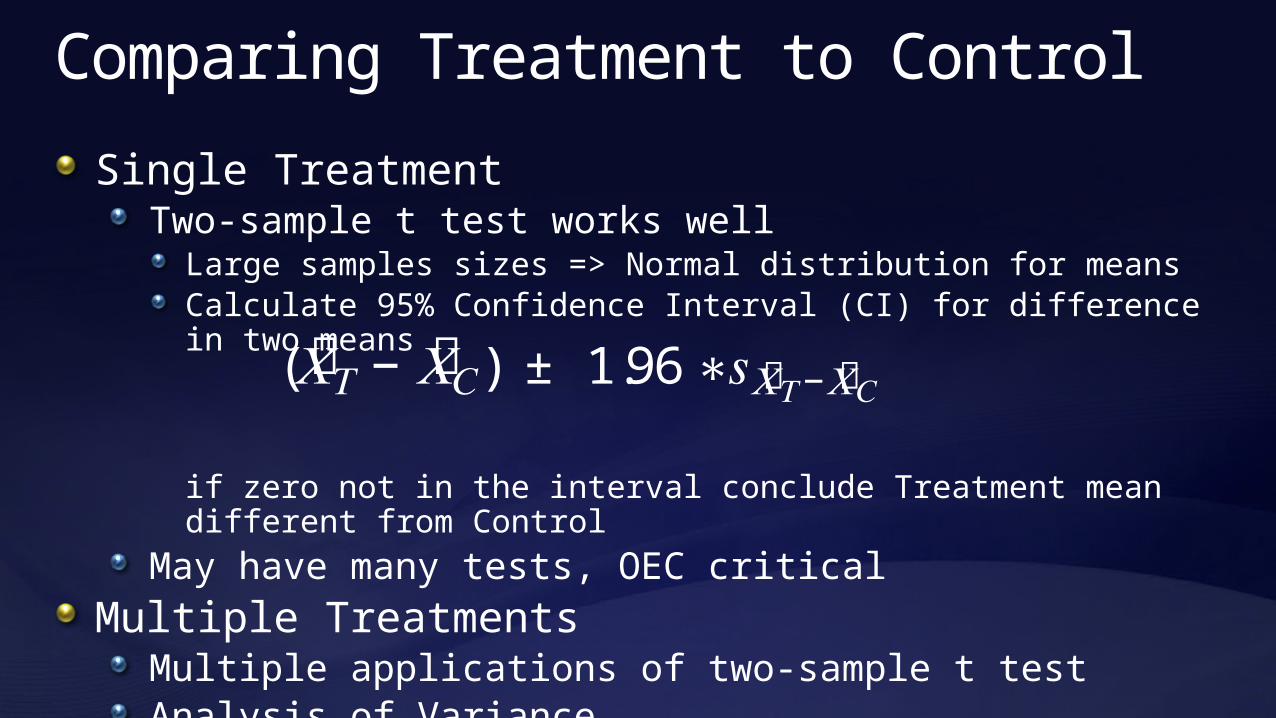
Single TreatmentTwo-sample t test works well
Large samples sizes => Normal distribution for meansCalculate 95% Confidence Interval (CI) for difference in two means
if zero not in the interval conclude Treatment mean different from Control
May have many tests, OEC criticalMultiple Treatments
Multiple applications of two-sample t testAnalysis of Variance
(𝑋ത𝑇− 𝑋ത𝐶) ± 1.96∗𝑠𝑋ത𝑇−𝑋ത𝐶
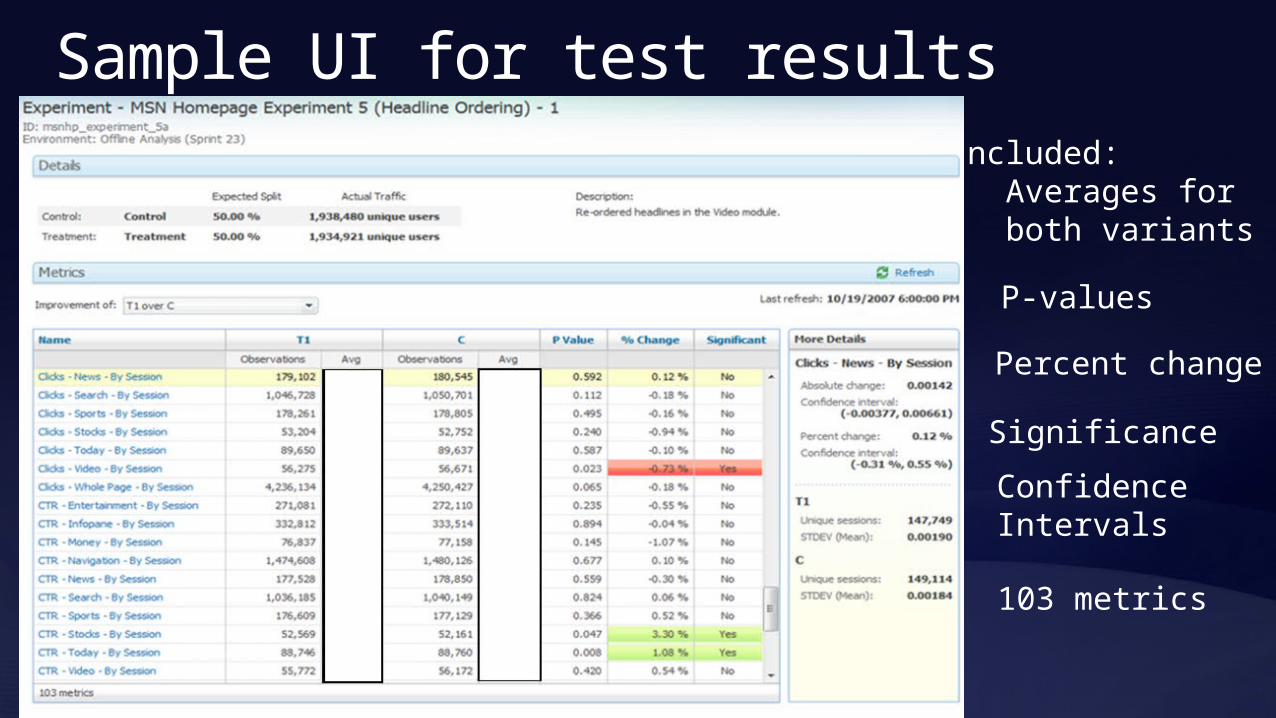
Sample UI for test resultsIncluded: Averages for both variants
P-values
Percent change
Significance
Confidence Intervals
103 metrics

Comparing Treatment to Control
P-value is the probability of getting a difference farther from zero than observed under assumption of no differenceCI for percent effect must use special formula (Fieller’s theorem)Care must be taken in calculating standard deviations
When randomization is by user, any metric that is not per user must take into account non-independence in calculating standard deviationWe routinely use bootstrap or delta method to estimate standard deviations for metrics that are not by user
Sample Size NeededMay need to consider
Sample size needed for normality of means
Sample size needed for sufficient power
Sample size needed for representative sample
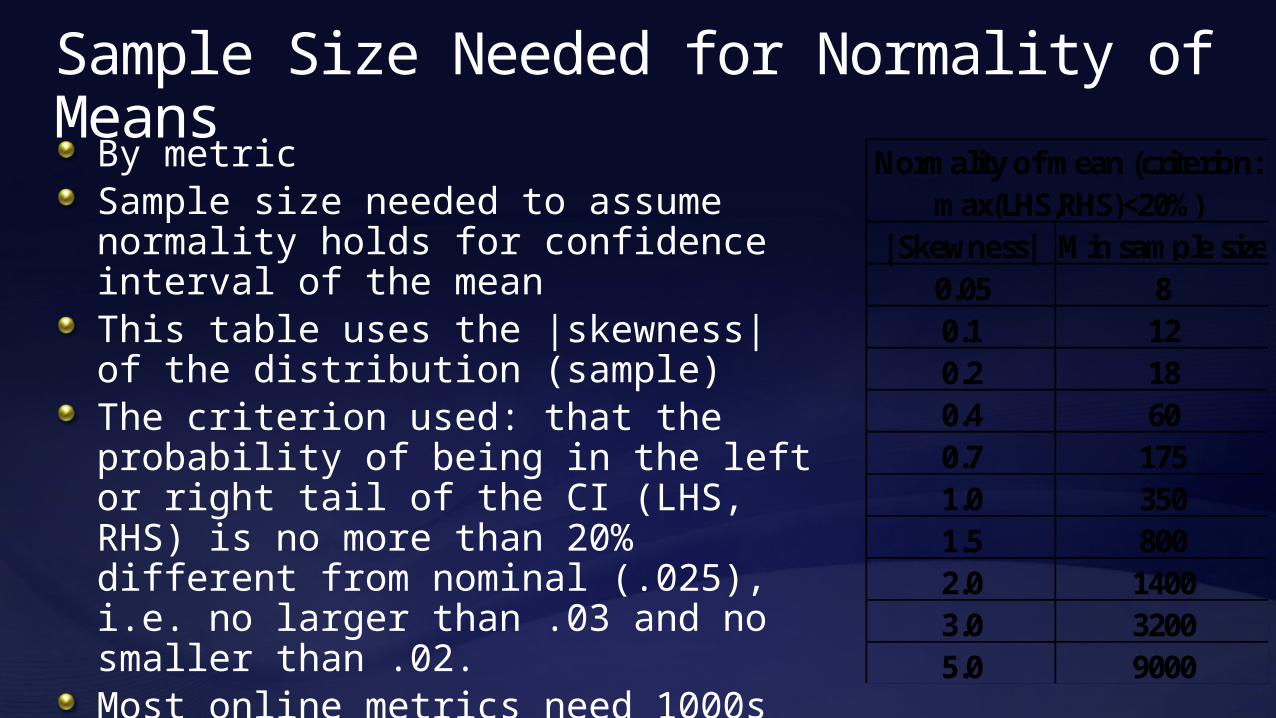
Sample Size Needed for Normality of Means
By metricSample size needed to assume normality holds for confidence interval of the meanThis table uses the |skewness| of the distribution (sample)The criterion used: that the probability of being in the left or right tail of the CI (LHS, RHS) is no more than 20% different from nominal (.025), i.e. no larger than .03 and no smaller than .02.Most online metrics need 1000s for each group
|Skewness| Min sample size0.05 80.1 120.2 180.4 600.7 1751.0 3501.5 8002.0 14003.0 32005.0 9000
Normality of mean (criterion: max(LHS,RHS)<20%)
Power and Sample Size
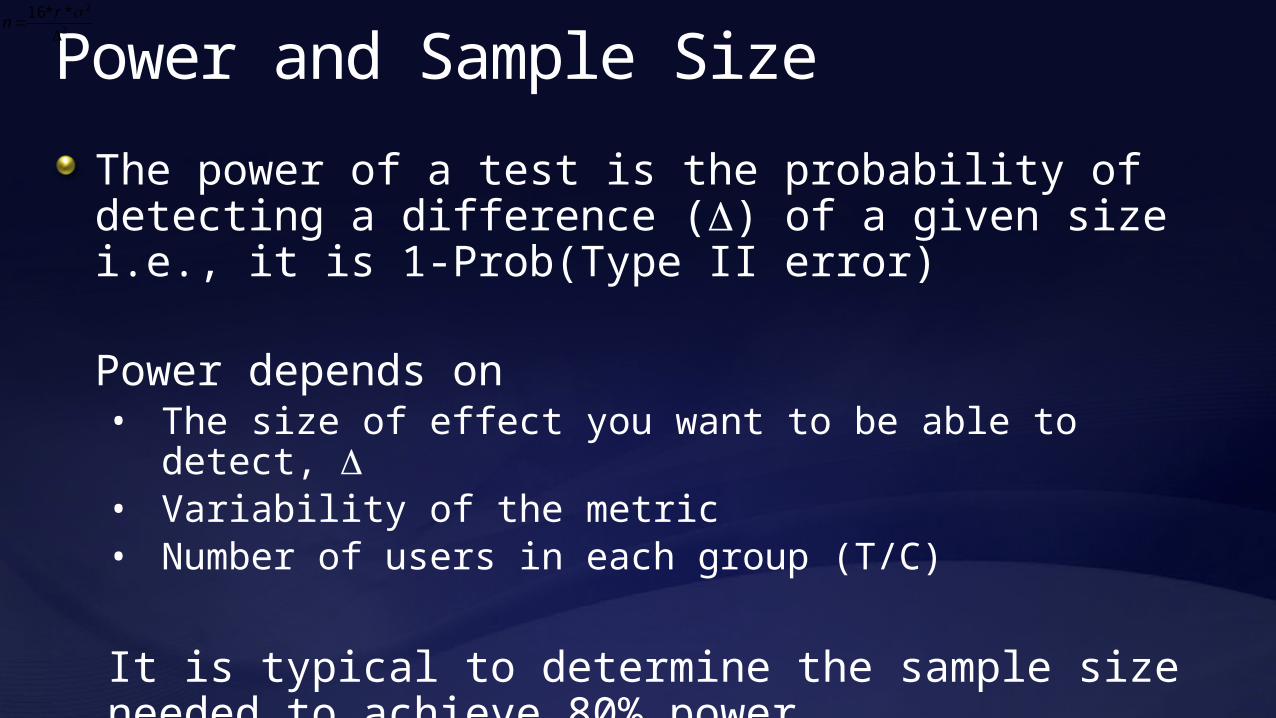
The power of a test is the probability of detecting a difference (D) of a given size i.e., it is 1-Prob(Type II error)
Power depends on• The size of effect you want to be able to detect, D• Variability of the metric• Number of users in each group (T/C)
It is typical to determine the sample size needed to achieve 80% power
2
2**16
rn
Power and Sample Size
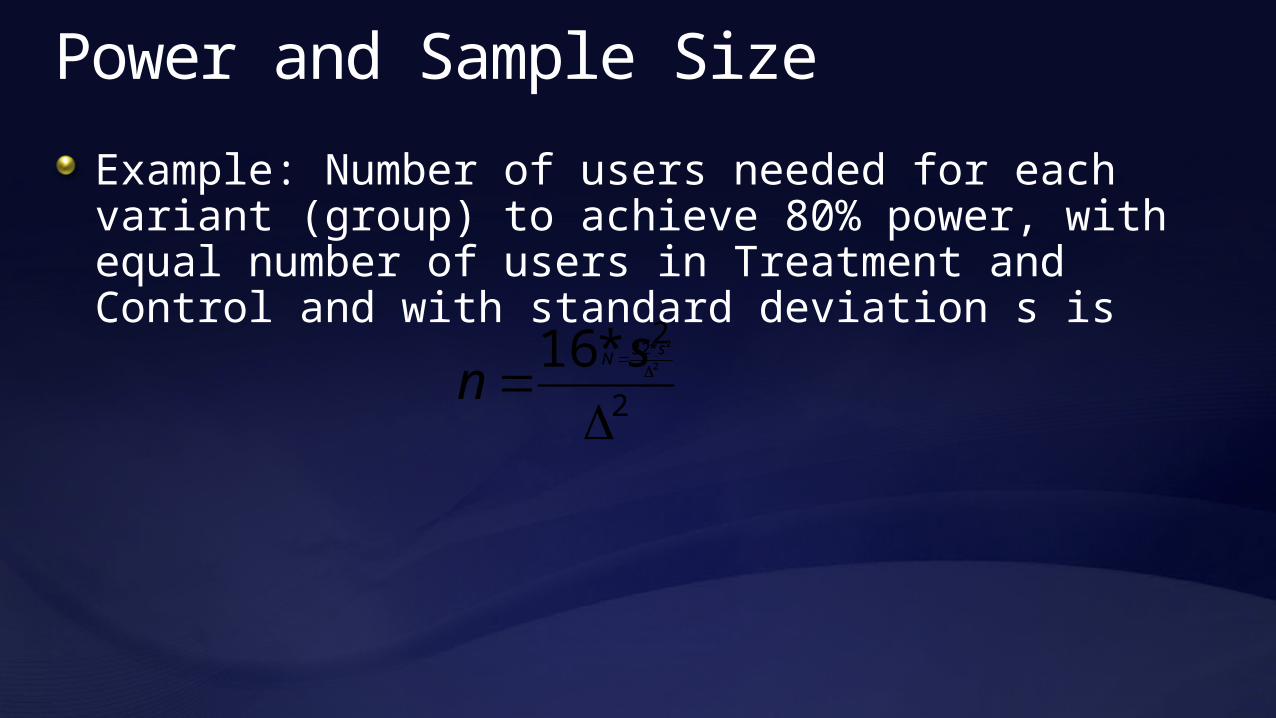
Example: Number of users needed for each variant (group) to achieve 80% power, with equal number of users in Treatment and Control and with standard deviation s is
2
2*32
sN
2
2*32
sN
2
2*16
sn
Ramp up
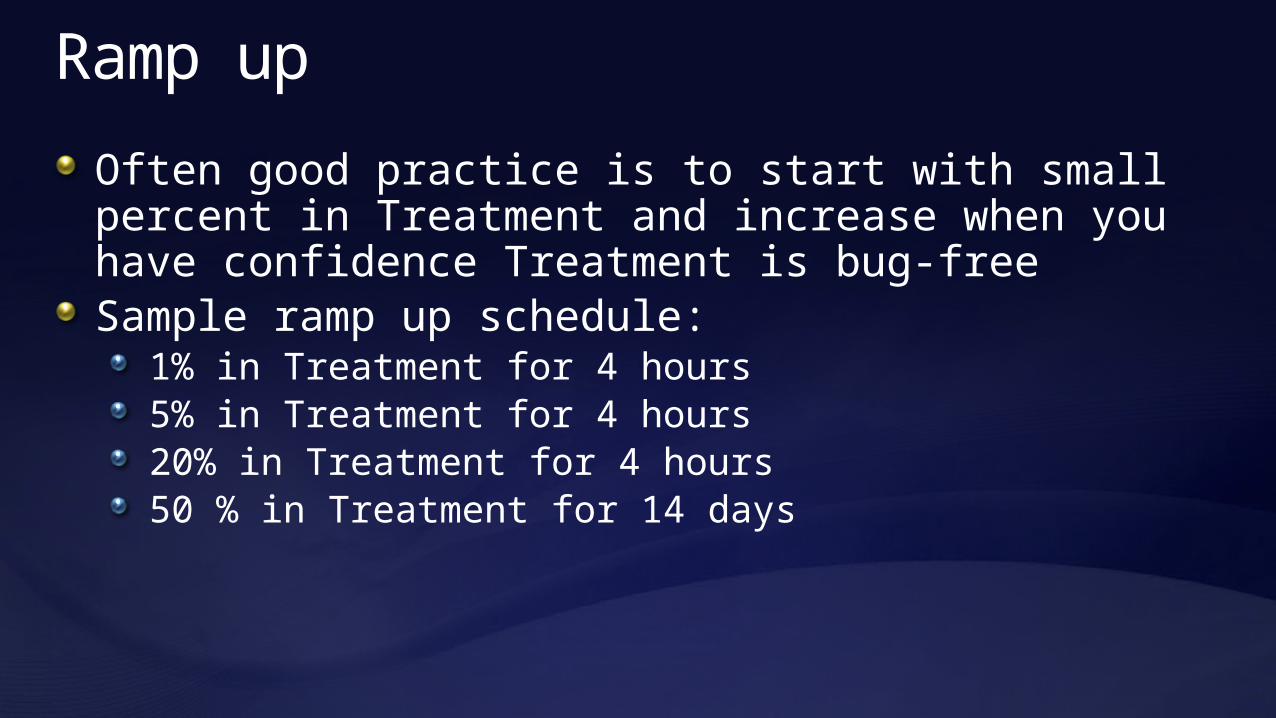
Often good practice is to start with small percent in Treatment and increase when you have confidence Treatment is bug-freeSample ramp up schedule:
1% in Treatment for 4 hours5% in Treatment for 4 hours20% in Treatment for 4 hours50 % in Treatment for 14 days

Caution With Ramp upIn an online experiment that ran for 35 days, the Treatment had a click-through rate (CTR) of 29.6% and the Control had a CTR of 30.9% for a -4.3% drop (Control did better)When CTR effect is calculated by day => Treatment better
What’s going on?
1 2 3 4 5 6 7 8 9 10 11 12 13 14 15 16 17 18 19 20 21 22 23 24 25 26 27 28 29 30 31 32 33 34 35-2.00%
-1.00%
0.00%
1.00%
2.00%
3.00%
4.00%
5.00%
Treatment % Effect by Day
Pe
rce
nt
Diff
ere
nce
in
C
lick
Th
rou
gh
Ra
tes (
T-
C)/
C
Which is correct?

Simpson’s ParadoxCan happen when numerators and denominators are accumulated over groups of unequal sizesFamous example: UC Berkeley gender bias lawsuit. The graduate school was sued in 1973. Admission rates:
But for two large departments:
So, a larger percentageof men admitted than women
Applicants AdmittedMen 8442 44%
Women 4321 35%
In these two departments, admission rates did not seem to favor men, but whencombined, the admission rate for men was 55% and for women it was 41%
A CMen Applicants/
Admitted825 / 62% 325 / 37%
Women Applicants/ Admitted
108 / 82% 593 / 34%
Two Departments
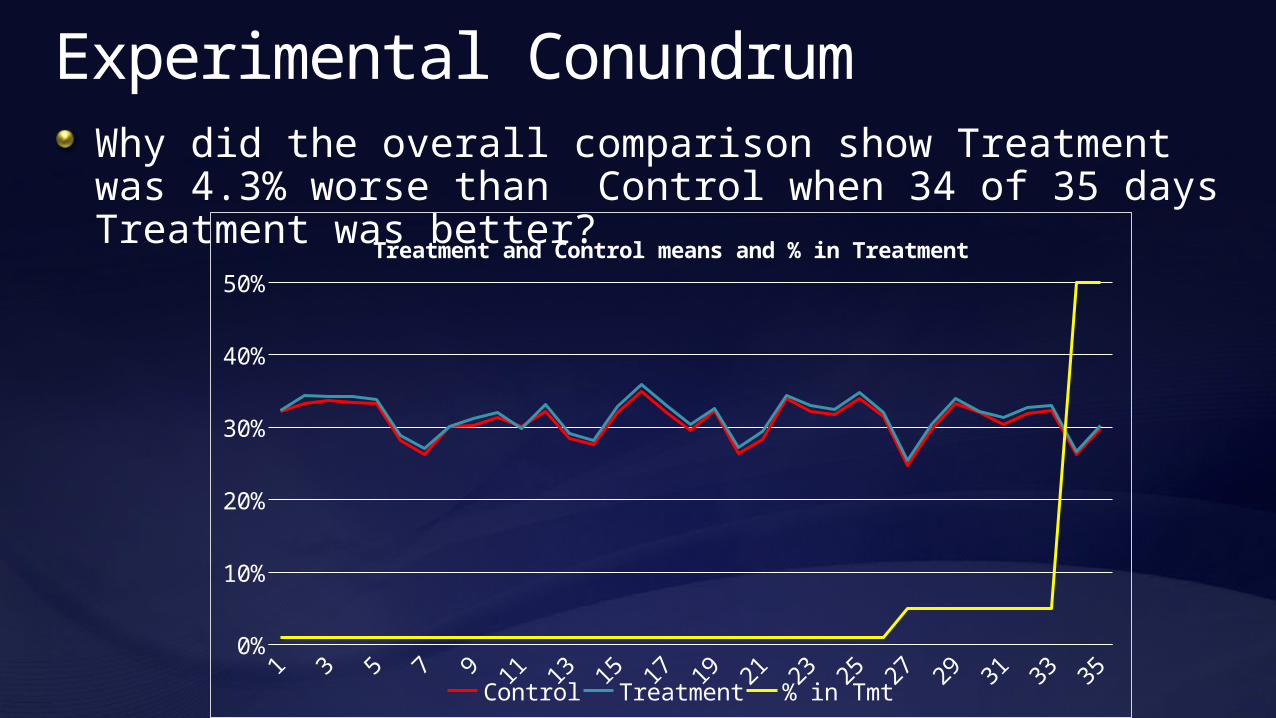
Why did the overall comparison show Treatment was 4.3% worse than Control when 34 of 35 days Treatment was better?
Experimental Conundrum
1 3 5 7 9 11 13 15 17 19 21 23 25 27 29 31 33 350%
10%
20%
30%
40%
50%
Treatment and Control means and % in Treatment
Control Treatment % in Tmt

MultiTreatment TestsExample: Real Estate widget design
Test five alternatives to the current designOEC: clicks to links weighted by revenue per click
Control T1
T3 T4
T2
T5
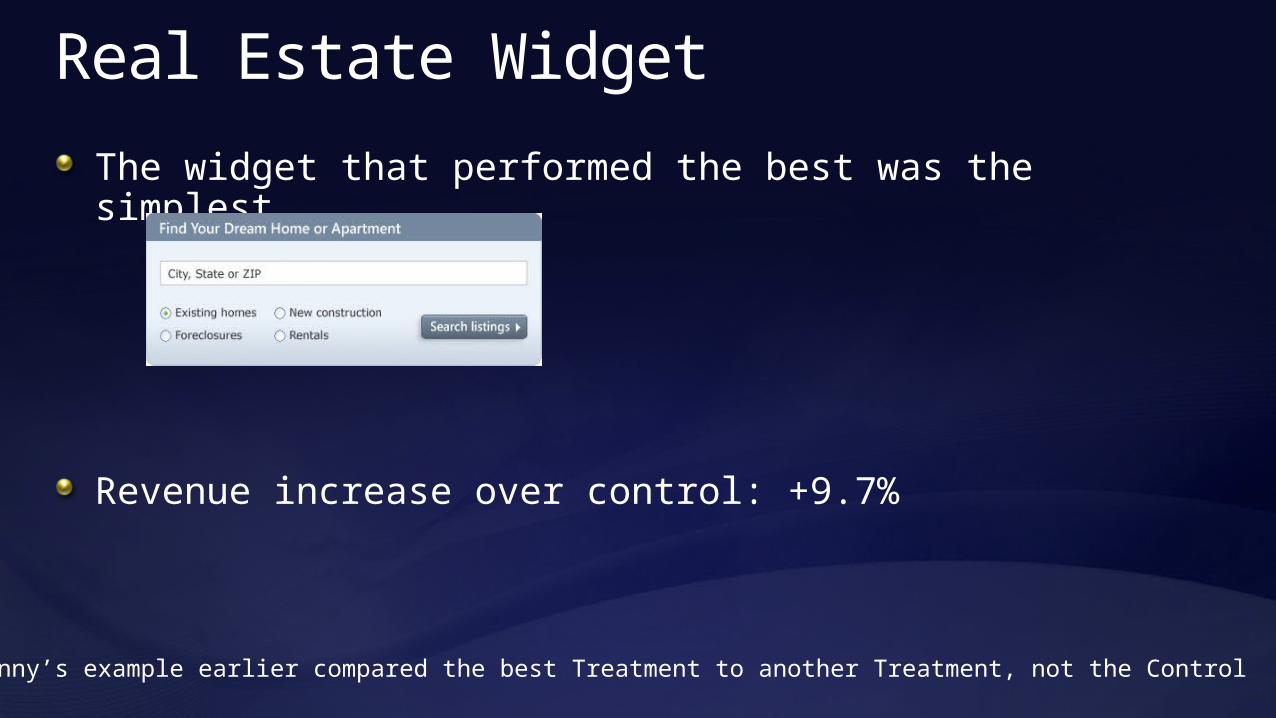
Real Estate Widget
The widget that performed the best was the simplest
Revenue increase over control: +9.7%
Note Ronny’s example earlier compared the best Treatment to another Treatment, not the Control
Design of Experiments
TriggeringBlockingMeasuring non-test factorsRandomization
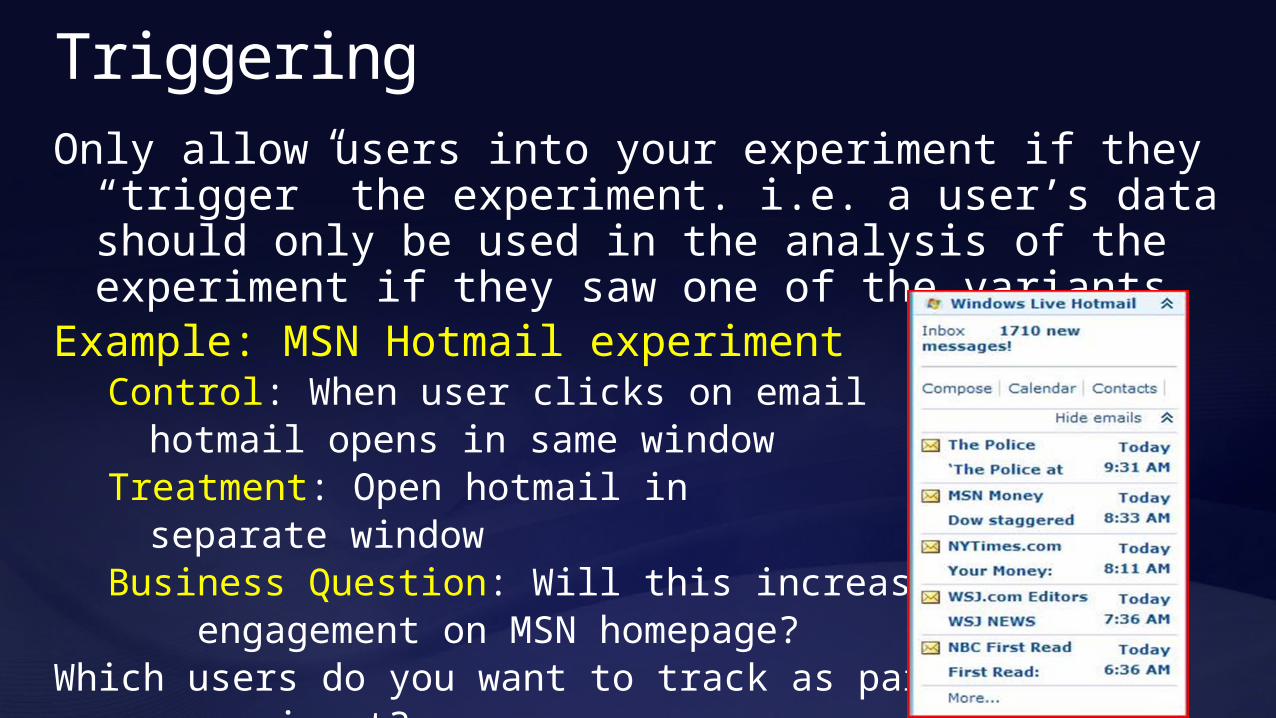
TriggeringOnly allow users into your experiment if they “trigger”
the experiment. i.e. a user’s data should only be used in the analysis of the experiment if they saw one of the variants
Example: MSN Hotmail experiment Control: When user clicks on email
hotmail opens in same windowTreatment: Open hotmail in
separate windowBusiness Question: Will this increase user engagement on MSN homepage?
Which users do you want to track as part of your experiment?

Design of Experiments
TriggeringBlockingMeasuring non-test factorsRandomization
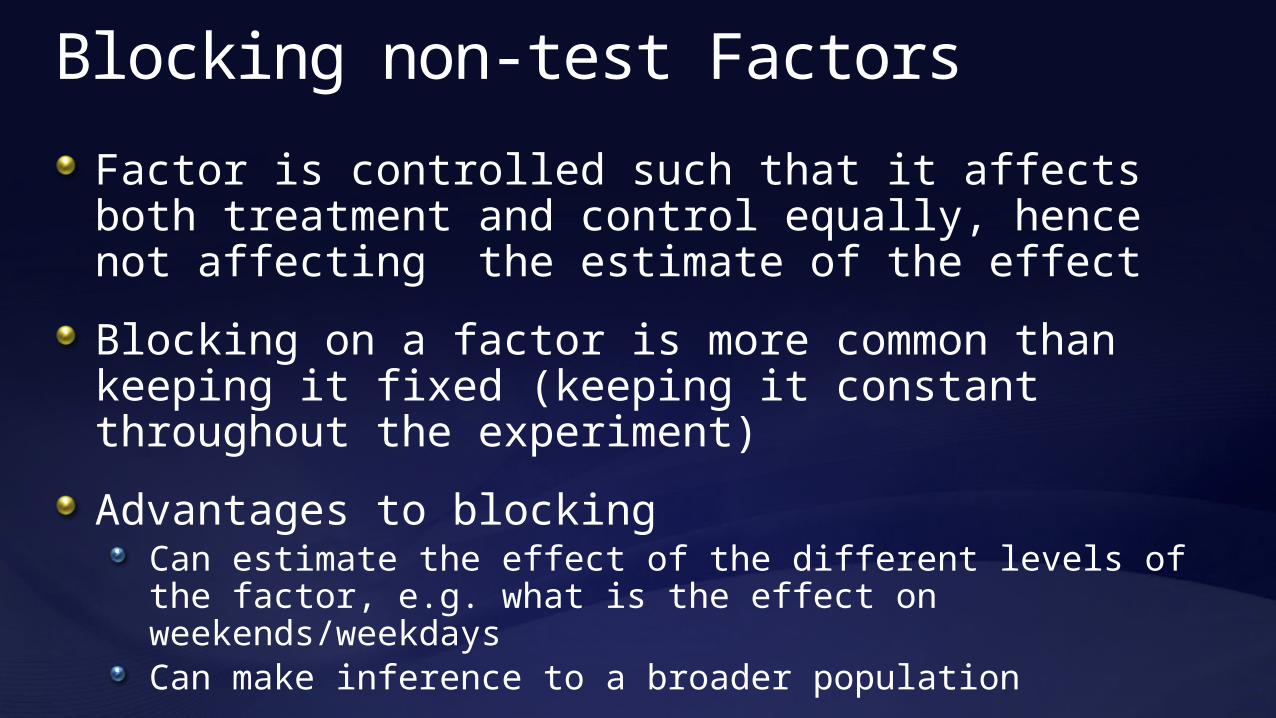
Blocking non-test Factors
Factor is controlled such that it affects both treatment and control equally, hence not affecting the estimate of the effect
Blocking on a factor is more common than keeping it fixed (keeping it constant throughout the experiment)
Advantages to blockingCan estimate the effect of the different levels of the factor, e.g. what is the effect on weekends/weekdaysCan make inference to a broader population

Examples of BlockingTime (time of day, day of week, etc.)Always run treatment and control concurrently in online
experiments to block on all factors that vary with time
ContentEx: If content of a site changes during the experiment it
must be the same for both Treatment and Control at all times
UserMay use before/after for users or a cohort group
Updates to site
Design Principle
The Treatment and Control groups should be as alike as possible except for application of the treatment
Who is in the experimentWhat is done during the experimentetc.

Design Principle
Example: One partner was conducting an A/A test (same as an A/B test but no real change is made) What would you expect?Results: T very significant (much more than it should be) Why?Found out another group was using their Treatment group to test something so there really was a difference between T and C

Design PrincipleEx: A site was testing a change to the layout of their page
Content to T and C was not the same for a 7 hour period39370.5
833333333
39370.6
666666667
39370.7
539370.8
333333333
39370.9
166666667
39371
39371.0
833333333
39371.1
666666667
39371.2
539371.3
333333333
39371.4
166666667
39371.5
39371.5
833333333
39371.6
666666667
39371.7
539371.8
333333333
39371.9
166666667
39372
39372.0
833333333
39372.1
666666667
39372.2
539372.3
333333333
39372.4
166666667
39372.5
39372.5
833333333
39372.6
666666667
39372.7
539372.8
333333333
39372.9
166666667
39373
39373.0
833333333
39373.1
666666667
39373.2
539373.3
333333333
39373.4
166666667
39373.5
39373.5
833333333
39373.6
666666667
39373.7
539373.8
333333333
39373.9
166666667
39374
39374.0
833333333
39374.1
666666667
39374.2
539374.3
333333333
39374.4
166666667
39374.5
39374.5
833333333
39374.6
6666666670.0%
0.2%
0.4%
0.6%
0.8%
1.0%
1.2%
Hourly Clickthrough Rate for Treatment and Control for Module
CTR_ControlCTR_Tmt
Click
thro
ug
h R
ate

Design of Experiments
TriggeringBlockingMeasuring non-test factorsRandomization
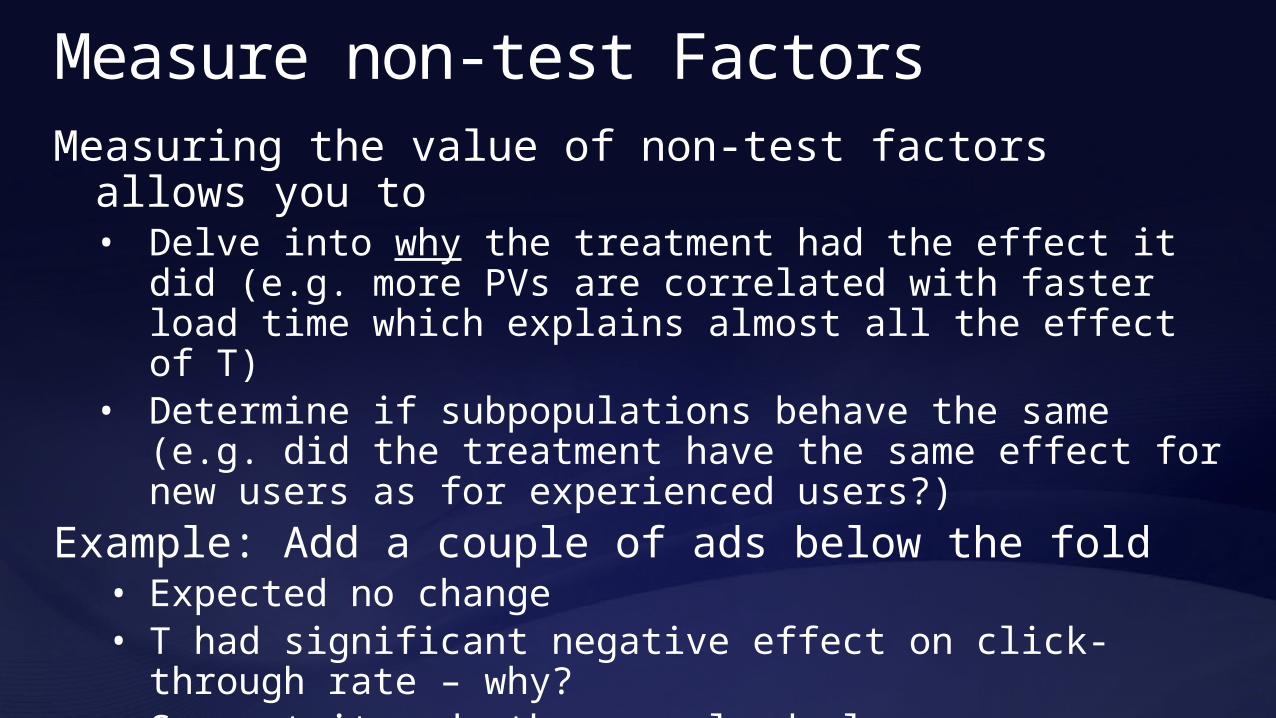
Measure non-test FactorsMeasuring the value of non-test factors allows you to• Delve into why the treatment had the effect it did (e.g.
more PVs are correlated with faster load time which explains almost all the effect of T)
• Determine if subpopulations behave the same (e.g. did the treatment have the same effect for new users as for experienced users?)
Example: Add a couple of ads below the fold• Expected no change• T had significant negative effect on click-through rate –
why?• Suspect it made the page load slower – no evidence• Later we added capability to measure time to load by PV.
Design of Experiments
TriggeringBlockingMeasuring non-test factorsRandomization
Randomize
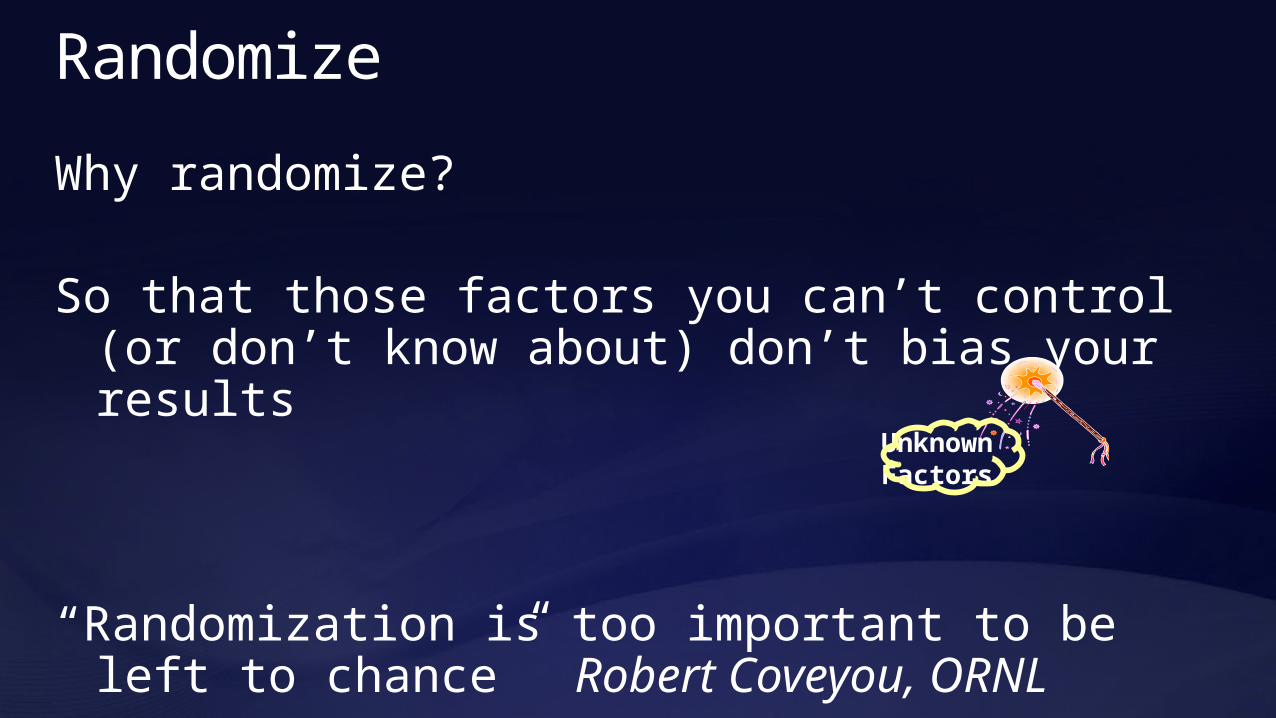
Why randomize?
So that those factors you can’t control (or don’t know about) don’t bias your results
“Randomization is too important to be left to chance” Robert Coveyou, ORNL
UnknownFactors

Randomize
How to randomize? (online tests)Randomly assign T or C to user (alternately could use user-
session, search query, page view or product/SKU)Usually best by user (store UserID in cookie)
How persistent is the UID?Ideally user always gets same treatment groupLimitations:
Clearing cookies => can change treatmentDifferent browser => may get different treatmentCan’t allow opt-in or opt-out
Representative Test
Make sure users and conditions are as representative of launch environment as possible
Time period: not holiday (unless holiday factor), pre-holiday, complete cycle (day, week)Users: all users who would see T in the future,not robots, not internal testers, outliers(?)Not during special events
Robot Detection and Removal
Remove robots (web crawlers, spiders, etc.) from analysis
They can generate many pageviews or clicks in Treatment or Control skewing the resultsRemove robots with known identifiers (found in the user agent)Develop heuristics to identify robots with many clicks or pageviews in short period of timeOther patterns may be used to identify robots as well, such as very regular activity
Data Validation checksCarry out checks to make sure data is not affected by some unknown factor
Check that percentage of users in each variant is not different from planned (statistical test)Check that number of users in the experiment is approximately what was expected (and doesn’t change too much during experiment)Check that the Treatment effect does not change too much during experimentCheck that means for primary metrics do not change unexpectedly
Before Your First Experiment
Conduct logging auditCompare data collected for experiment to system of recordShould have approximately same number of users, clicks, pageviews, orders, etc.
Conduct A/A testSplit users into two groups that get same experienceShould have about 5% of tests significantp-values should have U(0,1) distributionNo p-values should be extremely small (say <.001)
Common Errors
Not conducting logging or A/A testsFind caching issues, UID reassignment
Not keeping all factors constant or blockingContent changes to siteRedirect for Treatment but not for Control
Sample size too smallCaution with using surrogates for OEC!
Measure clicks to buy button (instead of revenue)Clicks to download button (instead of completed downloads)
MultiVariable Tests (MVTs)
Several factors/variables, each of which has two or more levels (C/T1/T2/…)Main effects: Comparison of Treatments to Control for each variable (i.e. compare means for T and C same as before)Interactions: Determine if combinations of variables have different effect than adding main effects

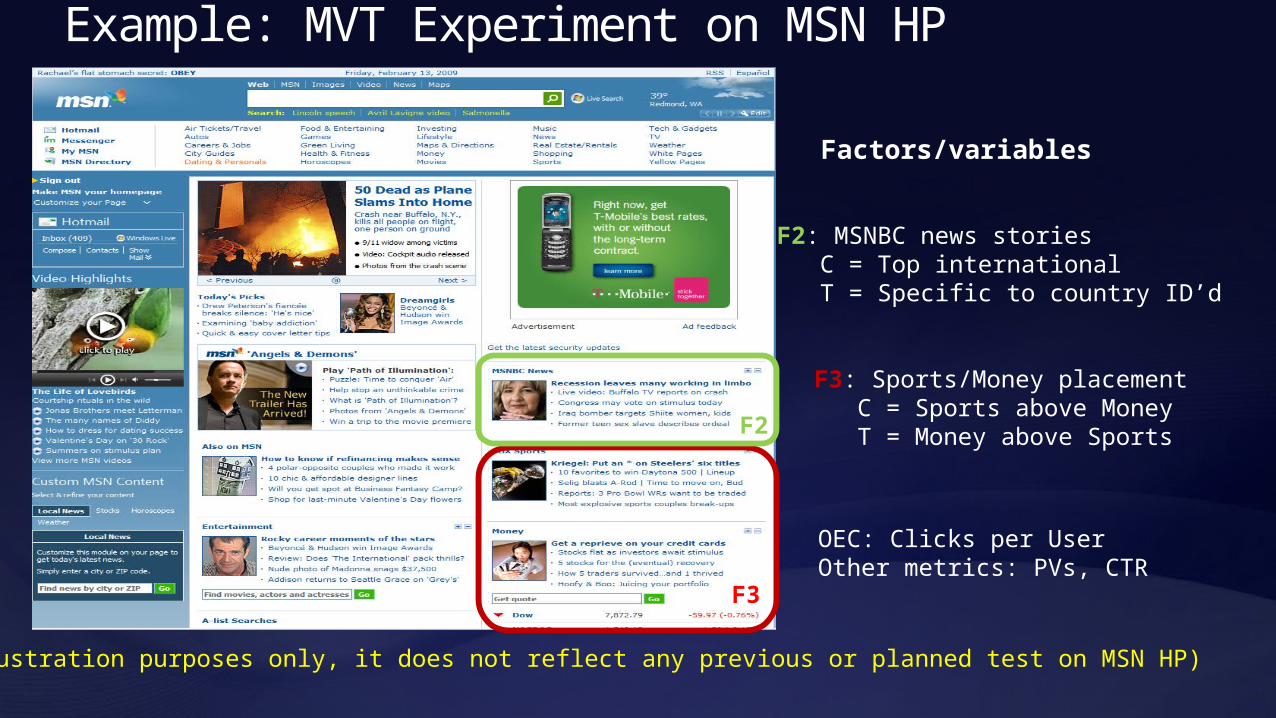
Example: MultiVariable Test on MSN HP
(This is for illustration purposes only, it does not reflect any previous or planned test on MSN HP)
F3
F3: Sports/Money placement C = Sports above Money T = Money above Sports
Factors/variables
F1: Size of Right col ad C = current size T1 = 10% larger T2 = 10% smaller
F2: MSNBC news stories C = Top international T = Specific to country ID’d
OEC: Clicks per User Other metrics: PVs, CTR
F2
F1
Multivariable Tests
Advantages:– Can test many things at once, accelerating innovation– Can estimate interactions between factors
Disadvantages– Some combinations of factors may give negative
customer experience– Analysis and interpretation is more difficult– May take longer to set up test

Designs for Multivariable Tests
On-line experiments can simply run overlapping, concurrent, independently randomized experiments
Example: Test 7 factors each at 2 levelsSet up 7 separate experiments to run at the same time with the same users. Get all 128 combinations in the results.
Advantages: – Easier to implement– Can turn off one experiment if negative– Get all interactions

Analysis for Interactions
Procedure for analyzing an MVT for interactions1. Since there are potentially a vary large number of
interactions among the variables being tested, restrict the ones you will look at to a few you suspect may be present. (If 7 factors, 21 two-factor interactions, 35 three-factor interactions, etc.)
2. Conduct the test to determine if the interaction between two factors is present or not
3. If interaction is not significant, stop! If the interaction IS significant, look at the graphical
output to interpret.

Analysis for Interactions
Example: Factors from MSN HP illustration
Hypothesis tests for interactions similar to main effects (details omitted)
F3 Sports/Money placement C = same order every day T = Sports higher on wkends and Money higher wkdays
F2: MSNBC news stories C = Top international T = Specific to country ID’d
Example: MVT Experiment on MSN HP
(This is for illustration purposes only, it does not reflect any previous or planned test on MSN HP)
F3
F3: Sports/Money placement C = Sports above Money T = Money above Sports
Factors/variables
F2: MSNBC news stories C = Top international T = Specific to country ID’d
OEC: Clicks per User Other metrics: PVs, CTR
F2

Graphical Analysis of Interactions
If hypothesis test for interaction is not significantAssume no interaction presentInteraction graph would show lines approximately parallel
If interaction is statistically significantPlot interaction to interpret

Graphical Analysis of Interactions
Case 1: No Interaction (parallel lines)Data Table Main Effects Results
F2 - C F2 - TF3 - C 4.06 4.10F3 - T 4.08 4.12
Pct Effect p-valueEffect(F2) 0.98% <.001Effect(F3) 0.49% 0.032
F2 - C F2 - T4.05
4.06
4.07
4.08
4.09
4.10
4.11
4.12
4.13
F2xF3 Interaction
F3 - CF3 - T
Avera
ge C
licks p
er
User
No Interaction
Graphical Analysis of Interactions
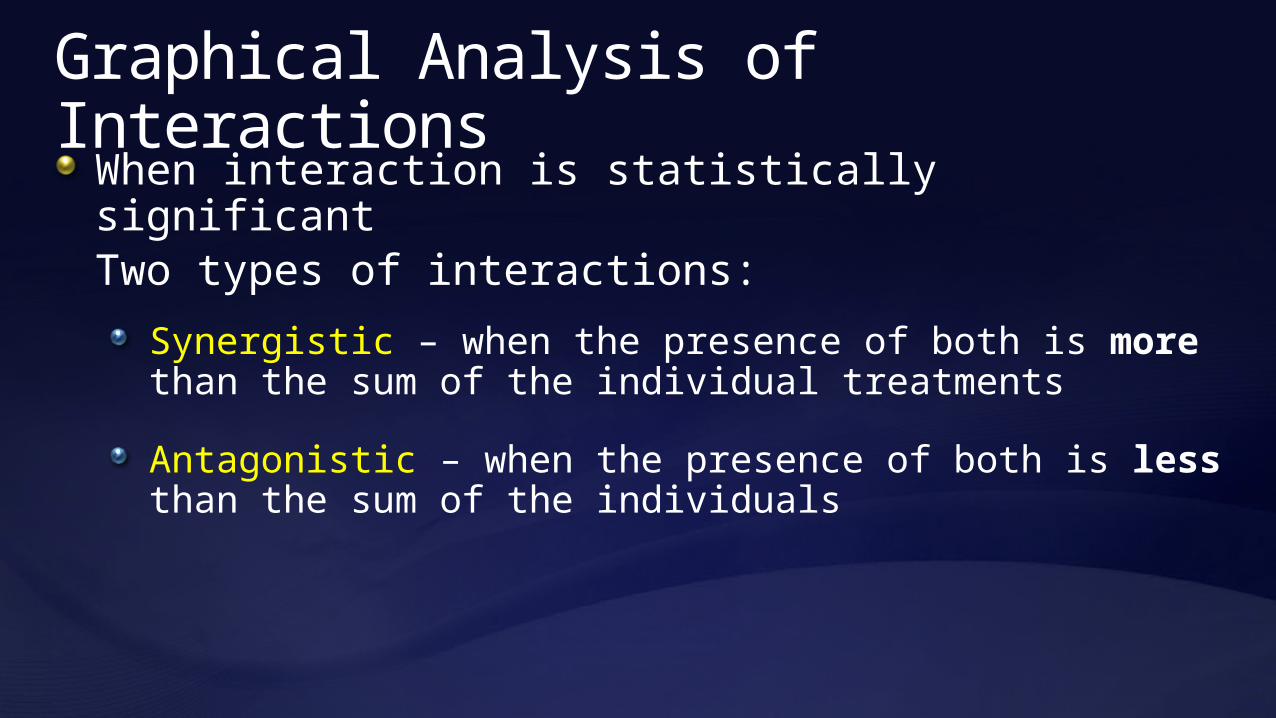
When interaction is statistically significantTwo types of interactions:
Synergistic – when the presence of both is more than the sum of the individual treatments
Antagonistic – when the presence of both is less than the sum of the individuals
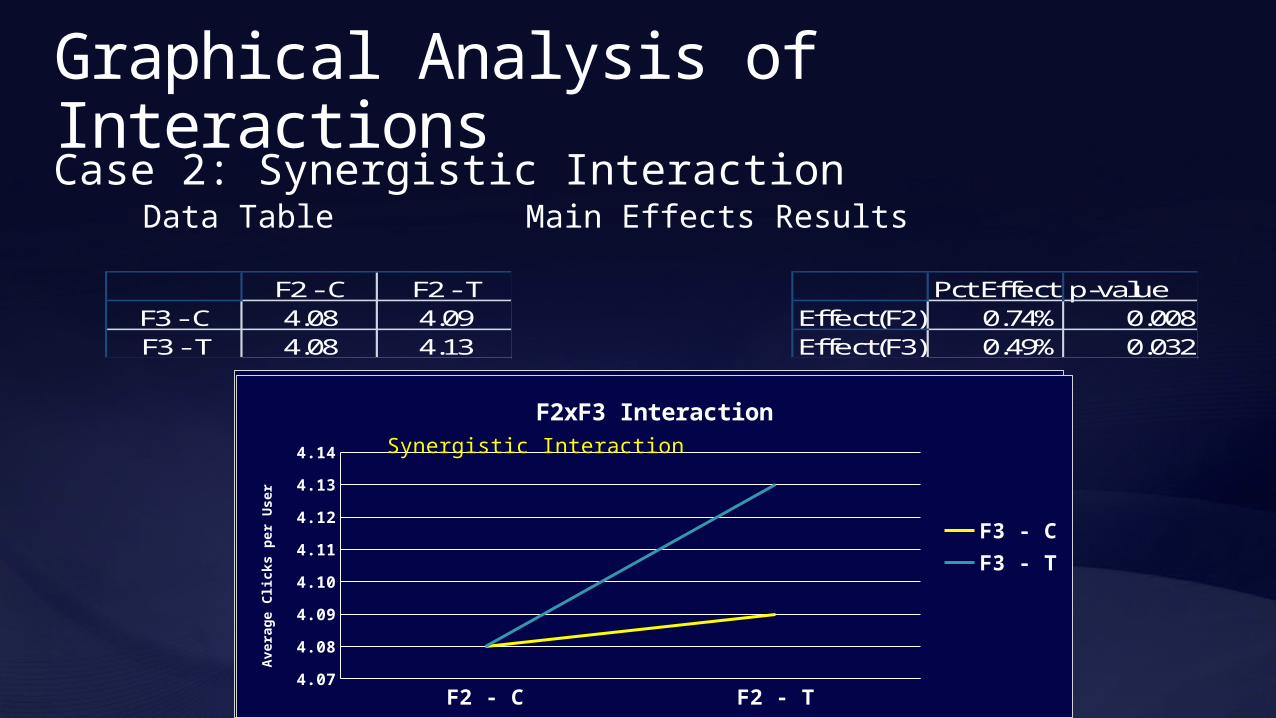
Graphical Analysis of Interactions
Case 2: Synergistic InteractionData Table Main Effects Results
Microsoft Confidential
F2 - C F2 - TF3 - C 4.08 4.09F3 - T 4.08 4.13
Pct Effect p-valueEffect(F2) 0.74% 0.008Effect(F3) 0.49% 0.032
F2 - C F2 - T4.07
4.08
4.09
4.10
4.11
4.12
4.13
4.14
F2xF3 Interaction
F3 - C
Num
ber
Days V
isit
MSN
HP
Synergistic Interaction
F2 - C F2 - T4.07
4.08
4.09
4.10
4.11
4.12
4.13
4.14
F2xF3 Interaction
F3 - CF3 - T
Avera
ge C
licks p
er
User
Synergistic Interaction

Graphical Analysis of Interactions
Case 3: Antagonistic InteractionData Table Main Effects Results
Microsoft ConfidentialF2 - C F2 - T4.07
4.08
4.09
4.10
4.11
4.12
4.13
4.14
F2xF3 Interaction
F3 - C
Num
ber
Days V
isit
MSN
HP
Antagonistic Interaction
F2 - C F2 - T4.07
4.08
4.09
4.10
4.11
4.12
4.13
4.14
F2xF3 Interaction
F3 - CF3 - T
Avera
ge C
licks p
er
User
Antagonistic Interaction
Pct Effect p-valueEffect(F2) 0.18% 0.396Effect(F3) 0.55% 0.028
F2 - C F2 - TF3 - C 4.08 4.11F3 - T 4.12 4.11

Challenges and Advanced Concepts
Variance calculations for metricsNon-parametric alternatives to t-test, ANOVARobot detectionAutomatic detection of interesting population segmentsExperimentation with exploration/exploitation schemes
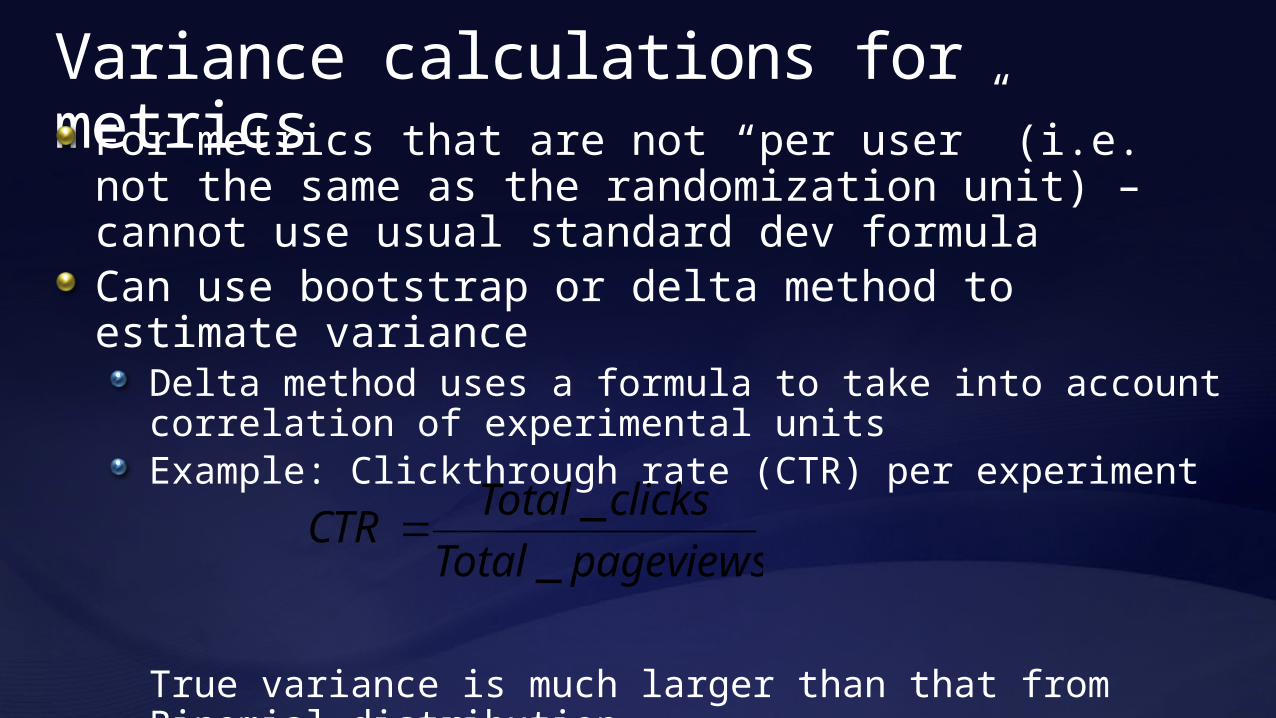
Variance calculations for metricsFor metrics that are not “per user” (i.e. not the same as the randomization unit) – cannot use usual standard dev formulaCan use bootstrap or delta method to estimate variance
Delta method uses a formula to take into account correlation of experimental unitsExample: Clickthrough rate (CTR) per experiment
True variance is much larger than that from Binomial distribution
pageviewsTotal
clicksTotalCTR
_
_
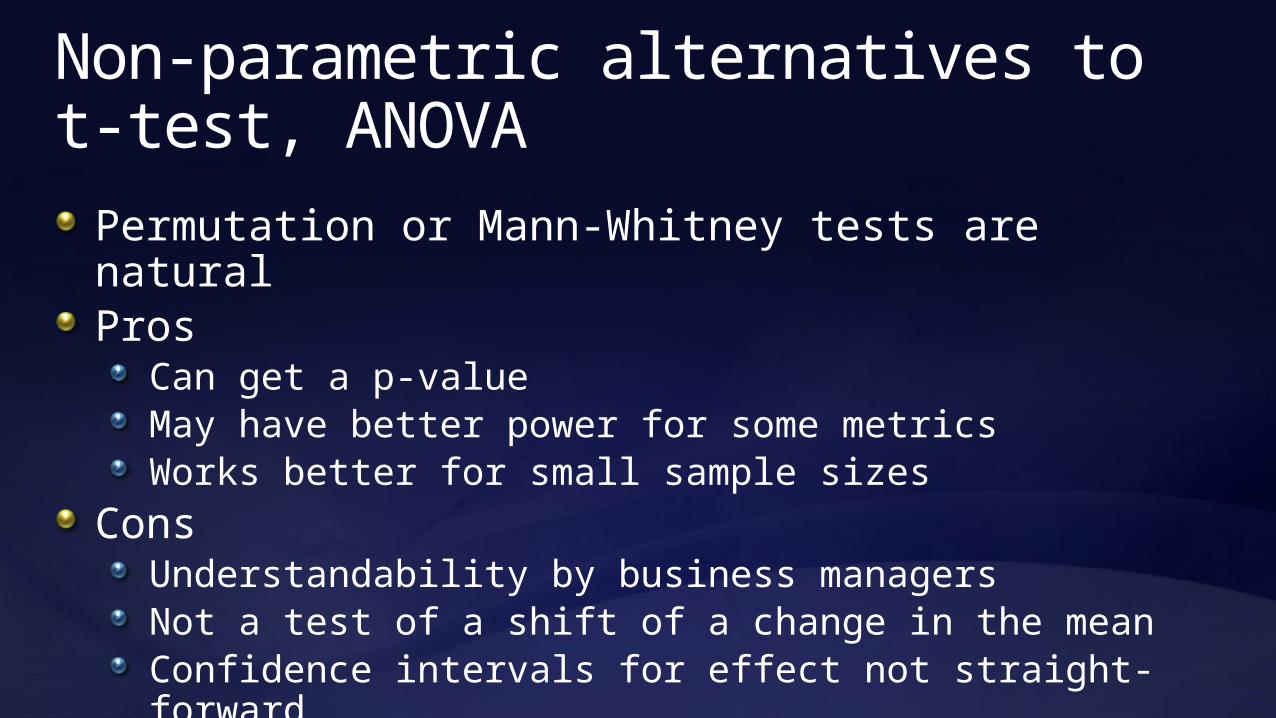
Non-parametric alternatives to t-test, ANOVA
Permutation or Mann-Whitney tests are naturalPros
Can get a p-valueMay have better power for some metricsWorks better for small sample sizes
Cons Understandability by business managersNot a test of a shift of a change in the meanConfidence intervals for effect not straight-forward
Robot filteringWhat is “best” way to develop heuristics to detect robots?What is “best” way to assess how well heuristics are doing?How to adjust robot detection parameters based on the specific site in the test?
For exampleSites with low traffic may need more aggressive robot filteringSites that have more robot traffic may need more aggressive robot filteringSites that expect active users (e.g. many clicks per hour) need less aggressive robot filteringSites that require users to sign-in should have fewer robots so less aggressive robot filtering required
Automatic detection of interesting population segments
A population segment is interesting if their response to the Treatment is different from the overall responseSegments can be defined by a number of variables
Browser or operating systemReferrer (e.g. from search engine, etc.)Signed-in statusLoyaltyDemographicsLocation – country, state, size of city (use IP lookup)Bandwidth

Experimentation with exploration/exploitation schemes
Want to automatically display best content based on exploration/exploitation strategyIs this strategy better than editor-placed content?What are the optimal parameter values?
Percent in exploration group?How long to test content in exploration group?What level of significance is needed?

BREAK