Embed Size (px)
Citation preview
Role of Ammonia in Formation of Secondary Particulate Matter: A Study from Kanpur, India
Mukesh Sharma, Shyam Kishore, Tejas, and Sailesh
Environmental Engineering and Management ProgramDepartment of Civil Engineering
Indian Institute of Technology Kanpur, Kanpur 208016, India
Indoflux Meeting Chennai July 12-16, 2006

Case Study – Secondary Particle Formation
Should Air Quality Measurements be Subset of Indo-flux Measurements – if yes, how?
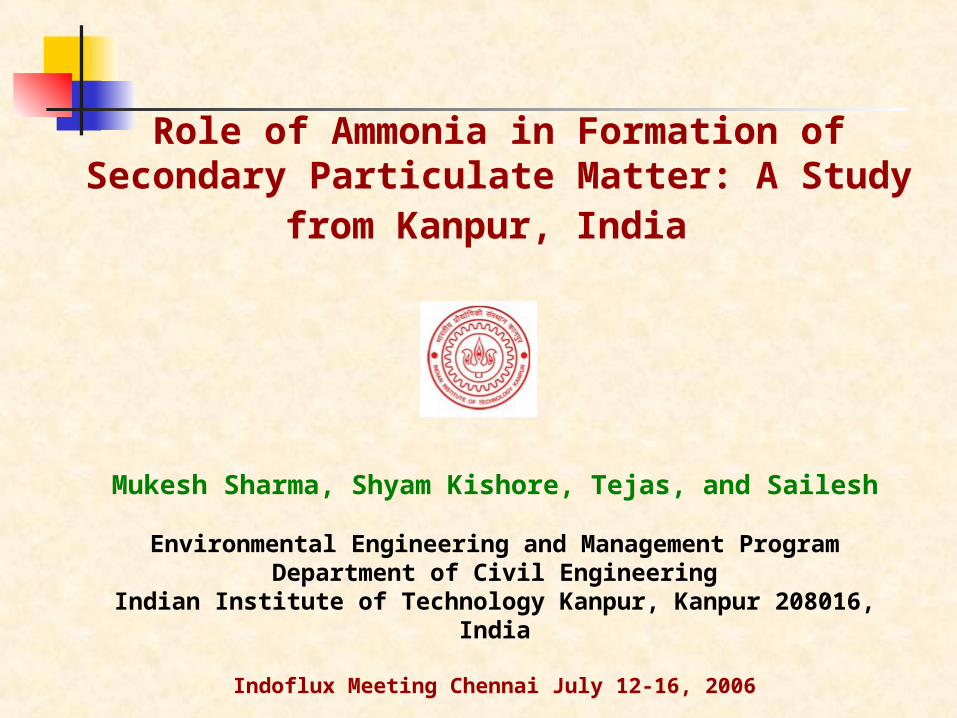
BACKGROUND
National Air Quality Program Suggests two Issues
o Consistently high particulate matter( PM) levelso Consistently rising levels of oxides of nitrogen (NOx)______________________________________________o Ozoneo VOCs, BTX, PAHs, Dioxins, Metalso Water Soluble Ions
0
100
200
300
400
500
600
700
SO2 NOX SPM
DELHI KOLKATA MUMBAI KANPUR
ug
/m3
Delhi
Mumbai Kolkata
Kanpur
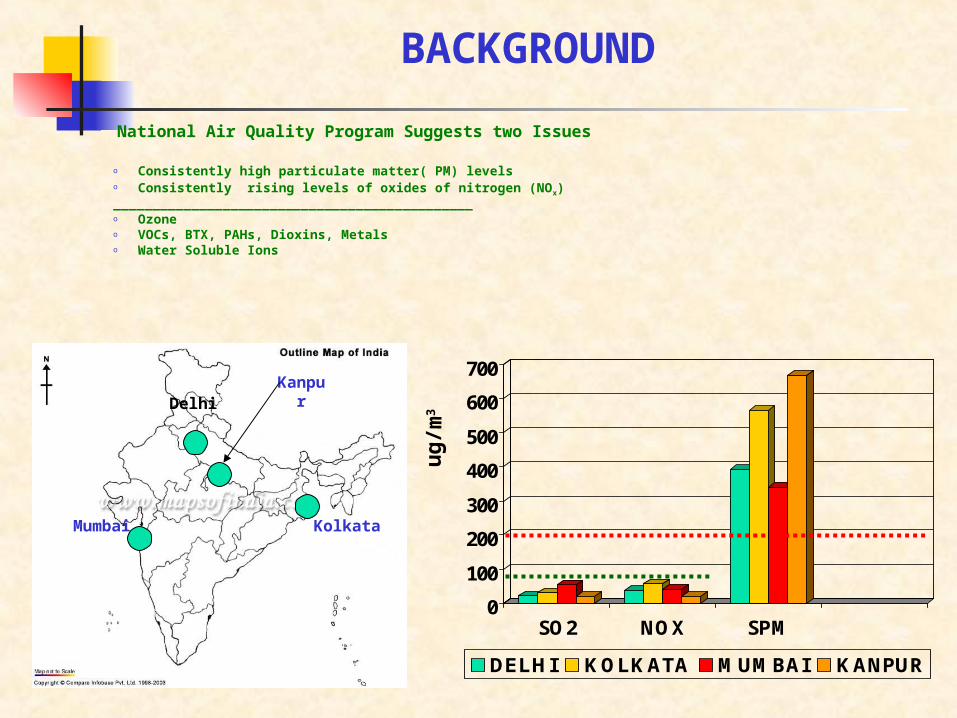
Summer PM10 Variation
Summer NOx Variation
Time Series : 1998-2004 New Delhi
Average PM10: 400 ug/m3
d[NOx]/dt = 10 ug/m3-yr
NOx , SO2and PM10 Interlinked
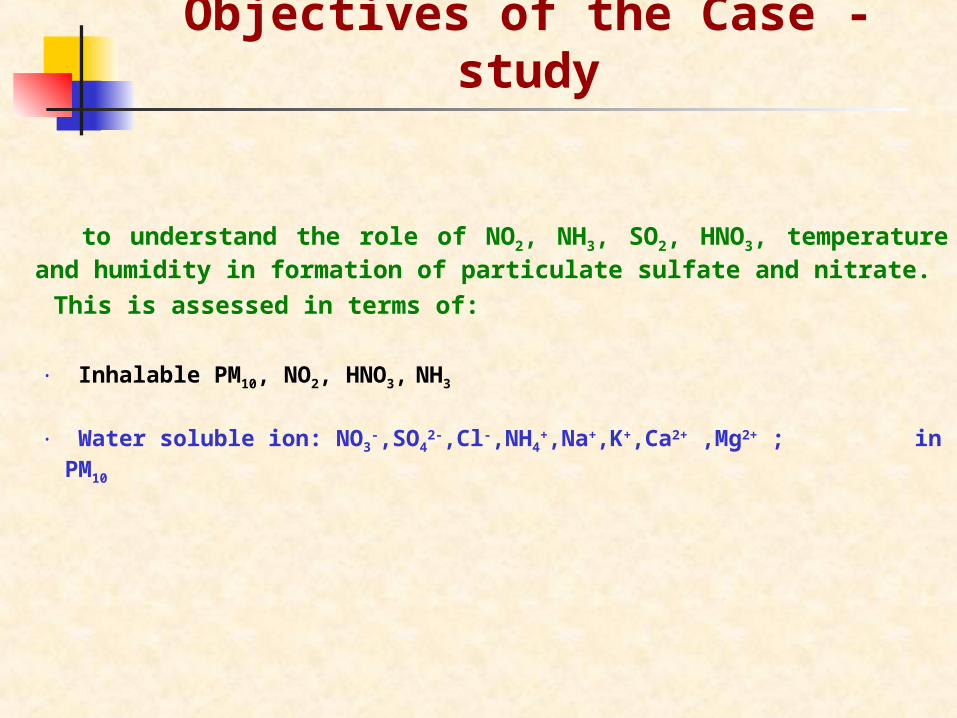
Objectives of the Case - study
to understand the role of NO2, NH3, SO2, HNO3, temperature and humidity in formation of particulate sulfate and nitrate.
This is assessed in terms of:
• Inhalable PM10, NO2, HNO3, NH3
• Water soluble ion: NO3-,SO4
2-,Cl-,NH4+,Na+,K+,Ca2+ ,Mg2+ ; in PM10
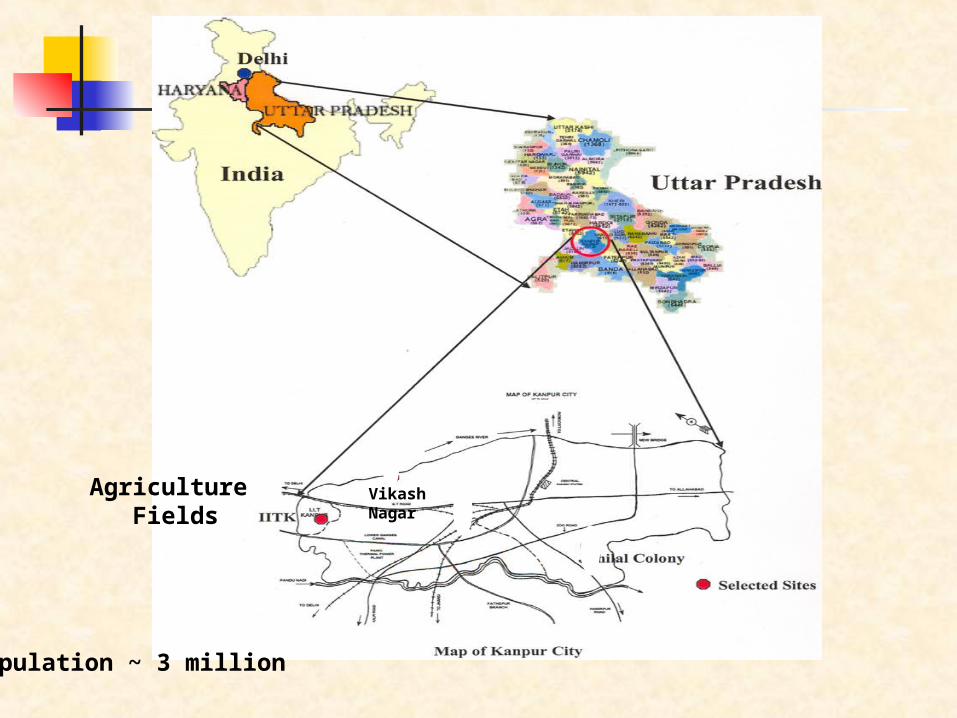
Agriculture Fields
Vikash Nagar
Population ~ 3 million
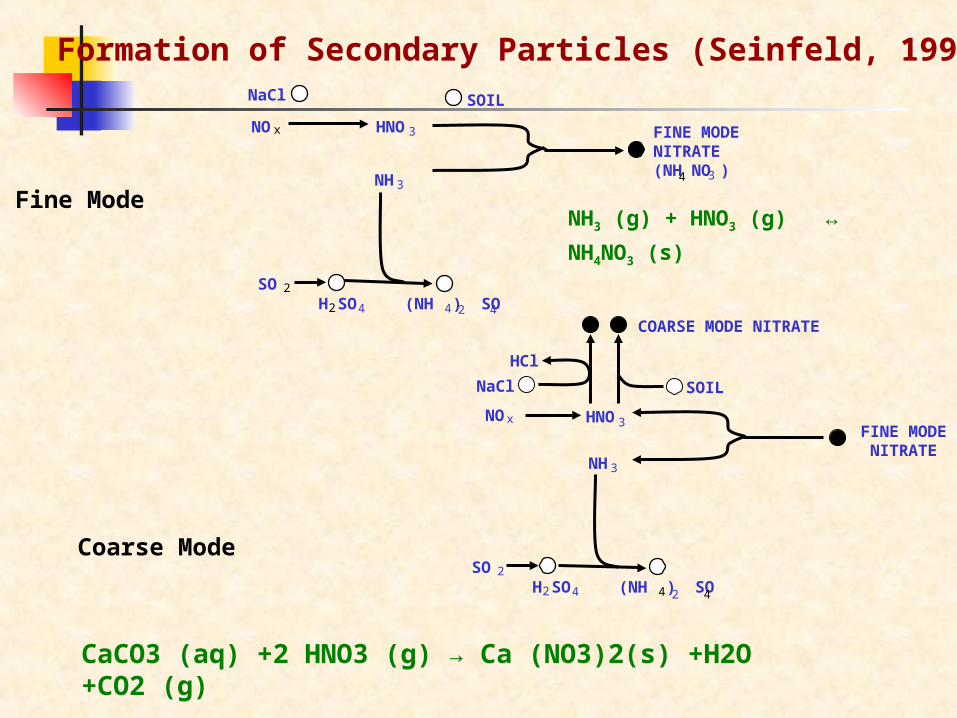
Formation of Secondary Particles (Seinfeld, 1996)
NH3 (g) + HNO3 (g) ↔ NH4NO3 (s)
NaCl
NOx HNO3
NH3
SOIL
FINE MODENITRATE(NH NO )4 3
SO 2H SO2 4 (NH ) SO4 2 4
HCl
NaCl
HNO3NOx
SOIL
NH3
FINE MODENITRATE
SO 2H SO2 4 (NH ) SO4 2 4
COARSE MODE NITRATE
CaCO3 (aq) +2 HNO3 (g) → Ca (NO3)2(s) +H2O +CO2 (g)
Fine Mode
Coarse Mode
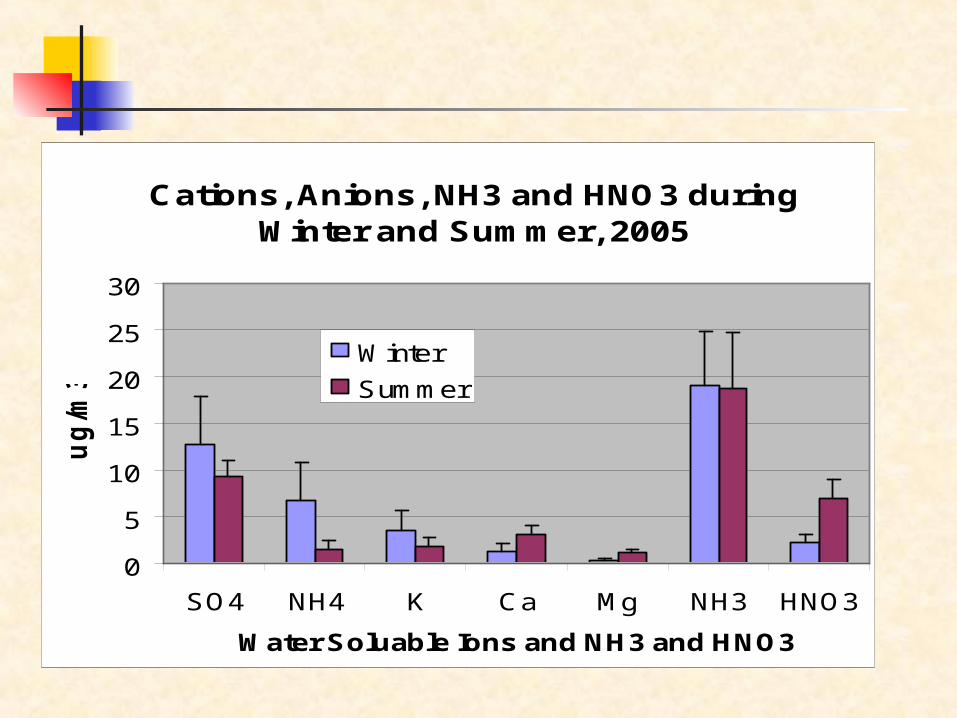
Cations, Anions, NH3 and HNO3 during Winter and Summer, 2005
0
5
10
15
20
25
30
SO4 NH4 K Ca Mg NH3 HNO3
Water Soluable Ions and NH3 and HNO3
ug
/m3
Winter
Summer
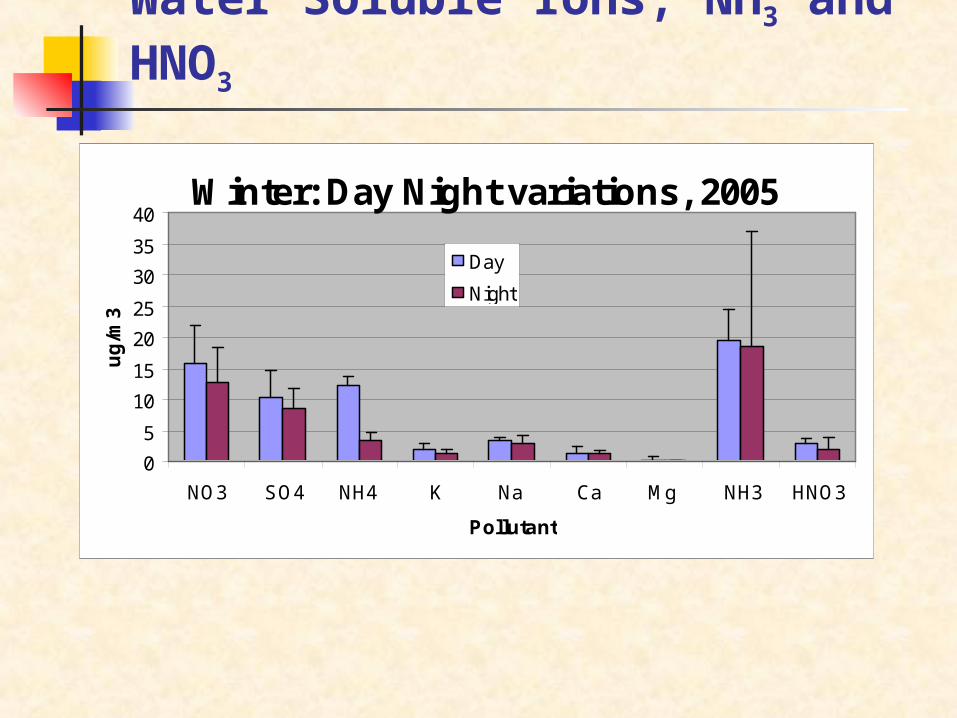
Water Soluble Ions, NH3 and HNO3
Winter: Day Night variations, 2005
0
5
10
15
20
25
30
35
40
NO3 SO4 NH4 K Na Ca Mg NH3 HNO3
Pollutant
ug
/m3
Day
Night
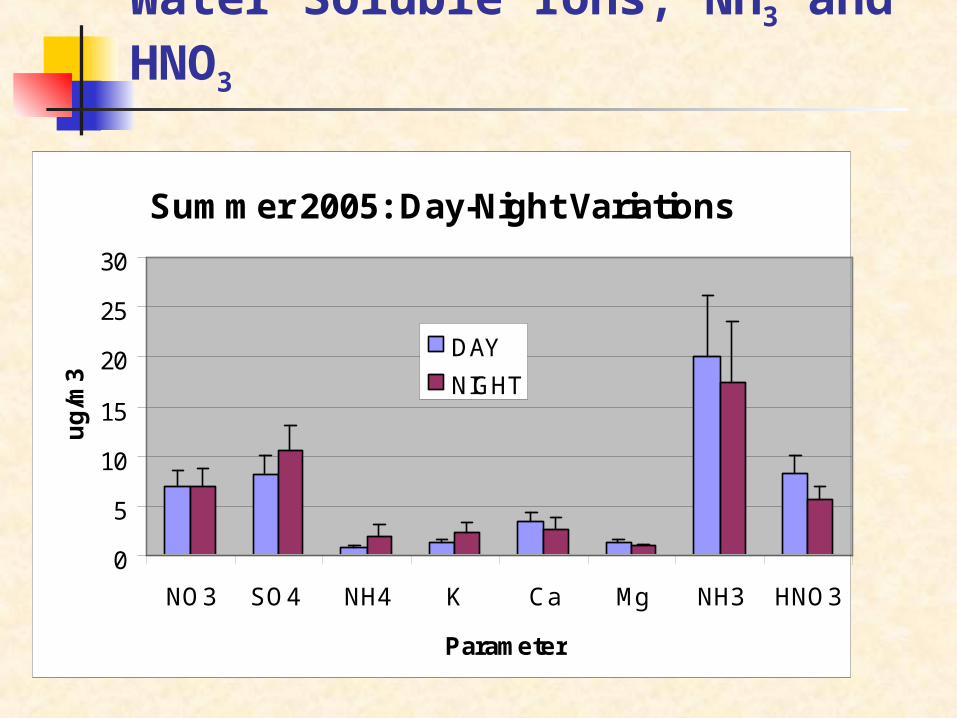
Water Soluble Ions, NH3 and HNO3
Summer 2005: Day-Night Variations
0
5
10
15
20
25
30
NO3 SO4 NH4 K Ca Mg NH3 HNO3
Parameter
ug
/m3
DAY
NIGHT
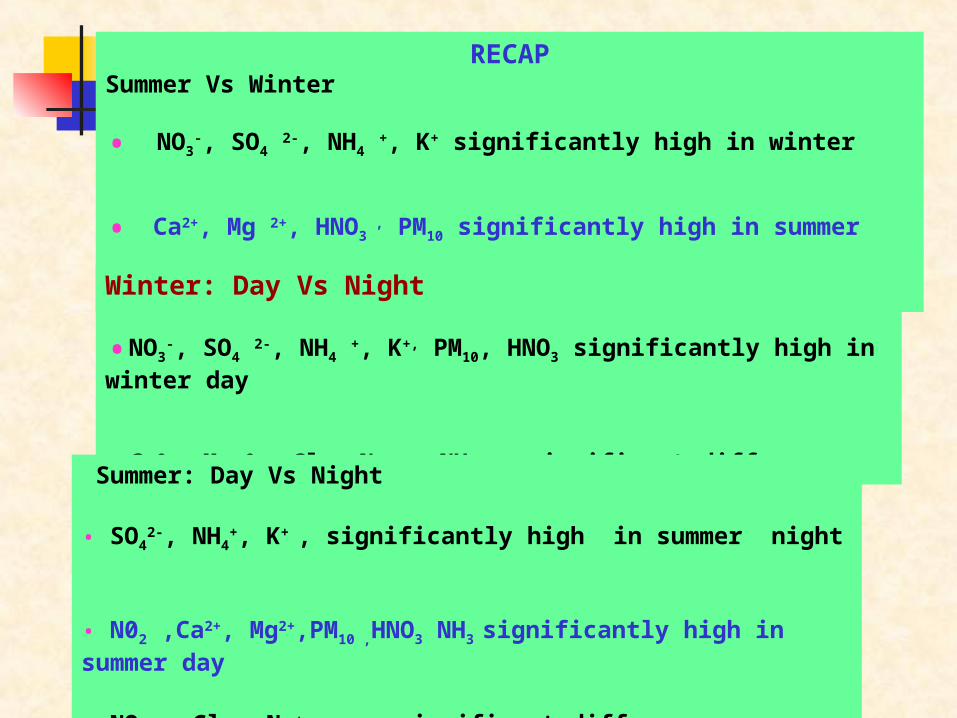
RECAPSummer Vs Winter
• NO3-, SO4 2-, NH4 +, K+ significantly high in winter
• Ca2+, Mg 2+, HNO3 , PM10 significantly high in summer
Winter: Day Vs Night
•NO3-, SO4 2-, NH4 +, K+, PM10, HNO3 significantly high in winter day
•Ca2+, Mg 2+, Cl -, Na +, NH3 no significant difference
Summer: Day Vs Night
• SO42-, NH4
+, K+ , significantly high in summer night
• N02 ,Ca2+, Mg2+,PM10 ,HNO3 NH3 significantly high in summer day
• NO3- , Cl- , Na+ no significant difference
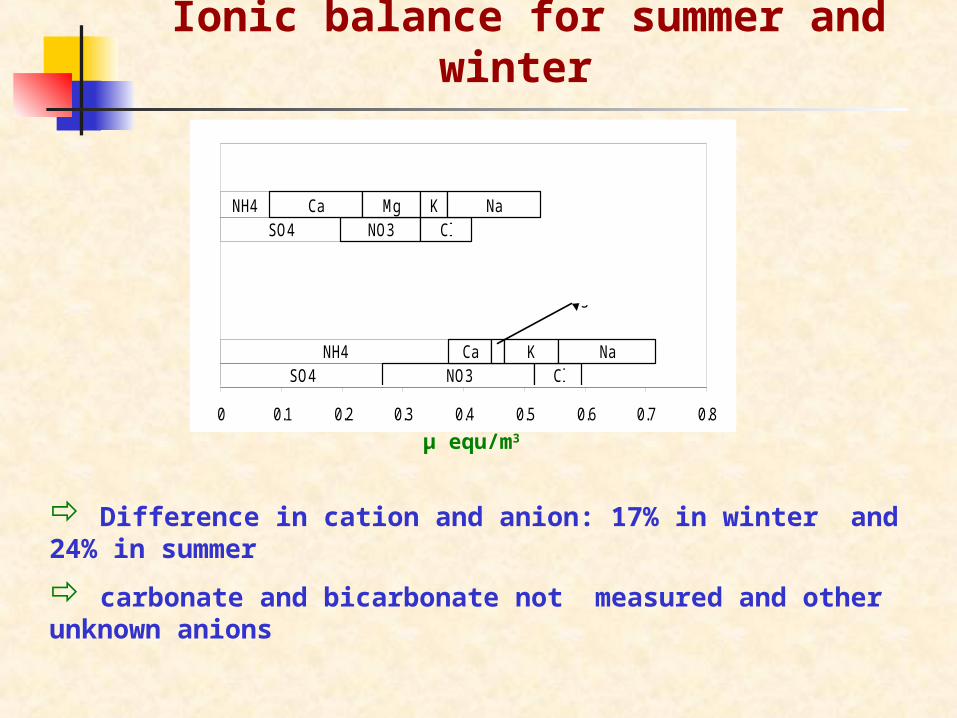
Ionic balance for summer and winter
SO4
NH4
NH4
SO4
NO3
Ca
Ca
NO3
MgCl
Cl
K
K
Na
Na
0 0.1 0.2 0.3 0.4 0.5 0.6 0.7 0.8
Mg
Summer
Winter
µ equ/m3
Difference in cation and anion: 17% in winter and 24% in summer
carbonate and bicarbonate not measured and other unknown anions
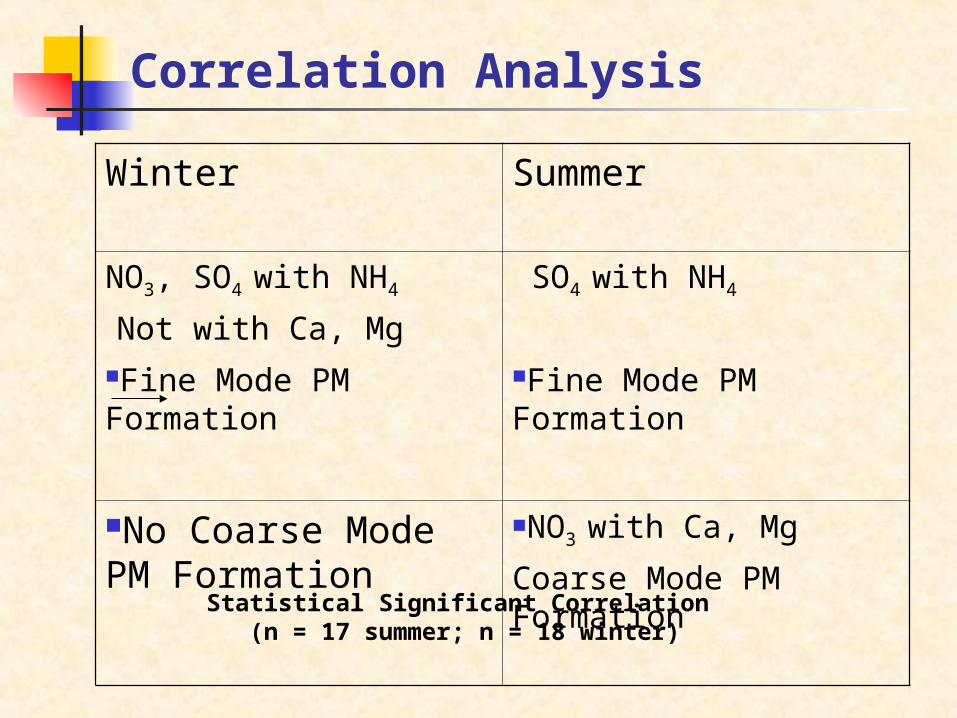
Correlation Analysis
Winter SummerNO3, SO4 with NH4
Not with Ca, MgFine Mode PM Formation
SO4 with NH4
Fine Mode PM Formation
No Coarse Mode PM Formation
NO3 with Ca, Mg
Coarse Mode PM Formation
Statistical Significant Correlation (n = 17 summer; n = 18 winter)
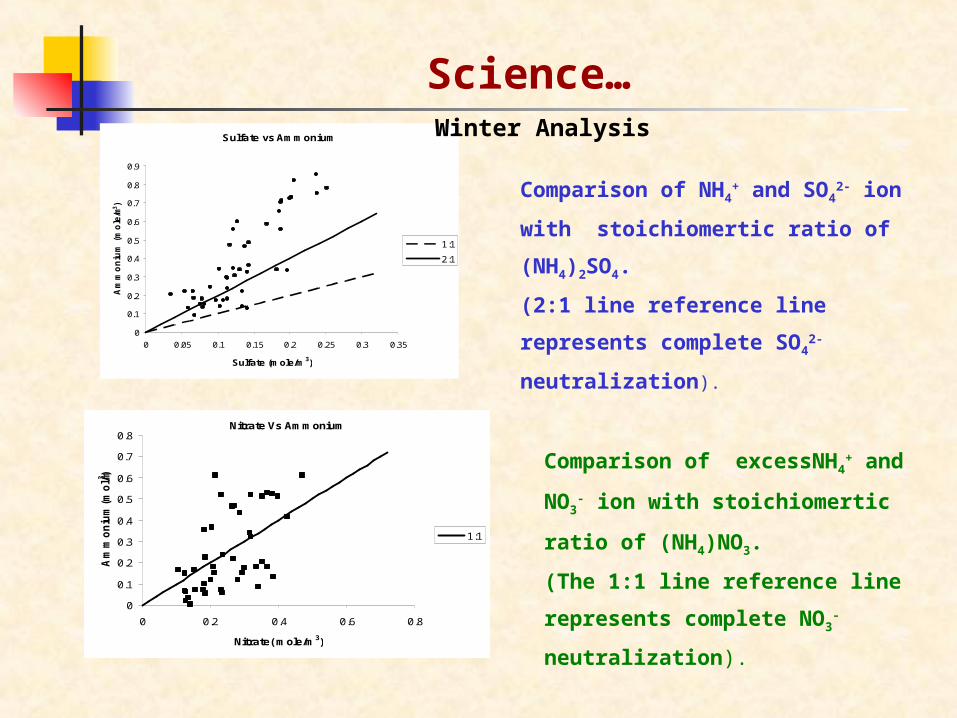
Science…Sulfate vs Ammonium
0
0.1
0.2
0.3
0.4
0.5
0.6
0.7
0.8
0.9
0 0.05 0.1 0.15 0.2 0.25 0.3 0.35
Sulfate (mole/m3)
Am
mo
niu
m (
mo
le/m
3)
1:1
2:1
Comparison of NH4+ and SO4
2- ion with
stoichiomertic ratio of (NH4)2SO4.
(2:1 line reference line represents
complete SO42- neutralization).
Nitrate Vs Ammonium
0
0.1
0.2
0.3
0.4
0.5
0.6
0.7
0.8
0 0.2 0.4 0.6 0.8
Nitrate( mole/m3)
Am
mo
niu
m(m
ol/m3 )
1:1
Comparison of excessNH4+ and NO3
- ion
with stoichiomertic ratio of (NH4)NO3.
(The 1:1 line reference line represents
complete NO3- neutralization).
Winter Analysis
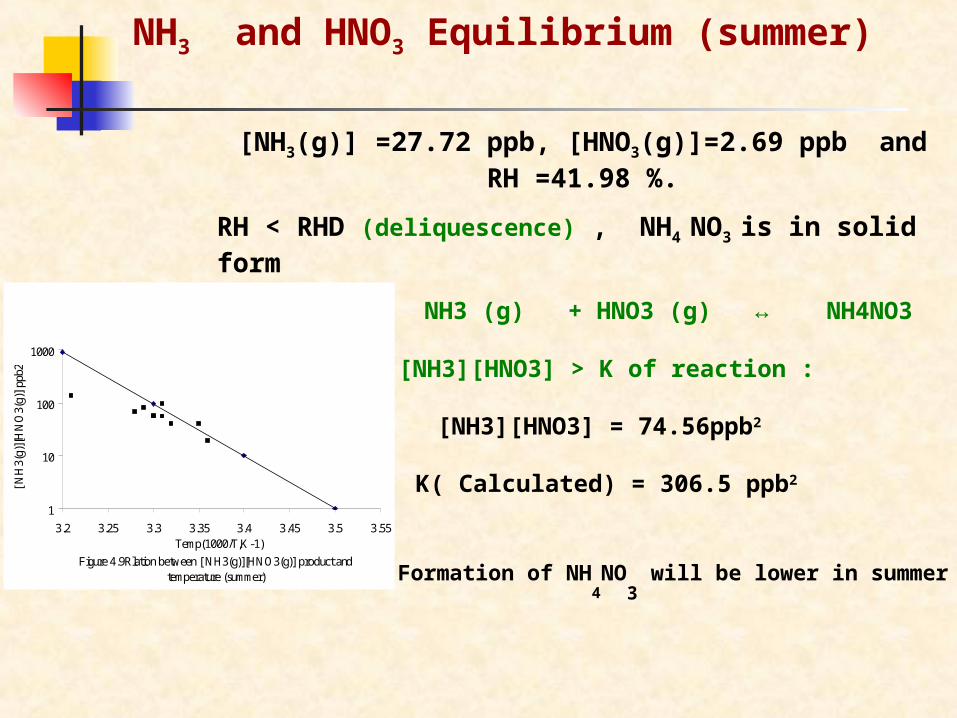
NH3 and HNO3 Equilibrium (summer)
[NH3(g)] =27.72 ppb, [HNO3(g)]=2.69 ppb and RH =41.98 %.
RH < RHD (deliquescence) , NH4 NO3 is in solid form
But…. for NH3 (g) + HNO3 (g) ↔ NH4NO3 (p)[NH3][HNO3] > K of reaction :
[NH3][HNO3] = 74.56ppb2
K( Calculated) = 306.5 ppb2
Formation of NH4NO
3 will be lower in summer
Figure 4.9Rlation between [ NH3(g)][HNO3(g)] product and temperature (summer)
1
10
100
1000
3.2 3.25 3.3 3.35 3.4 3.45 3.5 3.55Temp(1000/T,K-1)
[ N
H3(
g)][
HN
O3(
g)]
ppb2
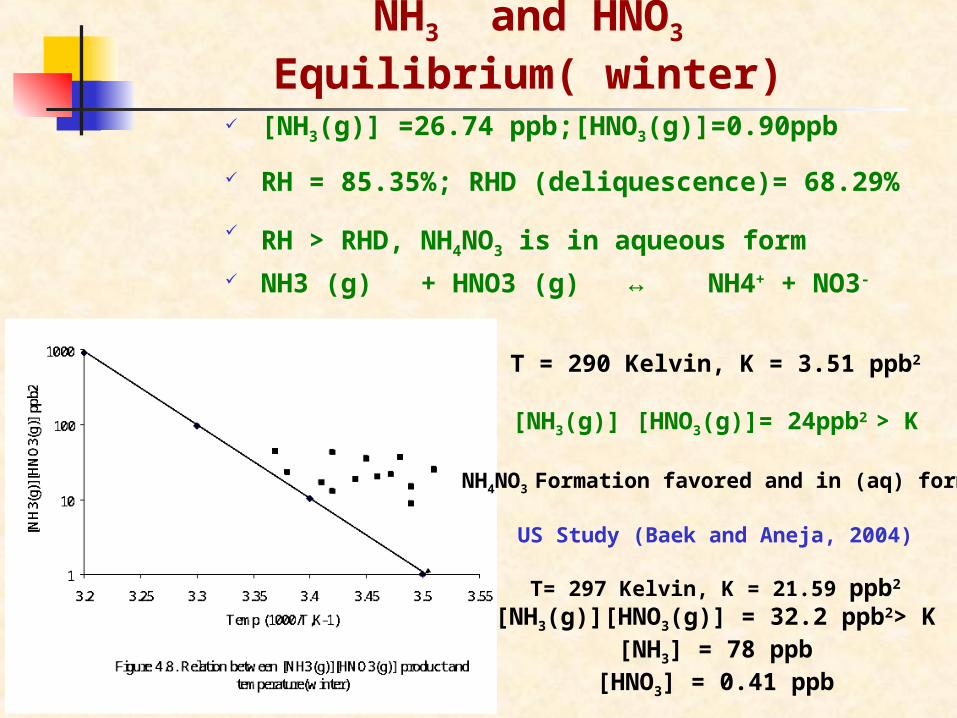
NH3 and HNO3 Equilibrium( winter) [NH3(g)] =26.74 ppb;[HNO3(g)]=0.90ppb
RH = 85.35%; RHD (deliquescence)= 68.29%
RH > RHD, NH4NO3 is in aqueous form NH3 (g) + HNO3 (g) ↔ NH4+ + NO3-
T = 290 Kelvin, K = 3.51 ppb2
[NH3(g)] [HNO3(g)]= 24ppb2 > K
NH4NO3 Formation favored and in (aq) form
US Study (Baek and Aneja, 2004)
T= 297 Kelvin, K = 21.59 ppb2
[NH3(g)][HNO3(g)] = 32.2 ppb2> K[NH3] = 78 ppb
[HNO3] = 0.41 ppb
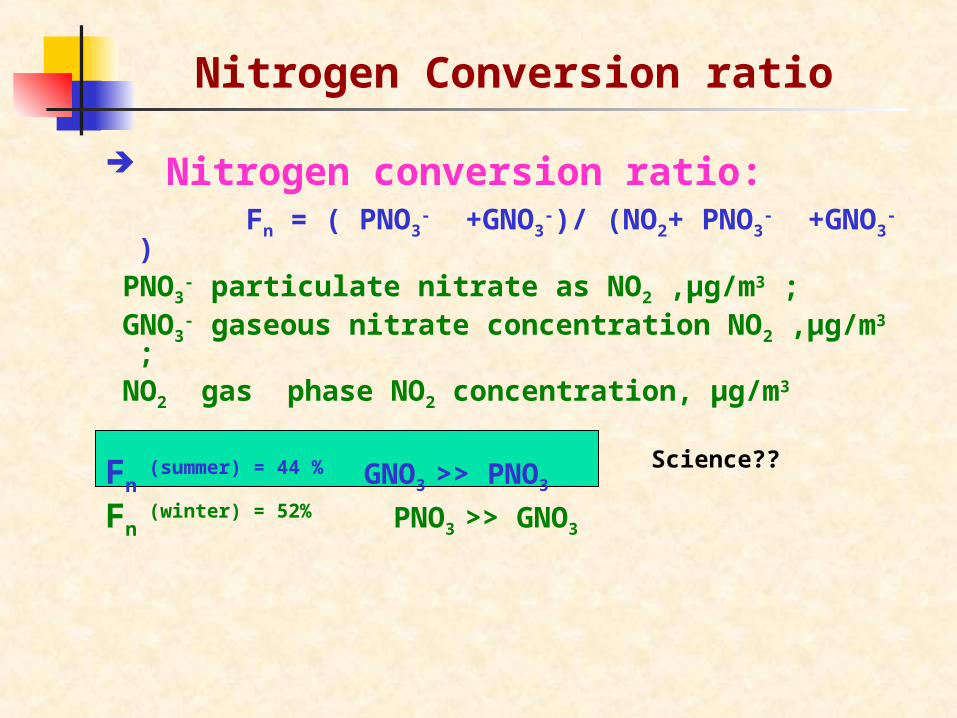
Nitrogen Conversion ratio
Nitrogen conversion ratio: Fn = ( PNO3
- +GNO3-)/ (NO2+ PNO3
- +GNO3- )
PNO3- particulate nitrate as NO2 ,µg/m3 ;
GNO3- gaseous nitrate concentration NO2 ,µg/m3 ;
NO2 gas phase NO2 concentration, µg/m3
Fn (summer) = 44 % GNO3 >> PNO3
Fn (winter) = 52% PNO3 >> GNO3
Science??
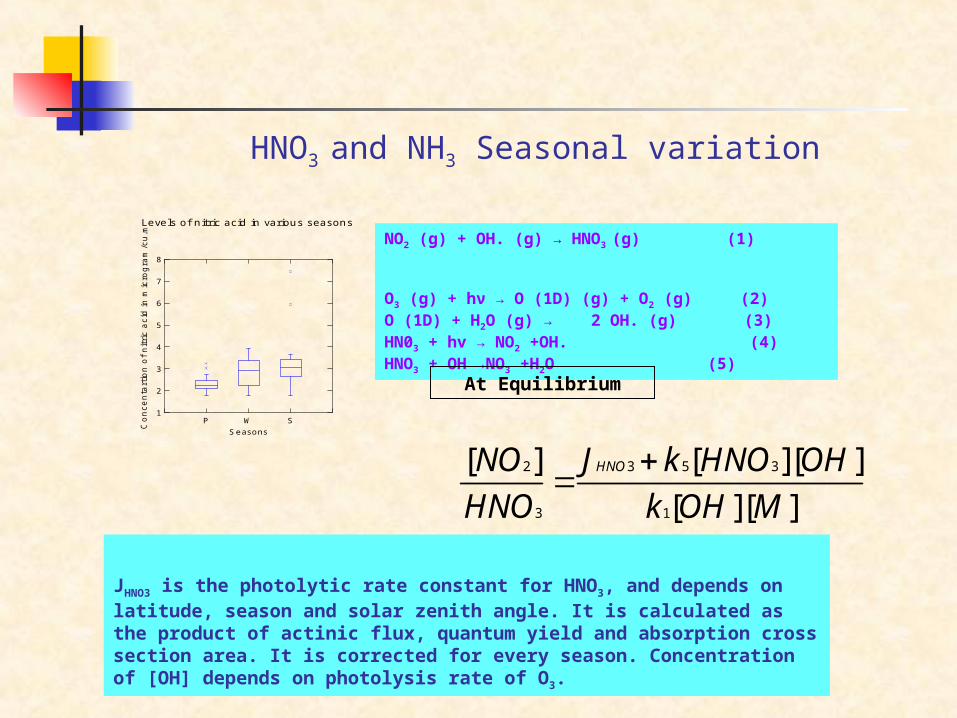
HNO3 and NH3 Seasonal variation
Levels of nitric acid in various seasons
P W SSeasons
1
2
3
4
5
6
7
8
Co
nce
nta
r ti o
n o
f n
i tri c
aci
d in
mic
r og
r am
/cu
.m NO2 (g) + OH. (g) → HNO3 (g) (1) O3 (g) + hν → O (1D) (g) + O2 (g) (2)O (1D) + H2O (g) → 2 OH. (g) (3)HN03 + hv → NO2 +OH. (4)HNO3 + OH →NO3 +H2O (5)
JHNO3 is the photolytic rate constant for HNO3, and depends on latitude, season and solar zenith angle. It is calculated as the product of actinic flux, quantum yield and absorption cross section area. It is corrected for every season. Concentration of [OH] depends on photolysis rate of O3.
2 3 5 3
3 1
[ ] [ ][ ]
[ ][ ]
HNONO J k HNO OH
HNO k OH M
At Equilibrium
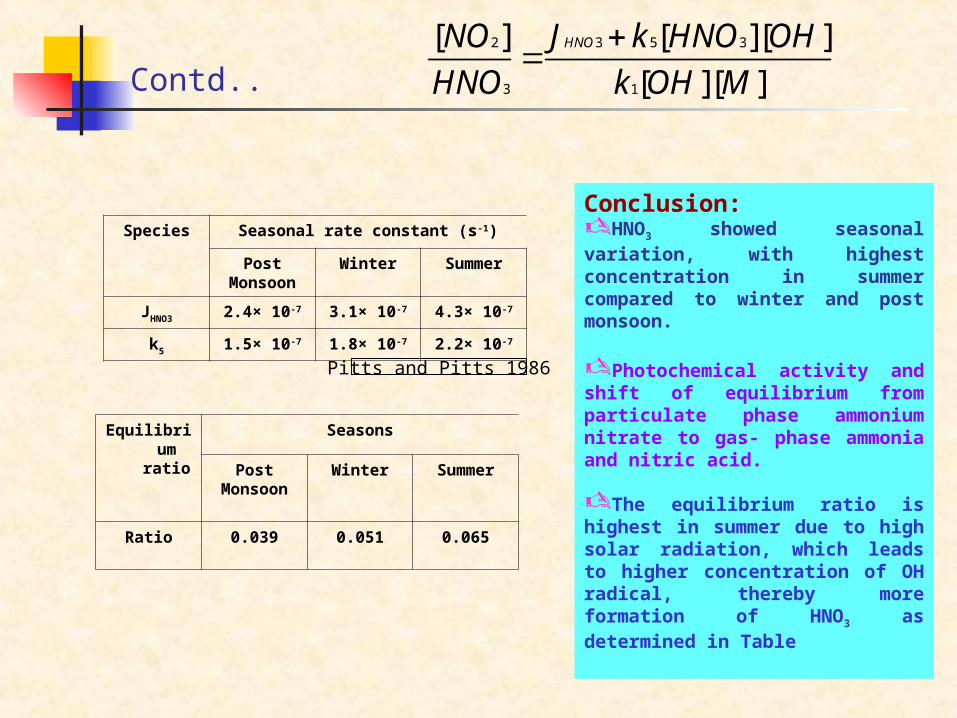
Conclusion:HNO3 showed seasonal variation, with highest concentration in summer compared to winter and post monsoon.
Photochemical activity and shift of equilibrium from particulate phase ammonium nitrate to gas- phase ammonia and nitric acid.
The equilibrium ratio is highest in summer due to high solar radiation, which leads to higher concentration of OH radical, thereby more formation of HNO3 as determined in Table
Contd..
Species Seasonal rate constant (s-1)
PostMonsoon
Winter Summer
JHNO3 2.4× 10⁻⁷ 3.1× 10⁻⁷ 4.3× 10⁻⁷
k5 1.5× 10⁻⁷ 1.8× 10⁻⁷ 2.2× 10⁻⁷
Equilibrium ratio
Seasons
PostMonsoon
Winter Summer
Ratio 0.039 0.051 0.065
Pitts and Pitts 1986
2 3 5 3
3 1
[ ] [ ][ ]
[ ][ ]
HNONO J k HNO OH
HNO k OH M
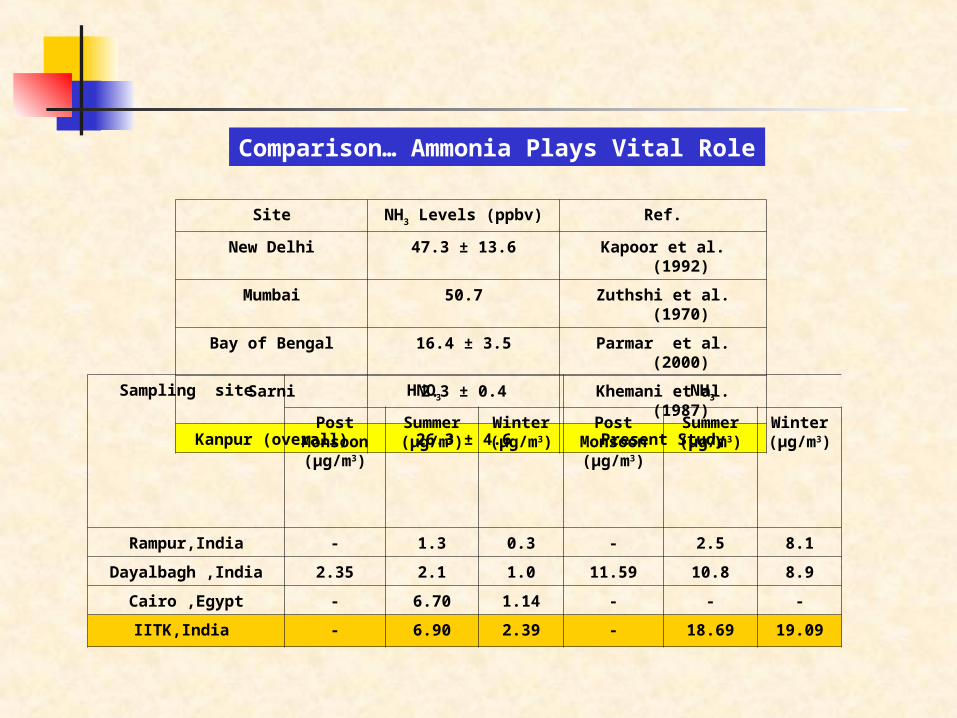
Site NH3 Levels (ppbv) Ref.
New Delhi 47.3 ± 13.6 Kapoor et al. (1992)
Mumbai 50.7 Zuthshi et al. (1970)
Bay of Bengal 16.4 ± 3.5 Parmar et al. (2000)
Sarni 2.3 ± 0.4 Khemani et al. (1987)
Kanpur (overall) 26.3 ± 4.6 Present Study
Sampling site HNO3 NH3
PostMonsoon(µg/m3)
Summer(µg/m3)
Winter(µg/m3)
PostMonsoon(µg/m3)
Summer(µg/m3)
Winter(µg/m3)
Rampur,India - 1.3 0.3 - 2.5 8.1
Dayalbagh ,India 2.35 2.1 1.0 11.59 10.8 8.9
Cairo ,Egypt - 6.70 1.14 - - -
IITK,India - 6.90 2.39 - 18.69 19.09
Comparison… Ammonia Plays Vital Role
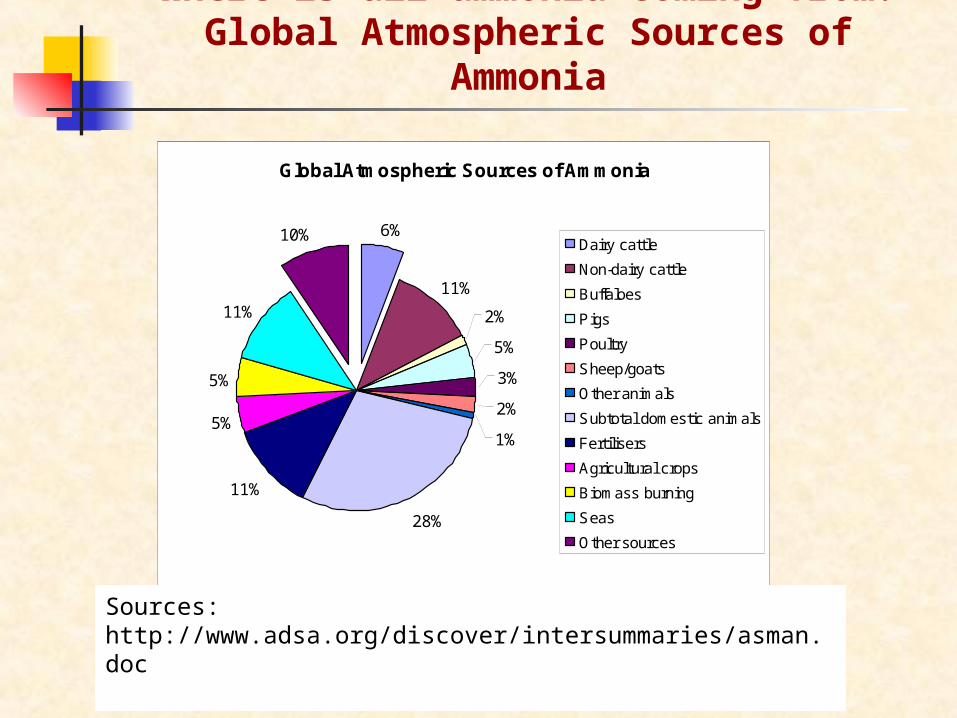
Where is all ammonia coming from?Global Atmospheric Sources of Ammonia
Global Atmospheric Sources of Ammonia
6%
11%
2%
5%
3%
2%
1%
28%
11%
5%
5%
11%
10%Dairy cattle
Non-dairy cattle
Buffaloes
Pigs
Poultry
Sheep/goats
Other animals
Subtotal domestic animals
Fertilisers
Agricultural crops
Biomass burning
Seas
Other sources
Sources: http://www.adsa.org/discover/intersummaries/asman.doc
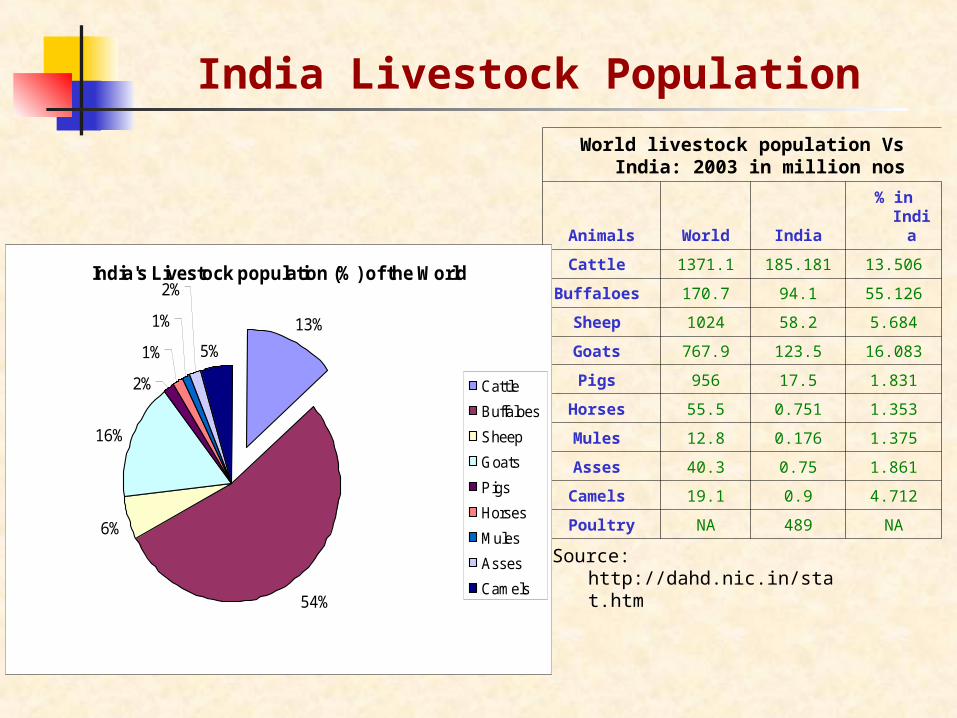
India Livestock Population
World livestock population Vs India: 2003 in million nos
Animals World India % in India
Cattle 1371.1 185.181 13.506
Buffaloes 170.7 94.1 55.126
Sheep 1024 58.2 5.684
Goats 767.9 123.5 16.083
Pigs 956 17.5 1.831
Horses 55.5 0.751 1.353
Mules 12.8 0.176 1.375
Asses 40.3 0.75 1.861
Camels 19.1 0.9 4.712
Poultry NA 489 NA
Source: http://dahd.nic.in/stat.htm
India's Livestock population (%) of the World
13%
54%
6%
16%
2%
1%
1%
2%
5%
Cattle
Buffaloes
Sheep
Goats
Pigs
Horses
Mules
Asses
Camels
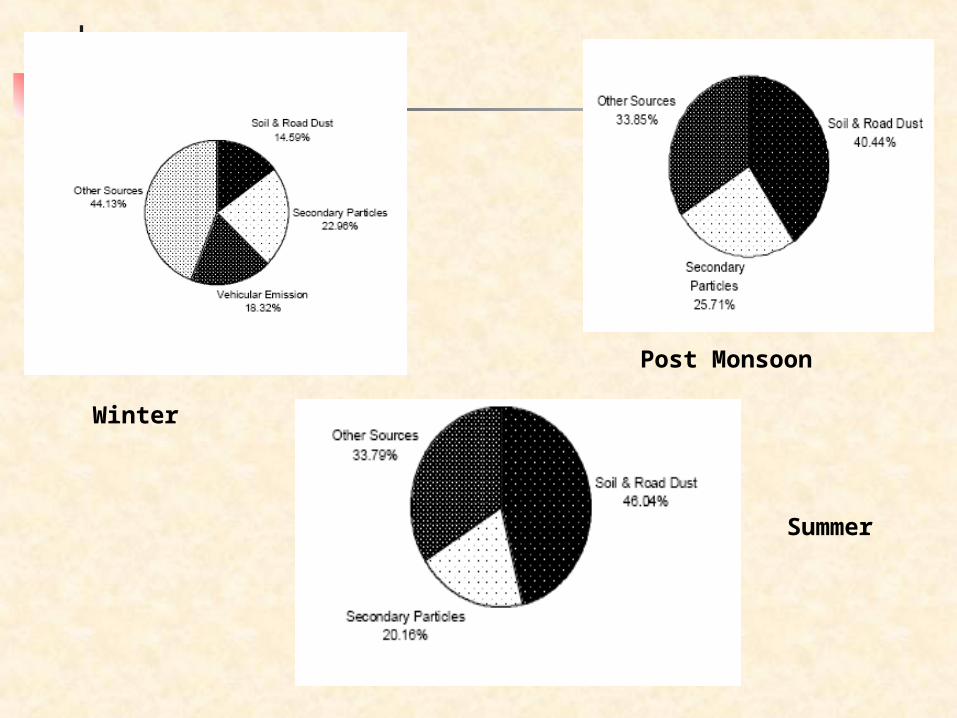
Winter
Post Monsoon
Summer
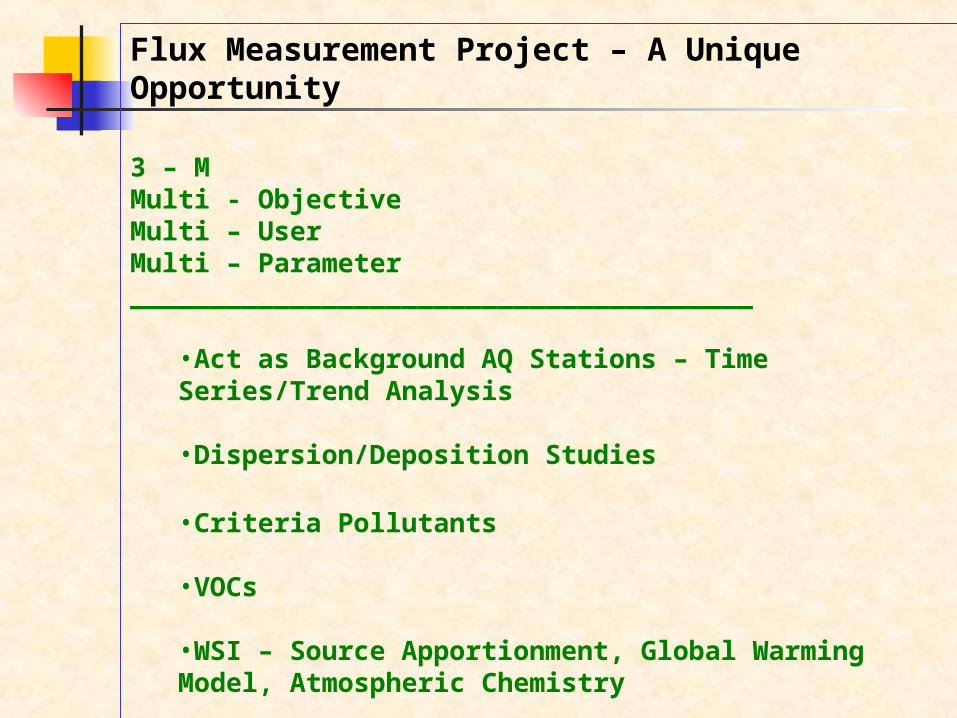
Flux Measurement Project – A Unique Opportunity
3 – MMulti - ObjectiveMulti – UserMulti – Parameter_______________________________________
•Act as Background AQ Stations – Time Series/Trend Analysis
•Dispersion/Deposition Studies
•Criteria Pollutants
•VOCs
•WSI – Source Apportionment, Global Warming Model, Atmospheric Chemistry

Acknowledgements….
We gratefully acknowledge
-- INDO-U.S. SCIENCE AND TECHNOLOGY FORUM -- DST, New Delhi-- Prof. Ramesh and Workshop Organizers

![[XLS]nregs-mp.orgnregs-mp.org/MP_Staff.xls · Web viewShri Nand Kishore Sahu Shti Manoj Chaurasiya Shri Shyam Sundar Soni Smt. Som Prabha Yadav shri A.K. Raghuwanshi smt. Heman satija](https://img.pdfslide.net/doc/110x75/5aaf378f7f8b9a6b308d0ad8/xlsnregs-mporgnregs-mporgmpstaffxlsweb-viewshri-nand-kishore-sahu-shti-manoj.jpg)