Embed Size (px)
Citation preview

Role of the Certified LaboratoryWhat really happens when you drop off a sample at a VAP certified lab,
and why it is important for CPs to know
Kevin Shoemaker Astrea TaylorOpal Johnson

Next Phase of the Project Life Cycle
1. PLANNING:
2. SAMPLING:
3. ASSESSMENT:
4. EVALUATION:
Plan for data collection using the DQO process
Collect data using a SAP and FSOPs
Verify that data meets DQOs
Make data-based project decisions
VAP CL Rule
Ohio Administrative Code (OAC) 3745-300-04

Labs are certified for: Specific methods, analytes, and parameter
groups.A CP is expected to check with the certified lab to determine which analytes, parameter groups, and methods they’re currently certified for prior to conducting sampling at a voluntary action property.
Check with CLs to ensure adequate sample volumes / amounts are sent for analysis.
Current CL certificates are located on VAP’s website:http://epa.ohio.gov/derr/vap/pro_lab/labs.aspx

Detection Limits Certified laboratories may not be able to
meet the detection limit(s) a CP requires to determine if applicable standards are met.
CPs are expected to check with the certified lab about the detection limits the lab can achieve for various analytes, parameter groups, and methods.

Performance Evaluations (PEs) & CL Audits Periodic PEs are no longer used to monitor
performance of CLs. PEs are only required for laboratories applying for initial or additional certification.
System audits are used to evaluate qualifications of labs applying for initial or additional certification.
Compliance audits are used to monitor CL performance. These audits are conducted at a frequency determined by the Agency.

Analytical Methods CLs can Use Methods published or endorsed by U.S. EPA
Performance-based methods are permitted when a USEPA method does not exist for an analyte or parameter group.
Asbestos must be accredited by either:‒ American Industrial Hygiene Association (AIHA), or‒ National Institute of Standards and Testing, National
Voluntary Laboratory Accreditation Program (NIST NVLAP)

From the field to the lab
Photos: www.coleman.com; www.labs.gosh.nhs.uk

Sample delivery: Shipping• Ask the lab which method they prefer
– Find out about Saturday delivery
• Downsides of shipping: – Delayed or lost coolers– Sample temperatures may change– Lab staff may get overwhelmed
• Up to 40 or more coolers per day
– Rush samples may not get logged in ASAP– Hold time concern

Sample delivery: Drop-off• Drop-off or Courier service to the CL
– Elevated / frozen temperatures aren’t an issue if samples were taken from the field that day and iced
– Less risk of cooler loss or delayed shipment – Samples are more likely to get logged in that day instead of
next day– May be able to get samples analyzed that night or first
thing in the morning – Short hold times are less likely to expire– Courier may be able to answer questions or provide
missing info

Log-in Department• Receive coolers, triage, unpack samples
– Coolers marked with short-holds and rush are prioritized
– Short-holds and rush samples may be taken by analysts (label samples correctly)
• Variety of knowledge, experience, education, training
• Connection between samples and Project Manager

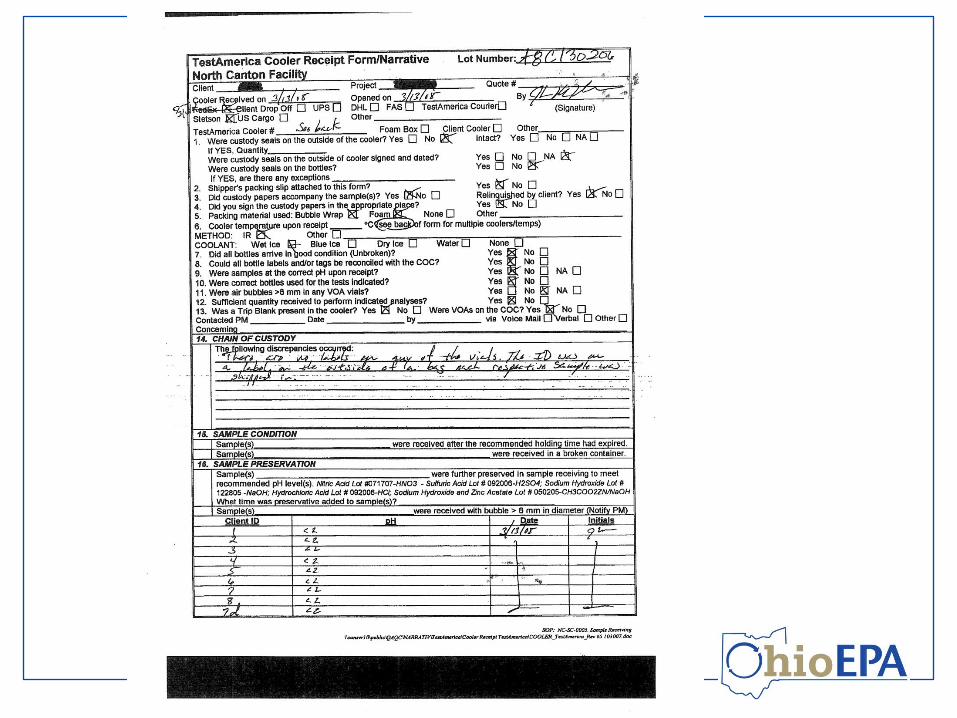
Cooler / Sample Receipt Form
• Log-in fills out form, noting– Method of delivery– Date and time received – Presence / absence of ice – Status of ice – Temperature of samples
• 4.0 ± 2 °C is acceptable unless samples were taken that day (with the exception of air and metals)

Cooler / Sample Receipt Form• Detail any problems
– sample breakage, unlabeled samples, mislabeled samples, times on COC and samples not matching, elevated temperatures, missing samples, preservative problems, unlabeled trip blanks, etc.
• Scanned with chain of custody• Part of NFA package, public record• CP acting with care and diligence


Next Steps• Samples are logged in and labeled• Chain of custody, sample receipt form, and
log-in sheet given to Project Manager– Reviews sheets– Makes corrections – Communicates with CP if there are problems – Sets samples to available so the lab can batch and
analyze them (some LIMS systems) – Tells analysts about rush samples

More Communication
• You can request copies of the log-in sheets, chain of custody, and the cooler / sample receipt form from the Lab Project Manager– Be aware of cooler or sample problems– Potentially catch mistakes– Double check field and lab personnel– Trust, but verify the CLs

Lab Analysis

Laboratory = Black Box
• Certified Professional sends in cooler of samples
• Waits a period of time for results
• How does a CP know the numbers are correct?

The Goal….
• Laboratory results that meet the established DQOs.
• Laboratory results that meet OhioVAP requirements = Affidavit

Starting with Set-Up: LIMS
• Projects can be setup in the LIMs prior to project set-up.• Quotes can be sent to the client for PRE-approval – listing methods, RLs,
pricing, contact information• Many laboratory LIMs system has the ability for the client to access data
and get information “real-time” – online data tools where access can be customized by person (e.g. accounting, project manager, field personnel)

Project Team
• Sales/PM = Quote• Bottle/Cooler shipment• Field Services/Courier• Kick-off Meeting • Communication update• Final Report• Follow-up and closure

Page 1 of 1 SET No.
Client Fax No. √ to Receive Results by Fax
Client Email √ to Receive Results by Email
#Time
Collected
1 16:00 X O 1 X X X X X
2 16:15 X O 1 X X X X X X
Date
Date Rush Requested: ________ Day(s)Must be approved by Lab Manager
Relinquished by: Time Received by: Date
Received in Lab by: Time
Time
N/A
Notes / Comments:East Sand Dune may be high in metals and with a low pH
09/09/14
PC
Bs
N/A
East Sand Dune - Oil Spill
Vis
cosity
Fla
sh P
oin
t
Tota
l O
rganic
Conte
nt
ICP
Meta
ls:
Pb,
Cr,
Se
West Sand Dune - Oil Spill 09/09/14
Contact Person
Quote Number
√ if Ohio VAP Samples
Sample IdentificationDate
Collected
John Johnson
Analysis Request / Chain of CustodyFor Summit Environmental Technologies, Inc. use only
Client Address Project Address
Num
ber
of C
onta
iner
s
Analytical Parametersand Methods
Client Name Project Identification
Merc
ury
pH
Client Phone
Com
pos
ite
222.555.7575 John Johnson
ABC123Money
MyQuote123
Catherine Morris
The Beautiful Beach ProjectJohnson & Morris Corporation
5789 Roslyn Avenue, Akron, OH 44320
Gra
b
Mat
rix:
S=
Sol
id, L=
Liq
uid
, O
=O
ilSL=
Slu
dge
, A
=A
ir
Pre
serv
ativ
e
Report To1234 Beach Lane, Daytona, FL 32116
PO Number
222.552.7070
Sampled By

Need to insert clean copy of COC that is landscaped
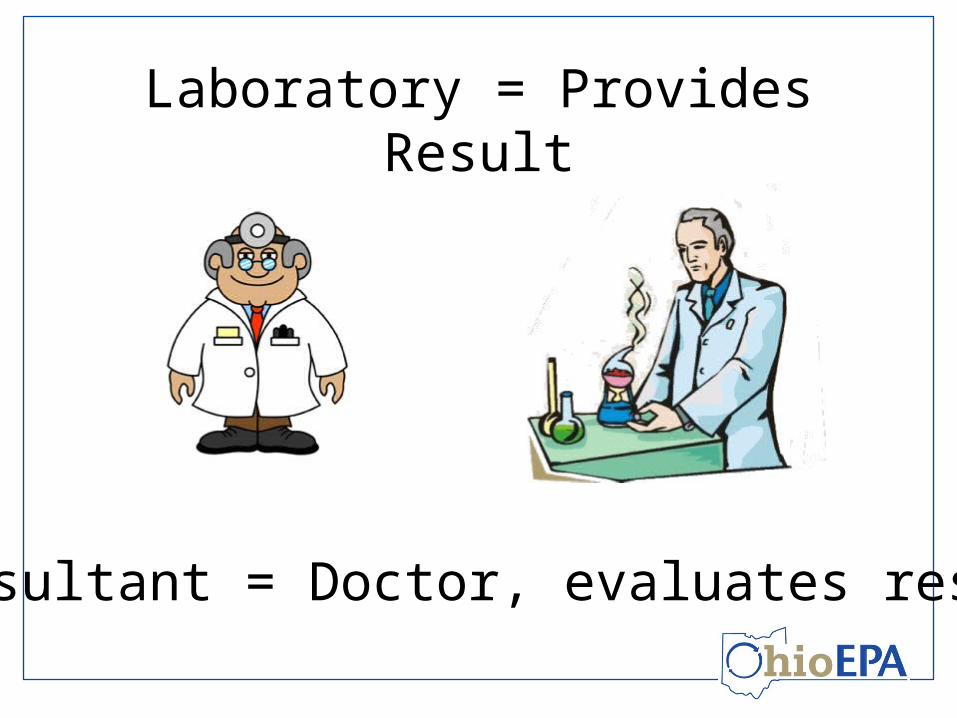
Laboratory = Provides Result
Consultant = Doctor, evaluates results

Quality Control (QC) Batch
• The QC batch consists of a set of up to 20 field samples that are processed utilizing the same procedures, reagents, and standards within the same time period.
• Minimum of a Blank and LCS.• MS/MSDs are generally client specified.

Method Blank
• Blank matrix processed under the same time frame, under the same conditions, and utilizing all of the steps of the analytical process.
• No detectable hits above the reporting limit (RL)
IF samples are “ND”, can be narratedOtherwise, batch must be redone
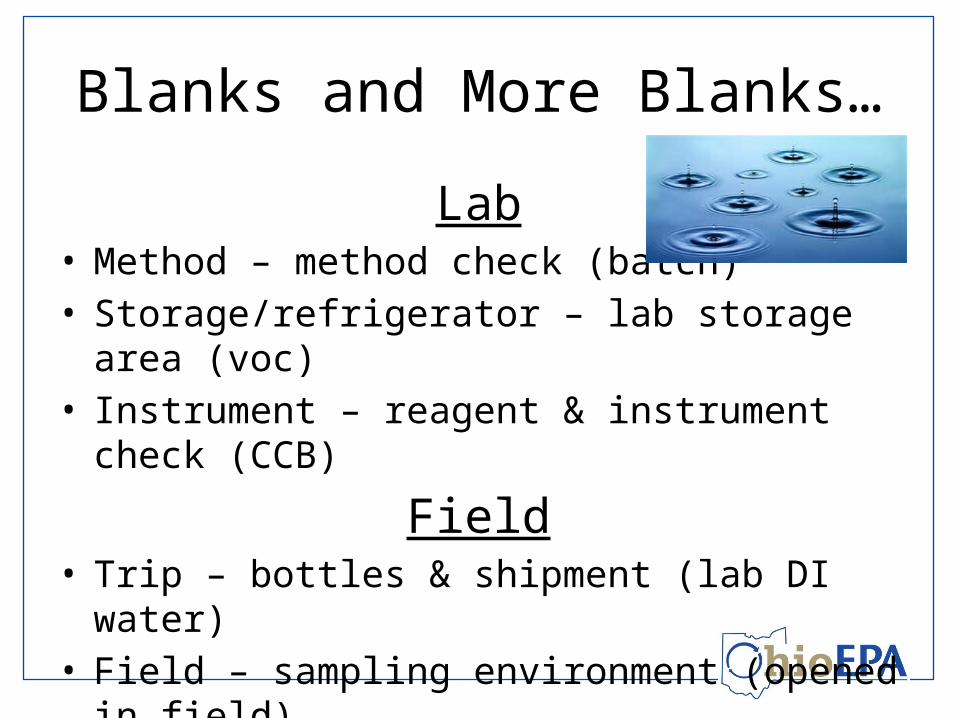
Blanks and More Blanks…
Lab• Method – method check (batch)• Storage/refrigerator – lab storage area (voc)• Instrument – reagent & instrument check (CCB)
Field• Trip – bottles & shipment (lab DI water)• Field – sampling environment (opened in field)• Equipment – sampling equipment

Laboratory Control Sample (LCS)
• Blank spike with a known amount of analyte(s) processed under the same time frame, under the same conditions, utilizing all steps of the analytical process as the native sample.
• Demonstrates that the batch was processed within accuracy range set by the method
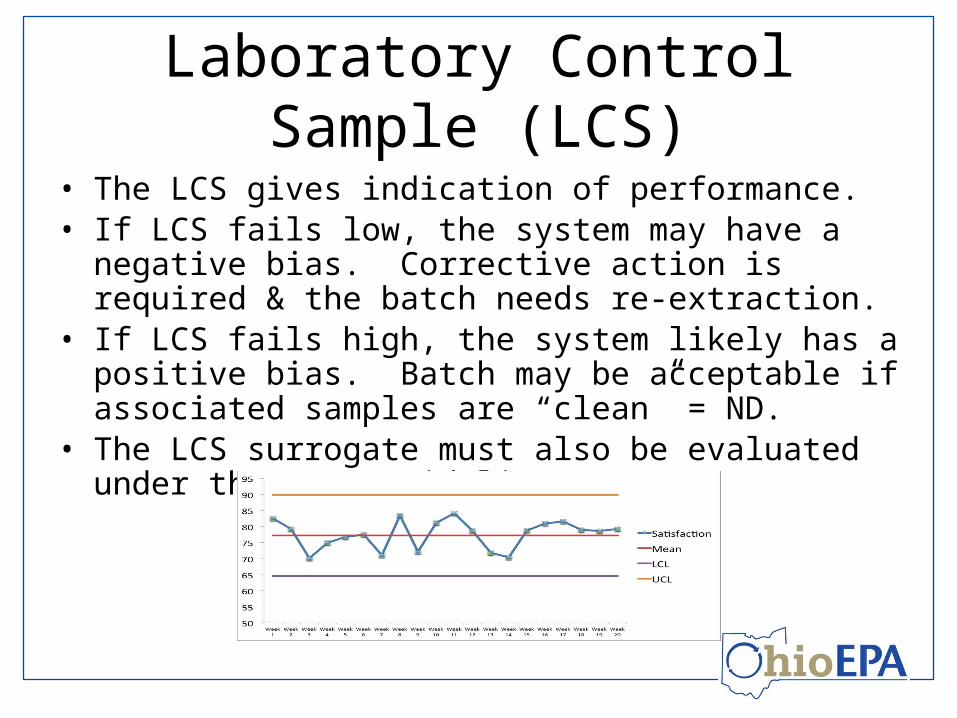
Laboratory Control Sample (LCS)• The LCS gives indication of performance.• If LCS fails low, the system may have a negative bias.
Corrective action is required & the batch needs re-extraction.• If LCS fails high, the system likely has a positive bias. Batch
may be acceptable if associated samples are “clean” = ND.• The LCS surrogate must also be evaluated under the same
guidelines.

Matrix Spikes/Matrix Spike Duplicates (MS/MSDs)
• MS/MSDs are performed per batch where applicable
• The information is only applicable to the actual sample spike
• Does not control the batch• Corrective action generally not performed • If client specific MS/MSD is NOT assigned,
batch MS/MSD will likely NOT be reported

Surrogates• Surrogates are compounds that are similar in
composition but not normally found in environmental samples.
• Surrogates are added to organic samples and associated QC samples.
• Gives an indication of any matrix effect or preparation accuracy especially in QC samples
• Surrogate failure can give information on bias and c/a is specific to the sample and not the entire batch

Example QC Report

Field QC
• Sample Duplicate – field duplicate or second aliquot of sample
• Matrix Spike – field spiked sample• Field Blank – known blank sample• Split Sample – subset/percentage to another
laboratory

Internal Standards (IS)• Internal Standards are to added to samples, blank and
calibration standards• The IS is used to verify instrument response, retention time,
the analyte signal to the IS, and corrects for the loss of analyte
• Determines instrument performance during sample analysis• Gives an indication of matrix effects on the individual sample• Control – area counts should be between 50 to 200%.• If internal standard response changes by a factor of 2 (-50% to
+100%) – corrective action is required

Quantitation Limit – QL, PQL, RL
The quantitation limit (QL), practical quantitation limit (PQL), or reporting limit (RL) is generally calculated as 3-5x the MDL.
• It is the lowest point at which quantitatively a substance can be measured.
• It is generally at the lowest point or the 2nd lowest point of the calibration curve.

Method Detection Limit (MDL)
• An MDL is the minimum amount of a substance that can be measured with a specific degree of confidence that the amount is greater than zero by using a specific method.
• The MDL represents a range where qualitative detection occurs using a specific method. Quantitative results are NOT produced in this range.
The procedure includes all steps of prep and analysisResults reported between the MDL and PQL must be flagged as
estimated results

LOD and LOQ Relationship
• The limit of detection (LOD) is defined as 3x the standard deviation of the blank
• The limit of quantification (LOQ) is defined as 10x the standard deviation of the blank.
• The probability of false positive is relatively small (~1%) at the LOD
Sometimes the LOD and MDL are defined as the same

LOD and LOQ Relationship

Factors that Impact the RL
• Dilutions• Matrix• Dry Weight• Prep• Methods• Target Analytes

Case Narrative & Cover Letter – end of the journey
• At the beginning of the report, there may be a cover letter or case narrative outlining the journey your samples took.
• QC/Batch failures • Matrix Issues• Reporting Limits• Re-extracts • Flags are often not defined in narrative, but in
a footnote

Example cover letter – with client info in the headers and project numbers on company letter head
ABC Labs received 2 samples on 01/22/15 for the analyses presented in the following report.
There were no problems with the analytical events associated with this report unless noted in the case narrative. QC data is within laboratory defined or method specified acceptance limits except where noted.
Signed – your happy project manager

Example case narrative – on company letter head and paginated
This report in its entirety consists of the documents listed below. All documents contain the ABC Lab’s Work Order Number assigned to this report.
Paginated Report including Cover Letter, Case Narrative, Analytical Results, Applicable Quality Control Summary Reports, and copies of the Chain of Custody Documents are supplied with this sample set.
Concentrations reported with a J-Flag in the Qualifier Field are values below the Limit of Quantitation(LOQ) but greater than the established Method Detection Limit (MDL).
Method numbers, unless specified as SM (Standard Methods) or ASTM, are EPA methods.
Estimated uncertainty values are available upon request.
All results for Solid Samples are reported on an "as received" or "wet weight" basis unless indicated as"dry weight" using the "-dry" designation on the reporting units.
ABC Labs holds the accreditations/certifications listed at the bottom of the cover letter that may or may not pertain to this report. The tests performed are certified under the OhioVAP program
Any comments or problems with the analytical events associated with this report are noted below.

Real Life Example…..


![[Validated Audit Process (VAP)] EICC Manual Pengendalian VAP](https://img.pdfslide.net/doc/110x75/587748571a28ab514f8b5fa7/validated-audit-process-vap-eicc-manual-pengendalian-vap.jpg)