Embed Size (px)
Citation preview

Using Soil Classification & Description Data
(What you Need to Know, Especially for Risk Assessment and Modeling)
VAP Spring 2015Certified Professional Coffee

Soil Classification & Description
• Purpose of training
– Briefly review the most commonly used soil classification systems (USDA & USCS)
– Identify some limitations and (associated misuses) of each system
– Address some concerns about the use of soil classification and description data (especially for risk assessment and modeling)

Soil Classification & Description
• Purpose of soil classification and description?
– Provides soil property data in an organized, systematic manner to support an activity (environmental remediation, agriculture, construction, etc.)
– Foundation of the conceptual site model for environmental remediation projects

Soil Classification & Description
• Johnson and Ettinger model for estimating subsurface vapor intrusion into buildings
• Uses USDA Soil Conservation Survey soil classification data to provide site-specific data for the following model parameters:
– Soil bulk density
– Total porosity
– Water-filled porosity

Soil Classification & Description
• Poor quality data often result from
– A laissez-faire approach to soil (geologic) logging, which leads to
• Failure to learn and consistently follow standard soil classification & description methods
• Indiscriminately using different classification systems (“mix and match”), or making it up as you log along

Soil Classification & Description
• Even good quality data can be misused when the user doesn’t understand– The classification system and what the data
actually indicate about soil properties
– Data limitations, e.g., • Field vs. laboratory classification
• Properties used as basis for a particular classification (USDA silt vs. USCS silt)

Soil Classification Systems
• Unified Soil Classification System– Engineering and environmental applications
– ASTM D2486-11 (lab), ASTM D2488-09a (field)
• USDA Soil Classification System– Agricultural, land development and environmental
applications
– USDA Soil Survey Manual• http://www.nrcs.usda.gov/wps/portal/nrcs/detail/soils/r
ef/?cid=nrcs142p2_054262

USDA Soil Classification System
• Origin and purpose
– Early soil science work, 1930s through 1940s by American and Russian scientists
– U.S. National Cooperative Soil Survey officially adopted the USDA system in 1965 and published it in 1975 (Soil Taxonomy: A Basic System of Soil Classification for Making and Interpreting Soil Surveys)
– Evaluates soils for agriculture, ranching, forestry (land development, non-farm uses important after 1950)

USDA Soil Classification System
• USDA “Texture Triangle Diagram”
– Twelve soil classes defined by %’s sand, silt, clay
– Silty Clay = 40-60% clay, 40-60% silt, 0-20% sand
– Lab analyses or field “texture by feel” analysis
– Gravel not included (used as modifier); %’s sand, silt clay normalized to 100% without gravel

USDA Soil Classification SystemParticle Size Limits
SAND SILT CLAYGRAVEL
2.00 mm 0.050 mm 0.002 mm
(Hydrometer)
(Sieves)
75 mm

USDA Soil Classification System
• Soil class identification (e.g., “sandy loam”) – May be based on field examination or lab analysis
of soil samples
– Field examination, estimate % sand/silt/clay by• Plasticity (ability to form a soil “ribbon”
• Feel of soil (gritty vs. smooth vs. greasy)
– Accuracy of field identification? At best, +/- 10% to 15% (sand/silt/clay)
USDA Soil Classification System(Field Testing)

USDA Soil Classification System(Field Testing)
Soil ribbon length estimates % clay
“Gritty” “Smooth”Grittiness estimates % sand versus % silt

Unified Soil Classification System (USCS)
• Origin and purpose– Developed in 1942 by Professor Arthur
Casagrande for airfield construction during WWII
– Most commonly used soil classification system
– Applicable ASTM standards• ASTM D2487-11, Standard Classification for Engineering
Purposes (laboratory testing)
• ASTM D2488-09a, Standard Practice for Description and Identification of Soils (field evaluation)

Unified Soil Classification System (USCS)
• Separates soils into two broad categories and then uses a flow-chart approach to classify based on soil properties (%’s by weight)– Coarse-grained soils, > 50% sand and gravel• “G” stands for gravel or gravelly soils
• “S” stands for sand or sandy soils
– Fine-grained soils, >= 50% silt and clay• “M” stands for silt or silty soils
• “C” stands for clay or clayey soils

Unified Soil Classification System (USCS)Coarse-Grained Soil Classification
• Less than 5% “fines” (silt and clay)– If the % sand is >= % gravel, SAND (S)
– If the % gravel is > % sand, GRAVEL (G)
• Greater than 15% fines– SILTY SAND (SM) or CLAYEY SAND (SC)
– SILTY GRAVEL (GM) or CLAYEY GRAVEL (GC)

Unified Soil Classification System (USCS)Coarse-Grained Soil Classification: Grading
Well Graded(Poorly Sorted)
Poorly Graded(Well Sorted)

Well Graded vs Poorly Graded
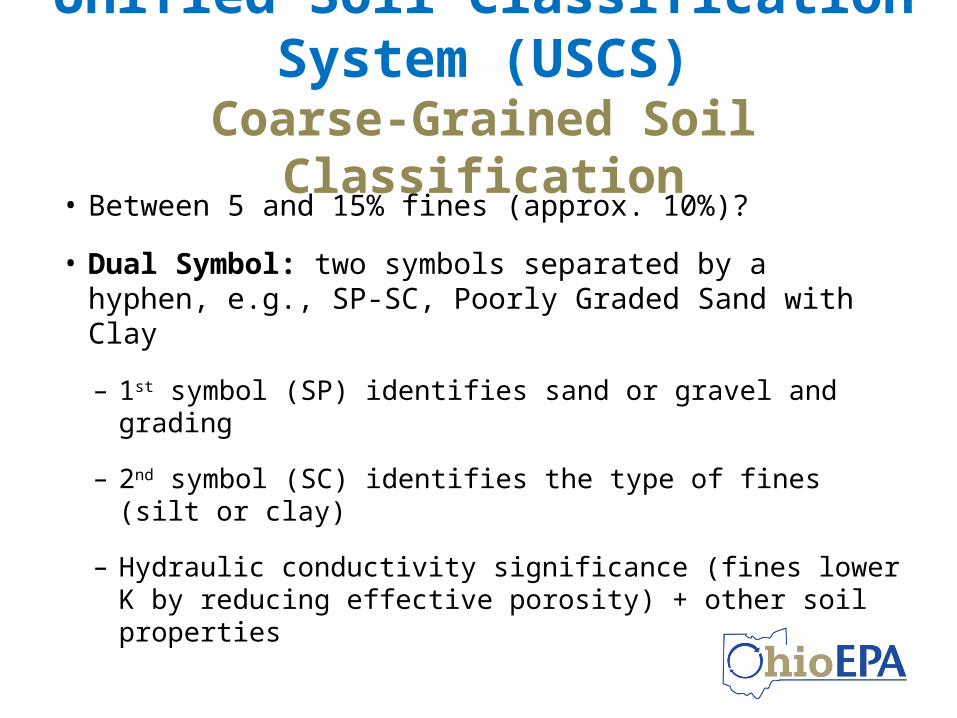
Unified Soil Classification System (USCS)Coarse-Grained Soil Classification
• Between 5 and 15% fines (approx. 10%)?
• Dual Symbol: two symbols separated by a hyphen, e.g., SP-SC, Poorly Graded Sand with Clay
– 1st symbol (SP) identifies sand or gravel and grading
– 2nd symbol (SC) identifies the type of fines (silt or clay)
– Hydraulic conductivity significance (fines lower K by reducing effective porosity) + other soil properties

Unified Soil Classification System (USCS)Dual Symbols, Coarse-Grained Soils
• Poorly Graded Gravel with Silt (GP-GM)
• Poorly Graded Gravel with Clay (GP-GC)
• Well-Graded Gravel with Silt (GW-GM)
• Well-Graded Gravel with Clay (GW-GC)
• Poorly Graded Sand with Silt (SP-SM)
• Poorly Graded Sand with Clay (SP-SC)
• Well-Graded Sand with Silt (SW-SM)
• Well-Graded Sand with Clay (SW-SC)

Unified Soil Classification System (USCS)Fine-Grained Soil Classification
• Fine-grained soil > or = 50% silt and/or clay
• The USCS grain size limit for the silt (M) and clay (C) fractions is the same 0.075 mm (passes #200 sieve)
(USDA system: silt fraction is between 0.05 and 0.002 mm, clay fraction < or = 0.002 mm)
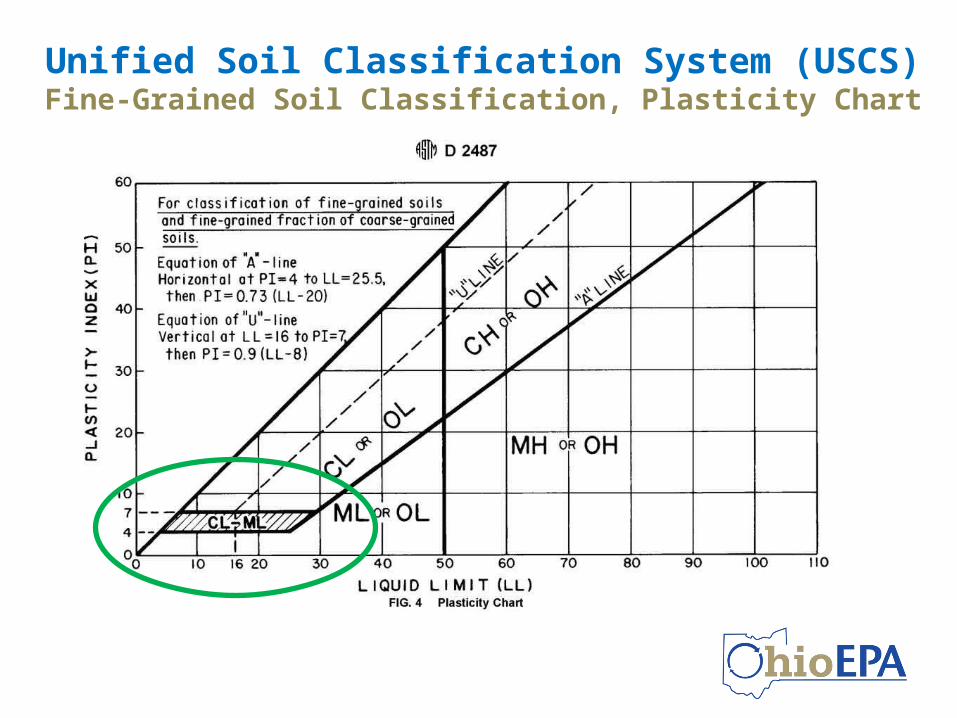
• USCS silt and clay classification is based on plastic properties (Atterberg Limits) and not particle size distribution

Unified Soil Classification System (USCS)
• Atterberg Limits (based on laboratory testing, ASTM D2487)
– Plastic Limit (PL), water content at which soil starts to exhibit plastic behavior
– Liquid Limit (LL), water content at which soil starts to exhibit liquid behavior
– Plasticity Index, PI, numeric difference between LL and PL, measure of plasticity; clays have a high PI, silts have a low PI

Unified Soil Classification System (USCS)Fine-Grained Soil Classification, Plasticity Chart

Unified Soil Classification System (USCS) Fine-Grained Soil Classification, Field Plasticity
Tests (based on Table 12, ASTM D2488-09a)

Unified Soil Classification System (USCS) Fine-Grained Soil Classification
• Percentages of sand or gravel?
– If < 15% sand or gravel, no qualifier needed, e.g., “lean clay”
– If 15-25% sand or gravel, add “with sand” (%S > or = %G) or “with gravel” (%G > %S), e.g., “lean clay with sand”
– If > 30 % sand or gravel, add “sandy” (%S > or = %G) or “gravelly” (%G > %S), e.g., “sandy lean clay”

USCS vs. USDA Particle Size Comparison
Unified Soil Classification System
GRAVEL SAND SILT and CLAY75 mm 4.75 mm 0.074 mm (#200 sieve)
GRAVEL SAND CLAYSILT
USDA Soil Classification System75 mm 2.00 mm 0.05 mm 0.002 mm
ATTERBERG LIMITS

Misuse of Soil Classification SystemsScenario #1
A model utilizes USDA soil classification data (the results will be used to evaluate risk). Is substituting USCS soil type data for “equivalent” USDA soil type data appropriate? For example, can we assume that that USCS lean clay and sandy clay are equivalent to USDA clay and sandy clay?

USDA Soil TypesDirect Comparison of USCS & USDA LabClassification of 62 Soil Samples FromCuyahoga, Franklin, Hamilton, Lucas andMontgomery Counties (DERR County Background Sampling)

Misuse of Soil Classification SystemsScenario #1
• Ohio EPA geotechnical laboratory data indicates
– USCS lean clay may classify as USDA silty clay, clay loam, silty clay loam, loam or silt loam (but not clay)
– USCS clayey sand classifies as USDA sandy loam (not clayey sand)

Misuse of Soil Classification SystemsScenario #1
• USCS and USDA are not “mix and match” systems (soil types aren’t equivalents)
• Some soil classification types may not occur in a given geographic area or site locations
– USCS elastic silt (MH) is not common in Ohio
– Based on DERR’s county soil data to date, USDA clay, sandy clay, and sandy clay loam are not common in Ohio

U.S. Army Corps of Engineers, Electromagnetic Power Attenuation in Soils,ERDC/EL TR-05-5, August 2005

USCS vs. USDA Particle Size Comparison
Unified Soil Classification System
GRAVEL SAND SILT and CLAY75 mm 4.75 mm 0.074 mm (#200 sieve)
GRAVEL SAND CLAYSILT
USDA Soil Classification System75 mm 2.00 mm 0.05 mm 0.002 mm
ATTERBERG LIMITS

Misuse of Soil Classification SystemsScenario #1 (Continued)
If you perform hydrometer analysis (ASTM D422) to determine the clay (> 0.002 mm) fraction for a soil sample classified according to the USCS, can you use the clay data with the USCS sand and silt %’s to determine the USDA soil type?

USCS vs. USDA Particle Size Comparison
Unified Soil Classification System
GRAVEL SAND SILT and CLAY75 mm 4.75 mm 0.074 mm (#200 sieve)
GRAVEL SAND CLAYSILT
USDA Soil Classification System75 mm 2.00 mm 0.05 mm 0.002 mm
ATTERBERG LIMITS
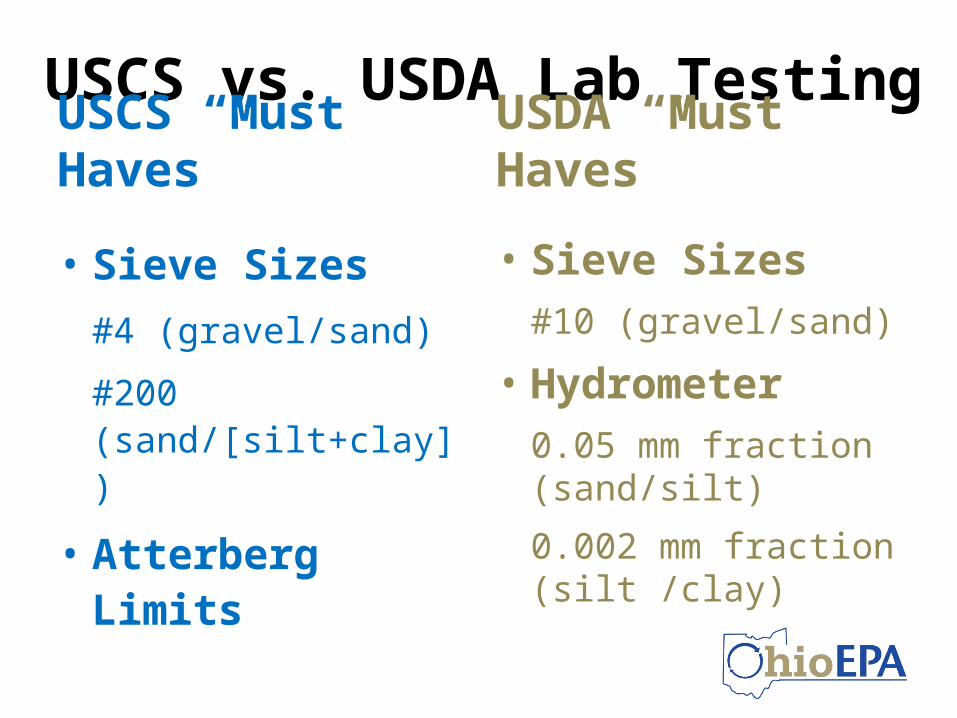
USCS vs. USDA Lab TestingUSCS “Must Haves” USDA “Must Haves”
• Sieve Sizes#4 (gravel/sand)
#200 (sand/[silt+clay])
• Atterberg Limits
• Sieve Sizes#10 (gravel/sand)
• Hydrometer0.05 mm fraction (sand/silt)
0.002 mm fraction (silt /clay)

USCS vs. USDA Lab TestingUSCS Options USDA Options
• Sieve Sizes¾” (c. gravel/f. gravel)
#10 (c. sand/m. sand)
#40 (m. sand/f. sand)
• Hydrometer
0.005 mm or 0.002 mm fractions (clay)
• Sieve Sizes#18 (v.c. sand/c. sand)
#35 (c. sand/m. sand)
#60 (m. sand/f. sand)
#140 (f. sand/v.f. sand)

Misuse of Soil Classification Systems Scenario #2
You are reviewing existing soil boring logs for a new site. The previous consultant’s assessment report states that they logged soils using the USCS per ASTM D2488-09a. You note that the terms “loam” and “loamy” are used with USCS terminology, and that “silty clay” appears frequently as a field soil description. Do you have any concerns?

Misuse of Soil Classification Systems Scenario #2
• Problems with consultant’s soil classification:
– Never appropriate to combine USCS and USDA soil classification terminology
– USCS silty clay or USDA silty clay? (significant difference)
– USCS silty clay? Should have used the term “lean clay” instead per ASTM D2488-09a and ASTM D2487-11 (“silty clay” can’t be classified in the field)
Unified Soil Classification System (USCS)Fine-Grained Soil Classification, Plasticity Chart

Misuse of Soil Classification Systems Scenario #3
You need to determine USDA soil types for a Phase II property assessment in Hamilton County. You have soil type data from several sites in Franklin County. Both counties are covered with till, which consistently classifies as clay loam or silty clay loam at the Franklin County sites.
Would assuming that the Hamilton County soils are clay loam or silty clay loam based on the Franklin County data be appropriate?

Comparison of USDA Soil Classification for Franklin and Hamilton Counties(DERR County Background Sampling, Soil Laboratory Results)

Comparison of USDA Soil Classification for Franklin, Lucas, and Hamilton Counties(DERR County Background Sampling, Soil Laboratory Results)

Recommendations for Using Soil Classification Data
• Become familiar with both the USCS and USDA soil classification system basics
• Never substitute USCS data for USDA soil classification data (directly or by manipulation)
• Request soil laboratory testing/classification for modeling and risk assessment purposes

Recommendations for Using Soil Classification Data
• Question soil classification (field or lab) that doesn’t appear to follow a standard system
• Never assume the soil type(s) at one site is/are comparable to another site based on the origin of geologic material (or proximity)

Questions?
Thanks for your time and attention!