Embed Size (px)
Citation preview

“Rolling Out the Plan”PRESENTING YOUR CASE PROJECT TO YOUR CLASSMATES.
Category Snapshot
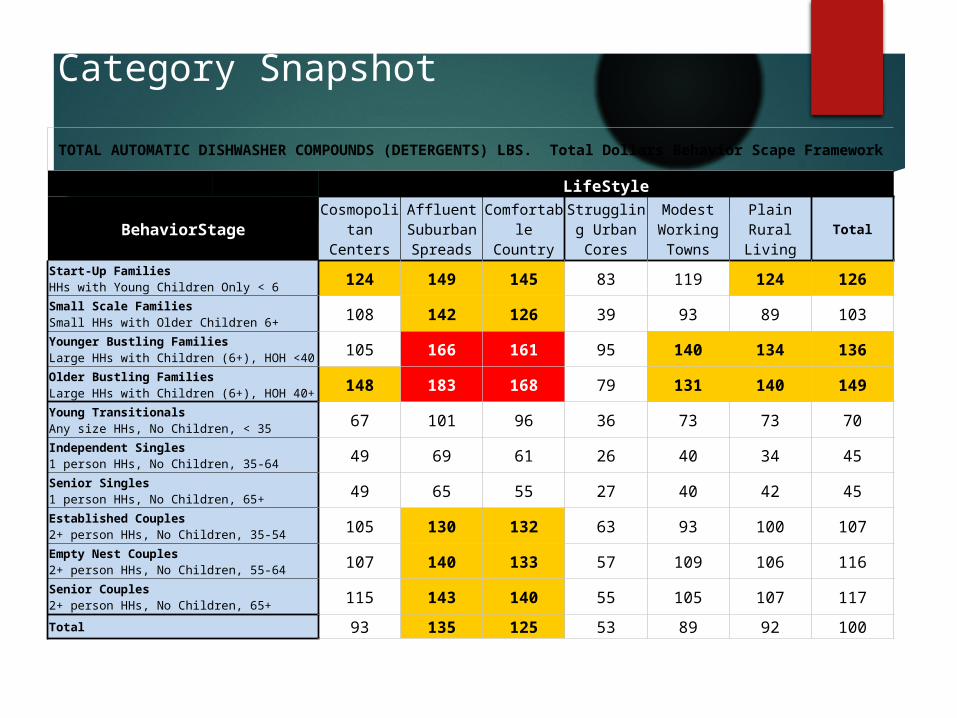
TOTAL AUTOMATIC DISHWASHER COMPOUNDS (DETERGENTS) LBS. Total Dollars Behavior Scape Framework
LifeStyle
BehaviorStageCosmopolitan Centers
Affluent Suburban Spreads
Comfortable Country
Struggling Urban Cores
Modest Working Towns
Plain Rural Living Total
Start-Up FamiliesHHs with Young Children Only < 6 124 149 145 83 119 124 126
Small Scale FamiliesSmall HHs with Older Children 6+ 108 142 126 39 93 89 103
Younger Bustling FamiliesLarge HHs with Children (6+), HOH <40 105 166 161 95 140 134 136
Older Bustling FamiliesLarge HHs with Children (6+), HOH 40+ 148 183 168 79 131 140 149
Young TransitionalsAny size HHs, No Children, < 35 67 101 96 36 73 73 70
Independent Singles1 person HHs, No Children, 35-64 49 69 61 26 40 34 45
Senior Singles1 person HHs, No Children, 65+ 49 65 55 27 40 42 45
Established Couples2+ person HHs, No Children, 35-54 105 130 132 63 93 100 107
Empty Nest Couples2+ person HHs, No Children, 55-64 107 140 133 57 109 106 116
Senior Couples2+ person HHs, No Children, 65+ 115 143 140 55 105 107 117
Total 93 135 125 53 89 92 100
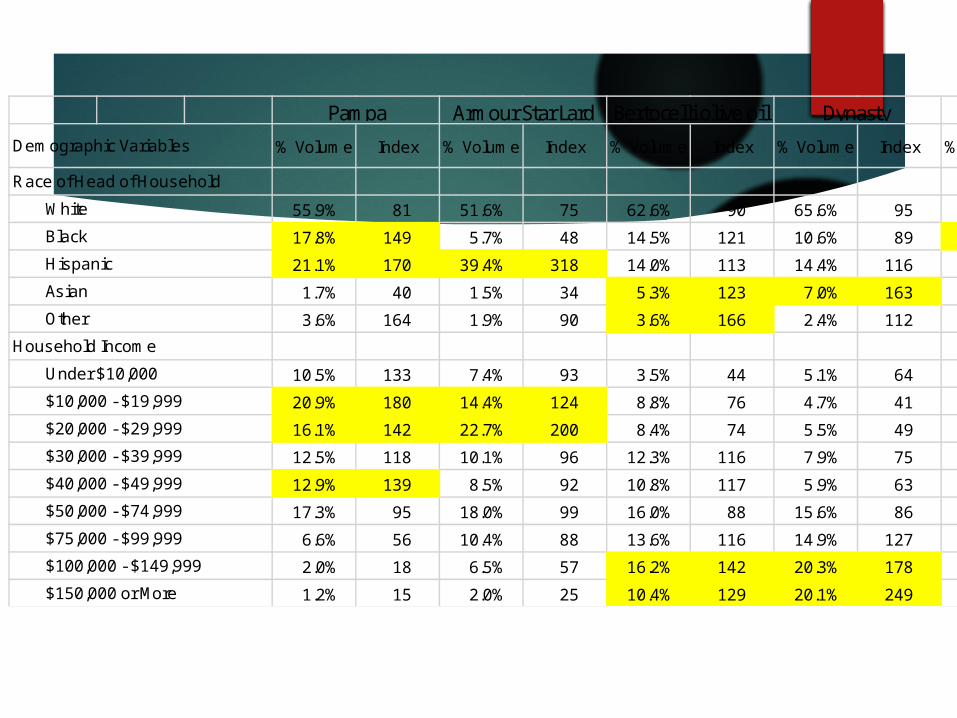
% Volume Index % Volume Index % Volume Index % Volume Index % Volume Index
55.9% 81 51.6% 75 62.6% 90 65.6% 95 59.5% 86
17.8% 149 5.7% 48 14.5% 121 10.6% 89 19.7% 165
21.1% 170 39.4% 318 14.0% 113 14.4% 116 14.0% 113
1.7% 40 1.5% 34 5.3% 123 7.0% 163 4.6% 108
3.6% 164 1.9% 90 3.6% 166 2.4% 112 2.1% 98
10.5% 133 7.4% 93 3.5% 44 5.1% 64 9.8% 124
20.9% 180 14.4% 124 8.8% 76 4.7% 41 13.2% 114
16.1% 142 22.7% 200 8.4% 74 5.5% 49 13.1% 115
12.5% 118 10.1% 96 12.3% 116 7.9% 75 11.5% 109
12.9% 139 8.5% 92 10.8% 117 5.9% 63 9.6% 104
17.3% 95 18.0% 99 16.0% 88 15.6% 86 17.8% 99
6.6% 56 10.4% 88 13.6% 116 14.9% 127 10.6% 90
2.0% 18 6.5% 57 16.2% 142 20.3% 178 8.7% 77
1.2% 15 2.0% 25 10.4% 129 20.1% 249 5.6% 69
Household Income
Under $10,000
$10,000 - $19,999
$20,000 - $29,999
$30,000 - $39,999
$40,000 - $49,999
$50,000 - $74,999
$75,000 - $99,999
$100,000 - $149,999
$150,000 or More
Private label
Demographic Variables
Other
Pampa Armour Star Lard Bertocelli olive oil Dynasty
Race of Head of Household
White
Black
Hispanic
Asian
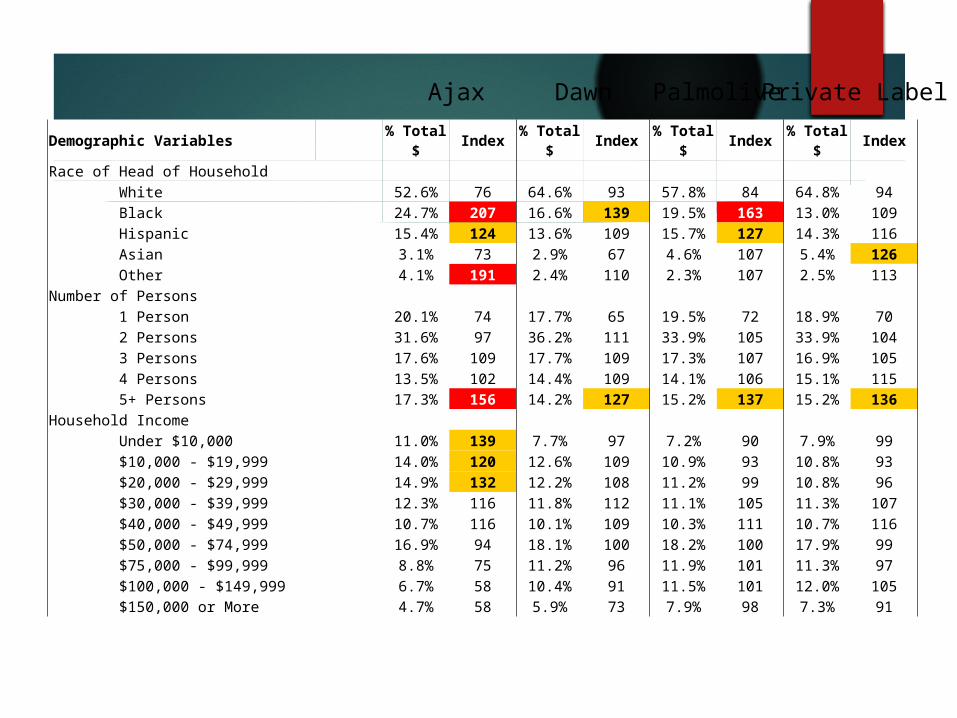
Demographic Variables % Total $ Index % Total $ Index % Total $ Index % Total $ IndexRace of Head of Household White 52.6% 76 64.6% 93 57.8% 84 64.8% 94 Black 24.7% 207 16.6% 139 19.5% 163 13.0% 109 Hispanic 15.4% 124 13.6% 109 15.7% 127 14.3% 116 Asian 3.1% 73 2.9% 67 4.6% 107 5.4% 126 Other 4.1% 191 2.4% 110 2.3% 107 2.5% 113Number of Persons 1 Person 20.1% 74 17.7% 65 19.5% 72 18.9% 70 2 Persons 31.6% 97 36.2% 111 33.9% 105 33.9% 104 3 Persons 17.6% 109 17.7% 109 17.3% 107 16.9% 105 4 Persons 13.5% 102 14.4% 109 14.1% 106 15.1% 115 5+ Persons 17.3% 156 14.2% 127 15.2% 137 15.2% 136Household Income Under $10,000 11.0% 139 7.7% 97 7.2% 90 7.9% 99 $10,000 - $19,999 14.0% 120 12.6% 109 10.9% 93 10.8% 93 $20,000 - $29,999 14.9% 132 12.2% 108 11.2% 99 10.8% 96 $30,000 - $39,999 12.3% 116 11.8% 112 11.1% 105 11.3% 107 $40,000 - $49,999 10.7% 116 10.1% 109 10.3% 111 10.7% 116 $50,000 - $74,999 16.9% 94 18.1% 100 18.2% 100 17.9% 99 $75,000 - $99,999 8.8% 75 11.2% 96 11.9% 101 11.3% 97 $100,000 - $149,999 6.7% 58 10.4% 91 11.5% 101 12.0% 105 $150,000 or More 4.7% 58 5.9% 73 7.9% 98 7.3% 91
Ajax Dawn Palmolive Private Label
Step Two: Category Role
Share some personal interest in the category, maybe employment was an issue.
Size, in U.S. sales:
>$1 billion = high
<$100 million = small
Marsh Supermarket Data on the broader category
Interest in penetration, purchase cycles, deal
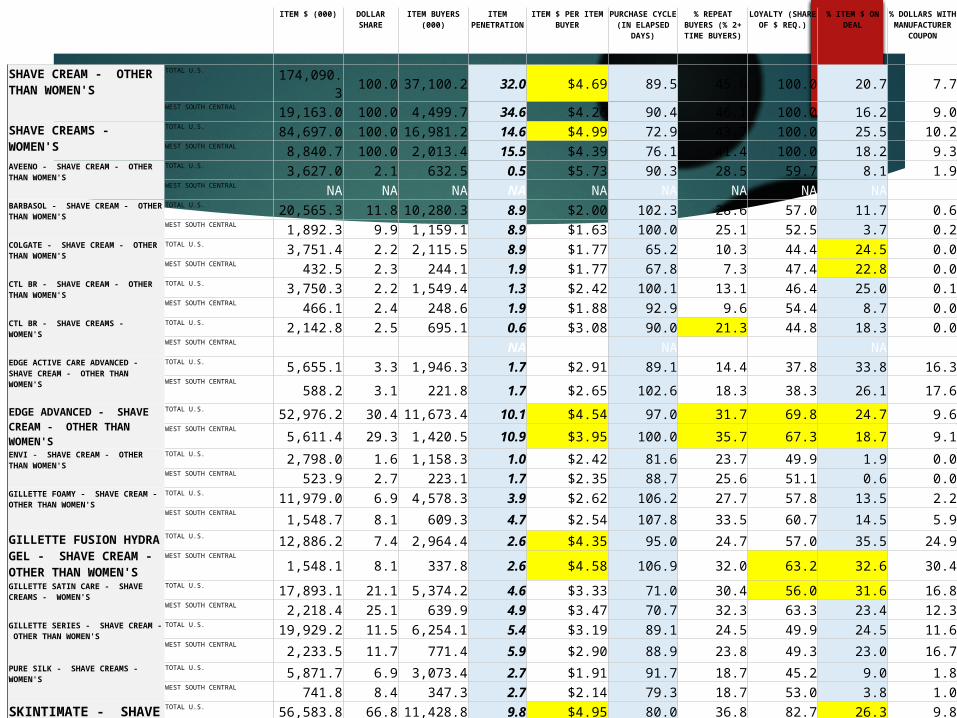
ITEM $ (000) DOLLAR SHARE
ITEM BUYERS (000)
ITEM PENETRATION
ITEM $ PER ITEM BUYER
PURCHASE CYCLE (IN
ELAPSED DAYS)
% REPEAT BUYERS (% 2+ TIME BUYERS)
LOYALTY (SHARE OF $ REQ.)
% ITEM $ ON DEAL
% DOLLARS WITH
MANUFACTURER COUPON
SHAVE CREAM - OTHER THAN WOMEN'S
TOTAL U.S.174,090.3 100.0 37,100.2 32.0 $4.69 89.5 45.6 100.0 20.7 7.7
WEST SOUTH CENTRAL19,163.0 100.0 4,499.7 34.6 $4.26 90.4 46.1 100.0 16.2 9.0
SHAVE CREAMS - WOMEN'S
TOTAL U.S.84,697.0 100.0 16,981.2 14.6 $4.99 72.9 43.7 100.0 25.5 10.2
WEST SOUTH CENTRAL8,840.7 100.0 2,013.4 15.5 $4.39 76.1 41.4 100.0 18.2 9.3
AVEENO - SHAVE CREAM - OTHER THAN WOMEN'S
TOTAL U.S.3,627.0 2.1 632.5 0.5 $5.73 90.3 28.5 59.7 8.1 1.9
WEST SOUTH CENTRALNA NA NA NA NA NA NA NA NA NA
BARBASOL - SHAVE CREAM - OTHER THAN WOMEN'S
TOTAL U.S.20,565.3 11.8 10,280.3 8.9 $2.00 102.3 28.6 57.0 11.7 0.6
WEST SOUTH CENTRAL1,892.3 9.9 1,159.1 8.9 $1.63 100.0 25.1 52.5 3.7 0.2
COLGATE - SHAVE CREAM - OTHER THAN WOMEN'S
TOTAL U.S.3,751.4 2.2 2,115.5 8.9 $1.77 65.2 10.3 44.4 24.5 0.0
WEST SOUTH CENTRAL432.5 2.3 244.1 1.9 $1.77 67.8 7.3 47.4 22.8 0.0
CTL BR - SHAVE CREAM - OTHER THAN WOMEN'S
TOTAL U.S.3,750.3 2.2 1,549.4 1.3 $2.42 100.1 13.1 46.4 25.0 0.1
WEST SOUTH CENTRAL466.1 2.4 248.6 1.9 $1.88 92.9 9.6 54.4 8.7 0.0
CTL BR - SHAVE CREAMS - WOMEN'S TOTAL U.S.2,142.8 2.5 695.1 0.6 $3.08 90.0 21.3 44.8 18.3 0.0
WEST SOUTH CENTRALNA NA NA NA NA NA NA NA NA NA
EDGE ACTIVE CARE ADVANCED - SHAVE CREAM - OTHER THAN WOMEN'S
TOTAL U.S.5,655.1 3.3 1,946.3 1.7 $2.91 89.1 14.4 37.8 33.8 16.3
WEST SOUTH CENTRAL
588.2 3.1 221.8 1.7 $2.65 102.6 18.3 38.3 26.1 17.6
EDGE ADVANCED - SHAVE CREAM - OTHER THAN WOMEN'S
TOTAL U.S.52,976.2 30.4 11,673.4 10.1 $4.54 97.0 31.7 69.8 24.7 9.6
WEST SOUTH CENTRAL
5,611.4 29.3 1,420.5 10.9 $3.95 100.0 35.7 67.3 18.7 9.1ENVI - SHAVE CREAM - OTHER THAN WOMEN'S
TOTAL U.S.2,798.0 1.6 1,158.3 1.0 $2.42 81.6 23.7 49.9 1.9 0.0
WEST SOUTH CENTRAL523.9 2.7 223.1 1.7 $2.35 88.7 25.6 51.1 0.6 0.0
GILLETTE FOAMY - SHAVE CREAM - OTHER THAN WOMEN'S
TOTAL U.S.11,979.0 6.9 4,578.3 3.9 $2.62 106.2 27.7 57.8 13.5 2.2
WEST SOUTH CENTRAL
1,548.7 8.1 609.3 4.7 $2.54 107.8 33.5 60.7 14.5 5.9GILLETTE FUSION HYDRA GEL - SHAVE CREAM - OTHER THAN WOMEN'S
TOTAL U.S.12,886.2 7.4 2,964.4 2.6 $4.35 95.0 24.7 57.0 35.5 24.9
WEST SOUTH CENTRAL
1,548.1 8.1 337.8 2.6 $4.58 106.9 32.0 63.2 32.6 30.4GILLETTE SATIN CARE - SHAVE CREAMS - WOMEN'S
TOTAL U.S.17,893.1 21.1 5,374.2 4.6 $3.33 71.0 30.4 56.0 31.6 16.8
WEST SOUTH CENTRAL2,218.4 25.1 639.9 4.9 $3.47 70.7 32.3 63.3 23.4 12.3
GILLETTE SERIES - SHAVE CREAM - OTHER THAN WOMEN'S
TOTAL U.S.19,929.2 11.5 6,254.1 5.4 $3.19 89.1 24.5 49.9 24.5 11.6
WEST SOUTH CENTRAL
2,233.5 11.7 771.4 5.9 $2.90 88.9 23.8 49.3 23.0 16.7PURE SILK - SHAVE CREAMS - WOMEN'S
TOTAL U.S.5,871.7 6.9 3,073.4 2.7 $1.91 91.7 18.7 45.2 9.0 1.8
WEST SOUTH CENTRAL741.8 8.4 347.3 2.7 $2.14 79.3 18.7 53.0 3.8 1.0
SKINTIMATE - SHAVE CREAMS - WOMEN'S
TOTAL U.S.56,583.8 66.8 11,428.8 9.8 $4.95 80.0 36.8 82.7 26.3 9.8
WEST SOUTH CENTRAL5,599.1 63.3 1,365.0 10.5 $4.10 80.1 33.9 82.2 18.7 9.6
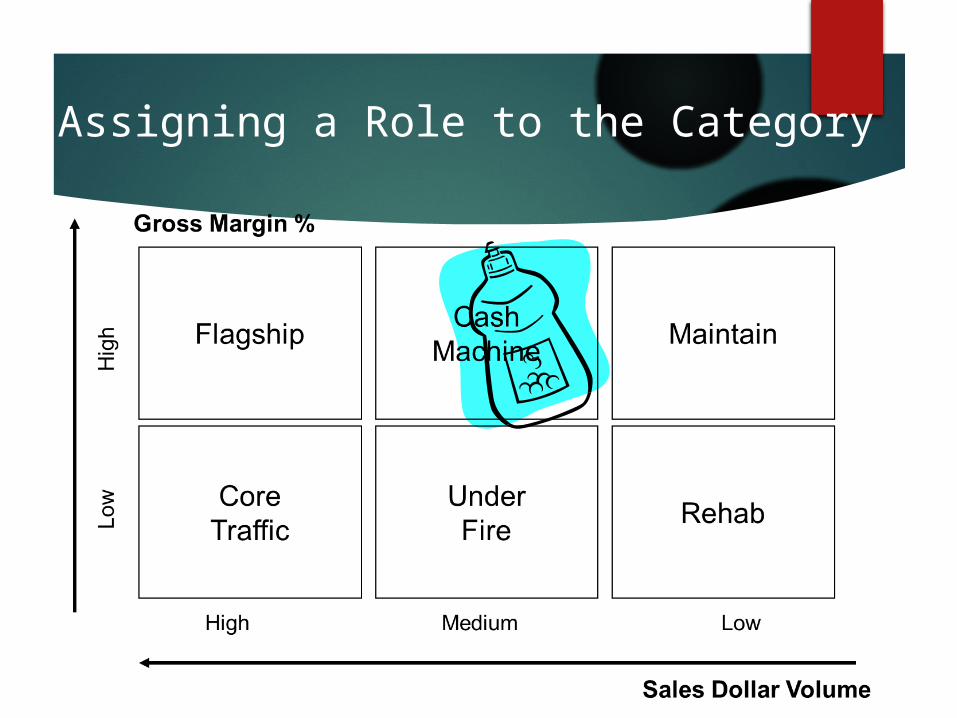
Assigning a Role to the Category
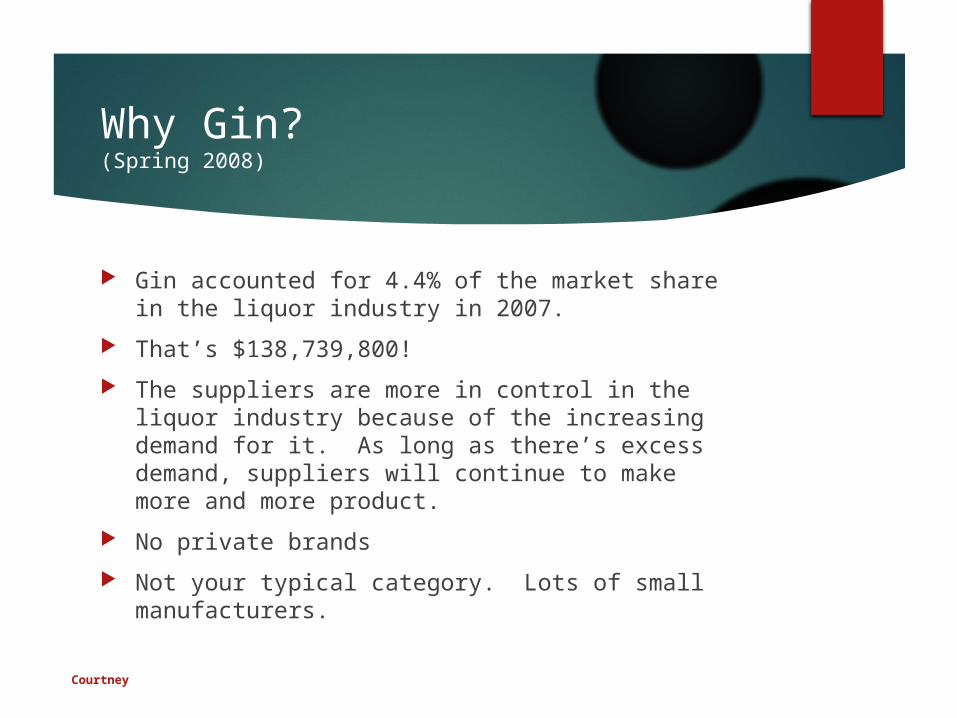
Why Gin?(Spring 2008)
Gin accounted for 4.4% of the market share in the liquor industry in 2007.
That’s $138,739,800!
The suppliers are more in control in the liquor industry because of the increasing demand for it. As long as there’s excess demand, suppliers will continue to make more and more product.
No private brands
Not your typical category. Lots of small manufacturers.
Courtney
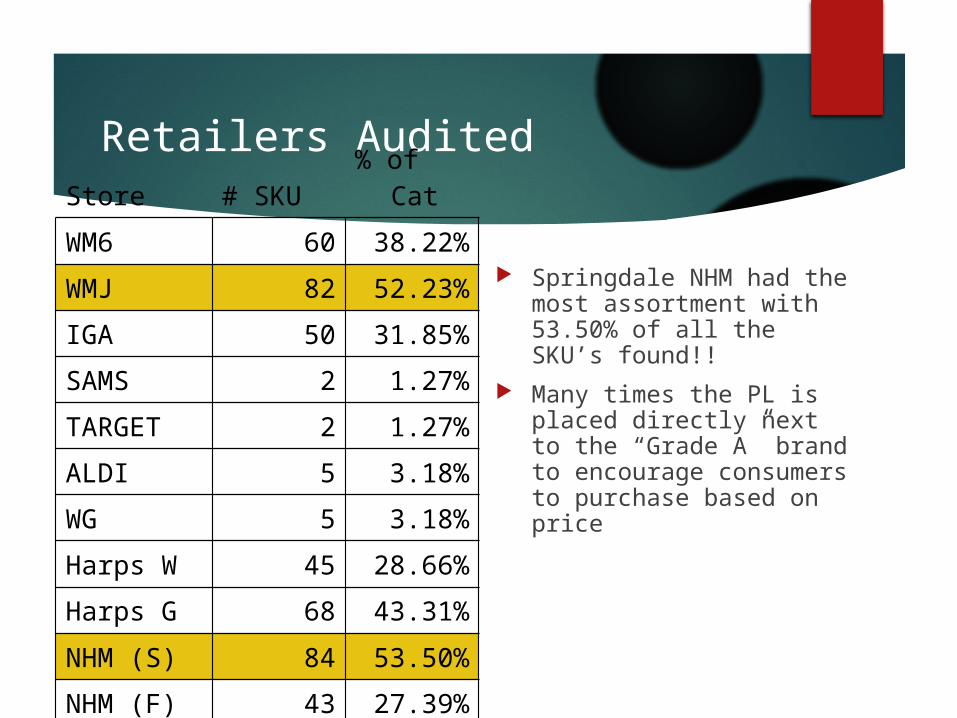
Retailers Audited Store # SKU % of Cat
WM6 60 38.22%
WMJ 82 52.23%
IGA 50 31.85%
SAMS 2 1.27%
TARGET 2 1.27%
ALDI 5 3.18%
WG 5 3.18%
Harps W 45 28.66%
Harps G 68 43.31%
NHM (S) 84 53.50%
NHM (F) 43 27.39%
Springdale NHM had the most assortment with 53.50% of all the SKU’s found!!
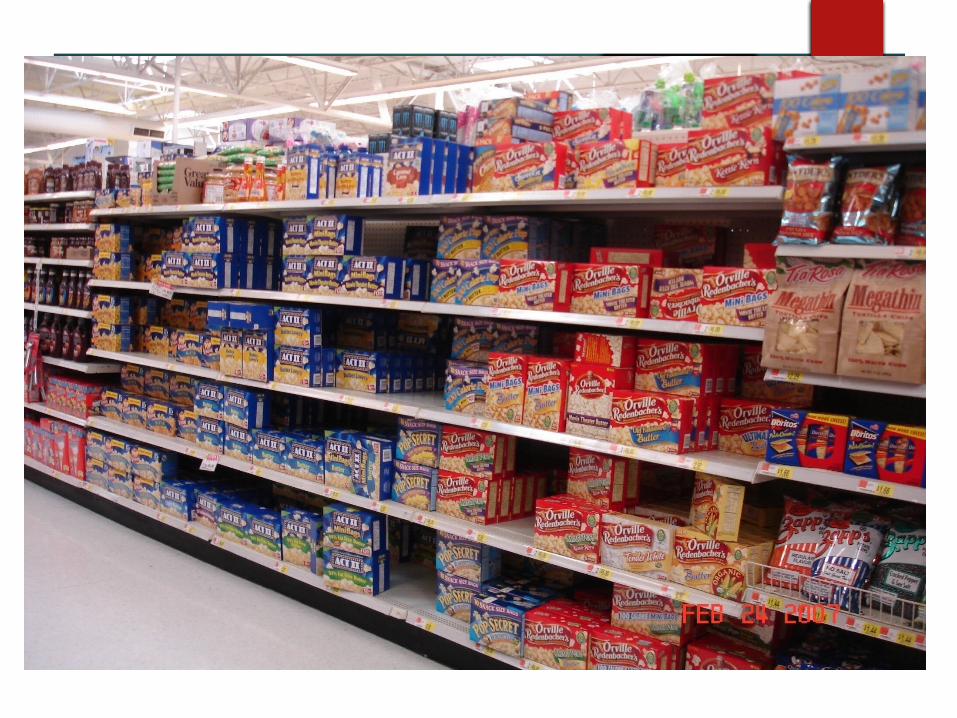
Many times the PL is placed directly next to the “Grade A” brand to encourage consumers to purchase based on price
Stores Audited
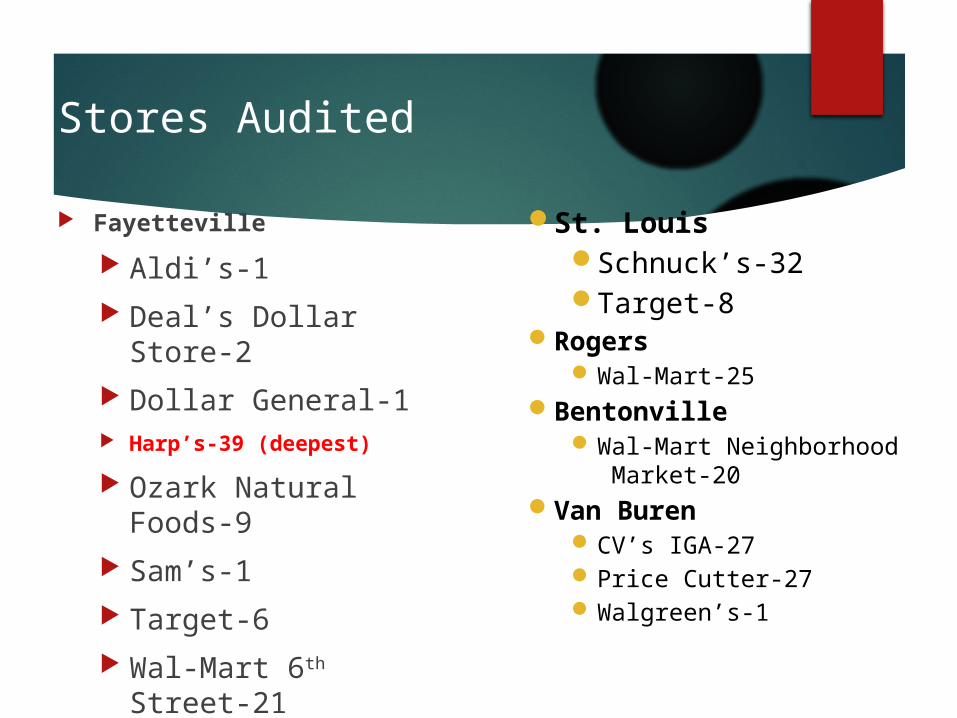
Fayetteville
Aldi’s-1 Deal’s Dollar Store-2 Dollar General-1 Harp’s-39 (deepest)
Ozark Natural Foods-9
Sam’s-1 Target-6 Wal-Mart 6th Street-
21
St. LouisSchnuck’s-32Target-8
Rogers Wal-Mart-25
Bentonville Wal-Mart Neighborhood
Market-20Van Buren
CV’s IGA-27 Price Cutter-27 Walgreen’s-1
Changes in Category
Have any new suppliers or brands appeared since a recent audit was conducted (semester of last audit)?
What has happened to prices and a prior group’s gross margin estimates?
Changes in share of display, at specific stores? Changes were minor or major? Category predictions, its role for the retailer, needs, etc.
The Suppliers
Introduction to suppliers and their brands
What did you describe as a dominant brand—why? SKUs? Number of stores stocking the brand? Stocking rate?
Were there some surprising losers? Any major firms with little shelf space, a single facings, strange or low margins.
SKU’s
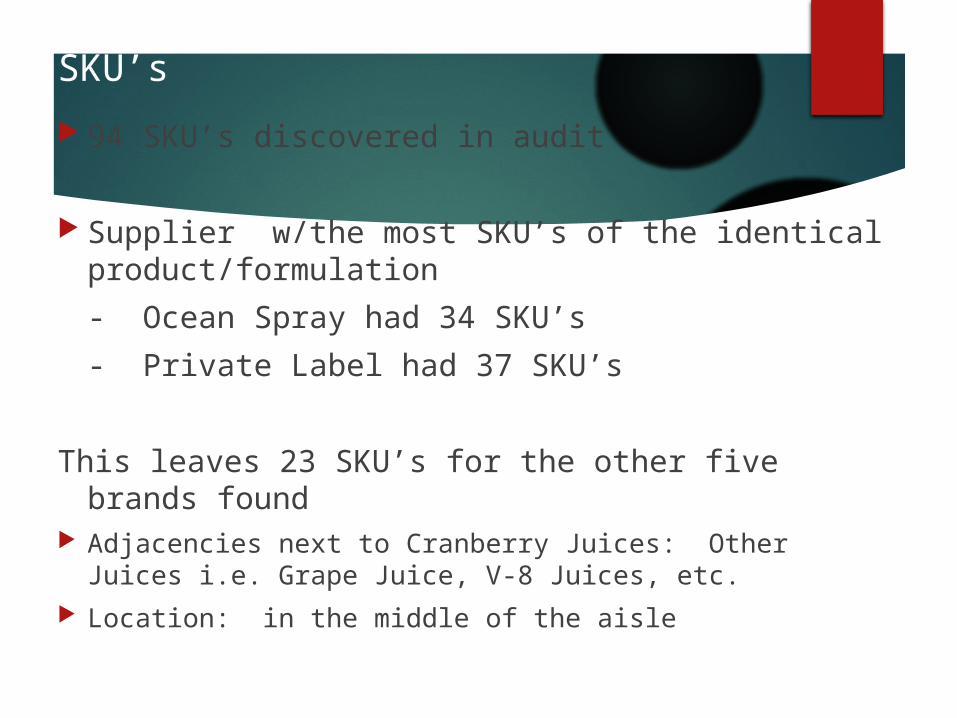
94 SKU’s discovered in audit
Supplier w/the most SKU’s of the identical product/formulation
- Ocean Spray had 34 SKU’s
- Private Label had 37 SKU’s
This leaves 23 SKU’s for the other five brands found Adjacencies next to Cranberry Juices: Other Juices i.e.
Grape Juice, V-8 Juices, etc. Location: in the middle of the aisle
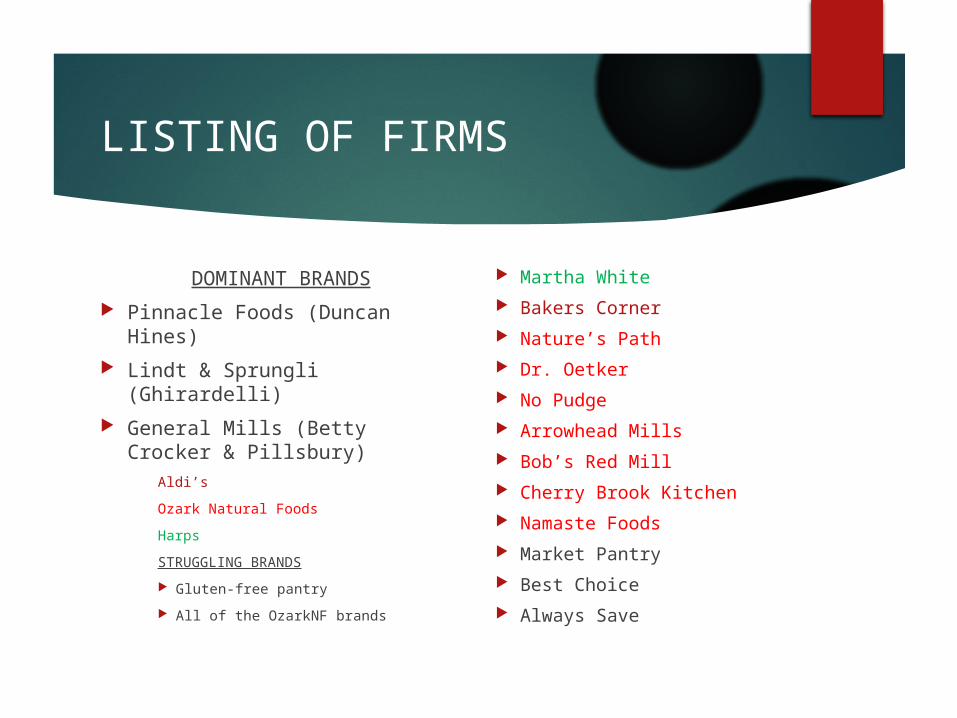
LISTING OF FIRMS
DOMINANT BRANDS
Pinnacle Foods (Duncan Hines)
Lindt & Sprungli (Ghirardelli)
General Mills (Betty Crocker & Pillsbury)
Aldi’s
Ozark Natural Foods
Harps
STRUGGLING BRANDS
Gluten-free pantry
All of the OzarkNF brands
Martha White
Bakers Corner
Nature’s Path
Dr. Oetker
No Pudge
Arrowhead Mills
Bob’s Red Mill
Cherry Brook Kitchen
Namaste Foods
Market Pantry
Best Choice
Always Save
Stores Audited
Total number of stores audited by group
Listing of stores
Trade area demographics for specific stores
Anticipated depth for the stores of interest to group members
Store without any evidence at category management—no relationship between demographics and category depth
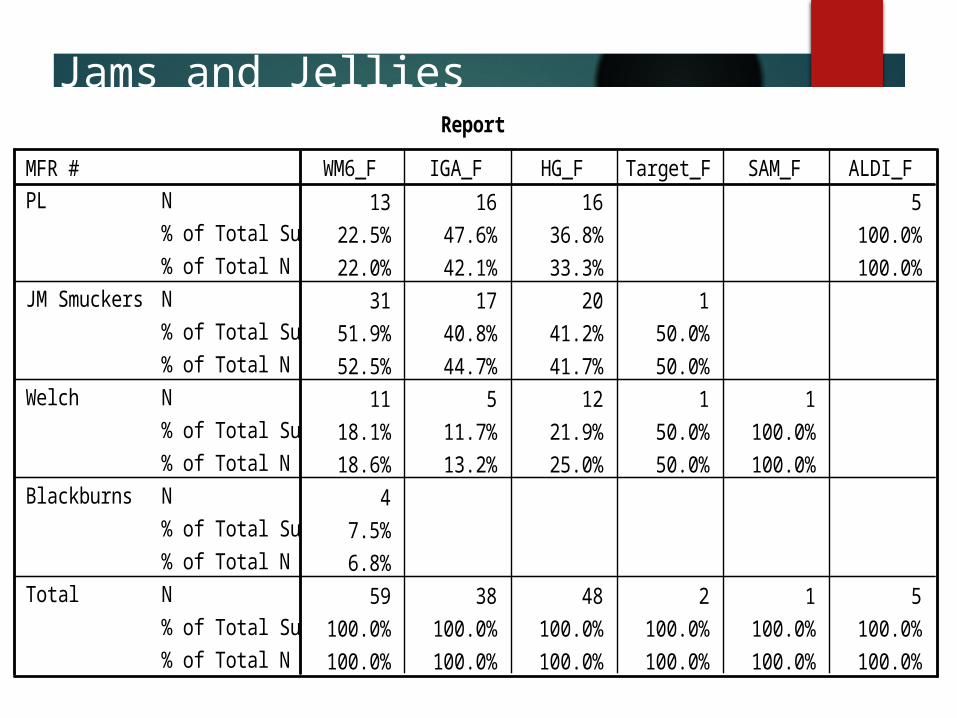
Jams and JelliesReport
13 16 16 5
22.5% 47.6% 36.8% 100.0%
22.0% 42.1% 33.3% 100.0%
31 17 20 1
51.9% 40.8% 41.2% 50.0%
52.5% 44.7% 41.7% 50.0%
11 5 12 1 1
18.1% 11.7% 21.9% 50.0% 100.0%
18.6% 13.2% 25.0% 50.0% 100.0%
4
7.5%
6.8%
59 38 48 2 1 5
100.0% 100.0% 100.0% 100.0% 100.0% 100.0%
100.0% 100.0% 100.0% 100.0% 100.0% 100.0%
N
% of Total Sum
% of Total N
N
% of Total Sum
% of Total N
N
% of Total Sum
% of Total N
N
% of Total Sum
% of Total N
N
% of Total Sum
% of Total N
MFR #PL
JM Smuckers
Welch
Blackburns
Total
WM6_F IGA_F HG_F Target_F SAM_F ALDI_F
How did your group determine gross margin?
What brands had the highest costs, what was it costs per ounce?
What were the estimates for private label, costs per ounce?
What adjustments for sizes, deals, negative gross margins did you have to make?
SPSS, 5-6 stores—of interest, showing average gross margin by brand, % of Total, mean %
% HHsHHs Index
% HHsHHs Index
% HHsHHs Index
% HHsHHs Index
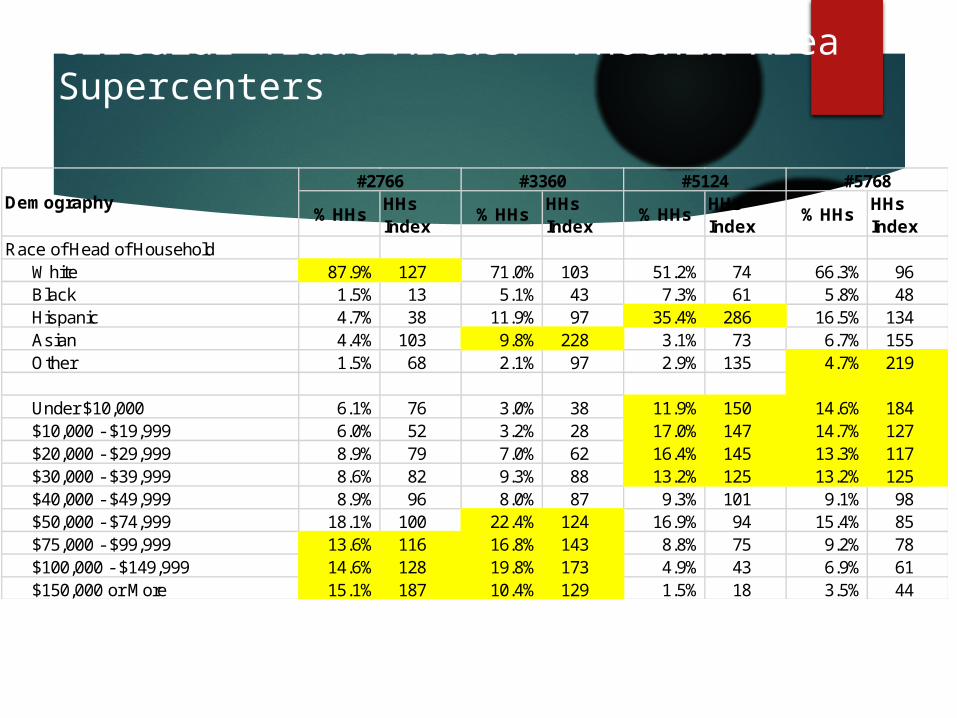
Race of Head of Household White 87.9% 127 71.0% 103 51.2% 74 66.3% 96 Black 1.5% 13 5.1% 43 7.3% 61 5.8% 48 Hispanic 4.7% 38 11.9% 97 35.4% 286 16.5% 134 Asian 4.4% 103 9.8% 228 3.1% 73 6.7% 155 Other 1.5% 68 2.1% 97 2.9% 135 4.7% 219
Under $10,000 6.1% 76 3.0% 38 11.9% 150 14.6% 184 $10,000 - $19,999 6.0% 52 3.2% 28 17.0% 147 14.7% 127 $20,000 - $29,999 8.9% 79 7.0% 62 16.4% 145 13.3% 117 $30,000 - $39,999 8.6% 82 9.3% 88 13.2% 125 13.2% 125 $40,000 - $49,999 8.9% 96 8.0% 87 9.3% 101 9.1% 98 $50,000 - $74,999 18.1% 100 22.4% 124 16.9% 94 15.4% 85 $75,000 - $99,999 13.6% 116 16.8% 143 8.8% 75 9.2% 78 $100,000 - $149,999 14.6% 128 19.8% 173 4.9% 43 6.9% 61 $150,000 or More 15.1% 187 10.4% 129 1.5% 18 3.5% 44
Demography#3360 #5124 #5768#2766
Circular Trade Areas: Phoenix Area Supercenters
% HHsHHs Index
% HHsHHs Index
% HHsHHs Index
% HHsHHs Index
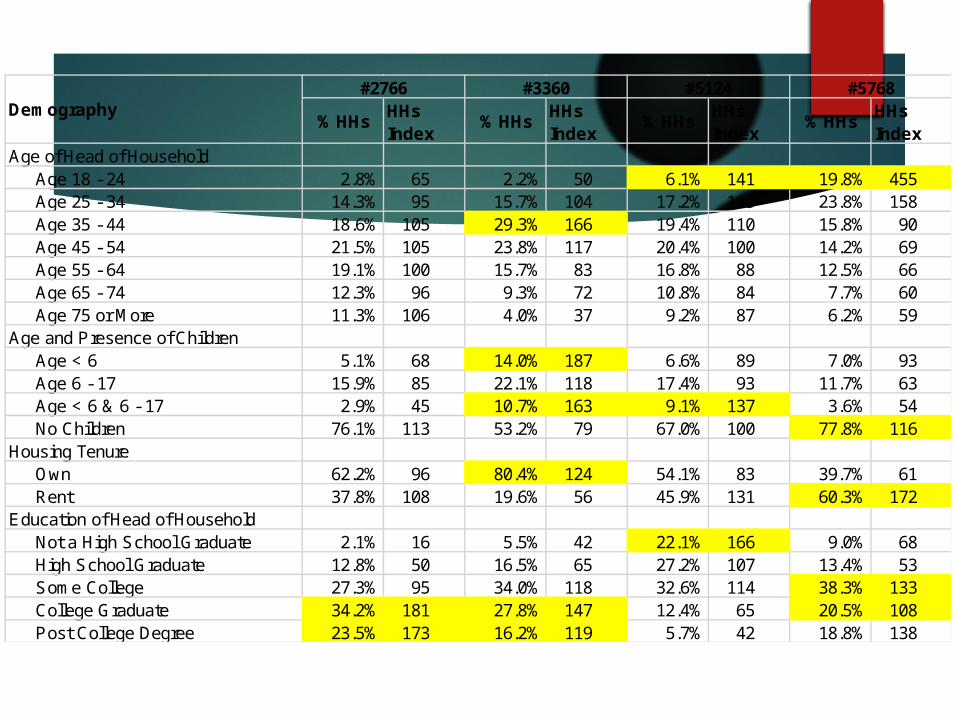
Age of Head of Household Age 18 - 24 2.8% 65 2.2% 50 6.1% 141 19.8% 455 Age 25 - 34 14.3% 95 15.7% 104 17.2% 115 23.8% 158 Age 35 - 44 18.6% 105 29.3% 166 19.4% 110 15.8% 90 Age 45 - 54 21.5% 105 23.8% 117 20.4% 100 14.2% 69 Age 55 - 64 19.1% 100 15.7% 83 16.8% 88 12.5% 66 Age 65 - 74 12.3% 96 9.3% 72 10.8% 84 7.7% 60 Age 75 or More 11.3% 106 4.0% 37 9.2% 87 6.2% 59Age and Presence of Children Age < 6 5.1% 68 14.0% 187 6.6% 89 7.0% 93 Age 6 - 17 15.9% 85 22.1% 118 17.4% 93 11.7% 63 Age < 6 & 6 - 17 2.9% 45 10.7% 163 9.1% 137 3.6% 54 No Children 76.1% 113 53.2% 79 67.0% 100 77.8% 116Housing Tenure Own 62.2% 96 80.4% 124 54.1% 83 39.7% 61 Rent 37.8% 108 19.6% 56 45.9% 131 60.3% 172Education of Head of Household Not a High School Graduate 2.1% 16 5.5% 42 22.1% 166 9.0% 68 High School Graduate 12.8% 50 16.5% 65 27.2% 107 13.4% 53 Some College 27.3% 95 34.0% 118 32.6% 114 38.3% 133 College Graduate 34.2% 181 27.8% 147 12.4% 65 20.5% 108 Post College Degree 23.5% 173 16.2% 119 5.7% 42 18.8% 138
Demography#3360 #5124 #5768#2766
A.C. Nielsen Circular Trade Areas
Required component, some evidence in your PowerPoint file.
Does it explain differences in depth?
Does it explain different in shares of gross margin?
Does it explain difference in average gross margins?
FACINGS
WalGreen-School St. -Facings
WalGreen-6th St. - Facings
Walmart-Mall Ave. -
Facings
WalMart-6thST-Facings
Target-Shiloh- Facings
Harps-Crossover-
Facings
Harps-Garland-Facings
IGA-College-Facings
Dollar General- Garland- Facings
Dollar General- SchoolSt-Facings
% of Total Sum 20.0% 20.6% 14.1% 16.0% 29.6% 32.6% 18.0% 25.5% 17.9% 7.1%
% of Total N 20.6% 21.9% 16.7% 20.0% 35.7% 32.6% 21.8% 25.6% 20.0% 12.2%
N 7 7 6 8 10 15 12 10 11 5
% of Total Sum 2.9% 8.1% 5.0% 2.8% 6.7% 6.6% 9.1% 10.3% 3.6%
% of Total N 3.1% 11.1% 7.5% 3.6% 6.5% 5.5% 10.3% 10.9% 4.9%
N 1 4 3 1 3 3 4 6 2
% of Total Sum 14.3% 14.7% 16.2% 12.0% 18.3% 6.7% 3.3% 4.5% 9.0% 8.6%
% of Total N 14.7% 15.6% 16.7% 12.5% 14.3% 6.5% 3.6% 5.1% 10.9% 12.2%
N 5 5 6 5 4 3 2 2 6 5
% of Total Sum 28.6% 14.7% 22.2% 35.0% 29.6% 19.1% 26.2% 30.9% 6.2% 24.3%
% of Total N 26.5% 15.6% 25.0% 27.5% 25.0% 17.4% 20.0% 28.2% 7.3% 14.6%
N 9 5 9 11 7 8 11 11 4 6
% of Total Sum 22.9% 29.4% 16.2% 9.0% 9.9% 14.6% 9.0% 16.4% 23.4% 23.6%
% of Total N 23.5% 25.0% 8.3% 7.5% 10.7% 15.2% 9.1% 15.4% 21.8% 24.4%
N 8 8 3 3 3 7 5 6 12 10
% of Total Sum 100.0% 100.0% 100.0% 100.0% 100.0% 100.0% 100.0% 100.0% 100.0% 100.0%
% of Total N 100.0% 100.0% 100.0% 100.0% 100.0% 100.0% 100.0% 100.0% 100.0% 100.0%
N 34 32 36 40 28 46 55 39 55 41
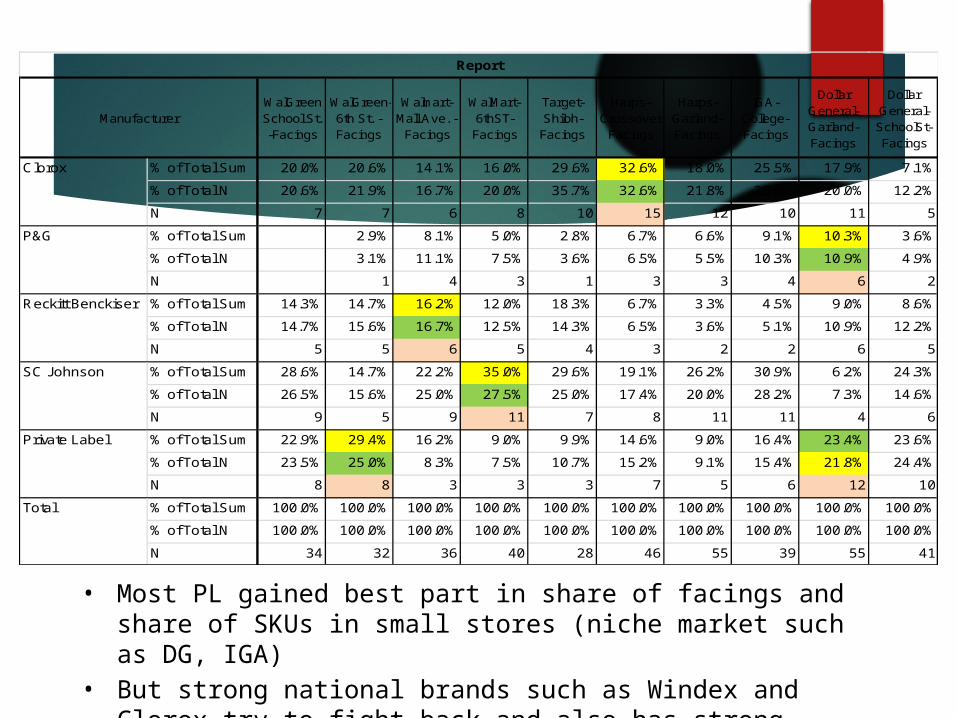
SC Johnson
Private Label
Total
P&G
Reckitt Benckiser
Report
Manufacturer
Clorox
• Most PL gained best part in share of facings and share of SKUs in small stores (niche market such as DG, IGA)
• But strong national brands such as Windex and Clorox try to fight back and also has strong influence in big stores (Wal-Mart, Harps).
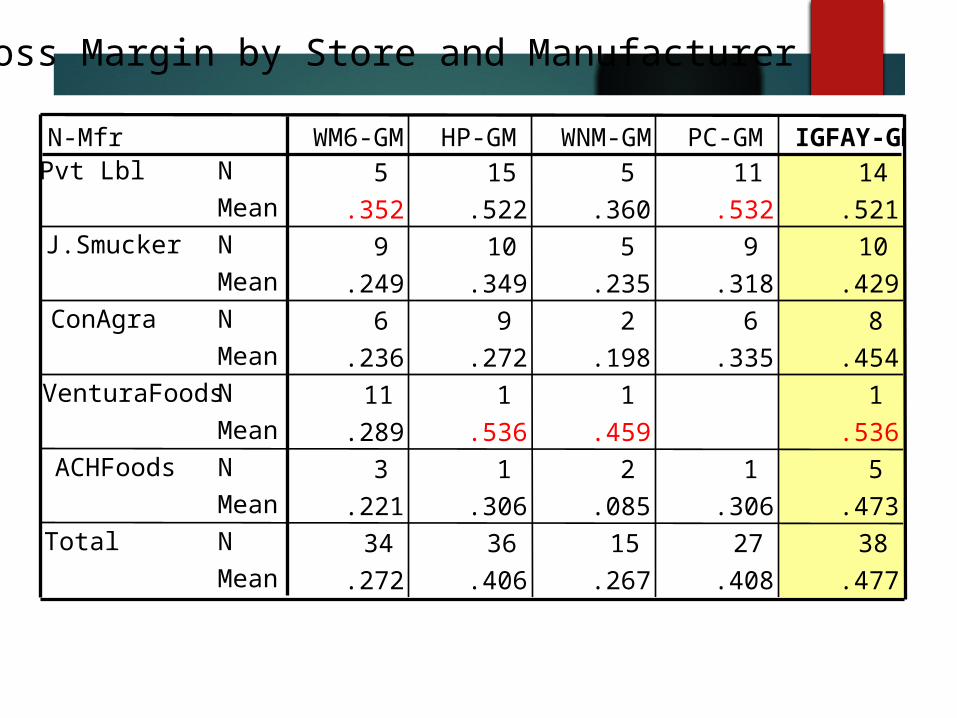
Gross Margin by Store and Manufacturer
5 15 5 11 14.352 .522 .360 .532 .521
9 10 5 9 10.249 .349 .235 .318 .429
6 9 2 6 8.236 .272 .198 .335 .45411 1 1 1
.289 .536 .459 .5363 1 2 1 5
.221 .306 .085 .306 .47334 36 15 27 38
.272 .406 .267 .408 .477
NMeanNMeanNMeanNMeanNMeanNMean
N-MfrPvt Lbl
J.Smucker
ConAgra
VenturaFoods
ACHFoods
Total
WM6-GM HP-GM WNM-GM PC-GM IGFAY-GM

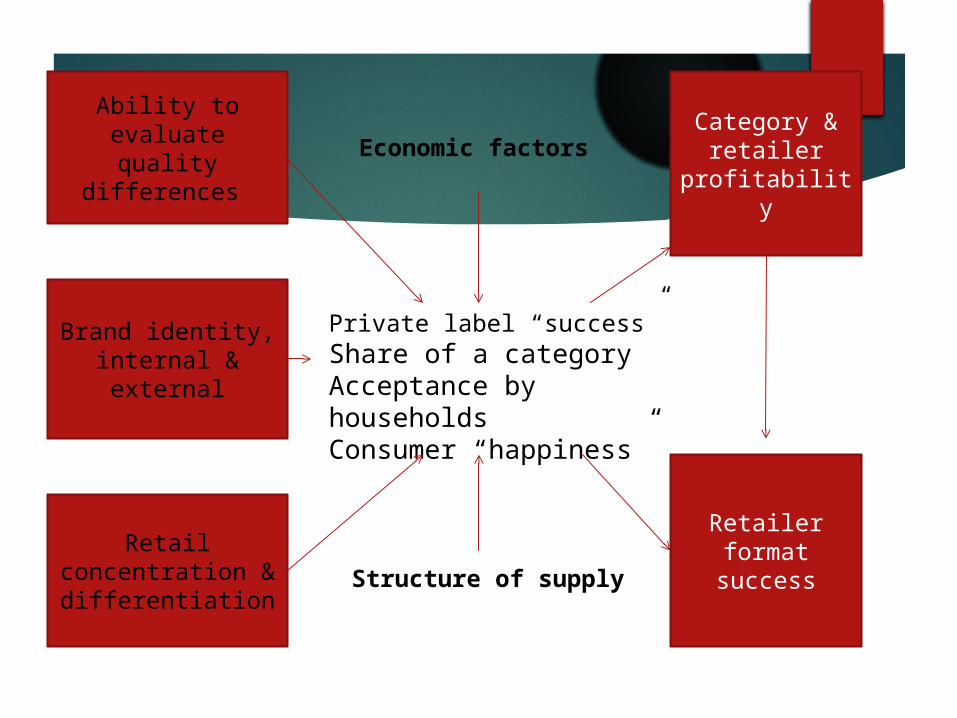
Private label “success”Share of a categoryAcceptance by householdsConsumer “happiness”
Ability to evaluate quality
differences
Brand identity, internal & external
Retail concentration & differentiation
Category & retailer
profitability
Economic factors
Structure of supply
Retailer format success
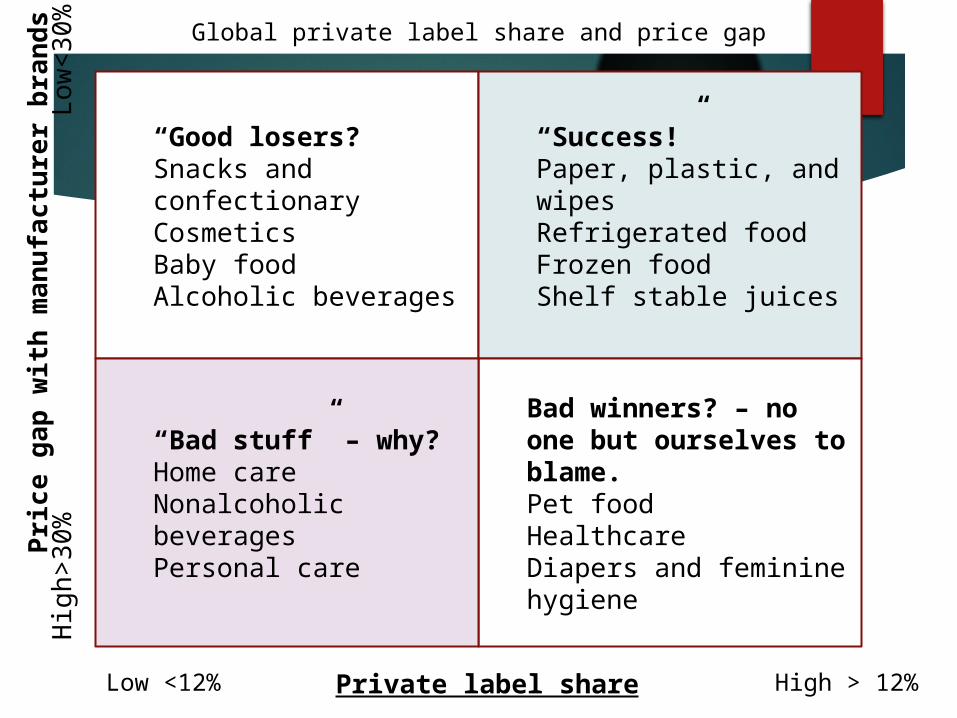
“Good losers?Snacks and confectionaryCosmeticsBaby foodAlcoholic beverages
“Success!”Paper, plastic, and wipesRefrigerated foodFrozen foodShelf stable juices
Bad winners? – no one but ourselves to blame.Pet foodHealthcareDiapers and feminine hygiene
Pri
ce g
ap
wit
h m
an
ufa
ctu
rer
bra
nd
sH
igh
>3
0%
Low
<3
0%
Private label shareLow <12% High > 12%
“Bad stuff” – why?Home careNonalcoholic beveragesPersonal care
Global private label share and price gap
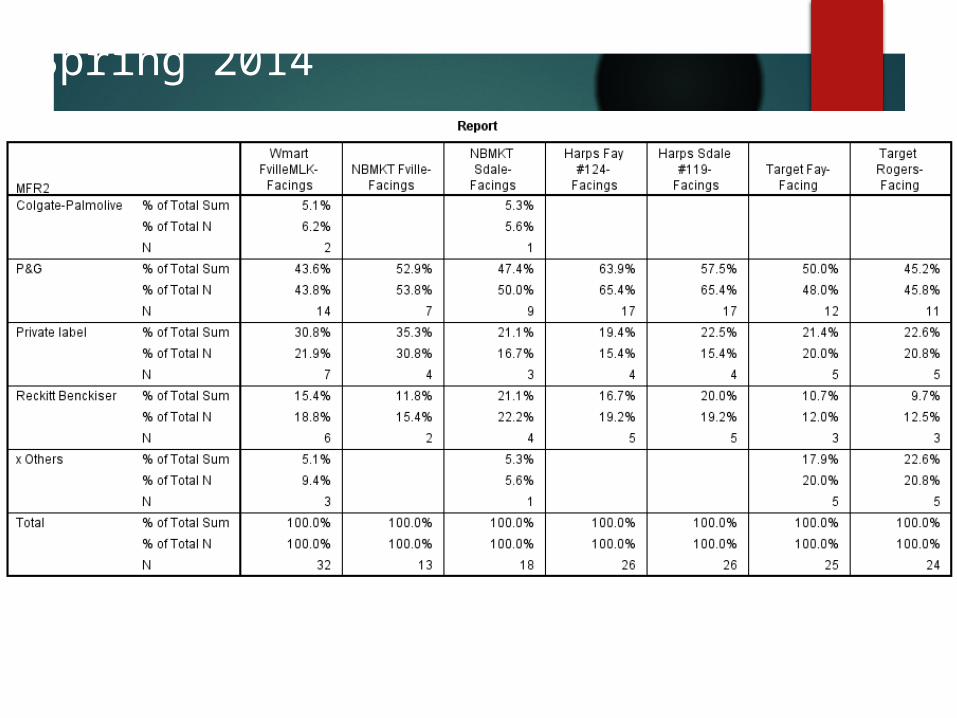
Spring 2014
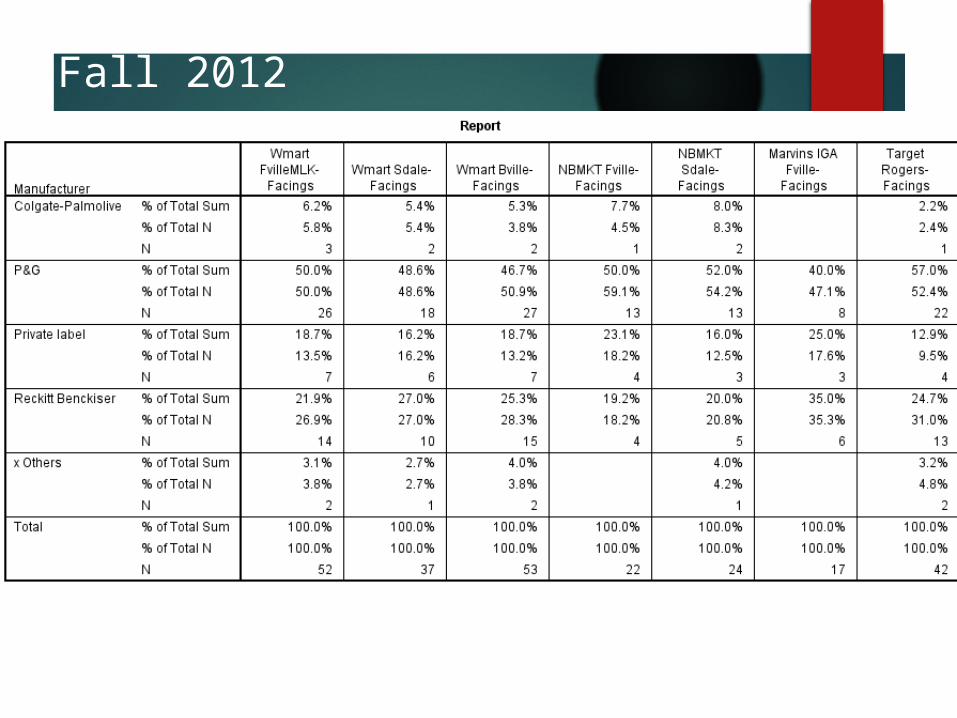
Fall 2012
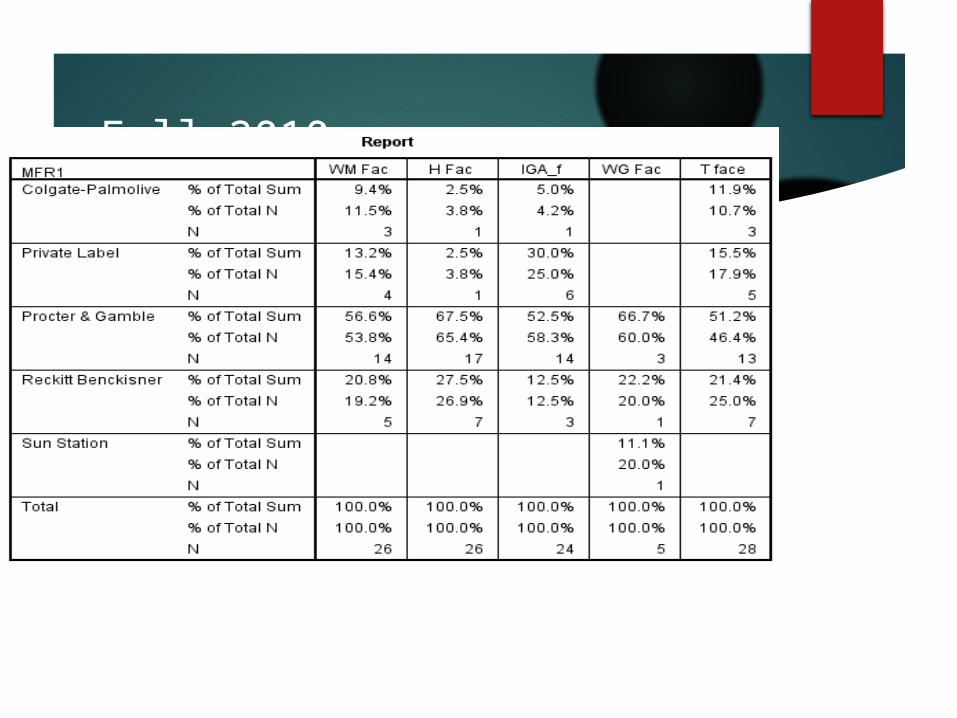
Fall 2010

Writing
Follow guidelines for double-spaced number of pages (26 lines, 3-4 paragraphs per page).
If you’re assigned to write a section—be sure all group members re-read it.
Include Heading for each of the eight sections and page breaks to separate sections/steps
Use subheadings within section if discussion in section is more than one page.