Embed Size (px)
Citation preview
water
Article
Hydrological Effectiveness of an Extensive GreenRoof in Mediterranean Climate
Stefania Anna Palermo 1,* , Michele Turco 2 , Francesca Principato 1 and Patrizia Piro 1
1 Department of Civil Engineering, University of Calabria, 87036 Rende (CS), Italy2 Department of Environmental and Chemical Engineering, University of Calabria, 87036 Rende (CS), Italy* Correspondence: [email protected]
Received: 16 May 2019; Accepted: 2 July 2019; Published: 4 July 2019�����������������
Abstract: In urban water management, green roofs provide a sustainable solution for flood riskmitigation. Numerous studies have investigated green roof hydrologic effectiveness and theparameters that influence their operation; many have been conducted on the pilot scale, whereasonly some of these have been executed on full-scale rooftop installations. Several models have beendeveloped, but only a few have investigated the influence of green roof physical parameters onperformance. From this broader context, this paper presents the results of a monitoring analysis of anextensive green roof located at the University of Calabria, Italy, in the Mediterranean climate region.To obtain this goal, the subsurface runoff coefficient, peak flow reduction, peak flow lag-time, and timeto the start of runoff were evaluated at an event scale by considering a set of data collected betweenOctober 2015 and September 2016 consisting of 62 storm events. The mean value of subsurface runoff
was 32.0% when considering the whole dataset, and 50.4% for 35 rainfall events (principally majorthan 8.0 mm); these results indicate the good hydraulic performance of this specific green roof in aMediterranean climate, which is in agreement with other studies. A modeling approach was used toevaluate the influence of the substrate depth on green roof retention. The soil hydraulics featureswere first measured using a simplified evaporation method, and then modeled using HYDRUS-1Dsoftware (PC-Progress s.r.o., Prague, Czech Republic) by considering different values of soil depth(6 cm, 9 cm, 12 cm, and 15 cm) for six months under Mediterranean climate conditions. The resultsshowed how the specific soil substrate was able to achieve a runoff volume reduction ranging from22% to 24% by increasing the soil depth.
Keywords: green roof; rainfall runoff; subsurface runoff coefficient; retention; soil depth; HYDRUS-1Dmodel; urban hydrology
1. Introduction
The combined effect of climate change and land-use alterations, due to ongoing urbanization,produces several environmentally adverse effects. The constant loss of natural areas, which significantlyaffects the natural hydrological cycle, and the increase in the frequency of extreme weather eventshave resulted in a considerable increase in runoff volumes that overload the drainage systems andproduce floods [1–4].
In this scenario, the use of sustainable solutions as an alternative to conventional techniques hasbecome a general goal of urban water management. To move in this sustainable direction, low impactdevelopments (LIDs) such as green roofs (GRs) are a possible eco-solution that contributes to restoringthe pre-development natural hydrological response [5–8].
GRs, by exploiting otherwise unused spaces, are particularly beneficial in densely built urbanareas [9]. They represent a source of storm water runoff mitigation by reducing the total runoff volume,peak flow rate, and delaying peak discharge time into the combined sewer systems [10,11]. GRs, which
Water 2019, 11, 1378; doi:10.3390/w11071378 www.mdpi.com/journal/water
Water 2019, 11, 1378 2 of 17
incorporate both the natural environment and engineered systems, offer a wide range of other benefits,including an enhancement of water quality, reduction in the building energy demand, attenuation ofurban heat islands, decrease in air pollution and noise levels in urban spaces, increase in the building’saesthetic value, and wildlife and biodiversity growth [12–17].
Many studies agree on the classification of GRs into two main categories: extensive and intensive,which differ from each other regarding the depth of soil layer and vegetation. Generally, extensive GRshave a thin soil layer of less than approximately 15 cm, whereas intensive soil layers exceed this value;shallow rooting and drought-resistant plants are used for the extensive GR, whereas deeper rootingplants are used for the intensive GRs. Therefore, due to its characteristics, the extensive GR is lighter,cheaper, and requires less maintenance than the intensive one [18–20].
Several studies have analyzed GRs retention performance worldwide; many of these have beenconducted on a pilot scale, generally consisting of different test beds or similar modules [11,18,19];others have been conducted on a full-scale rooftop [10,20,21]. However, not all of these have analyzedthe GR behavior for a continuous monitoring period, evaluating each parameter on an event scale.
The hydraulic behavior of GRs has also been analyzed from a modeling point of view. Numericalmodels have been developed using software such as the Environmental Protection Agency (EPA)’sStorm Water Management Model (SWMM) [19,22–24], Soil, Water, Atmosphere, and Plant (SWAP)model [25], and HYDRUS model [26–29].
From the analysis of these studies, some indicators (runoff volume reduction, peak flow reduction,peak flow lag-time, etc.) have been used to estimate GR hydraulic effectiveness. Another usefullumped parameter that is crucial for designing purposes is the subsurface runoff coefficient (SRC),which is calculated as the ratio between the total runoff depth delivered from the GR and the totalrainfall depth, i.e., the inverse value of the GR retention capacity. From a literature review completedby Garofalo et al. [30], the SRC presented a large variability in mean value, ranging from 0.30 to 0.90.This wide range can be explained by analyzing, for each study, the climate conditions of the GR site,the GR’s size (full-scale or pilot system), period of data analysis, the time step resolution, and thehydraulic and physical features.
Factors that typically influence GR water retention capacity can be grouped in two main categories:weather conditions (length of the antecedent dry weather period, season/climate, characteristics ofrainfall event) and the GR’s physical features (number of layers and materials, substrate depth, itshydraulic characteristics, type of vegetation, percentage of roof covered, roof geometry, and green roofage). Being unable to intervene in the weather conditions of the site where the installation is located,the choice of the physical characteristics of the substrate is crucial. In this regard, many studies haveobserved that the hydraulic behavior of a GR is influenced by the substrate depth and type [31–33].Some of these studies were conducted in the laboratory by considering constant rainfall data and notreal data recorded by a rain gauge, whereas others considered the results of modeling simulationsbased on literature hydraulic soil properties and not real substrate hydraulic properties.
From this broader context, the first objective of this study was to present the field hydrologicalmonitoring results of a specific extensive GR that has been installed at the University of Calabria, Italy,in a Mediterranean climate. To complete this analysis, first, one year of rainfall data (October 2015 toSeptember 2016) recorded by a rain gauge located on the experimental site was selected. Secondly, thecorresponding runoff from the GR was evaluated and compared with the runoff from an imperviousroof, which was located at the same site. Thirdly, to analyze the green roof’s hydraulic efficiency, theresponse in terms of the SRC, peak flow reduction (PFR), peak flow lag-time (PFL), and time to start ofrunoff (TSR) were determined on an event scale. The second objective of the study was to evaluatethe influence of the soil depth on the retention capacity of a substrate soil for an extensive greenroof in Mediterranean climate by considering the measured soil hydraulic properties and varying thethickness (from 9 to 15 cm) by means of the HYDRUS-1D model.
Water 2019, 11, 1378 3 of 17
2. Materials and Methods
2.1. Experimental Site
The experimental green roof (Figure 1) was built in 2012 on the terrace of the Department ofMechanical, Energy and Management Engineering (DIMEG), at the University of Calabria, Italy, located221 m above sea level in the Vermicelli Catchment. The University is in the south of Italy in the vicinityof Cosenza (39◦18′ N 16◦15′ E), under a Mediterranean climate condition, which is characterized by anaverage annual precipitation of 881.2 mm/year and a mean annual temperature of 15.5 ◦C [27].
Water 2019, 11, x FOR PEER REVIEW 3 of 18
2. Materials and Methods
2.1. Experimental Site
The experimental green roof (Figure 1) was built in 2012 on the terrace of the Department of Mechanical, Energy and Management Engineering (DIMEG), at the University of Calabria, Italy, located 221 m above sea level in the Vermicelli Catchment. The University is in the south of Italy in the vicinity of Cosenza (39°18′ N 16°15′ E), under a Mediterranean climate condition, which is characterized by an average annual precipitation of 881.2 mm/year and a mean annual temperature of 15.5 °C [27].
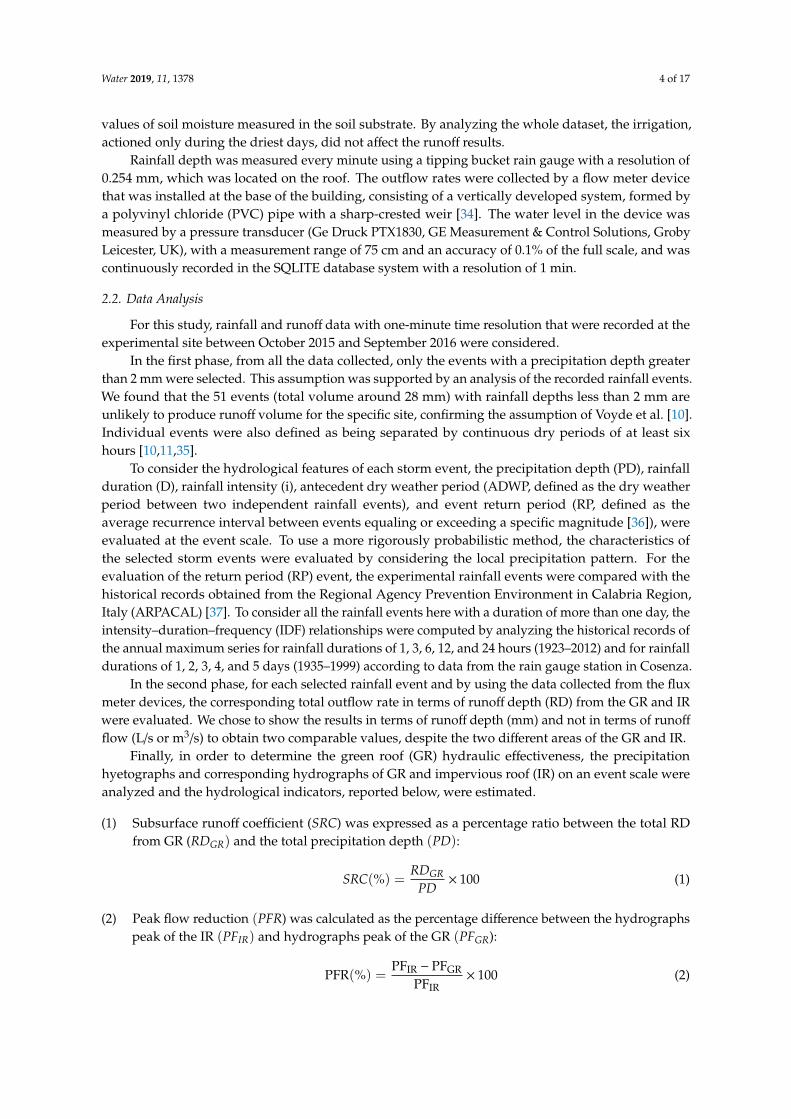
The green roof (GR) was built according to Italian regulation UNI 11235, and from top to bottom consisted of: (1) a surface layer, vegetated with three native Mediterranean species; (2) a commercial soil substrate, called “Terra Mediterranea” (Harpo spa, Trieste, Italy), with a maximum depth of 8 cm composed of a mineral terrain; (3) a permeable geotextile with a weight of 105 g/m2 to prevent fine soil particles from moving into the underlying layers; (4) a drainage layer in polystyrene foam with a water storage capacity of 11 L/m2 and a drainage capacity of 0.46 L·s−1m−2; (5) an anti-root layer consisting of a waterproof bituminous membrane with an anti-root additive, specific for green roof installation; and (6) an additional recovery waterproof membrane in elastobituminous membrane. In detail, as discussed in depth by Brunetti et al. [27], the soil substrate consists of a mineral soil with 74% gravel, 22% sand, and 4% silt and clay; it presents a measured bulk density of 0.86 g·cm−3 and 8% organic matter, which was determined in the laboratory using the Walkley–Black method. Among the three native Mediterranean species, two are herbaceous plants that are suited for well-drained soils (Dianthus gratianopolitanus and Cerastium tomentosum), and one is a succulent plant (Carpobrotus edulis), which is characterized by a high drought tolerance. More detail on the specific soil substrate hydraulic properties are reported in the results section, where the measurements recorded in the laboratory are provided.
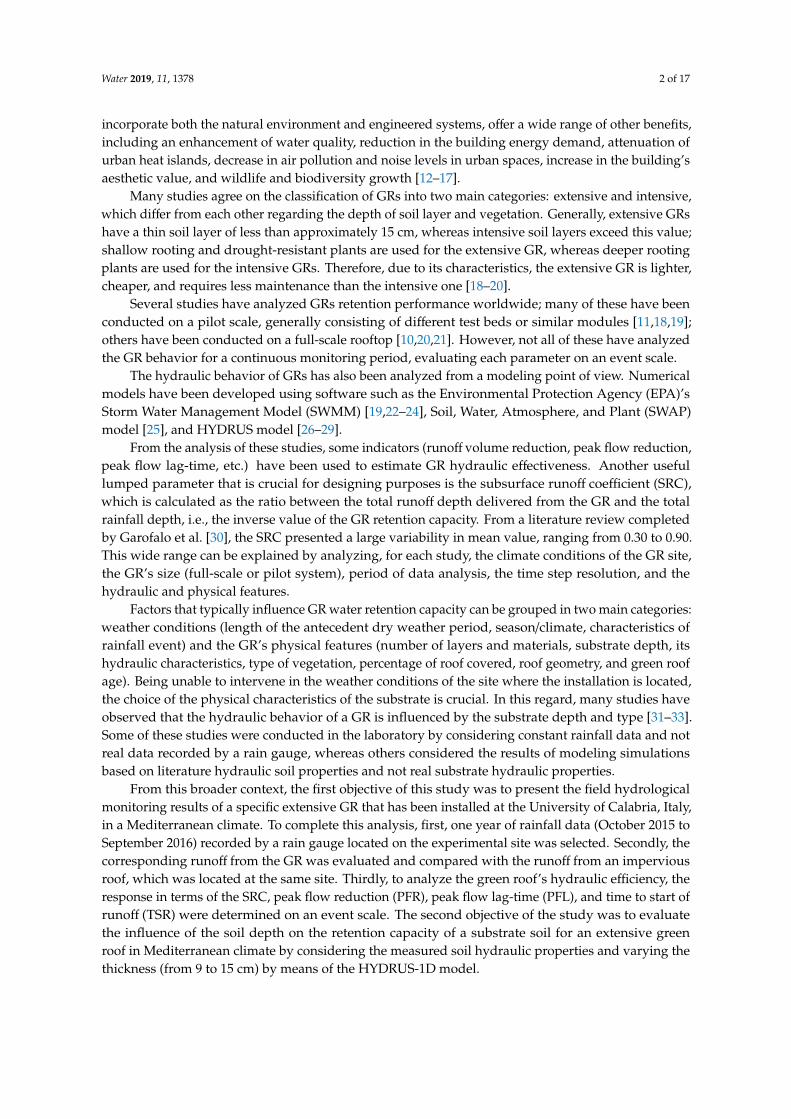
Figure 1. The experimental green roof (GR) located at the University of Calabria, Italy. A map of Italy, with the location of the green roof (left), the GR experimental site (middle), and an axonometric detail stratigraphy (right). All the figures were captured or created by the Urban Hydraulic and Hydrology Laboratory, University of Calabria, Italy.
To evaluate the hydraulic efficiency of this specific stratigraphy, the outflow collected from the GR, which is characterized by an area of 50 m2 and a slope of 1%, was compared with that discharged by an impervious roof (IR) located on the same site, which presented an area of 40 m2. The different areas of the GR and IR were considered during the outflow comparison analysis.
The GR water supply is guaranteed only by reusing the green roof’s outflow, which was collected in a specific storage tank and distributed through a drip irrigation system. This irrigation system is activated during drought periods, generally occurring in summer when the precipitation volume for the specific climate condition is low and very high temperatures are recorded in accordance with low values of soil moisture measured in the soil substrate. By analyzing the whole dataset, the irrigation, actioned only during the driest days, did not affect the runoff results.
Figure 1. The experimental green roof (GR) located at the University of Calabria, Italy. A map of Italy,with the location of the green roof (left), the GR experimental site (middle), and an axonometric detailstratigraphy (right). All the figures were captured or created by the Urban Hydraulic and HydrologyLaboratory, University of Calabria, Italy.
The green roof (GR) was built according to Italian regulation UNI 11235, and from top to bottomconsisted of: (1) a surface layer, vegetated with three native Mediterranean species; (2) a commercialsoil substrate, called “Terra Mediterranea” (Harpo spa, Trieste, Italy), with a maximum depth of 8 cmcomposed of a mineral terrain; (3) a permeable geotextile with a weight of 105 g/m2 to prevent finesoil particles from moving into the underlying layers; (4) a drainage layer in polystyrene foam witha water storage capacity of 11 L/m2 and a drainage capacity of 0.46 L·s−1m−2; (5) an anti-root layerconsisting of a waterproof bituminous membrane with an anti-root additive, specific for green roofinstallation; and (6) an additional recovery waterproof membrane in elastobituminous membrane. Indetail, as discussed in depth by Brunetti et al. [27], the soil substrate consists of a mineral soil with74% gravel, 22% sand, and 4% silt and clay; it presents a measured bulk density of 0.86 g·cm−3 and 8%organic matter, which was determined in the laboratory using the Walkley–Black method. Among thethree native Mediterranean species, two are herbaceous plants that are suited for well-drained soils(Dianthus gratianopolitanus and Cerastium tomentosum), and one is a succulent plant (Carpobrotus edulis),which is characterized by a high drought tolerance. More detail on the specific soil substrate hydraulicproperties are reported in the results section, where the measurements recorded in the laboratoryare provided.
To evaluate the hydraulic efficiency of this specific stratigraphy, the outflow collected from theGR, which is characterized by an area of 50 m2 and a slope of 1%, was compared with that dischargedby an impervious roof (IR) located on the same site, which presented an area of 40 m2. The differentareas of the GR and IR were considered during the outflow comparison analysis.
The GR water supply is guaranteed only by reusing the green roof’s outflow, which was collectedin a specific storage tank and distributed through a drip irrigation system. This irrigation system isactivated during drought periods, generally occurring in summer when the precipitation volume forthe specific climate condition is low and very high temperatures are recorded in accordance with low
Water 2019, 11, 1378 4 of 17
values of soil moisture measured in the soil substrate. By analyzing the whole dataset, the irrigation,actioned only during the driest days, did not affect the runoff results.
Rainfall depth was measured every minute using a tipping bucket rain gauge with a resolution of0.254 mm, which was located on the roof. The outflow rates were collected by a flow meter devicethat was installed at the base of the building, consisting of a vertically developed system, formed bya polyvinyl chloride (PVC) pipe with a sharp-crested weir [34]. The water level in the device wasmeasured by a pressure transducer (Ge Druck PTX1830, GE Measurement & Control Solutions, GrobyLeicester, UK), with a measurement range of 75 cm and an accuracy of 0.1% of the full scale, and wascontinuously recorded in the SQLITE database system with a resolution of 1 min.
2.2. Data Analysis
For this study, rainfall and runoff data with one-minute time resolution that were recorded at theexperimental site between October 2015 and September 2016 were considered.
In the first phase, from all the data collected, only the events with a precipitation depth greaterthan 2 mm were selected. This assumption was supported by an analysis of the recorded rainfall events.We found that the 51 events (total volume around 28 mm) with rainfall depths less than 2 mm areunlikely to produce runoff volume for the specific site, confirming the assumption of Voyde et al. [10].Individual events were also defined as being separated by continuous dry periods of at least sixhours [10,11,35].
To consider the hydrological features of each storm event, the precipitation depth (PD), rainfallduration (D), rainfall intensity (i), antecedent dry weather period (ADWP, defined as the dry weatherperiod between two independent rainfall events), and event return period (RP, defined as theaverage recurrence interval between events equaling or exceeding a specific magnitude [36]), wereevaluated at the event scale. To use a more rigorously probabilistic method, the characteristics ofthe selected storm events were evaluated by considering the local precipitation pattern. For theevaluation of the return period (RP) event, the experimental rainfall events were compared with thehistorical records obtained from the Regional Agency Prevention Environment in Calabria Region,Italy (ARPACAL) [37]. To consider all the rainfall events here with a duration of more than one day, theintensity–duration–frequency (IDF) relationships were computed by analyzing the historical records ofthe annual maximum series for rainfall durations of 1, 3, 6, 12, and 24 hours (1923–2012) and for rainfalldurations of 1, 2, 3, 4, and 5 days (1935–1999) according to data from the rain gauge station in Cosenza.
In the second phase, for each selected rainfall event and by using the data collected from the fluxmeter devices, the corresponding total outflow rate in terms of runoff depth (RD) from the GR and IRwere evaluated. We chose to show the results in terms of runoff depth (mm) and not in terms of runoff
flow (L/s or m3/s) to obtain two comparable values, despite the two different areas of the GR and IR.Finally, in order to determine the green roof (GR) hydraulic effectiveness, the precipitation
hyetographs and corresponding hydrographs of GR and impervious roof (IR) on an event scale wereanalyzed and the hydrological indicators, reported below, were estimated.
(1) Subsurface runoff coefficient (SRC) was expressed as a percentage ratio between the total RDfrom GR (RDGR) and the total precipitation depth (PD):
SRC(%) =RDGR
PD× 100 (1)
(2) Peak flow reduction (PFR) was calculated as the percentage difference between the hydrographspeak of the IR (PFIR) and hydrographs peak of the GR (PFGR):
PFR(%) =PFIR − PFGR
PFIR× 100 (2)
Water 2019, 11, 1378 5 of 17
(3) Peak flow lag-time (PFL) was determined as the time difference between the peak of precipitation
hyetograph (tP) and the peak of GR hydrograph(tPGR
):
PFL(min) = tPGR − tP (3)
(4) Time to start of runoff (TSR) was evaluated, according to Stovin et al. [11], as the time differencebetween the start of rainfall (t0) and the time at which the total runoff exceeded 0.01 mm(tRD>0.01 mm):
TSR(min) = tRD>0.01 mm − t0 (4)
2.3. Soil hydraulic Properties
To evaluate the influence of the substrate depth on green roof retention capacity, a six-monthdataset (January 2016 to June 2016) was selected from a weather station that measured the precipitation,velocity and direction of wind, air humidity, air temperature, atmospheric pressure, and global solarradiation. The weather station is located at the University of Calabria, next to the experimental site (theGreen Roof) cited in this work. Data from the station were collected online and were processed andstored in an SQL database. Reference evapotranspiration was calculated using the Penman–Monteithequation [38]. An average value of albedo of 0.23 was assumed considering that the albedo forvegetated areas was 0.23 in a similar study conducted on a green roof [39].
In order to assess the hydrological response of the green roof by variating the soil substrate depthusing the HYDRUS model, the hydraulic properties of the soil materials were investigated.
There are many methods to assess the hydraulic properties of soils in different conditions [40,41].Among these, the simplified evaporation method [42] is one of the most popular. This method isbased on measuring both soil moisture and pressure head during a soil drying cycle under the effectof evaporation. The method was developed by Wind [43], who introduced an iterative graphicalprocedure to estimate, first, the water retention curve from the average soil moisture and pressurehead readings, and to define hydraulic conductivities from measured pressure head profile andvariations in the water content distribution. Afterwards, several authors proposed simplifications tothis method [44–46].
In this work, the hydraulic properties of the soil substrates were measured in the Urban Hydraulicsand Hydrology Laboratory, University of Calabria, Italy using a simplified evaporation methodproposed by Schindler et al. [45,46] using the HYPROP® device (METER Group AG, Munich,Germany) [47]. With this method, two tensiometers are placed at two depths of a soil sample sitting ina sample ring. The plane in the middle between the two tensiometers is identical to the horizontalsymmetry plane of the column. The sample is saturated with water, basally closed, and set on a balance.The soil surface is open to the ambient atmosphere so that the soil water can evaporate. HYPROP®
(METER Group AG, Munich, Germany) measures the water tension in two horizons of the soil sampleover the evaporation process by means of two vertical tension shafts. The changing mass of the sampleover time is assessed by weighing. The medial water content is calculated based on the mass change.This results in one measuring value per point in time for the retention curve.
The soil substrate of the green roof for the laboratory analysis was packed using a stainless-steelsampling ring with a volume of 250 mL. Then, the soil sample was saturated from the bottom beforestarting the evaporation test. The measurement unit and the tensiometers were degassed using avacuum pump to reduce the potential nucleation sites in the demineralized water. At the end of theexperiment, the sample was placed in an oven at 105 ◦C for 24 h; then, the dry weight was measured.For a complete description of the system, please refer to the UMS [47].
The numerical optimization procedure, HYPROP-FIT [48], was used to simultaneously fit theretention and hydraulic conductivity functions to the experimental data obtained using the evaporationmethod. Fitting was accomplished using a non-linear optimization algorithm that minimizes the sumof the weighted squared residuals between model predictions and measurements.
Water 2019, 11, 1378 6 of 17
The unimodal van Genuchten–Mualem model [49] was evaluated for the description of soilhydraulic properties:
Θ =
1
(1+(α|h|)n)m if h ≤ 0
1 if h > 0(5)
Θ =θ− θr
θs − θr(6)
K =
KsΘL[(
1−(1−Θ
1m))m]2
if h < 0
Ks if h > 0(7)
m = 1−1n
(8)
where Θ is the effective saturation; α is a parameter related to the inverse of the air-entry pressure head(L−1); θs and θr are the saturated and residual water contents, respectively (–); n and m are pore-sizedistribution indices; Ks is the saturated hydraulic conductivity (L·T−1); and L is the tortuosity andpore-connectivity parameter.
2.4. Simulation Procedure
Based on the hydraulic properties measured by the simplified evaporation method proposedby Schindler et al. [45,46] using the HYPROP® device (METER Group AG, Munich, Germany) [47],we analyzed the runoff volume from a specific substrate for an extensive green roof by consideringincreasing values of soil depth using the HYDRUS-1D model. In detail, the cumulative runoff volumefrom the green roof, in response to a continuous period of six months of rainfall events, was evaluatedby varying the depth of the soil from time to time, not exceeding the maximum soil thickness of 15 cmgenerally attributed to an extensive green roof (6 cm, 9 cm, 12 cm, and 15 cm).
To run a simulation by varying the soil substrate, the HYDRUS-1D model [50] was used.HYDRUS-1D is a one-dimensional finite element model that is used for simulating the movementof water, heat, and multiple solutes in variably saturated porous media. HYDRUS-1D implementsmultiple uniform (single-porosity) and nonequilibrium (dual-porosity and dual-permeability) waterflow models [50].
The studied green roof was interpreted as a one-dimensional, single-porosity, porous mediumsystem, which could be described by the Richards equation in the following form:
∂θ∂z
=∂∂z
[K(h)
∂h∂z
+ 1]− S (9)
where θ is the volumetric water content, h is the soil water pressure head (L), K(h) is the unsaturatedhydraulic conductivity (LT−1), z is the soil depth (L), and S is a sink term (L3L−3T−1), which is definedas a volume of water removed from a unit volume of soil per unit of time due to plant water uptake.Feddes et al. [51] defined S as:
S(h) = a(h) × Sp (10)
where a(h) is a dimensionless water stress response function that depends on the soil pressure head hand has a range of values between 0–1, and Sp is the potential root water uptake rate.
Feddes et al. [51] proposed a water stress response function, in which water uptake is assumed tobe zero close to soil saturation and for pressure heads higher than the wilting point. Water uptakeis assumed to be optimal between two specific pressure heads, which depend on a particular plant.Feddes parameters were assumed according to the HYDRUS database considering the vegetationas grass.
Water 2019, 11, 1378 7 of 17
2.5. Numerical Domain and Boundary Conditions
The numerical domain representing the stratigraphy of the green roof consisted of one layer.An atmospheric boundary condition was applied at the soil surface using the precipitation andmeteorological conditions measured. A seepage face boundary condition was specified at the bottom ofthe layer. A seepage face boundary acts as a zero-pressure head boundary when the bottom boundarynode is saturated, and as a no-flux boundary when it is unsaturated.
The initial pressure head was assumed to be constant in the entire domain and was set to −100 cm.
3. Results and Discussion
3.1. Rainfall Events
The whole studied period was characterized by 62 rainy events and one snowy event (19 January2016), which was not considered in this study (Table 1), for a total precipitation depth (PD) of1256.3 mm ranging from 2.0 mm to 120.1 mm with a mean value of 20.3 mm. For the whole datasetand the specific climate conditions, more than half (51.6%) of the rainfall events had a precipitationdepth less than 10 mm, while 24.2% had a precipitation depth between 10–30 mm, 16.1% had aprecipitation depth between 30–50 mm, 3.2% had a precipitation depth between 50–70 mm, 1.6% (oneevent) had a precipitation depth between 70–90 mm, one event had a precipitation depth between90–110 mm, and one had a precipitation depth greater than 110 mm. Our analysis is representative ofthe specific precipitation pattern where the experimental site is located, and therefore is affected by theMediterranean climate condition characterized by hot and dry summers and cool and wet winters [30].
Table 1. Hydrological characteristics of each rainfall event collected from October 2015 to September 2016on the experimental site. PD: precipitation depth, D: rainfall duration, Mean i: mean rainfall intensity,Max i: maximum rainfall intensity, ADWP: antecedent dry weather period, and RP: return period.
No. Date PD D Mean i Max i ADWP RP
(dd/mm/yyyy; hh:mm) (mm) (hh:mm) (mm/h) (mm/h) (hh:mm:ss) (years)
1 07/10/2015; 07:47 42.2 15:05 2.8 121.9 - <12 09/10/2015; 19:21 24.1 16:32 1.5 167.6 43:40 <13 10/10/2015; 23:25 48.3 17:11 2.8 106.7 11:33 <14 15/10/2015; 08:01 6.4 04:24 1.4 15.2 90:45 <15 21/10/2015; 14:51 120.1 42:55 2.8 45.7 146:25 <206 29/10/2015; 13:10 63.3 35:32 1.8 61.0 147:25 <27 21/11/2015; 23:26 37.1 10:37 3.5 30.5 526:45 <18 23/11/2015; 16:30 13.0 04:19 3.0 15.2 30:28 <19 24/11/2015; 17:24 97.3 61:31 1.6 76.2 20:34 <3
10 28/11/2015; 08:49 2.8 01:53 1.5 15.2 25:54 <111 10/12/2015; 13:05 8.4 02:48 3.0 15.2 290:22 <112 03/01/2016; 06:04 66.3 36:28 1.8 76.2 566:10 <213 05/01/2016; 02:51 3.3 08:15 0.4 30.5 08:19 <114 06/01/2016; 05:45 24.6 24:08 1.0 30.5 18:37 <115 07/01/2016; 19:36 9.9 08:58 1.1 15.2 13:43 <116 12/01/2016; 19:02 6.1 08:43 0.7 30.5 110:28 <117 15/01/2016; 21:39 24.9 25:51 1.0 15.2 58:22 <118 11/02/2016; 08:01 23.4 04:54 4.8 30.5 519:58 <119 12/02/2016; 06:25 18.8 07:07 2.6 45.7 17:30 <120 12/02/2016; 23:22 74.9 35:24 2.1 76.2 09:49 <321 18/02/2016; 05:26 45.2 18:25 2.5 45.7 90:40 <122 20/02/2016; 12:15 4.6 00:48 5.7 30.5 36:24 <123 23/02/2016; 22:11 3.1 02:55 1.0 15.2 81:07 <124 26/02/2016; 03:52 10.9 19:30 0.6 30.5 50:46 <1
Water 2019, 11, 1378 8 of 17
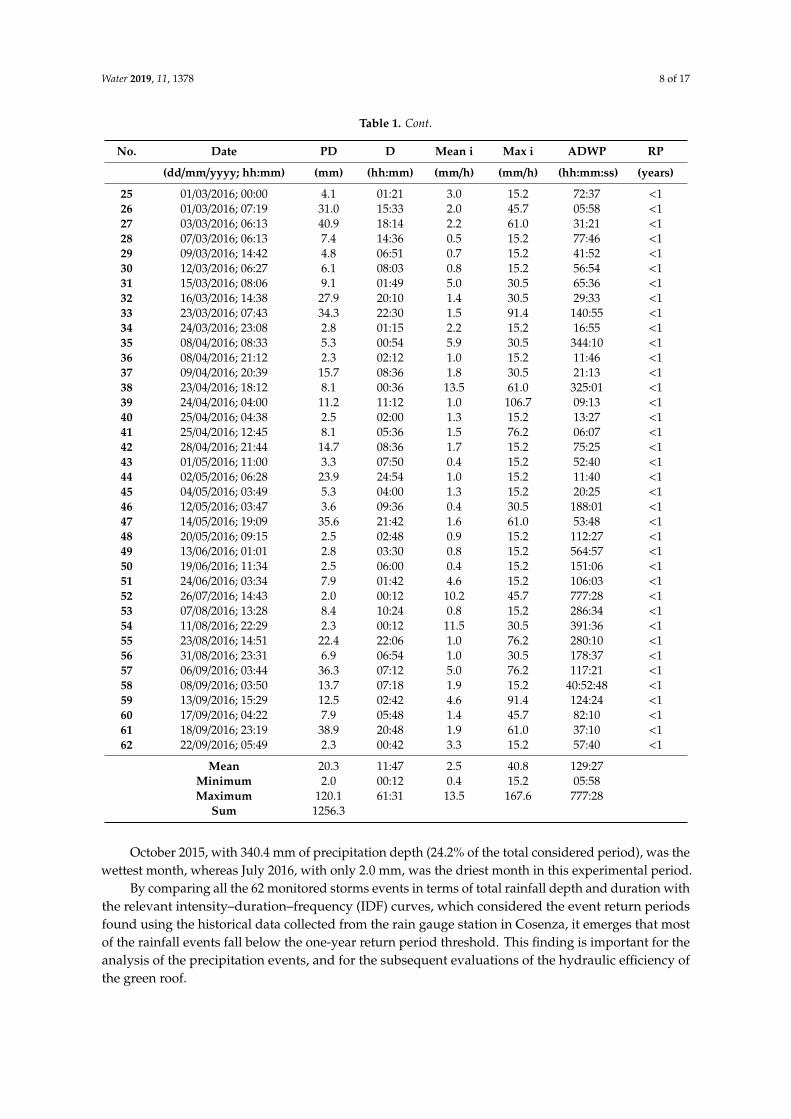
Table 1. Cont.
No. Date PD D Mean i Max i ADWP RP
(dd/mm/yyyy; hh:mm) (mm) (hh:mm) (mm/h) (mm/h) (hh:mm:ss) (years)
25 01/03/2016; 00:00 4.1 01:21 3.0 15.2 72:37 <126 01/03/2016; 07:19 31.0 15:33 2.0 45.7 05:58 <127 03/03/2016; 06:13 40.9 18:14 2.2 61.0 31:21 <128 07/03/2016; 06:13 7.4 14:36 0.5 15.2 77:46 <129 09/03/2016; 14:42 4.8 06:51 0.7 15.2 41:52 <130 12/03/2016; 06:27 6.1 08:03 0.8 15.2 56:54 <131 15/03/2016; 08:06 9.1 01:49 5.0 30.5 65:36 <132 16/03/2016; 14:38 27.9 20:10 1.4 30.5 29:33 <133 23/03/2016; 07:43 34.3 22:30 1.5 91.4 140:55 <134 24/03/2016; 23:08 2.8 01:15 2.2 15.2 16:55 <135 08/04/2016; 08:33 5.3 00:54 5.9 30.5 344:10 <136 08/04/2016; 21:12 2.3 02:12 1.0 15.2 11:46 <137 09/04/2016; 20:39 15.7 08:36 1.8 30.5 21:13 <138 23/04/2016; 18:12 8.1 00:36 13.5 61.0 325:01 <139 24/04/2016; 04:00 11.2 11:12 1.0 106.7 09:13 <140 25/04/2016; 04:38 2.5 02:00 1.3 15.2 13:27 <141 25/04/2016; 12:45 8.1 05:36 1.5 76.2 06:07 <142 28/04/2016; 21:44 14.7 08:36 1.7 15.2 75:25 <143 01/05/2016; 11:00 3.3 07:50 0.4 15.2 52:40 <144 02/05/2016; 06:28 23.9 24:54 1.0 15.2 11:40 <145 04/05/2016; 03:49 5.3 04:00 1.3 15.2 20:25 <146 12/05/2016; 03:47 3.6 09:36 0.4 30.5 188:01 <147 14/05/2016; 19:09 35.6 21:42 1.6 61.0 53:48 <148 20/05/2016; 09:15 2.5 02:48 0.9 15.2 112:27 <149 13/06/2016; 01:01 2.8 03:30 0.8 15.2 564:57 <150 19/06/2016; 11:34 2.5 06:00 0.4 15.2 151:06 <151 24/06/2016; 03:34 7.9 01:42 4.6 15.2 106:03 <152 26/07/2016; 14:43 2.0 00:12 10.2 45.7 777:28 <153 07/08/2016; 13:28 8.4 10:24 0.8 15.2 286:34 <154 11/08/2016; 22:29 2.3 00:12 11.5 30.5 391:36 <155 23/08/2016; 14:51 22.4 22:06 1.0 76.2 280:10 <156 31/08/2016; 23:31 6.9 06:54 1.0 30.5 178:37 <157 06/09/2016; 03:44 36.3 07:12 5.0 76.2 117:21 <158 08/09/2016; 03:50 13.7 07:18 1.9 15.2 40:52:48 <159 13/09/2016; 15:29 12.5 02:42 4.6 91.4 124:24 <160 17/09/2016; 04:22 7.9 05:48 1.4 45.7 82:10 <161 18/09/2016; 23:19 38.9 20:48 1.9 61.0 37:10 <162 22/09/2016; 05:49 2.3 00:42 3.3 15.2 57:40 <1
Mean 20.3 11:47 2.5 40.8 129:27Minimum 2.0 00:12 0.4 15.2 05:58Maximum 120.1 61:31 13.5 167.6 777:28
Sum 1256.3
October 2015, with 340.4 mm of precipitation depth (24.2% of the total considered period), was thewettest month, whereas July 2016, with only 2.0 mm, was the driest month in this experimental period.
By comparing all the 62 monitored storms events in terms of total rainfall depth and duration withthe relevant intensity–duration–frequency (IDF) curves, which considered the event return periodsfound using the historical data collected from the rain gauge station in Cosenza, it emerges that mostof the rainfall events fall below the one-year return period threshold. This finding is important for theanalysis of the precipitation events, and for the subsequent evaluations of the hydraulic efficiency ofthe green roof.
Water 2019, 11, 1378 9 of 17
3.2. Green Roof Hydrologic Effectiveness
To evaluate the hydrological performance of the experimental green roof, the runoff volume—whichwas generated in response to the 62 rainfall events recorded at the experimental site—and thehydrological indicators, were both analyzed.
Table 2 reports the results obtained in terms of total runoff depth (RD) and subsurface runoff
coefficient (SRC) for each event. For peak flow reduction (PFR), peak flow lag-time (PFL), and timeto start runoff (TSR), only the results for rainfall events with a precipitation depth (PD) greater than8 mm are shown. In detail, the choice to evaluate the PFR, PFL, and TSR indexes for only for someevents was based on the evaluations conducted on rainfall events with precipitation depths less than8 mm, which were almost completely preserved by the green roof. In this regard, having found aminimal runoff for these events, it was difficult to identify a demarcated hydrograph peak as well asthe start of the hydrograph, which was considerably delayed. The same situation was found for event53, which, despite having a rainfall depth of 8.4 mm, had a minimal runoff volume that was probablyaffected by the long event duration and the high temperature of the period (August), and thereforewas not suitable for the analysis. Table 2 also reports the mean, minimum, and maximum values foreach hydrological indicator.
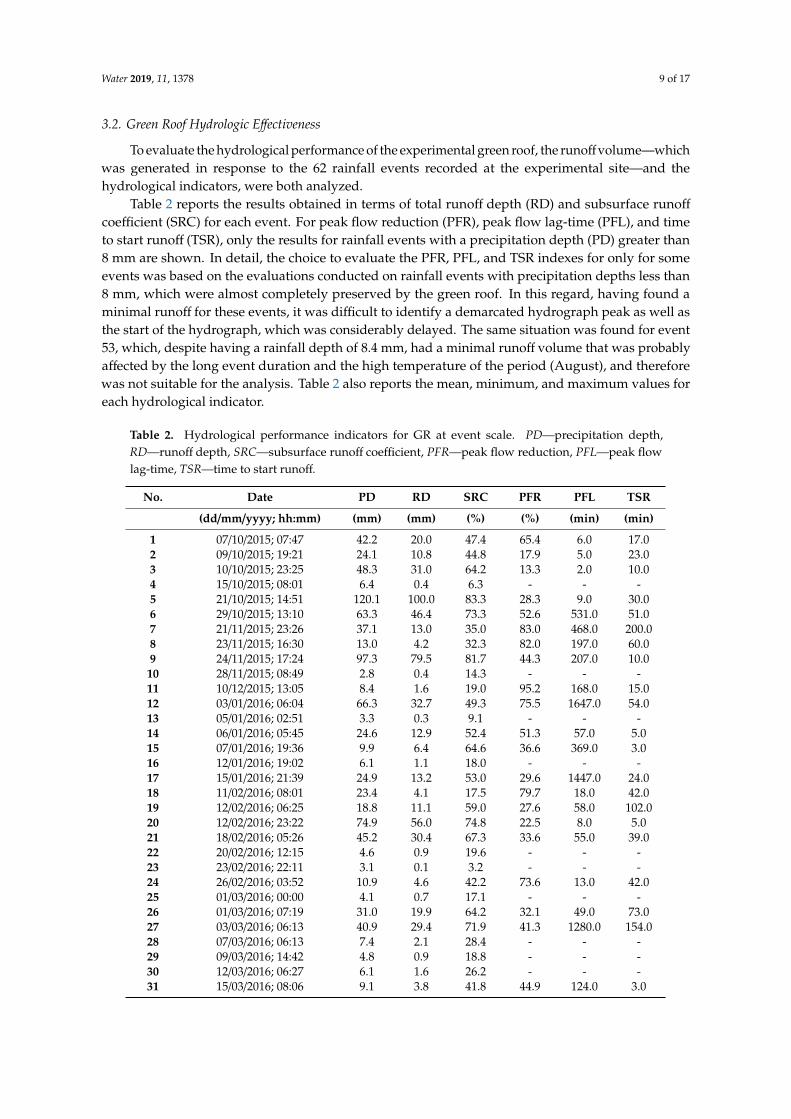
Table 2. Hydrological performance indicators for GR at event scale. PD—precipitation depth,RD—runoff depth, SRC—subsurface runoff coefficient, PFR—peak flow reduction, PFL—peak flowlag-time, TSR—time to start runoff.
No. Date PD RD SRC PFR PFL TSR
(dd/mm/yyyy; hh:mm) (mm) (mm) (%) (%) (min) (min)
1 07/10/2015; 07:47 42.2 20.0 47.4 65.4 6.0 17.02 09/10/2015; 19:21 24.1 10.8 44.8 17.9 5.0 23.03 10/10/2015; 23:25 48.3 31.0 64.2 13.3 2.0 10.04 15/10/2015; 08:01 6.4 0.4 6.3 - - -5 21/10/2015; 14:51 120.1 100.0 83.3 28.3 9.0 30.06 29/10/2015; 13:10 63.3 46.4 73.3 52.6 531.0 51.07 21/11/2015; 23:26 37.1 13.0 35.0 83.0 468.0 200.08 23/11/2015; 16:30 13.0 4.2 32.3 82.0 197.0 60.09 24/11/2015; 17:24 97.3 79.5 81.7 44.3 207.0 10.0
10 28/11/2015; 08:49 2.8 0.4 14.3 - - -11 10/12/2015; 13:05 8.4 1.6 19.0 95.2 168.0 15.012 03/01/2016; 06:04 66.3 32.7 49.3 75.5 1647.0 54.013 05/01/2016; 02:51 3.3 0.3 9.1 - - -14 06/01/2016; 05:45 24.6 12.9 52.4 51.3 57.0 5.015 07/01/2016; 19:36 9.9 6.4 64.6 36.6 369.0 3.016 12/01/2016; 19:02 6.1 1.1 18.0 - - -17 15/01/2016; 21:39 24.9 13.2 53.0 29.6 1447.0 24.018 11/02/2016; 08:01 23.4 4.1 17.5 79.7 18.0 42.019 12/02/2016; 06:25 18.8 11.1 59.0 27.6 58.0 102.020 12/02/2016; 23:22 74.9 56.0 74.8 22.5 8.0 5.021 18/02/2016; 05:26 45.2 30.4 67.3 33.6 55.0 39.022 20/02/2016; 12:15 4.6 0.9 19.6 - - -23 23/02/2016; 22:11 3.1 0.1 3.2 - - -24 26/02/2016; 03:52 10.9 4.6 42.2 73.6 13.0 42.025 01/03/2016; 00:00 4.1 0.7 17.1 - - -26 01/03/2016; 07:19 31.0 19.9 64.2 32.1 49.0 73.027 03/03/2016; 06:13 40.9 29.4 71.9 41.3 1280.0 154.028 07/03/2016; 06:13 7.4 2.1 28.4 - - -29 09/03/2016; 14:42 4.8 0.9 18.8 - - -30 12/03/2016; 06:27 6.1 1.6 26.2 - - -31 15/03/2016; 08:06 9.1 3.8 41.8 44.9 124.0 3.0
Water 2019, 11, 1378 10 of 17
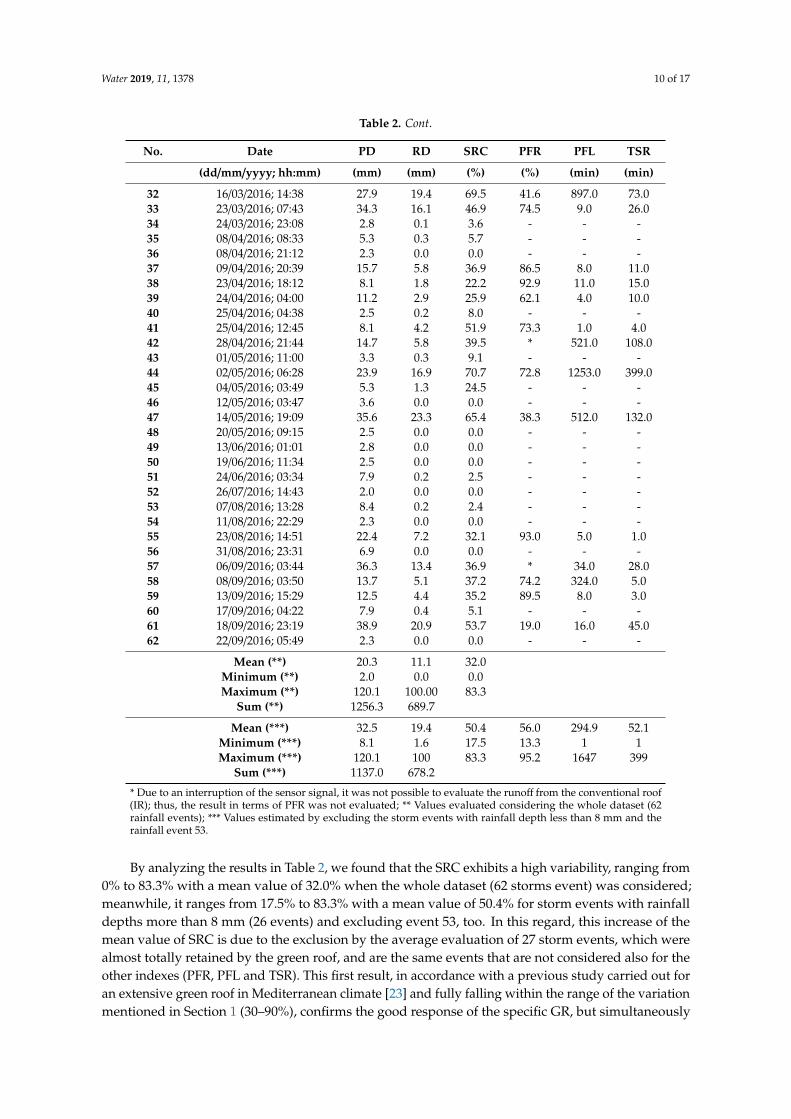
Table 2. Cont.
No. Date PD RD SRC PFR PFL TSR
(dd/mm/yyyy; hh:mm) (mm) (mm) (%) (%) (min) (min)
32 16/03/2016; 14:38 27.9 19.4 69.5 41.6 897.0 73.033 23/03/2016; 07:43 34.3 16.1 46.9 74.5 9.0 26.034 24/03/2016; 23:08 2.8 0.1 3.6 - - -35 08/04/2016; 08:33 5.3 0.3 5.7 - - -36 08/04/2016; 21:12 2.3 0.0 0.0 - - -37 09/04/2016; 20:39 15.7 5.8 36.9 86.5 8.0 11.038 23/04/2016; 18:12 8.1 1.8 22.2 92.9 11.0 15.039 24/04/2016; 04:00 11.2 2.9 25.9 62.1 4.0 10.040 25/04/2016; 04:38 2.5 0.2 8.0 - - -41 25/04/2016; 12:45 8.1 4.2 51.9 73.3 1.0 4.042 28/04/2016; 21:44 14.7 5.8 39.5 * 521.0 108.043 01/05/2016; 11:00 3.3 0.3 9.1 - - -44 02/05/2016; 06:28 23.9 16.9 70.7 72.8 1253.0 399.045 04/05/2016; 03:49 5.3 1.3 24.5 - - -46 12/05/2016; 03:47 3.6 0.0 0.0 - - -47 14/05/2016; 19:09 35.6 23.3 65.4 38.3 512.0 132.048 20/05/2016; 09:15 2.5 0.0 0.0 - - -49 13/06/2016; 01:01 2.8 0.0 0.0 - - -50 19/06/2016; 11:34 2.5 0.0 0.0 - - -51 24/06/2016; 03:34 7.9 0.2 2.5 - - -52 26/07/2016; 14:43 2.0 0.0 0.0 - - -53 07/08/2016; 13:28 8.4 0.2 2.4 - - -54 11/08/2016; 22:29 2.3 0.0 0.0 - - -55 23/08/2016; 14:51 22.4 7.2 32.1 93.0 5.0 1.056 31/08/2016; 23:31 6.9 0.0 0.0 - - -57 06/09/2016; 03:44 36.3 13.4 36.9 * 34.0 28.058 08/09/2016; 03:50 13.7 5.1 37.2 74.2 324.0 5.059 13/09/2016; 15:29 12.5 4.4 35.2 89.5 8.0 3.060 17/09/2016; 04:22 7.9 0.4 5.1 - - -61 18/09/2016; 23:19 38.9 20.9 53.7 19.0 16.0 45.062 22/09/2016; 05:49 2.3 0.0 0.0 - - -
Mean (**) 20.3 11.1 32.0Minimum (**) 2.0 0.0 0.0Maximum (**) 120.1 100.00 83.3
Sum (**) 1256.3 689.7
Mean (***) 32.5 19.4 50.4 56.0 294.9 52.1Minimum (***) 8.1 1.6 17.5 13.3 1 1Maximum (***) 120.1 100 83.3 95.2 1647 399
Sum (***) 1137.0 678.2
* Due to an interruption of the sensor signal, it was not possible to evaluate the runoff from the conventional roof(IR); thus, the result in terms of PFR was not evaluated; ** Values evaluated considering the whole dataset (62rainfall events); *** Values estimated by excluding the storm events with rainfall depth less than 8 mm and therainfall event 53.
By analyzing the results in Table 2, we found that the SRC exhibits a high variability, ranging from0% to 83.3% with a mean value of 32.0% when the whole dataset (62 storms event) was considered;meanwhile, it ranges from 17.5% to 83.3% with a mean value of 50.4% for storm events with rainfalldepths more than 8 mm (26 events) and excluding event 53, too. In this regard, this increase of themean value of SRC is due to the exclusion by the average evaluation of 27 storm events, which werealmost totally retained by the green roof, and are the same events that are not considered also for theother indexes (PFR, PFL and TSR). This first result, in accordance with a previous study carried out foran extensive green roof in Mediterranean climate [23] and fully falling within the range of the variationmentioned in Section 1 (30–90%), confirms the good response of the specific GR, but simultaneously
Water 2019, 11, 1378 11 of 17
highlights how the SRC index is strongly influenced by weather conditions. For example, by comparingtwo events with different rainfall depths, such as Event 9 (PD = 97.3 mm) and Event 18 (PD = 23.4mm), the SRC values were 81.7% and 17.5%, respectively. Two events with similar rainfall depths, suchas Event 7 (PD = 37.1 mm) and Event 27 (PD = 40.9 mm), produced SRC values of 35.0% and 71.9%,respectively. These differences in SRC given similar precipitation can be understood by observingthe antecedent dry weather period (ADWP) of the two events, which affects the initial soil moisturecondition and therefore the soil retention capacity. Event 7, with a retention of 65.0% (SRC = 35.0%),occurred after more than 20 continuous dry days, whereas when Event 27 happened, at the beginningof the event, the soil substrate had a reduced retention capacity due to the short ADWP (just over oneday); therefore, this results in a higher SRC than Event 7.
A similar conclusion can be reached by observing the other three indices (PFR, PFL, and TSR)in Table 2. We found that PFR, PFL, and TSR—with mean values of 56.0%, 294.9 min, and 52.1 min,respectively—were highly variable, and principally associated with the climate condition before thebeginning of the storm events, and therefore, with the initial humidity of the soil.
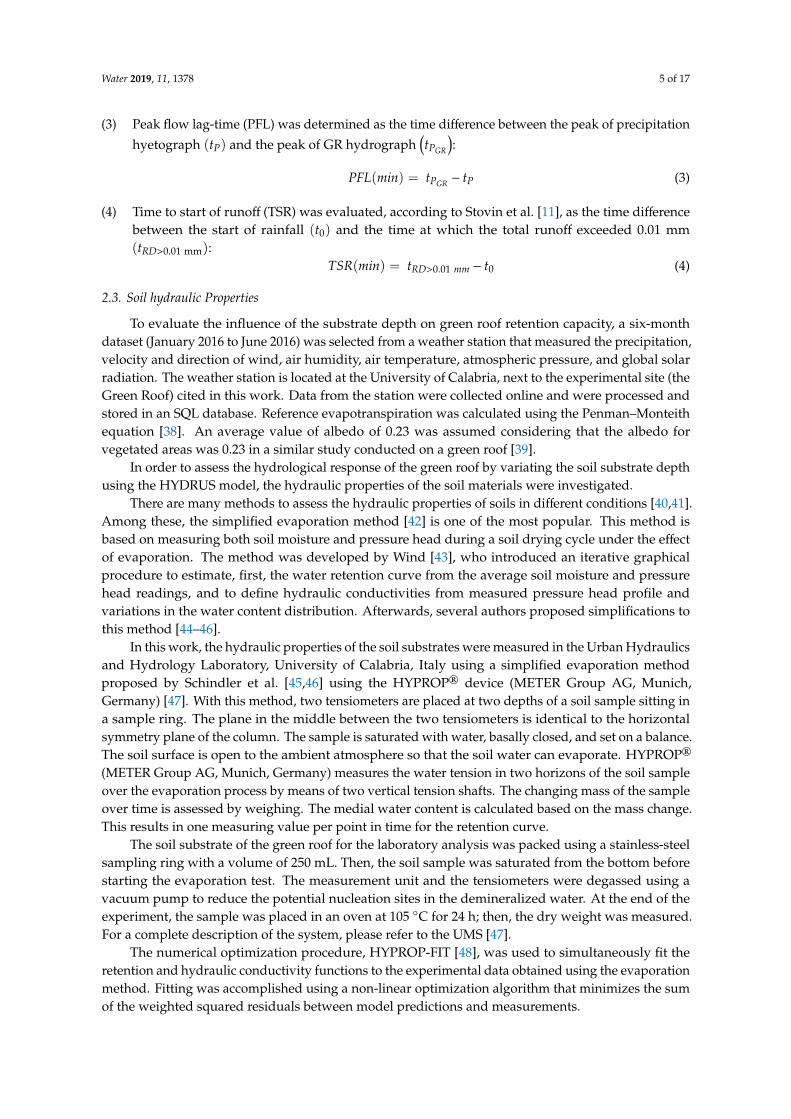
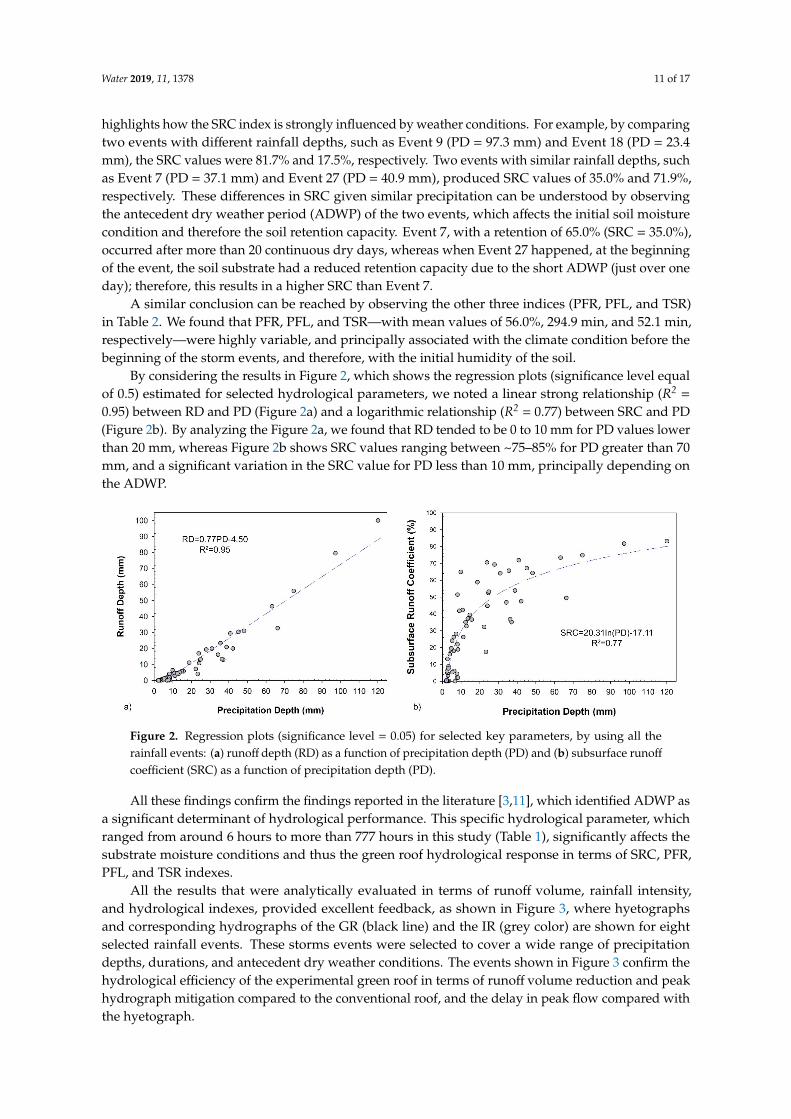
By considering the results in Figure 2, which shows the regression plots (significance level equalof 0.5) estimated for selected hydrological parameters, we noted a linear strong relationship (R2 =
0.95) between RD and PD (Figure 2a) and a logarithmic relationship (R2 = 0.77) between SRC and PD(Figure 2b). By analyzing the Figure 2a, we found that RD tended to be 0 to 10 mm for PD values lowerthan 20 mm, whereas Figure 2b shows SRC values ranging between ~75–85% for PD greater than 70mm, and a significant variation in the SRC value for PD less than 10 mm, principally depending onthe ADWP.
Water 2019, 11, x FOR PEER REVIEW 11 of 18
39 24/04/2016; 04:00 11.2 2.9 25.9 62.1 4.0 10.0 40 25/04/2016; 04:38 2.5 0.2 8.0 - - - 41 25/04/2016; 12:45 8.1 4.2 51.9 73.3 1.0 4.0 42 28/04/2016; 21:44 14.7 5.8 39.5 * 521.0 108.0 43 01/05/2016; 11:00 3.3 0.3 9.1 - - - 44 02/05/2016; 06:28 23.9 16.9 70.7 72.8 1253.0 399.0 45 04/05/2016; 03:49 5.3 1.3 24.5 - - - 46 12/05/2016; 03:47 3.6 0.0 0.0 - - - 47 14/05/2016; 19:09 35.6 23.3 65.4 38.3 512.0 132.0 48 20/05/2016; 09:15 2.5 0.0 0.0 - - - 49 13/06/2016; 01:01 2.8 0.0 0.0 - - - 50 19/06/2016; 11:34 2.5 0.0 0.0 - - - 51 24/06/2016; 03:34 7.9 0.2 2.5 - - - 52 26/07/2016; 14:43 2.0 0.0 0.0 - - - 53 07/08/2016; 13:28 8.4 0.2 2.4 - - - 54 11/08/2016; 22:29 2.3 0.0 0.0 - - - 55 23/08/2016; 14:51 22.4 7.2 32.1 93.0 5.0 1.0 56 31/08/2016; 23:31 6.9 0.0 0.0 - - - 57 06/09/2016; 03:44 36.3 13.4 36.9 * 34.0 28.0 58 08/09/2016; 03:50 13.7 5.1 37.2 74.2 324.0 5.0 59 13/09/2016; 15:29 12.5 4.4 35.2 89.5 8.0 3.0 60 17/09/2016; 04:22 7.9 0.4 5.1 - - - 61 18/09/2016; 23:19 38.9 20.9 53.7 19.0 16.0 45.0 62 22/09/2016; 05:49 2.3 0.0 0.0 - - -
Mean (**) 20.3 11.1 32.0 Minimum (**) 2.0 0.0 0.0 Maximum (**) 120.1 100.00 83.3 Sum (**) 1256.3 689.7
Mean (***) 32.5 19.4 50.4 56.0 294.9 52.1 Minimum (***) 8.1 1.6 17.5 13.3 1 1 Maximum (***) 120.1 100 83.3 95.2 1647 399 Sum (***) 1137.0 678.2 * Due to an interruption of the sensor signal, it was not possible to evaluate the runoff from the conventional roof (IR); thus, the result in terms of PFR was not evaluated; ** Values evaluated considering the whole dataset (62 rainfall events); *** Values estimated by excluding the storm events with rainfall depth less than 8 mm and the rainfall event 53.
Figure 2. Regression plots (significance level = 0.05) for selected key parameters, by using all the rainfall events: (a) runoff depth (RD) as a function of precipitation depth (PD) and (b) subsurface runoff coefficient (SRC) as a function of precipitation depth (PD).
Figure 2. Regression plots (significance level = 0.05) for selected key parameters, by using all therainfall events: (a) runoff depth (RD) as a function of precipitation depth (PD) and (b) subsurface runoff
coefficient (SRC) as a function of precipitation depth (PD).
All these findings confirm the findings reported in the literature [3,11], which identified ADWP asa significant determinant of hydrological performance. This specific hydrological parameter, whichranged from around 6 hours to more than 777 hours in this study (Table 1), significantly affects thesubstrate moisture conditions and thus the green roof hydrological response in terms of SRC, PFR,PFL, and TSR indexes.
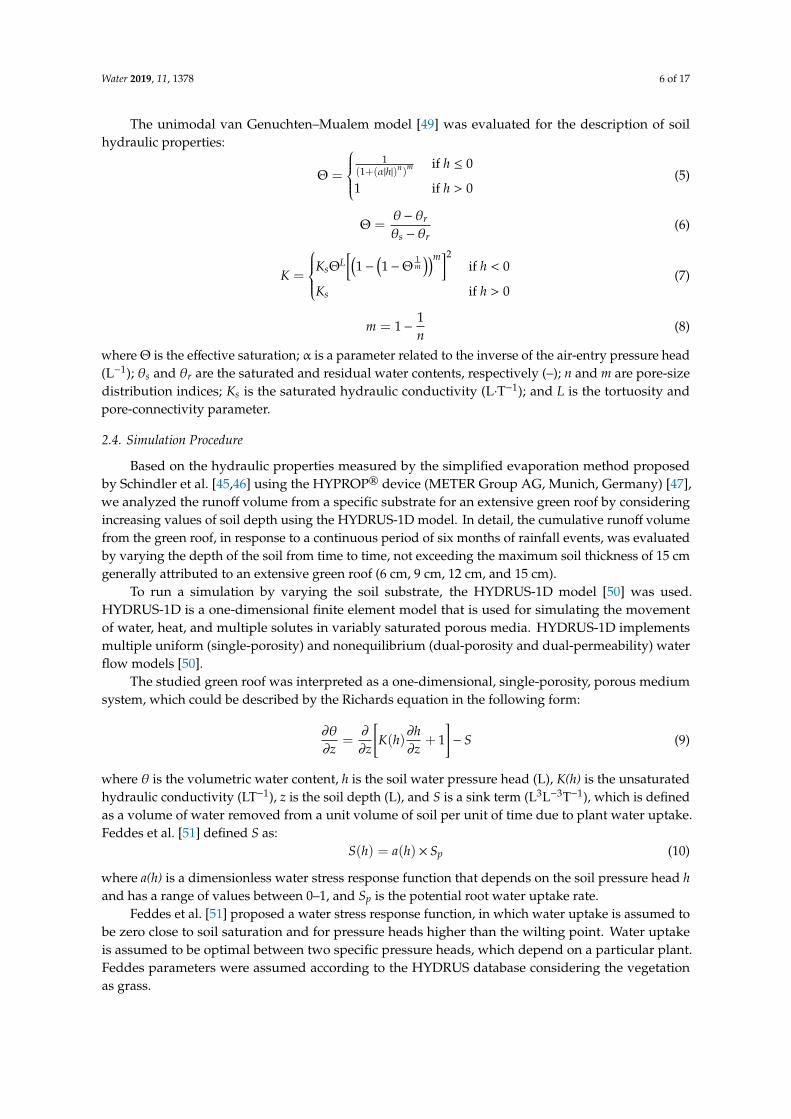
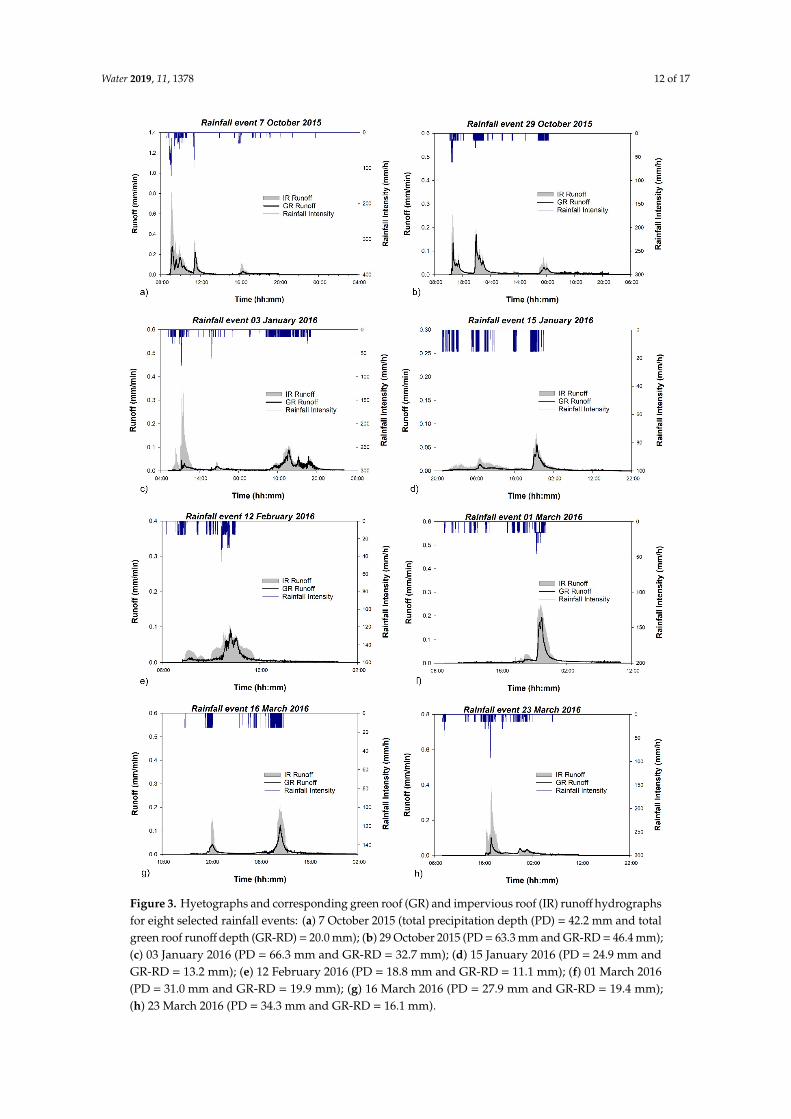
All the results that were analytically evaluated in terms of runoff volume, rainfall intensity,and hydrological indexes, provided excellent feedback, as shown in Figure 3, where hyetographsand corresponding hydrographs of the GR (black line) and the IR (grey color) are shown for eightselected rainfall events. These storms events were selected to cover a wide range of precipitationdepths, durations, and antecedent dry weather conditions. The events shown in Figure 3 confirm thehydrological efficiency of the experimental green roof in terms of runoff volume reduction and peakhydrograph mitigation compared to the conventional roof, and the delay in peak flow compared withthe hyetograph.
Water 2019, 11, 1378 12 of 17Water 2019, 11, x FOR PEER REVIEW 12 of 18
Figure 3. Hyetographs and corresponding green roof (GR) and impervious roof (IR) runoff hydrographs for eight selected rainfall events: (a) 7 October 2015 (total precipitation depth (PD) = 42.2 mm and total green roof runoff depth (GR-RD) = 20.0 mm); (b) 29 October 2015 (PD = 63.3 mm and GR-RD = 46.4 mm); (c) 03 January 2016 (PD = 66.3 mm and GR-RD = 32.7 mm); (d) 15 January 2016 (PD = 24.9 mm and GR-RD = 13.2 mm); (e) 12 February 2016 (PD = 18.8 mm and GR-RD = 11.1 mm); (f) 01 March 2016 (PD = 31.0 mm and GR-RD = 19.9 mm); (g) 16 March 2016 (PD = 27.9 mm and GR-RD = 19.4 mm); (h) 23 March 2016 (PD = 34.3 mm and GR-RD = 16.1 mm).
Figure 3. Hyetographs and corresponding green roof (GR) and impervious roof (IR) runoff hydrographsfor eight selected rainfall events: (a) 7 October 2015 (total precipitation depth (PD) = 42.2 mm and totalgreen roof runoff depth (GR-RD) = 20.0 mm); (b) 29 October 2015 (PD = 63.3 mm and GR-RD = 46.4 mm);(c) 03 January 2016 (PD = 66.3 mm and GR-RD = 32.7 mm); (d) 15 January 2016 (PD = 24.9 mm andGR-RD = 13.2 mm); (e) 12 February 2016 (PD = 18.8 mm and GR-RD = 11.1 mm); (f) 01 March 2016(PD = 31.0 mm and GR-RD = 19.9 mm); (g) 16 March 2016 (PD = 27.9 mm and GR-RD = 19.4 mm);(h) 23 March 2016 (PD = 34.3 mm and GR-RD = 16.1 mm).
Water 2019, 11, 1378 13 of 17
3.3. Soil Hydraulic Properties
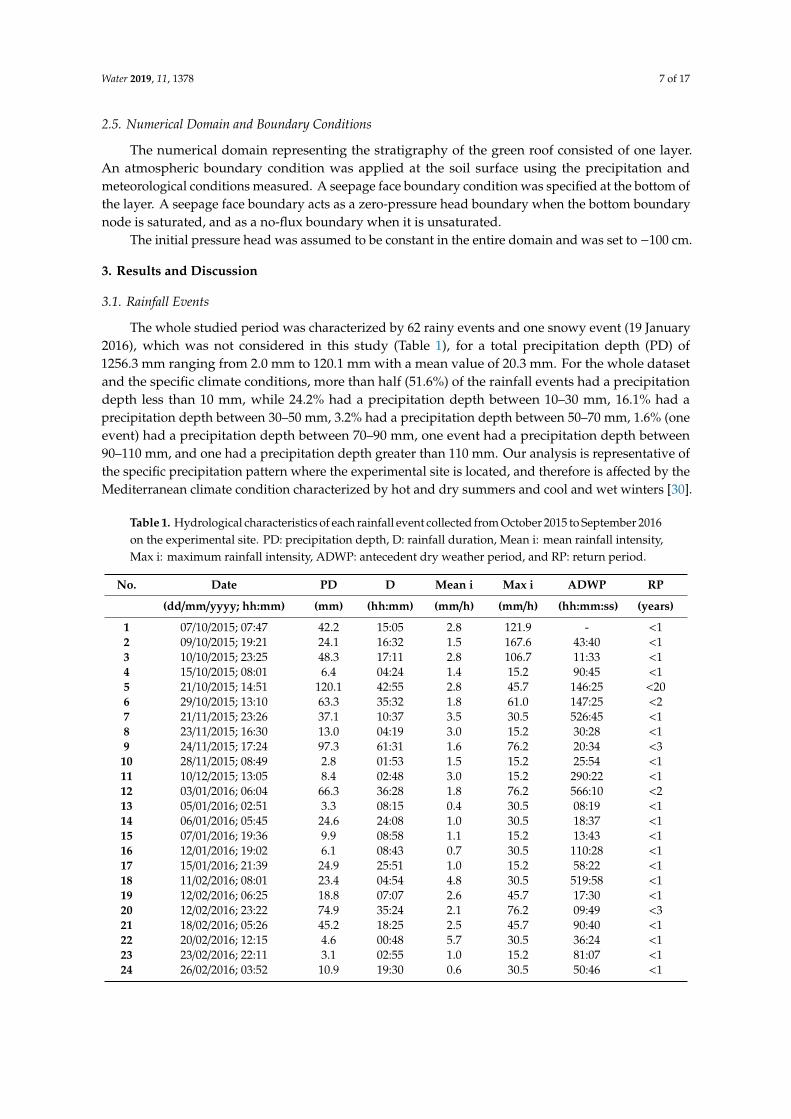
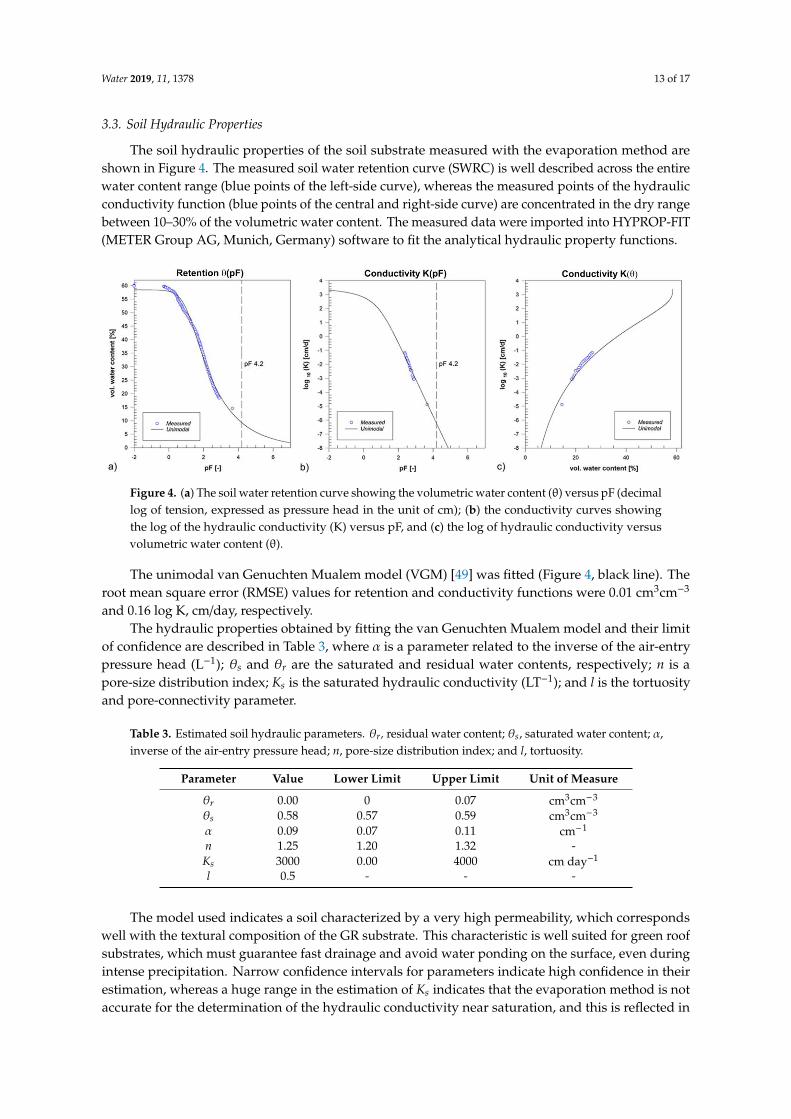
The soil hydraulic properties of the soil substrate measured with the evaporation method areshown in Figure 4. The measured soil water retention curve (SWRC) is well described across the entirewater content range (blue points of the left-side curve), whereas the measured points of the hydraulicconductivity function (blue points of the central and right-side curve) are concentrated in the dry rangebetween 10–30% of the volumetric water content. The measured data were imported into HYPROP-FIT(METER Group AG, Munich, Germany) software to fit the analytical hydraulic property functions.
Water 2019, 11, x FOR PEER REVIEW 15 of 20
3.3. Soil Hydraulic Properties
The soil hydraulic properties of the soil substrate measured with the evaporation method are
shown in Figure 4. The measured soil water retention curve (SWRC) is well described across the
entire water content range (blue points of the left-side curve), whereas the measured points of the
hydraulic conductivity function (blue points of the central and right-side curve) are concentrated in
the dry range between 10–30% of the volumetric water content. The measured data were imported
into HYPROP-FIT (METER Group AG, Munich, Germany) software to fit the analytical hydraulic
property functions.
The unimodal van Genuchten Mualem model (VGM) [49] was fitted (Figure 4, black line). The
root mean square error (RMSE) values for retention and conductivity functions were 0.01 cm3cm-3
and 0.16 log K, cm/day, respectively.
Figure 4. (a) The soil water retention curve showing the volumetric water content (θ) versus pF
(decimal log of tension, expressed as pressure head in the unit of cm); (b) the conductivity curves
showing the log of the hydraulic conductivity (K) versus pF, and (c) the log of hydraulic conductivity
versus volumetric water content (θ).
The hydraulic properties obtained by fitting the van Genuchten Mualem model and their limit
of confidence are described in Table 3, where α is a parameter related to the inverse of the air-entry
pressure head (L−1); θs and θr are the saturated and residual water contents, respectively; n is a pore-
size distribution index; Ks is the saturated hydraulic conductivity (LT−1); and l is the tortuosity and
pore-connectivity parameter.
Table 3. Estimated soil hydraulic parameters. θr, residual water content; θs, saturated water content;
α, inverse of the air-entry pressure head; n, pore-size distribution index; and l, tortuosity.
Parameter Value Lower Limit Upper Limit Unit of Measure
θr 0.00 0 0.07 cm3cm−3
θs 0.58 0.57 0.59 cm3cm−3
α 0.09 0.07 0.11 cm−1
n 1.25 1.20 1.32 -
Ks 3000 0.00 4000 cm day-1
l 0.5 - - -
The model used indicates a soil characterized by a very high permeability, which corresponds
well with the textural composition of the GR substrate. This characteristic is well suited for green roof
substrates, which must guarantee fast drainage and avoid water ponding on the surface, even during
intense precipitation. Narrow confidence intervals for parameters indicate high confidence in their
estimation, whereas a huge range in the estimation of Ks indicates that the evaporation method is not
accurate for the determination of the hydraulic conductivity near saturation, and this is reflected in
the estimation of Ks. To improve the accuracy in the estimation of the hydraulic conductivity near
Figure 4. (a) The soil water retention curve showing the volumetric water content (θ) versus pF (decimallog of tension, expressed as pressure head in the unit of cm); (b) the conductivity curves showingthe log of the hydraulic conductivity (K) versus pF, and (c) the log of hydraulic conductivity versusvolumetric water content (θ).
The unimodal van Genuchten Mualem model (VGM) [49] was fitted (Figure 4, black line). Theroot mean square error (RMSE) values for retention and conductivity functions were 0.01 cm3cm−3
and 0.16 log K, cm/day, respectively.The hydraulic properties obtained by fitting the van Genuchten Mualem model and their limit
of confidence are described in Table 3, where α is a parameter related to the inverse of the air-entrypressure head (L−1); θs and θr are the saturated and residual water contents, respectively; n is apore-size distribution index; Ks is the saturated hydraulic conductivity (LT−1); and l is the tortuosityand pore-connectivity parameter.
Table 3. Estimated soil hydraulic parameters. θr, residual water content; θs, saturated water content; α,inverse of the air-entry pressure head; n, pore-size distribution index; and l, tortuosity.
Parameter Value Lower Limit Upper Limit Unit of Measure
θr 0.00 0 0.07 cm3cm−3
θs 0.58 0.57 0.59 cm3cm−3
α 0.09 0.07 0.11 cm−1
n 1.25 1.20 1.32 -Ks 3000 0.00 4000 cm day−1
l 0.5 - - -
The model used indicates a soil characterized by a very high permeability, which correspondswell with the textural composition of the GR substrate. This characteristic is well suited for green roofsubstrates, which must guarantee fast drainage and avoid water ponding on the surface, even duringintense precipitation. Narrow confidence intervals for parameters indicate high confidence in theirestimation, whereas a huge range in the estimation of Ks indicates that the evaporation method is notaccurate for the determination of the hydraulic conductivity near saturation, and this is reflected in

Water 2019, 11, 1378 14 of 17
the estimation of Ks. To improve the accuracy in the estimation of the hydraulic conductivity nearsaturation, other methods and devices should be used such as Ksat [52] based on the Darcy experiment.
3.4. Green Roof Hydraulic Behavior for Different Soil Depths
As stated above, the hydraulic parameters of the soil substrate were used in HYDRUS-1D todescribe the hydrological behavior of the green roof with different soil depths.
Cumulative inflow and outflow fluxes of the green roof are reported in Figure 5. By increasing thesoil substrate depth, the green roof was able to reduce the total runoff volume from 22% to 24% inresponse to the same total precipitation during the considered period.
Water 2019, 11, x FOR PEER REVIEW 14 of 18
saturation, other methods and devices should be used such as Ksat [52] based on the Darcy experiment.
3.4. Green Roof Hydraulic Behavior for Different Soil Depths
As stated above, the hydraulic parameters of the soil substrate were used in HYDRUS-1D to describe the hydrological behavior of the green roof with different soil depths.
Cumulative inflow and outflow fluxes of the green roof are reported in Figure 5. By increasing the soil substrate depth, the green roof was able to reduce the total runoff volume from 22% to 24% in response to the same total precipitation during the considered period.
Figure 5. Cumulative rainfall and cumulative modeled runoff for different values of soil depth (H) by considering a six-month dataset (January–June 2016).
The steep gradients in the cumulative outflow indicate that the green roof responded quickly to precipitation. This aspect is directly related to the limited thickness of the substrate, which reduces the possible delay.
During simulations, mass balance errors were always below 1%, which is generally considered acceptable at these low levels.
As shown in Figure 5, the outflow volume reduction achieved by doubling the soil substrate depth under the same climate conditions was not significant. This result, which confirms the findings of Feitosa and Wilkinson [32], can be justified by observing that the six-month dataset used for these simulations was obtained in winter and spring, where evapotranspiration is not predominant. Based on these findings, since the adoption of a deeper soil depth does not contribute to a significant increase in the retention capacity, it would only represent a structural overloading, while a substrate depth of six centimeters would be an ideal soil depth for extensive green roofs.
4. Conclusions
Green roofs may be a solution for minimizing the impact of urbanization on the hydrologic cycle. Given the important role they play in the mitigation of urban flooding, several studies have focused on the analysis of their hydraulic behavior.
In this study, we conducted a field monitoring campaign for one year on a full-scale extensive green roof. We evaluated hydrological indices (subsurface runoff coefficient, peak flow reduction, peak flow lag-time, and time to start runoff) on an event scale, and we found possible correlations
Figure 5. Cumulative rainfall and cumulative modeled runoff for different values of soil depth (H) byconsidering a six-month dataset (January–June 2016).
The steep gradients in the cumulative outflow indicate that the green roof responded quickly toprecipitation. This aspect is directly related to the limited thickness of the substrate, which reduces thepossible delay.
During simulations, mass balance errors were always below 1%, which is generally consideredacceptable at these low levels.
As shown in Figure 5, the outflow volume reduction achieved by doubling the soil substratedepth under the same climate conditions was not significant. This result, which confirms the findingsof Feitosa and Wilkinson [32], can be justified by observing that the six-month dataset used for thesesimulations was obtained in winter and spring, where evapotranspiration is not predominant. Basedon these findings, since the adoption of a deeper soil depth does not contribute to a significant increasein the retention capacity, it would only represent a structural overloading, while a substrate depth ofsix centimeters would be an ideal soil depth for extensive green roofs.
4. Conclusions
Green roofs may be a solution for minimizing the impact of urbanization on the hydrologic cycle.Given the important role they play in the mitigation of urban flooding, several studies have focused onthe analysis of their hydraulic behavior.
In this study, we conducted a field monitoring campaign for one year on a full-scale extensivegreen roof. We evaluated hydrological indices (subsurface runoff coefficient, peak flow reduction, peak
Water 2019, 11, 1378 15 of 17
flow lag-time, and time to start runoff) on an event scale, and we found possible correlations betweenthese indicators and hydrological features of storm events. The findings showed that the subsurfacerunoff coefficient (SRC) ranges from 17.5% to 83.3% with an average value of 50.4% for the rainfallevents with a precipitation depth more than 8 mm (35 rainfall events) and by excluding Event 53,which presents an average value of 32.0% for the whole dataset (62 rainfall events). This result, whichis evaluated by considering an event scale analysis, falls in the range (around 30–90%) evaluated inliterature [30] under different climate conditions and temporally scales. In addition, as the subsurfacerunoff coefficient is an extremely useful index to quantify the hydraulic efficiency of a green roof, thisfinding confirms the optimal retention capacity of the experimental green roof in the Mediterraneanclimate. Therefore, the average value of the subsurface runoff that was obtained in this study for thespecific green roof can be taken into account during preliminary design choices for the construction ofgreen roofs in Mediterranean climate conditions.
Finally, to evaluate the influence of soil thickness on the hydraulic behavior of a green roof, theHYDRUS 1D model was used to consider green roofs with soil depths of 6 cm, 9 cm, 12 cm, and 15 cm.The results obtained in this phase show how the considered substrate depths for green roofs were ableto achieve a runoff volume reduction of 22% to 24% during the selected period for the Mediterraneanclimate conditions without observing flow over the top surface of the soil. These findings are inaccordance with the literature [32], which may be explained by the dataset used in these simulationsbeing obtained during winter and spring where evapotranspiration, one of the key factors reducingstorm water in the hydrological cycle, was not predominant. Thus, in the field of extensive green roofs,as the outflow volume reduction achieved by increasing the soil depth was not significant, the idealdepth for soil substrate would be six centimeters.
Finally, since the outflow volume reduction achieved by doubling the soil substrate depth underthe same climate conditions is not significant, the maximum depth of 15 cm is not recommended foradoption considering the structural overloading.
Author Contributions: The authors contributions in the realization of the paper have been as follows.Conceptualization, S.A.P., M.T., F.P, and P.P.; methodology, S.A.P. and M.T.; data curation, S.A.P., M.T., and F.P.;formal analysis, S.A.P. and M.T.; investigation, S.A.P. and M.T.; writing—original draft preparation, S.A.P., M.T.and F.P.; writing—review, S.A.P. and M.T.; editing, S.A.P., M.T, and F.P.; supervision: P.P.
Funding: The study was co-funded by the Italian National Operative Project (PON) PON01_02543 “Integratedand sustainable management service for the water–energy cycle in urban drainage systems”, Research andCompetitiveness for the convergence regions 2007/2013, I Axis “Support to structural changes” operative objective4.1.1.1. “Scientific-technological generators of transformation processes of the productive system and creation ofnew sectors” Action II: “Interventions to support industrial research”.
Acknowledgments: We acknowledge the support by the Italian National Operative Project (PON) PON01_02543“Integrated and sustainable management service for the water–energy cycle in urban drainage systems”, Researchand Competitiveness for the convergence regions 2007/2013, I Axis “Support to structural changes” operativeobjective 4.1.1.1. “Scientific-technological generators of transformation processes of the productive system andcreation of new sectors” Action II: “Interventions to support industrial research”.
Conflicts of Interest: The authors declare no conflict of interest.
References
1. Starzec, M.; Dziopak, J.; Słys, D.; Pochwat, K.; Kordana, S. Dimensioning of Required Volumes ofInterconnected Detention Tanks Taking into Account the Direction and Speed of Rain Movement. Water2018, 10, 1826. [CrossRef]
2. Kordana, S. The identification of key factors determining the sustainability of stormwater systems. E3S WebConf. 2018, 45, 00033. [CrossRef]
3. Piro, P.; Turco, M.; Palermo, S.A.; Principato, F.; Brunetti, G. A Comprehensive Approach to StormwaterManagement Problems in the Next Generation Drainage Networks. In The Internet of Things for SmartUrban Ecosystems. Internet of Things (Technology, Communications and Computing); Cicirelli, F., Guerrieri, A.,Mastroianni, C., Spezzano, G., Vinci, A., Eds.; Springer: Cham, Switzerland, 2019. [CrossRef]
Water 2019, 11, 1378 16 of 17
4. Pumo, D.; Arnone, E.; Francipane, A.; Caracciolo, D.; Noto, L.V. Potential implications of climate 363 changeand urbanization on watershed hydrology. J. Hydrol. 2017, 554, 80–99. [CrossRef]
5. Palermo, S.A.; Zischg, J.; Sitzenfrei, R.; Rauch, W.; Piro, P. Parameter Sensitivity of a Microscale HydrodynamicModel. In New Trends in Urban Drainage Modelling. UDM 2018; Green Energy and Technology; Mannina, G.,Ed.; Springer: Cham, Switzerland, 2019; pp. 982–987.
6. Bhaskar, A.S.; Hogan, D.M.; Archfield, S.A. Urban base flow with low impact development. Hydrol. Process.2016, 30, 3156–3171. [CrossRef]
7. Brunetti, G.; Šimunek, J.; Turco, M.; Piro, P. On the use of global sensitivity analysis for the numerical analysisof permeable pavements. Urban Water J. 2018, 15, 269–275. [CrossRef]
8. Turco, M.; Brunetti, G.; Carbone, M.; Piro, P. Modelling the hydraulic behaviour of permeable pavementsthrough a reservoir element model. Int. Multidiscip. Sci. GeoConf. SGEM 2018, 18, 507–514. [CrossRef]
9. Wang, X.; Tian, Y.; Zhao, X. The influence of dual-substrate-layer extensive green roofs on rainwater runoff
quantity and quality. Sci. Total Environ. 2017, 592, 465–476. [CrossRef] [PubMed]10. Voyde, E.; Fassman, E.; Simcock, R. Hydrology of an extensive living roof under sub-tropical climate
conditions in Auckland, New Zealand. J. Hydrol. 2010, 394, 384–395. [CrossRef]11. Stovin, V.; Vesuviano, G.; Kasmin, H. The hydrological performance of a green roof test bed under UK
climatic conditions. J. Hydrol. 2012, 414, 148–161. [CrossRef]12. Vijayaraghavan, K. Green roofs: A critical review on the role of components, benefits, limitations and trends.
Renew. Sustain. Energy Rev. 2016, 57, 740–752. [CrossRef]13. Peczkowski, G.; Kowalczyk, T.; Szawernoga, K.; Orzepowski, W.; Zmuda, R.; Pokładek, R. Hydrological
Performance and Runoff Water Quality of Experimental Green Roofs. Water 2018, 10, 1185. [CrossRef]14. Bevilacqua, P.; Mazzeo, D.; Arcuri, N. Thermal inertia assessment of an experimental extensive green roof in
summer conditions. Build. Environ. 2018, 131, 264–276. [CrossRef]15. Santamouris, M. Cooling the cities–a review of reflective and green roof mitigation technologies to fight heat
island and improve comfort in urban environments. Solar Energy 2014, 103, 682–703. [CrossRef]16. Rowe, D.B. Green roofs as a means of pollution abatement. Environ. Pollut. 2011, 159, 2100–2110. [CrossRef]
[PubMed]17. Yang, H.S.; Kang, J.; Choi, M.S. Acoustic effects of green roof systems on a low-profiled structure at street
level. Build. Environ. 2012, 50, 44–55. [CrossRef]18. Buccola, N.; Spolek, G. A pilot-scale evaluation of green roof runoff retention, detention, and quality.
Water Air Soil Pollut. 2011, 216, 83–92. [CrossRef]19. Krebs, G.; Kuoppamäki, K.; Kokkonen, T.; Koivusalo, H. Simulation of green roof test bed runoff.
Hydrol. Process. 2016, 30, 250–262. [CrossRef]20. Carson, T.B.; Marasco, D.E.; Culligan, P.J.; McGillis, W.R. Hydrological performance of extensive green roofs
in New York City: Observations and multi-year modeling of three full-scale systems. Environ. Res. Lett.2013, 8, 024036. [CrossRef]
21. Fassman-Beck, E.; Voyde, E.; Simcock, R.; Hong, Y.S. 4 Living roofs in 3 locations: Does configuration affectrunoff mitigation? J. Hydrol. 2013, 490, 11–20. [CrossRef]
22. Peng, Z.; Stovin, V. Independent validation of the SWMM green roof module. J. Hydrol. Eng. 2017, 22,04017037. [CrossRef]
23. Cipolla, S.S.; Maglionico, M.; Stojkov, I. A long-term hydrological modelling of an extensive green roof bymeans of SWMM. Ecol. Eng. 2016, 95, 876–887. [CrossRef]
24. Principato, F.; Ferrante, A.P.; Frega, F.; Bartolo, M.; Piro, P. Mitigation of Urban Surface Runoff through LIDSolutions: Case Study in Mediterranean Area. In New Trends in Urban Drainage Modelling. UDM 2018; GreenEnergy and Technology; Mannina, G., Ed.; Springer: Cham, Switzerland, 2019; pp. 665–670.
25. Metselaar, K. Water retention and evapotranspiration of green roofs and possible natural vegetation types.Resour. Conserv. Recycl. 2012, 64, 49–55. [CrossRef]
26. Palla, A.; Gnecco, I.; Lanza, L.G. Compared performance of a conceptual and a mechanistic hydrologicmodels of a green roof. Hydrol. Process. 2012, 26, 73. [CrossRef]
27. Brunetti, G.; Šimunek, J.; Piro, P. A Comprehensive Analysis of the Variably Saturated 461 Hydraulic Behaviorof a Green Roof in a Mediterranean Climate. Vadose Zone J. 2016, 15. [CrossRef]
28. Hilten, R.N.; Lawrence, T.M.; Tollner, E.W. Modeling stormwater runoff from green roofs with HYDRUS-1D.J. Hydrol. 2008, 358, 288–293. [CrossRef]
Water 2019, 11, 1378 17 of 17
29. Li, Y.; Babcock, R.W., Jr. Modeling hydrologic performance of a green roof system with HYDRUS-2D.J. Environ. Eng. 2015, 141, 04015036. [CrossRef]
30. Garofalo, G.; Palermo, S.; Principato, F.; Theodosiou, T.; Piro, P. The influence of hydrologic parameters onthe hydraulic efficiency of an extensive green roof in mediterranean area. Water 2016, 8, 44. [CrossRef]
31. Liu, R.; Fassman-Beck, E. Hydrologic response of engineered media in living roofs and bioretention to largerainfalls: Experiments and modeling. Hydrol. Process. 2017, 31, 556–572. [CrossRef]
32. Feitosa, R.C.; Wilkinson, S. Modelling green roof stormwater response for different soil depths. Landsc. UrbanPlan. 2016, 153, 170–179. [CrossRef]
33. Soulis, K.X.; Ntoulas, N.; Nektarios, P.A.; Kargas, G. Runoff reduction from extensive green roofs havingdifferent substrate depth and plant cover. Ecol. Eng. 2017, 102, 80–89. [CrossRef]
34. Piro, P.; Carbone, M.; Morimanno, F.; Palermo, S.A. Simple flowmeter device for LID systems: Fromlaboratory procedure to full-scale implementation. Flow Meas. Instrum. 2019, 65, 240–249. [CrossRef]
35. Getter, K.L.; Rowe, D.B.; Andresen, J.A. Quantifying the effect of slope on extensive green roof stormwaterretention. Ecol. Eng. 2007, 31, 225–231. [CrossRef]
36. Shiau, J.T. Return period of bivariate distributed extreme hydrological events. Stoch. Environ. Res. Risk Assess.2003, 17, 42–57. [CrossRef]
37. Arpacal. 2019. Available online: http://www.cfd.calabria.it/index.php/dati-stazioni/dati-storici (accessed on24 January 2019).
38. Allen, R.G.; Pereira, L.S.; Raes, D.; Smith, M. FAO Irrigation and Drainage Paper No. 56: Crop Evapotranspiration;FAO: Rome, Italy, 1998.
39. Lazzarin, R.M.; Castellotti, F.; Busato, F. Experimental measurements and numerical modelling of a greenroof. Energy Build. 2005, 37, 1260–1267. [CrossRef]
40. Arya, L.M. Wind and hot-air methods. In Methods of Soil Analysis; Part 4. Physical Methods; Dane, J.H.,Topp, G.C., Eds.; SSSA: Madison, WI, USA, 2002; pp. 916–926.
41. Dane, J.H.; Hopmans, J.W. Pressure plate extractor. In Methods of Soil Analysis; Part 4. Physical Methods;Dane, J.H., Topp, G.C., Eds.; SSSA: Madison, WI, USA, 2002; pp. 688–690.
42. Schindler, U. Ein Schnellverfahren zur Messung der Wasserleitfähigkeit im teilgesättigten Boden anStechzylinderproben. Arch. Für Acker-Und Pflanzenbau Und Bodenkd. 1980, 24, 1–7.
43. Wind, G.P. Capillary conductivity data estimated by a simple method. Available online: https://library.wur.nl/WebQuery/wurpubs/fulltext/350954 (accessed on 3 July 2019).
44. Peters, A.; Durner, W. Simplified evaporation method for determining soil hydraulic properties. J. Hydrol.2008, 356, 147–162. [CrossRef]
45. Schindler, U.; Durner, W.; von Unold, G.; Mueller, L.; Wieland, R. The evaporation method: Extending themeasurement range of soil hydraulic properties using the air-entry pressure of the ceramic cup. J. Plant Nutr.Soil Sci. 2010, 173, 563–572. [CrossRef]
46. Schindler, U.; Durner, W.; von Unold, G.; Muller, L. Evaporation Method for Measuring UnsaturatedHydraulic Properties of Soils: Extending the Measurement Range. Soil Sci. Soc. Am. J. 2010, 74, 1071–1083.[CrossRef]
47. UMS GmbH. UMS (2015): Manual HYPROP, Version 2015-01; UMS GmbH: München, Germany, 8137;Volume 37.
48. Pertassek, T.; Peters, A.; Durner, W. HYPROP-FIT Software User’s Manual, V.3.0; UMS GmbH: München,Germany, 2015.
49. Van Genuchten, M.T. A closed-form equation for predicting the hydraulic conductivity of unsaturated soils1. Soil Sci. Soc. Am. J. 1980, 44, 892–898. [CrossRef]
50. Šimunek, J.; van Genuchten, M.T.; Šejna, M. Recent Developments and Applications of the HYDRUSComputer Software Packages. Vadose Zone J. 2016, 15. [CrossRef]
51. Feddes, R.A.; Kowalik, P.J.; Zaradny, H. Simulation of Field Water Use and Crop Yield; PUDOC: Wageningen,The Netherlands, 1978.
52. UMS GmbH. KSAT: Operation Manual; Umwelt Monitoring System; GmbH: Munich, Germany, 2012.
© 2019 by the authors. Licensee MDPI, Basel, Switzerland. This article is an open accessarticle distributed under the terms and conditions of the Creative Commons Attribution(CC BY) license (http://creativecommons.org/licenses/by/4.0/).