Embed Size (px)
Citation preview
The Economic Impact of the Columbia Metropolitan Airport
A Statewide and Regional Analysis
Developed by: Division of Research
Moore School of Business University of South Carolina
September 2015
2
Study Prepared By:
Dr. Joseph C. Von Nessen Research Economist, Division of Research
Prepared for the Columbia Metropolitan Airport (CAE)
3
Executive Summary The Columbia Metropolitan Airport (CAE) is a significant generator of economic activity in South Carolina – and in the Midlands region in particular. Specifically, the CAE and its business tenants support a large workforce and a high volume of expenditure activity that generates considerable positive economic ripple effects across many industries statewide. In addition, the CAE induces further economic activity through attracting thousands of out-‐of-‐state visitors every year. These visitors spend part of their income on local goods and services, thereby increasing local demand. The CAE also serves as a critically important competitive advantage for the ongoing economic development of the Midlands region. In general, there is a strong link between the health of any local economy and access to commercial aviation facilities. Airports provide a means to transport both people and goods regionally, nationally, and internationally as part of an increasingly global economy. By increasing the accessibility of a local region, commercial aviation facilities – and the CAE in particular -‐ enable existing businesses to expand their reach and influence and provide additional opportunities for new businesses looking to expand and take advantage of local resources. The purpose of this study is to specifically document the economic impact of the CAE on the Columbia Metropolitan Statistical Area (MSA) and on South Carolina as a whole. This will include estimates of all impacts resulting from the activities of the CAE business tenants as well as all out-‐of-‐state visitor spending that takes place as the result of visitor traffic that flows through the CAE. In addition, this study will provide estimates documenting the increases in state tax revenue that result from this total volume of economic activity. The key findings of this study are as follows:
• The total annual economic impact resulting from all business activities associated with the CAE and its tenants on the state of South Carolina is estimated to be approximately $847 million. This figure reflects the dollar value of all final goods and services produced in South Carolina can than be attributed (either directly or indirectly) to CAE business tenants. This impact corresponds to 4,118 jobs and $179 million in labor income for South Carolinians that would not exist otherwise.
• About 95 percent of this economic impact occurs within the Columbia MSA. This corresponds to approximately $832 million in total economic output, 3,911 jobs, and $170 million in labor income.
4
• The CAE serves over one million passengers each year, over half of which are visitors to South Carolina. These visitors increase local economic activity by spending money within the state at a variety of local businesses, which provides an additional $364 million in economic activity to South Carolina. This economic activity supports approximately 2,868 jobs and $107 million in labor income.
• The total economic impact that comes about through all activities
associated with the CAE yields a statewide employment multiplier of 2.2. For every 10 jobs that are directly supported by the CAE and its business tenants, an additional 12 jobs are created elsewhere in the South Carolina economy.
• The CAE contributes approximately $1.2 billion to South Carolina’s annual
gross state product. This implies that the CAE generates economic activity that produces approximately $27 million in annual tax revenue for the state.
5
Table of Contents EXECUTIVE SUMMARY ......................................................................................................................... 3 SECTION I – INTRODUCTION .............................................................................................................. 6 SECTION II – ECONOMIC IMPACT METHODOLOGY ..................................................................... 8
Table 1 – Total Annual CAE Direct Business Activity and Passenger Traffic ........................... 10 SECTION III – ECONOMIC IMPACT OF THE COLUMBIA METROPOLITAN AIRPORT ....... 10 CAE BUSINESS TENANTS ....................................................................................................................................... 11 Table 2 – Economic Impact of the CAE on South Carolina ............................................................... 11 Table 3 – Economic Impact of the CAE on the Columbia MSA ....................................................... 12
VISITOR SPENDING .................................................................................................................................................. 13 Table 4 – Economic Impact of CAE Visitor Spending on South Carolina ................................... 13 Table 5 – Economic Impact of CAE Visitor Spending on the Columbia MSA ............................ 14
TOTAL IMPACT ......................................................................................................................................................... 15 Figure 1 – Total Economic Impact of the CAE on South Carolina (Employment) ................. 15 Figure 2 – Total Economic Impact of the CAE on South Carolina (Economic Output) ....... 15 Figure 3 – Total Economic Impact of the CAE on South Carolina (Labor Income) ............... 16
SECTION IV – CONTRIBUTIONS TO STATE TAX REVENUE ..................................................... 17 Table 6 – State Tax Revenue Derived from the CAE ............................................................................ 17
SECTION V – CONCLUSION ................................................................................................................ 17 APPENDIX I ............................................................................................................................................ 19
6
Section I – Introduction The United States has the largest aviation system in the world with over 3,300
airports designated as part of the national airport system. It is comprised of
approximately 2,800 general aviation and 540 commercial service airports,
including the Columbia Metropolitan Airport (CAE).
Airports play a key role in transporting people and goods regionally, nationally, and
internationally as part of the larger global economy. Airports also act as a vital
linkage between many of the nation’s different transportation modes. While state
and local governments typically own and operate most airports, the federal
government also plays an important role in managing and regulating air traffic.
Airports not only have an essential role in the transportation of time-‐sensitive
cargo, they are also significant generators of economic activity. Passenger activity
has been shown to be a powerful predictor for population and employment growth
even when controlling for other factors shaping economic growth.1 This growth is
usually concentrated in knowledge and service-‐based businesses rather than
industrial manufacturing.2
In addition to on-‐airport activity and air transportation, airports also contribute to
their local economies through visitor spending at off-‐airport locations. According to
a 2012 national study from the Airports Council International, the nation’s nearly
500 commercial airports supported over 10.5 million jobs, created an annual payroll
of $365 billion, and produced an annual output of $1.2 trillion.3
The CAE was founded in 1940 as the Lexington County Airport and was used by the
U.S. military during World War II as the Columbia Army Airbase. The present
1 Green, Richard K., “Airports and Economic Development.” Real Estate Economics, Vol. 35 (1), Spring 2007. 2 Brueckner, Jan K., “Airline Traffic and Urban Economic Development.” Urban Studies, July 2003. 3 “The Economic Impacts of Commercial Airports in 2010,” published by the Airports Council International – North America, January 2012.
7
terminal was opened in 1965 with major renovations completed in 1997. The
airport currently operates as a hub for United Parcel Services (UPS) Airlines in
addition to traditional domestic passenger flights.
The airport covers about 2,600 acres and operates two runways. Annually, the
airport serves over 1 million passengers and 168,000 tons of air cargo. Five airlines
(Delta, Piedmont/US Airways, United Express, American Eagle, and Continental)
account for the majority of passengers with Delta Airlines representing about 43
percent of all passengers in calendar year 2014.4
The purpose of this study is to specifically estimate the economic impact of the CAE
on the three-‐county Columbia metropolitan region as well as on the state of South
Carolina as a whole. This impact will be measured through estimates of job and
income creation, the overall contribution to economic activity, and all state tax
revenue that arises from all business activities associated directly with the CAE as
well as all business tenants of the CAE. In addition, this study will examine the
economic impacts associated with increases in visitor spending that can be directly
attributed to the presence of the airport.
This study begins with a discussion of the economic impact methodology used,
including a description of direct, indirect, and induced impacts. Section III then
presents the statewide impact estimates of the CAE as well as the local estimates for
the Columbia metropolitan region. Next, Section IV documents the annual tax
revenue that accrues to the state of South Carolina as a result of all economic
activities generated through the CAE. Finally, Section V concludes with a brief
summary of all results.
4 Source: https://www.columbiaairport.com/
8
Section II – Economic Impact Methodology The economic impact of any organization or firm can be measured by how
expenditures of that business or organization increase the demand for various
goods and services in the local region over what it would have been otherwise. In a
standard economic impact analysis, there are three types of economic impacts that
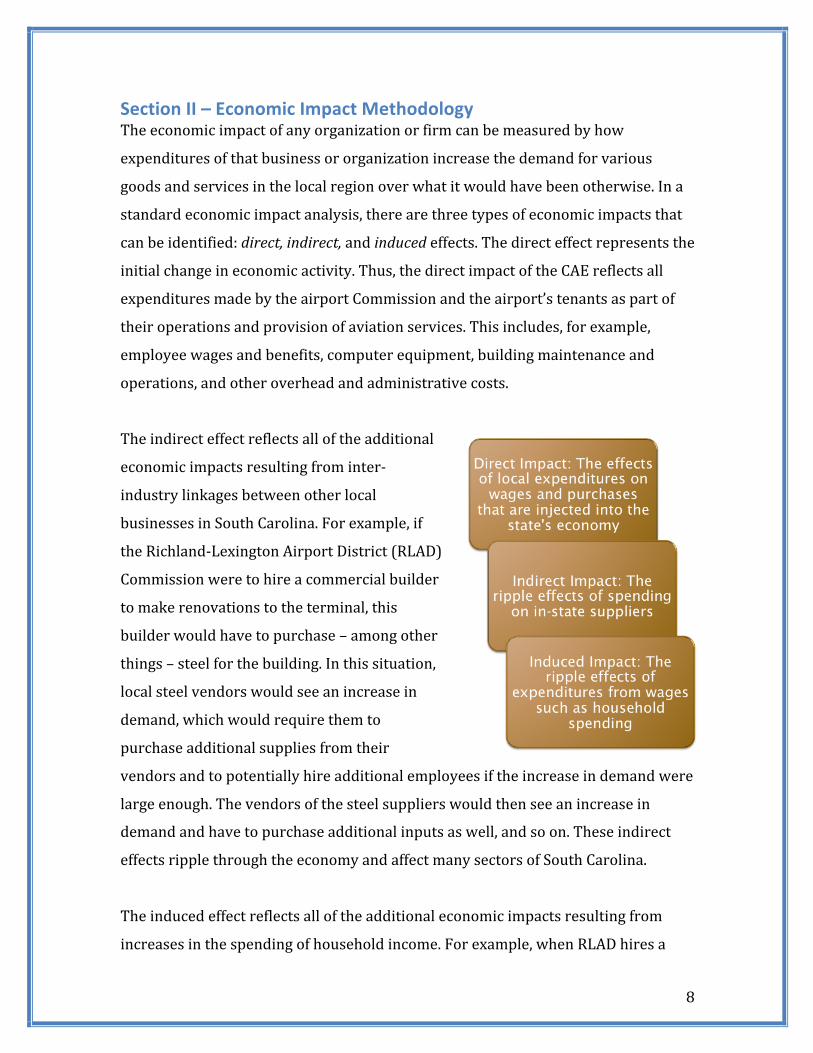
can be identified: direct, indirect, and induced effects. The direct effect represents the
initial change in economic activity. Thus, the direct impact of the CAE reflects all
expenditures made by the airport Commission and the airport’s tenants as part of
their operations and provision of aviation services. This includes, for example,
employee wages and benefits, computer equipment, building maintenance and
operations, and other overhead and administrative costs.
The indirect effect reflects all of the additional
economic impacts resulting from inter-‐
industry linkages between other local
businesses in South Carolina. For example, if
the Richland-‐Lexington Airport District (RLAD)
Commission were to hire a commercial builder
to make renovations to the terminal, this
builder would have to purchase – among other
things – steel for the building. In this situation,
local steel vendors would see an increase in
demand, which would require them to
purchase additional supplies from their
vendors and to potentially hire additional employees if the increase in demand were
large enough. The vendors of the steel suppliers would then see an increase in
demand and have to purchase additional inputs as well, and so on. These indirect
effects ripple through the economy and affect many sectors of South Carolina.
The induced effect reflects all of the additional economic impacts resulting from
increases in the spending of household income. For example, when RLAD hires a
9
commercial builder and the demand for this builder rises, some of the builder’s staff
will see a rise in their income levels. Part of this income will then be spent locally on,
for example, food, entertainment, or housing. These industries will then also see an
increase in demand for their goods and services, which will lead to higher income
levels of some of their employees, part of which will also be spent locally. An
increase in visitor spending that occurs as a result of the presence of the CAE also
constitutes a separate set of induced impacts. Visitor spending activity is simply a
form of household spending that occurs as a result of people traveling through
South Carolina.
These successive rounds of indirect and induced spending do not go on forever,
which is why a specific value can be calculated for each of them. In each round,
money is “leaked out” for a variety of reasons. For example, employees will save
some of their additional income and part of the money they do spend will go to
businesses located outside of South Carolina. In order to determine the total
economic impact, economic multipliers are used. An economic multiplier can be
used to determine what the total economic impact is (direct, indirect, and induced)
from an initial change in economic activity (the direct impact). For example, if
$1,000 was spent by RLAD on terminal renovation materials and this expenditure
ultimately resulted in a total increase of $1,500 in South Carolina economic activity,
then the economic output multiplier would be 1.5. Multipliers are different in each
sector of the economy and are largely determined by the size of the local supplier
network. Multipliers also depend on the region being analyzed. For example, a
$1,000 purchase on terminal renovation materials would have a larger impact on
South Carolina than on Richland County alone.
Multipliers are available to calculate more than just the indirect and induced
impacts on overall economic activity. Multipliers also exist to determine the total
impact in terms of employment and labor income. To estimate the impact of the CAE
on the state of South Carolina, the Division of Research used a detailed structural
model (known as an input-‐output model) of the South Carolina economy containing
10
specific information on economic linkages between different industries. This study
also utilized the input-‐output modeling software IMPLAN in calculating estimates.
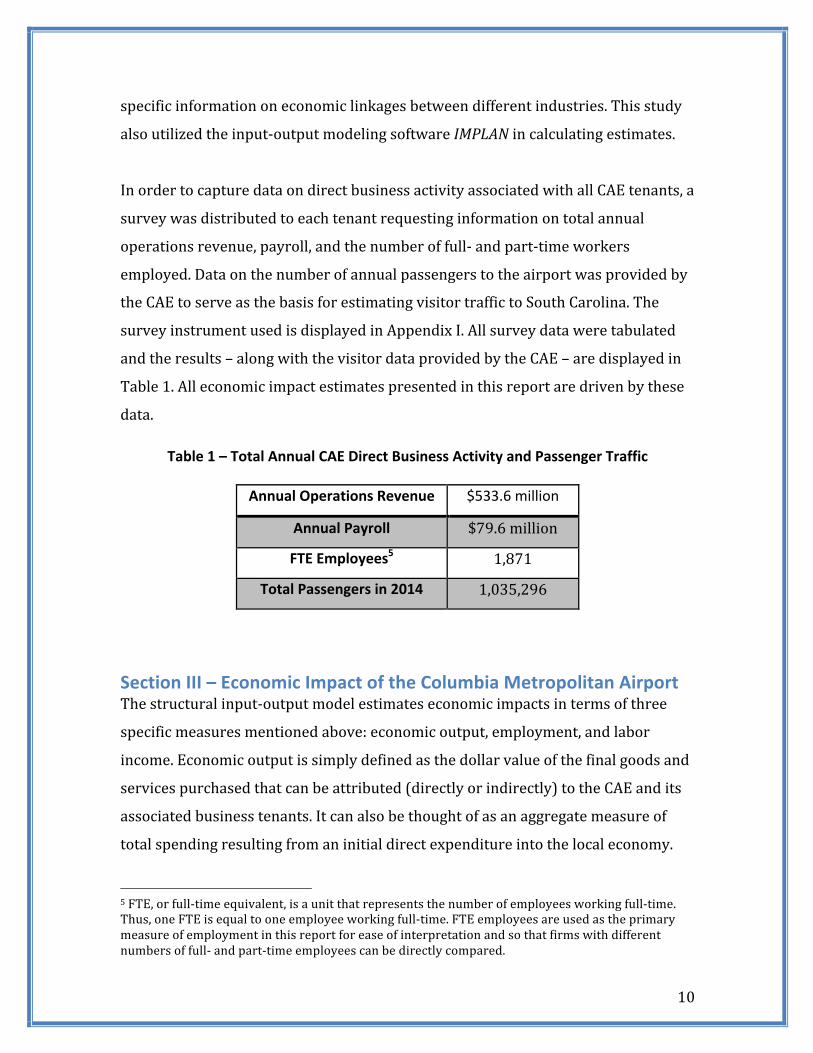
In order to capture data on direct business activity associated with all CAE tenants, a
survey was distributed to each tenant requesting information on total annual
operations revenue, payroll, and the number of full-‐ and part-‐time workers
employed. Data on the number of annual passengers to the airport was provided by
the CAE to serve as the basis for estimating visitor traffic to South Carolina. The
survey instrument used is displayed in Appendix I. All survey data were tabulated
and the results – along with the visitor data provided by the CAE – are displayed in
Table 1. All economic impact estimates presented in this report are driven by these
data.
Table 1 – Total Annual CAE Direct Business Activity and Passenger Traffic
Annual Operations Revenue $533.6 million
Annual Payroll $79.6 million
FTE Employees5 1,871
Total Passengers in 2014 1,035,296
Section III – Economic Impact of the Columbia Metropolitan Airport The structural input-‐output model estimates economic impacts in terms of three
specific measures mentioned above: economic output, employment, and labor
income. Economic output is simply defined as the dollar value of the final goods and
services purchased that can be attributed (directly or indirectly) to the CAE and its
associated business tenants. It can also be thought of as an aggregate measure of
total spending resulting from an initial direct expenditure into the local economy.
5 FTE, or full-‐time equivalent, is a unit that represents the number of employees working full-‐time. Thus, one FTE is equal to one employee working full-‐time. FTE employees are used as the primary measure of employment in this report for ease of interpretation and so that firms with different numbers of full-‐ and part-‐time employees can be directly compared.
11
Because it includes all spending by consumers and businesses on both goods and
services, it is an all-‐inclusive measure of the impact on total economic activity.
Employment reflects the number of jobs that are associated with the total economic
output estimate and is measured in terms of the total number of full-‐time equivalent
positions. Labor income represents total employee compensation, including wages,
salaries, and benefits.
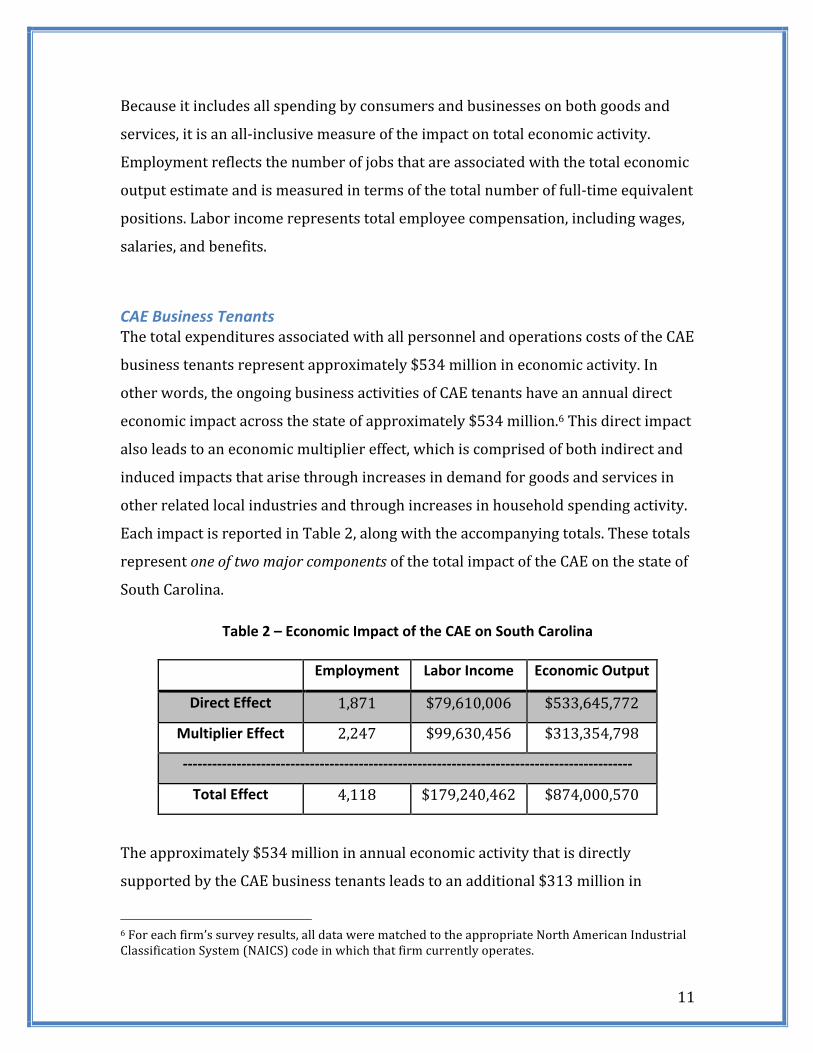
CAE Business Tenants The total expenditures associated with all personnel and operations costs of the CAE
business tenants represent approximately $534 million in economic activity. In
other words, the ongoing business activities of CAE tenants have an annual direct
economic impact across the state of approximately $534 million.6 This direct impact
also leads to an economic multiplier effect, which is comprised of both indirect and
induced impacts that arise through increases in demand for goods and services in
other related local industries and through increases in household spending activity.
Each impact is reported in Table 2, along with the accompanying totals. These totals
represent one of two major components of the total impact of the CAE on the state of
South Carolina.
Table 2 – Economic Impact of the CAE on South Carolina
Employment Labor Income Economic Output
Direct Effect 1,871 $79,610,006 $533,645,772
Multiplier Effect 2,247 $99,630,456 $313,354,798
-‐-‐-‐-‐-‐-‐-‐-‐-‐-‐-‐-‐-‐-‐-‐-‐-‐-‐-‐-‐-‐-‐-‐-‐-‐-‐-‐-‐-‐-‐-‐-‐-‐-‐-‐-‐-‐-‐-‐-‐-‐-‐-‐-‐-‐-‐-‐-‐-‐-‐-‐-‐-‐-‐-‐-‐-‐-‐-‐-‐-‐-‐-‐-‐-‐-‐-‐-‐-‐-‐-‐-‐-‐-‐-‐-‐-‐-‐-‐-‐-‐-‐-‐-‐-‐-‐-‐-‐-‐-‐-‐-‐
Total Effect 4,118 $179,240,462 $874,000,570
The approximately $534 million in annual economic activity that is directly
supported by the CAE business tenants leads to an additional $313 million in
6 For each firm’s survey results, all data were matched to the appropriate North American Industrial Classification System (NAICS) code in which that firm currently operates.
12
economic multiplier effects. This is the result of increased demand for goods and
services of local suppliers and additional household spending that results from the
$534 million in procurement activity by the CAE business tenants.
The combination of the direct and multiplier effect leads to a total impact of $874
million on the state of South Carolina. This economic activity is associated with
4,118 jobs and $179 million in labor income. The employment multiplier associated
with these estimates is 2.2, implying that for every 10 jobs directly created by the
CAE business tenants, an additional 12 jobs are created elsewhere in South Carolina.
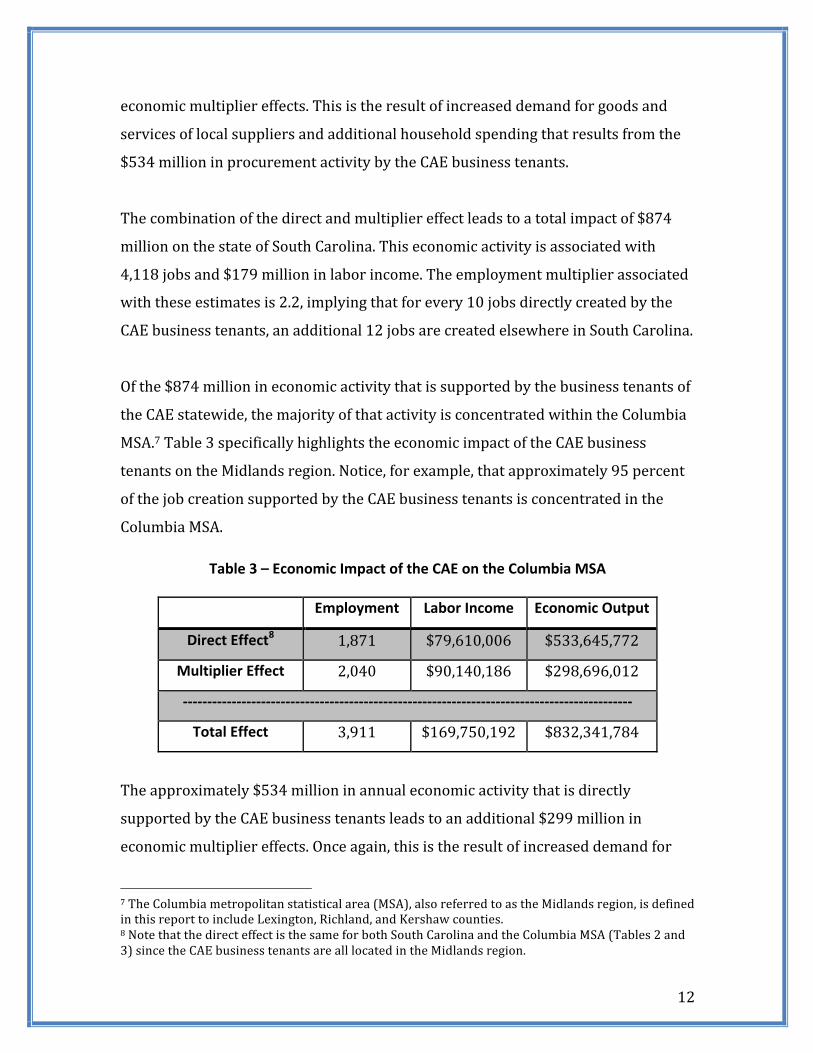
Of the $874 million in economic activity that is supported by the business tenants of
the CAE statewide, the majority of that activity is concentrated within the Columbia
MSA.7 Table 3 specifically highlights the economic impact of the CAE business
tenants on the Midlands region. Notice, for example, that approximately 95 percent
of the job creation supported by the CAE business tenants is concentrated in the
Columbia MSA.
Table 3 – Economic Impact of the CAE on the Columbia MSA
Employment Labor Income Economic Output
Direct Effect8 1,871 $79,610,006 $533,645,772
Multiplier Effect 2,040 $90,140,186 $298,696,012
-‐-‐-‐-‐-‐-‐-‐-‐-‐-‐-‐-‐-‐-‐-‐-‐-‐-‐-‐-‐-‐-‐-‐-‐-‐-‐-‐-‐-‐-‐-‐-‐-‐-‐-‐-‐-‐-‐-‐-‐-‐-‐-‐-‐-‐-‐-‐-‐-‐-‐-‐-‐-‐-‐-‐-‐-‐-‐-‐-‐-‐-‐-‐-‐-‐-‐-‐-‐-‐-‐-‐-‐-‐-‐-‐-‐-‐-‐-‐-‐-‐-‐-‐-‐-‐-‐-‐-‐-‐-‐-‐-‐
Total Effect 3,911 $169,750,192 $832,341,784
The approximately $534 million in annual economic activity that is directly
supported by the CAE business tenants leads to an additional $299 million in
economic multiplier effects. Once again, this is the result of increased demand for
7 The Columbia metropolitan statistical area (MSA), also referred to as the Midlands region, is defined in this report to include Lexington, Richland, and Kershaw counties. 8 Note that the direct effect is the same for both South Carolina and the Columbia MSA (Tables 2 and 3) since the CAE business tenants are all located in the Midlands region.
13
goods and services of local suppliers and additional household spending that results
from the $534 million in procurement activity by the CAE business tenants.
Visitor Spending The second major component of the total economic impact of the CAE on the state of
South Carolina comes about from visitor spending activity. The CAE serves over one
million passengers annually, and as Table 1 shows, served approximately 1,035,296
during the 2014 calendar year. A significant number of these passengers are visitors
to South Carolina who spend time and money in the local economy. This spending
activity introduces new demand to a variety of industries – from hotels and
restaurants to transportation and recreational activities.
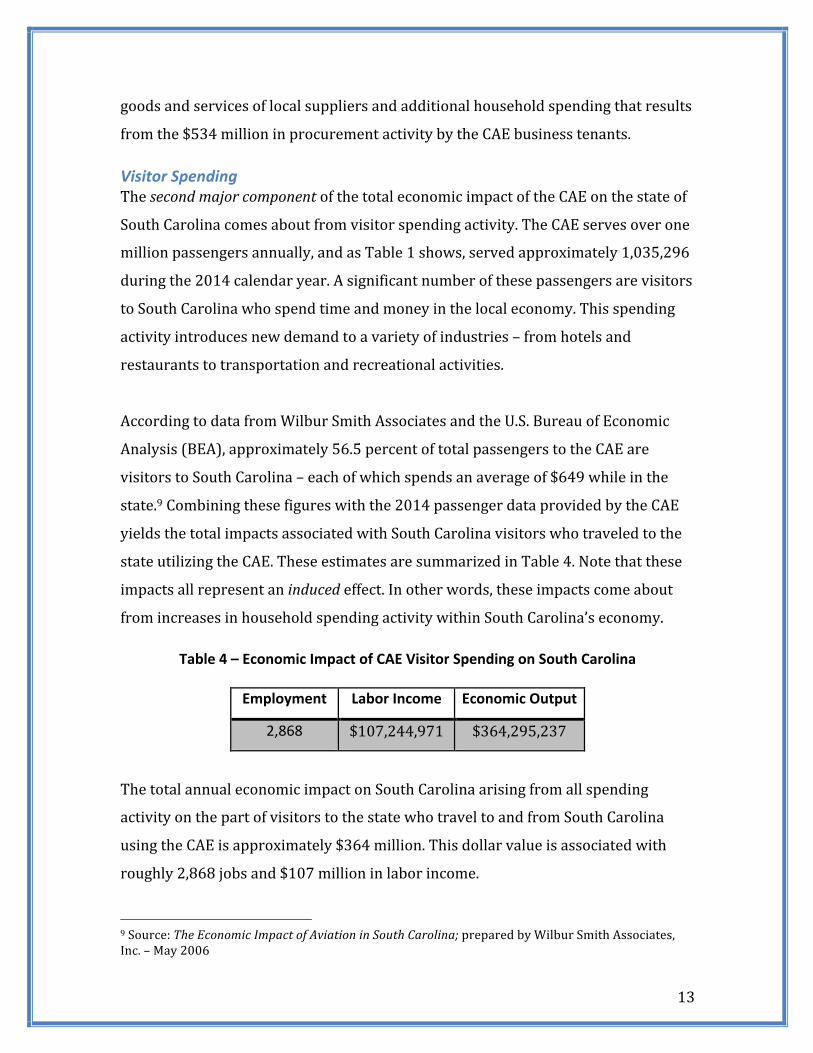
According to data from Wilbur Smith Associates and the U.S. Bureau of Economic
Analysis (BEA), approximately 56.5 percent of total passengers to the CAE are
visitors to South Carolina – each of which spends an average of $649 while in the
state.9 Combining these figures with the 2014 passenger data provided by the CAE
yields the total impacts associated with South Carolina visitors who traveled to the
state utilizing the CAE. These estimates are summarized in Table 4. Note that these
impacts all represent an induced effect. In other words, these impacts come about
from increases in household spending activity within South Carolina’s economy.
Table 4 – Economic Impact of CAE Visitor Spending on South Carolina
Employment Labor Income Economic Output
2,868 $107,244,971 $364,295,237
The total annual economic impact on South Carolina arising from all spending
activity on the part of visitors to the state who travel to and from South Carolina
using the CAE is approximately $364 million. This dollar value is associated with
roughly 2,868 jobs and $107 million in labor income.
9 Source: The Economic Impact of Aviation in South Carolina; prepared by Wilbur Smith Associates, Inc. – May 2006
14
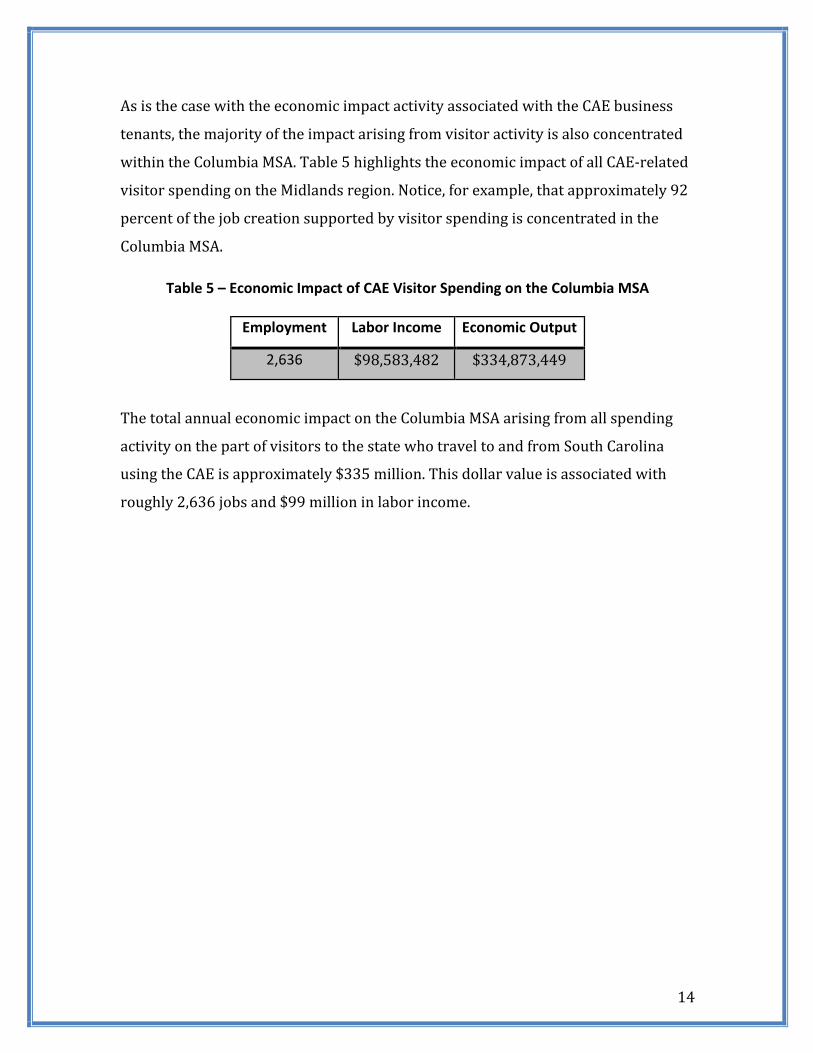
As is the case with the economic impact activity associated with the CAE business
tenants, the majority of the impact arising from visitor activity is also concentrated
within the Columbia MSA. Table 5 highlights the economic impact of all CAE-‐related
visitor spending on the Midlands region. Notice, for example, that approximately 92
percent of the job creation supported by visitor spending is concentrated in the
Columbia MSA.
Table 5 – Economic Impact of CAE Visitor Spending on the Columbia MSA
Employment Labor Income Economic Output
2,636 $98,583,482 $334,873,449
The total annual economic impact on the Columbia MSA arising from all spending
activity on the part of visitors to the state who travel to and from South Carolina
using the CAE is approximately $335 million. This dollar value is associated with
roughly 2,636 jobs and $99 million in labor income.
15
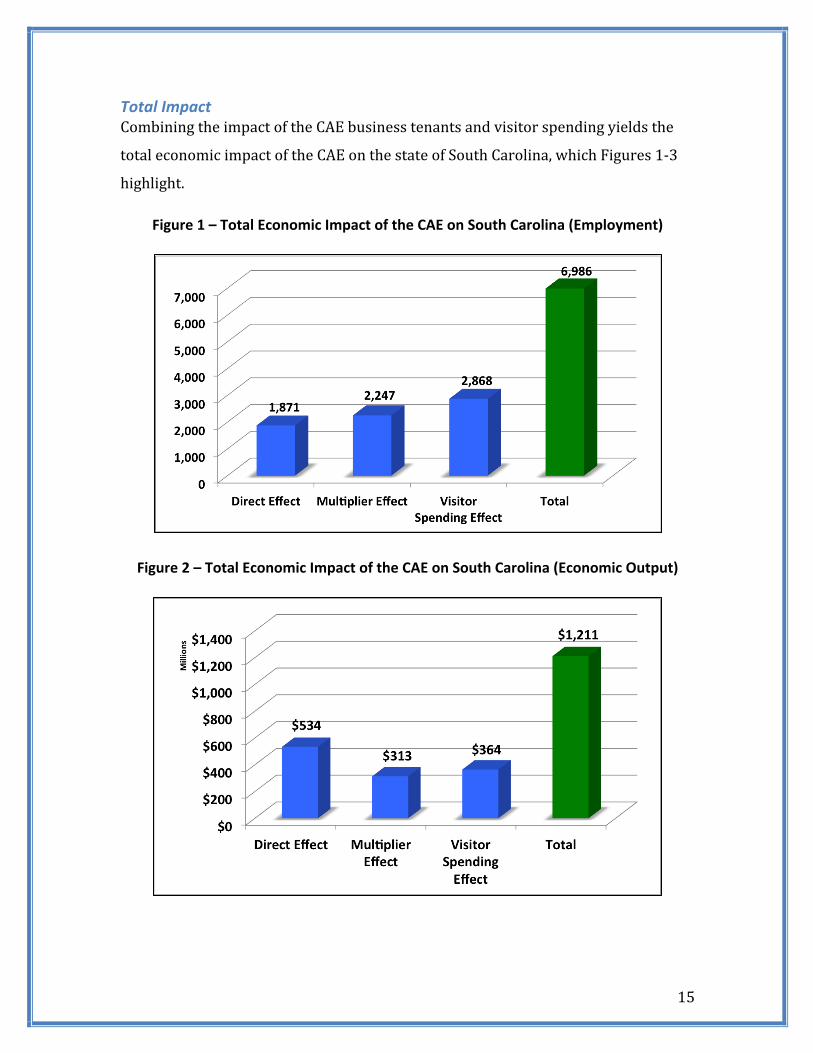
Total Impact Combining the impact of the CAE business tenants and visitor spending yields the
total economic impact of the CAE on the state of South Carolina, which Figures 1-‐3
highlight.
Figure 1 – Total Economic Impact of the CAE on South Carolina (Employment)
Figure 2 – Total Economic Impact of the CAE on South Carolina (Economic Output)
16
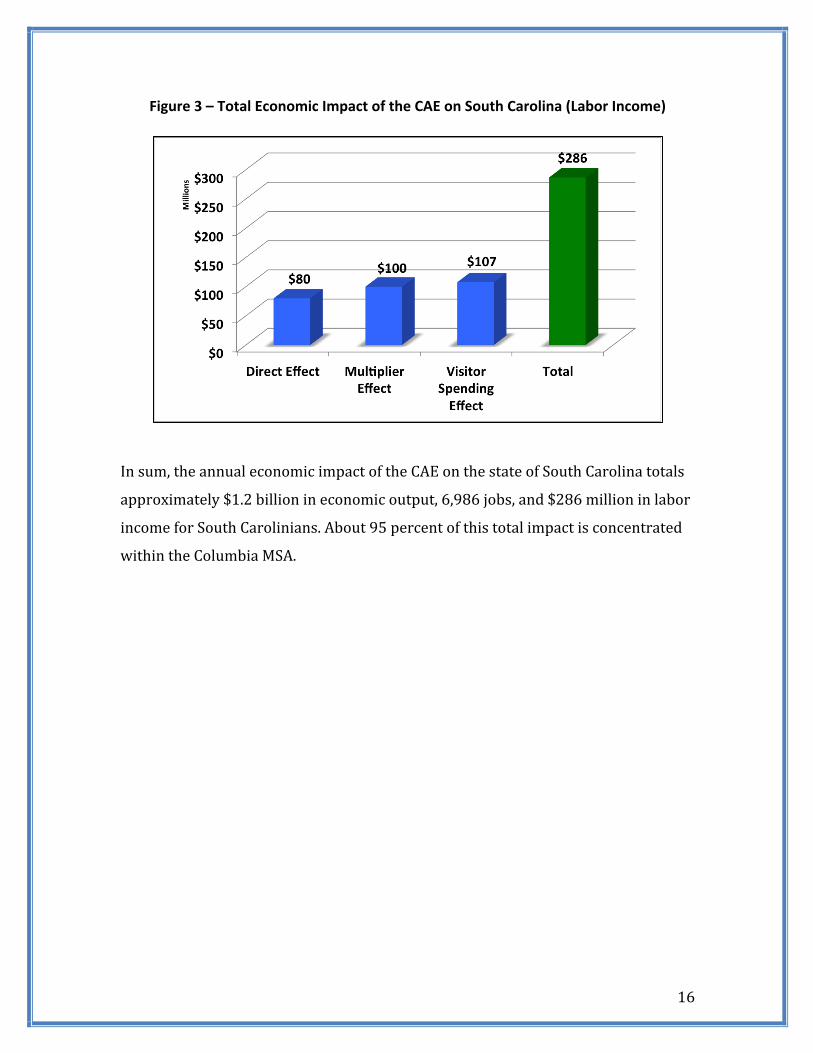
Figure 3 – Total Economic Impact of the CAE on South Carolina (Labor Income)
In sum, the annual economic impact of the CAE on the state of South Carolina totals
approximately $1.2 billion in economic output, 6,986 jobs, and $286 million in labor
income for South Carolinians. About 95 percent of this total impact is concentrated
within the Columbia MSA.
17
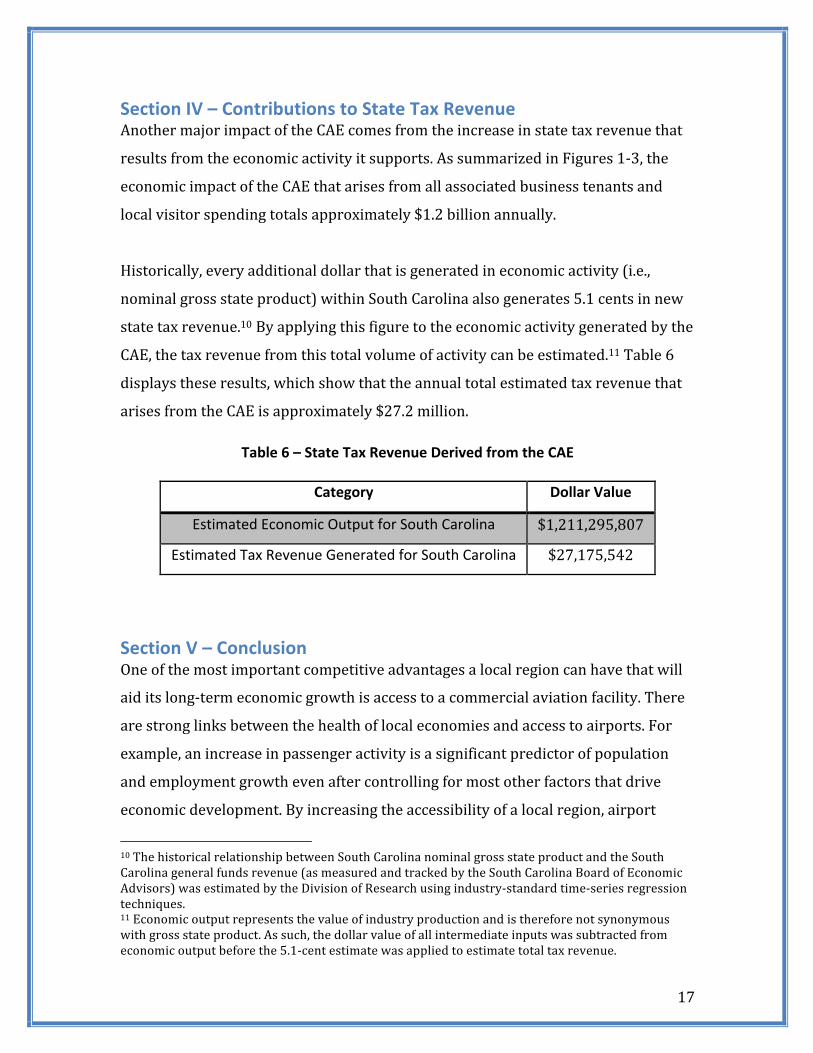
Section IV – Contributions to State Tax Revenue Another major impact of the CAE comes from the increase in state tax revenue that
results from the economic activity it supports. As summarized in Figures 1-‐3, the
economic impact of the CAE that arises from all associated business tenants and
local visitor spending totals approximately $1.2 billion annually.
Historically, every additional dollar that is generated in economic activity (i.e.,
nominal gross state product) within South Carolina also generates 5.1 cents in new
state tax revenue.10 By applying this figure to the economic activity generated by the
CAE, the tax revenue from this total volume of activity can be estimated.11 Table 6
displays these results, which show that the annual total estimated tax revenue that
arises from the CAE is approximately $27.2 million.
Table 6 – State Tax Revenue Derived from the CAE
Category Dollar Value
Estimated Economic Output for South Carolina $1,211,295,807
Estimated Tax Revenue Generated for South Carolina $27,175,542
Section V – Conclusion One of the most important competitive advantages a local region can have that will
aid its long-‐term economic growth is access to a commercial aviation facility. There
are strong links between the health of local economies and access to airports. For
example, an increase in passenger activity is a significant predictor of population
and employment growth even after controlling for most other factors that drive
economic development. By increasing the accessibility of a local region, airport
10 The historical relationship between South Carolina nominal gross state product and the South Carolina general funds revenue (as measured and tracked by the South Carolina Board of Economic Advisors) was estimated by the Division of Research using industry-‐standard time-‐series regression techniques. 11 Economic output represents the value of industry production and is therefore not synonymous with gross state product. As such, the dollar value of all intermediate inputs was subtracted from economic output before the 5.1-‐cent estimate was applied to estimate total tax revenue.
18
facilities enable business to expand their reach and influence and provide
opportunities for new businesses looking to expand and take advantage of local
resources.
This study documents the total statewide economic impact of the Columbia
Metropolitan Airport (CAE), which includes the impacts of all CAE business tenants
as well as the visitor spending activity that occurs as the result of the passenger
traffic that the CAE facilitates. In sum, this study estimates that the total economic
impact resulting from both of these sets of activities is approximately $1.2 billion on
the state of South Carolina. This dollar value represents all final goods and services
produced in South Carolina that can be attributed (directly or indirectly) to the CAE.
This impact corresponds to 6,986 jobs and $286 million in labor income for South
Carolinians that would not exist otherwise. Of this $1.2 billion, approximately 95
percent is concentrated within the Midlands region. This $1.2 billion also generates
approximately $27 million in new tax revenue for the state of South Carolina.
The economic benefits of the CAE are clear. The business activities supported by the
CAE not only supports a large workforce and a high volume of expenditure activity
that generates considerable positive economic ripple effects across many industries,
but also serves out-‐of-‐state visitors who then introduce new spending activity to the
state and thus further stimulates local industries.
South Carolina’s economy has become much more globally based since the Great
Recession, with economic growth being largely driven by export-‐oriented industries
such as automotive and aerospace. As the state continues to enhance its reputation
and presence on the international stage, the importance of commercial aviation
facilities will only increase going forward and serve a critical function in facilitating
economic development efforts across South Carolina for the foreseeable future.
19
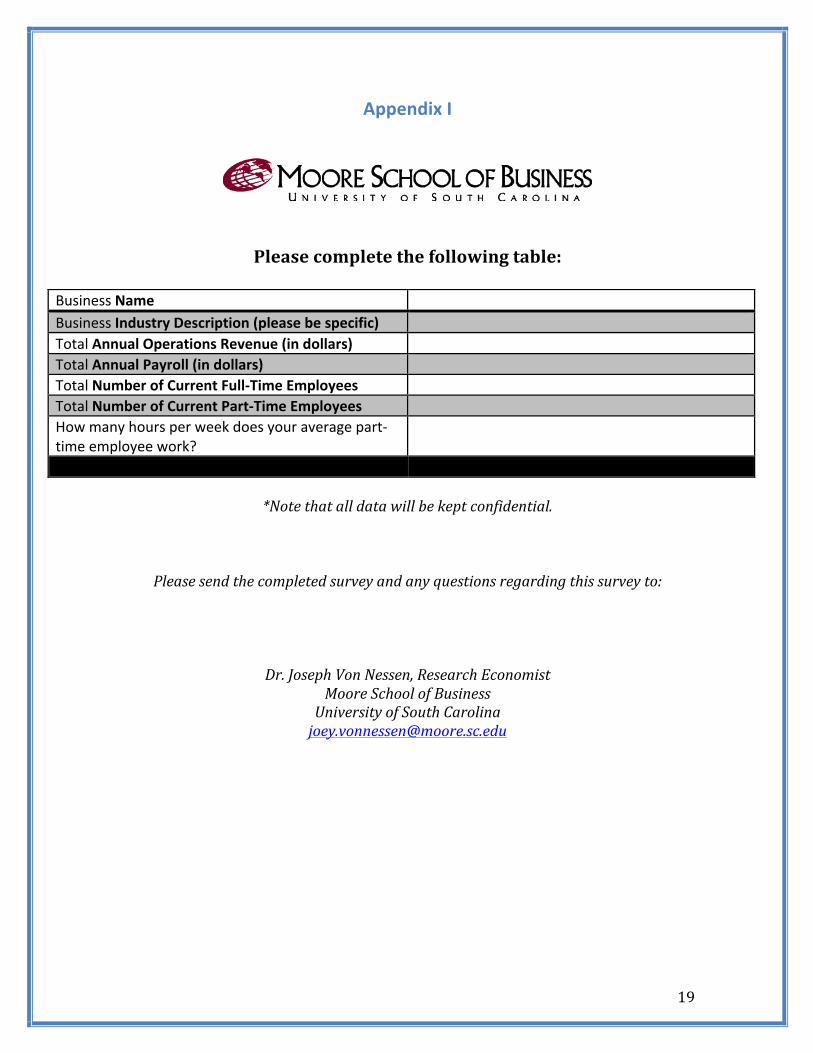
Appendix I
Please complete the following table:
*Note that all data will be kept confidential.
Please send the completed survey and any questions regarding this survey to:
Dr. Joseph Von Nessen, Research Economist Moore School of Business University of South Carolina [email protected]
Business Name Business Industry Description (please be specific) Total Annual Operations Revenue (in dollars) Total Annual Payroll (in dollars) Total Number of Current Full-‐Time Employees Total Number of Current Part-‐Time Employees How many hours per week does your average part-‐time employee work?