Embed Size (px)
Citation preview
8/9/2019 Round-robin analysis of the RILEM TC 162-TDF -.pdf
http://slidepdf.com/reader/full/round-robin-analysis-of-the-rilem-tc-162-tdf-pdf 1/12
Mater ia l s a nd S t ruc tures /
M at r r i aux e t Cons t ruc t i ons , Vo l . 36 , No vem ber 2003 , pp 609-620
~ RILEM TC 162-TDF: Test and design methods for steel fibre reinforced concrete
R o u n d r o b i n a n a l y s i s o f t h e R I L E M T C 1 6 2 T D F b e a m
b e n d i n g te st : P a r t 1 T e s t m e t h o d e v a l u a t io n
P r e p a r e d b y B . I .G . B a r r ~ a n d M . K . L e e ~ w i th c o n t ri b u ti o n s f r o m E . J. d e P l a c e H a n s e n 3
D . D u p o n t 4 E . E r d e m s S . S c h a e r l a e k e n s 2 B . S c h n t i t g e n 5 H S t a n g 3 a n d L . V a n d e w a l l e 4
( 1 ) C a r d i f f U n i v e r s i t y , W a l e s
(2 ) Bel g i an Research Ins t i t u t e , Bel g i um
( 3 ) T e c h n i c a l U n i v e r si t y o f D e m n a r k , D e n m a r k
( 4 ) K a t h o l i e k e U n i v e r s i te i t L e u v e n , B e l g i u m
( 5 ) R u h r - U n i v er s i ty o f B o c h u m , G e r m a n y
A B S T R A C T
A r o u n d r o b i n t e s t p r o g r a m m e w a s c a r r i e d o u t o n t h e
b e a m - b e n d i n g t e s t r e c o m m e n d e d b y t h e R I L E M T C 1 6 2 -
TD F [1 ] . P l a i n concre t e a nd s t ee l f i b re r e i n fb rced conc re t e
( S F R C ) b e a m s w e r e i n c l u d e d i n t h e t e s t p r o g r a m m e . T h e
mat er i a l var i ab l es fo r t he SFR C bea ms c ons i s t ed o f two
concre t e s t r eng t hs , t h r ee f i b re dosages and t h ree t ypes o f
f i b res . A com prehens i ve s t a t i s t ica l ana l ys i s was car r i ed ou t
t o de t e rmi ne t he app l i cab i l i t y and robus t ness o f t he t es t
met hod . I t was t bund t ha t a l t hough i n t e r - l ab var i a t i ons do
occur , t h i s was r e l a t i ve l y smal l compared t o t he i nheren t
mat er i a l var i a t ion . I t i s a l so poss i b l e t ha t t he h i gh v ar i a t ions
observed cou l d be due t o t he r e l a t ive l y smal l c ross sec t ions
used fo r t he t es t beams . Add i t i ona l l y , an i nves t i ga t i on was
car r i ed ou t t o eva l ua t e t he ob j ec t i veness o f the c a l cu l a t i on
p rocedure p roposed
b y
R I L E M T C 1 6 2 -T D F t o o b t a in t h e
necessary des i gn paramet er s . I t was found t ha t t he
p rescr i bed ca l cu l a t i on p rocedure was sa t i s f ac t o ry , as t he
var i a t i on be t ween t he des i gn paramet er s ca l cu l a t ed a t
d i f f e r en t l abo ra t o r i es was genera l l y wi t h i n t he r ange o f
• A n a l te r n a ti v e m e t h o d o f o b t a i n in g t h e d e s i g n
param et er s , by c ons i der i ng r es idua l s t r eng t hs , i s sugges t ed
as i t s i mp l i f i es t he ca l cu l a t i on p rocedure and t he t es t
m e t h o d . I n g e n e r a l, t h e b e a m t e s t w a s f o u n d t o b e a g o o d
robus t t es t and r e l a t i ve l y easy t o car ry ou t . .
R SUMs
Un program rne d 'e.~ais comp aratifi entre laboratoires a dtO
rdalisd po ur le tes t de poutre soumise h la lexion, comm epreser#
pa r TC 1 62-TD F de la RILEM. D es poutres en b~ton normal e t en
b~ton de fibres m~tall iqu~s (BFM ) sont inclue s dans le
program me d 'es~i~ . Pcatr les poutres en BFM, on a con~Mdrd
com rne variables de ma t&'ia ux: deux rdsi~tanc~es gl la
compression, tro~ dosages ate ibres et trois (vpes de fibres. Une
anaO,se stat~tique exkxtustive a Ot~ erAcmOe ~m r determ iner la
pertinence c4 Ia solMitd de la m ~thode d'essai. On a constatO que,
bien qu e des variation s de r~,~ltats entre les laboratoires existent,
celles~'i sont relativement petites; surtout lorsque l',on compare
avec lea' :mriat ions in tr im ~ es des mat&iawc eux-m~mes. Ces
dern i~es variations peuv ent ~ re ~galement &4es cnec sections
trans~ersales relativemen t petites q ui so nt utilis.~es po ur les essais
de poutre. Ensu ite, une analyse a ~td rdalisOe en vu d'&,a.hter
l'objectbeit~ de la m Othode de calcut q~d est proposd par TC 162-
TD F de la R1LE]ff pou r obtenir les paramfitres n~cessaires lots
du dim emionnement. On a cons, aM que la m~thode de calcul
prescrite dtait satisftisante, parce que la variation des
param~tres; calcut~e par les dij]~rents k~oratoires pour le
dimensionnement; Otait d'u n ordre de grandeur de +_5%. Une
mdthode alternatfi~ est ndanmoins proposOe pou t obtenir les
pa ra, 'n ~es de dimem'ionnement en prena nt en comid~ration la
r~sistance rds'iduelle. Cette m~tho de sinwlifie la mdttuM e de c ak ~l
et la m~thode d'essai. En gOndral, l ' ssai de pou tre soumise h la
f lexion s imple , comm e pre~cri t pa r le TC 162-TD F de la RILE?r
est un essai rob uste e t relativement simp le ?t exdcuter.
1359 5997/03
9 R I L E M
6 9

8/9/2019 Round-robin analysis of the RILEM TC 162-TDF -.pdf
http://slidepdf.com/reader/full/round-robin-analysis-of-the-rilem-tc-162-tdf-pdf 2/12
T C 1 6 2 - T D F
1 . I N T R O D U C T I O N
In the b eginning of 1999, a research eonsort i tml cortsist ing
o f e leven academ ic and industria l partners was created
tb l lowing an award o f a Cont rac t unde r the Indus tr ia l and
Mate r ia l s Technolog ies P rogram m e (Br i t e -EuRam HI) to ca r ry
out a
proje t
ent i t led Tes t and D esign metho ds ; for S teel F ibre
Re in tbrced Concre te (Des ign of S F RC ) . One o f the ob jec tives
of the p ro jec t was to inves tiga te appropr ia te te s t m e thods to
characterise the bas ic materia l propert ies of SFRC materia ls .
As pa r t o f the e f fo r t to fu l fi l tha t ob jec t ive , a round rob in t e s t
p rogram m e was ca r r i ed ou t on two te s t conf igura t ions i e
notched beam s un der th ree -po in t bend ing and un i -ax ia l t ensi l e
tes t on cyl inders . This pape r presents the resul ts for the round
rob in p rogram m e ca r r i ed ou t on the th ree -po in t beam -bending
tes t . The s e t -up chosen fo r eva lua t ion was based upon the
r e c o m m e n d a ti o n s o f t h e R I L E M T C 1 6 2 -T D F [ 1 ] w i t h s o m e
minor modificat ions as deta i led la ter . The main a im was to
inves t igate the s trengths , l imita tions and appropria teness o f the
proposals .
Tw o conc rete st rengths wer e considere d in the tes t
p rogram m e. The conc re te g rades cons ide red were C25/30 ,
t e rm ed as norm a l s t reng th conc re te (NS C) and C70/85 , t e rm ed
as high s trength cono~ete ( t lSC ). The le t ter C indicates a
characteris t ic compress ive s t rength and the numerals indicate
the com pres s ive s t reng ths in N/m m 2 measu red f i 'om cyl inde rs
and cubes re spec t ive ly . Three d i f fe ren t f ib re dosages were
em ployed in the t e s t p rogram m e
i e
25 kg /m3, 50 k g/m 3 and
75 kg /m3. In addi t ion, pla in concrete beams w ere a lso included
in the tes t progranmqe. The pla in concrete beanas essent ia l ly
p lay the ro le o f con t ro l spec im ens and were a m ean s o f
inves t igat ing the s t rengths, l imita t ions and
sens i t ivi ty o f the pro posed tes t :method, as
they do no t con ta in va r ia t ions in t roduced
by fibre dis tr ibut ion and orienta t ion.
F i v e t e s t i n g l a b o r a t o r i e s w e r e
i n v o l v e d i n t h i s p a r t o f t h e r o u n d r o b i n T e s t i n g
p r o g r a m m e , w i t h C a r d i f f U n i v e r s i t y l a b
( U W C ) a s t h e t a s k c o - o r d i n a t o r . T h e
labora to r ie s a re ( in a lphabe t i ca l o rde r ) :
CST C - Belgian Building Research CSTC
Institute DTU
D T U - Technical Univers i ty of Derunark KUL
K U L - Katholieke Univers i te i t Leuve n RUB
RU B - Ruhr-Universi ty of Boc hum UWC
UW C - Cardiff' University (task co- Total
ordinator)
Th e abov e acron3qns for each Note:
part ic ipat ing laboratory wil l be used
hence forth. During the s tat is t ical analys is ,
each individual laboratory was ass igned a
nm n ber (kno wn on ly to the t a sk co-ord ina tor ) to m a in ta in the
object iveness o f the s ta t is tical s tudy.
2 . T E S T P R O G R A M M E
I t was dec ided a t an ea r ly s t age tha t i t would be wise to
d iv ide the fo reseen round rob in t e s t p rogranune in to two
phases . The f i rs t phase was considered a pi lot phase to
inves tiga te the s t reng tks and weakn es ses o f the p roposed b eam
test . Subseq uently, this valuable experie nce wo uld be fed into
the s econd phase where a wide r range o f m a te r ia ls would be
tes ted. F or the f i rs t phase, UvWC cas t a l l o f the specimens
involved. For the second phase, three other labs
i e
C S T C ,
DTU and RUB prepa red the spec im ens . Tab le 1 g ives the
overa l l round rob in t e s t p rogram m e.
3 . M A T E R I A L S A N D S P E C I M E N
P R E P A R A T I O N
3 . 1 T y p e o f f i b r e s
T h r e e t y p e s o f f i b r e s , s u p p l i e d b y N . V . B e k a e r t S . A . ,
w e r e u s e d f o r t h e r o u n d r o b i n t e s t p r o g r a m m e . A l l t h e
f i b r e s w e r e h o o k e d a n d c o l la t e d . D e t ai l s o f t h e i r u s a g e c a n
b e s e e n f r o m T a b l e 1 ( f r o m t h e s u p e r sc r i p ts ) . D e t a il s o f t h e
f ib res a re g iven in Tab le 2 .
3 . 2 F i r s t p h a s e
U W C c a s t a ll o f t h e s p e c i m e n s , w h i c h w e r e N S C , { br t h e
f i rs t p h a se . T h e m i x c o m p o s i t i o n , b a s e d u p o n e a r l i e r w o r k
a t UW C [2] , o f cem ent : f ine aggrega te : coa rse aggrega te :
wa te r i s equa l to 1 : 2 : 2 . 5 :0 . 5 6 b y we igh t .
For the f i rs t phase, control specimens in the form o f three
150rmn cubes and three cyl inders (~bl00x200 mm long) were
cas t a long with the actual beam specimen s (150x 150x600 ram)
( N . B . ~ q e r e c o m m e n d e d P d L E M b e a m h a s d i m e n si o ns o f
150x 150x 550m m as s_hown in F ig . 1 ), Two of the con t ro l
spec im ens were re ta ined a t UWC, whereas the th i rd was
transported with the beams to the other tes t ing labs . All
spec im ens were cured under w a te r a t a t em pera tu re o f 20-t2~
T a b l e 1 - O v e r a l l r o u n d r o b i n t e st p r o g r a m m e
N u m b e r o f s p e ci m e n s
F i r st p h a s e S e c o n d p h a s e
C 2 5 / 3 0 C 2 5 / 3 0 C 7 0 / 8 0
252 kg/m3 752 kg/m3 0 kg/m3 253 kg/m 3
6 6 6 6
6 6 6 6
6 6 6 6
6 6 6 6
6 6 6 6
30 30 30
0 kg/m 3 501 kg/m 3
8 8
8 8
8 8
8 8
8 8
40 40
Superscript
indicates Dramix 80/60 BN w as used
Superscript 2 indicates Dramix 65/60 BN was used
Superscript 3 indicates Dram ix 80/60 BP w as used
30
Table 2 - C haract er i s t ic s o f t he f ibres used
D r a m i x D r a m i x D r a m i x
P r o p e r t y 6 5 6 0 B N 8 0 / 6 0 B N 8 0 / 6 0 B P
Carbon
Low Low High
content
Tensile
strength 1000 1000 2500
(MPa)
60 60 60ength (mm)
Aspect ratio
(Length /
Diameter)
65
80
80
6 1 0

8/9/2019 Round-robin analysis of the RILEM TC 162-TDF -.pdf
http://slidepdf.com/reader/full/round-robin-analysis-of-the-rilem-tc-162-tdf-pdf 3/12
M a t e r i a l s a n d S t r u c t u r e s /M a t O r i a u x
e t C o n s t r u c t i o n s
V o l . 3 6 , N o v e m b e r 2 0 0 3
A t 2 1 d a y s , h a l f o f th e b e a m s p e c i m e n s f r o m e a c h m i x
w e r e t a k e n o u t o f t h e w a t e r a n d n o t c h e d . T h e o t h e r h a l f
w e r e l e f t i n t h e w a t e r a s t h e y w e r e t o b e n o t c h e d a t t h e i r
r e s p e c t i v e t e s t i n g l a b s a t a p p r o x i m a t e l y 7 w e e k s . A f t e r
n o t c h i n g , t h e s p e c i m e n s w e r e i m m e d i a t e l y p l a c e d b a c k
und er wa te r fb r fu r the r c tu ing . S ub sequen t ly , a t 28 days , a l l
t h e s p e c i m e n s ( w h e t h e r n o t c h e d o r u n - n o t c h e d ) w e r e
r e m o v e d f r o m t h e w a t e r a n d w r a p p e d i n g o o d q u a l i ty c l i n g
f i lm . T h e y w e r e t h e n s t o r e d i n a c u r i n g r o o m ( R H 6 5 J: 5 % ,
T = 20 ~ :2 ~ A p p r o x i m a t e l y o n e w e e k b e f o r e t e st i ng , t h e
s p e c i m e n s w e r e t a k e n o u t o f th e c u r i n g r o o m a n d s e n t to
the i r re spec t ive t e s t ing l abs .
3.3 Second phase
F o r t h e s e c o n d p h a s e , t h r e e o t h e r l a b o r a t o r i e s w e r e
r e s p o n s i b l e f o r s p e c i m e n p r e p a r a t i o n . R U B p r e p a r e d t h e
s p e c i m e n s w i t h 7 5 k g / m 3 o f f i b re s , w h e r e a s D T U a n d C S T C
p r e p a r e d t h e s p e c i m e n s w i t h 2 5 k g / m 3 o f f i b re s . C S T C a l so
f a b r i c a t e d th e p l a i n H S C t e s t s p e c i m e n s .
D T U p r e p a r e d t h e N S C w i t h 2 5 k g / m 3 o f f i b r e s u s in g a
m i x c o m p o s i t i o n o f 1 : 2. 0 7 : 2 .5 2 : 0 . 5 1 . R U B p r e p a r e d t h e
N S C w i t h 7 5 k g / m 3 o f f i b r e s u s i n g a m i x c o m p o s i t i o n o f 1 :
3 . 89 : 3 . 0 5 : 0 . 6 5 ( N S C m i x c o m p o s i t i o n g i v e n i n t h e f b r m o f
c e m e n t : f i n e a g g re g a t e : c o a r s e a g g r e g a t e: w a t e r ) . C S T C , o n
t h e o t h e r h an d , c a s t th e p l a in H S C a n d t h e H S C s p e c i m e n s
w i t h 2 5 k g / m 3 o f s t e e l f i b r e s u s in g a m i x c o m p o s i t i o n o f 1 :
1 . 9 3 : 2 . 6 6 : 0 . 0 0 7 5 : 0 . 3 5 ( c e m e n t : t i n e a g g r e g a t e : c o a r s e
aggrega te : s i l i ca fum e: wa te r ) . In add i t ion , 7 . 75 l i t re /m3 o f
supe r -p la s t i c ize r was added .
F or the s ec ond phase , a s im i la r p roced ure to the f i r st phase
was im plem ented . However , a s l igh t ly d i f fe ren t approach
was us ed rega rd ing no tch ing o f the spec im ens . Al l the
spec im ens were no tched a t the i r re spec t ive t e s t ing l abs jus t
be fore t e s t ing took p lace
i.e.
7 weeks a ider cas t ing. The
prepa r ing l abs a l so p repa red con t ro l spec im ens , bu t these
were no t t ranspor ted bu t t e s ted a t the p repa r ing l ab i t s el f .
3.4 Notching procedu re
F o r b o t h t h e f i r st a n d s e c o n d p h a s e s , a l l b e a m s w e r e c u t
v i a r o t a t in g d i a m o n d b l a d e s t o m a i n t a i n a l i g am e n t h e i g h t
o f 1 2 5 m m . W h i l s t t h e n o t c h e s w e r e c u t , a j e t o f w a t e r w a s
u s e d t o c o o l t h e s u r f a c e s d u r in g t h e n o t c h i n g p r o c e d u r e . A l l
no tch es were cu t pe rpend icu la r to the top sur thce a t cas t ing .
4 . T E S T SE T U P
4.1 Descrip tion of test set up
Th e tes t se t-up used is i llustrated in F ig. 1 with so me s l ight
m odi f i ca t ions f rom the P dLEM recom m enda t ions . Al l t e s t s
were conduc ted under c losed looped condi t ions . The
m easurem ents wh ich were t aken dur ing t e s ting were the load
applied, mid-span displacements on both s ides of the be am (~St
and 82) and the c rack m ou th open ing d i sp lacem ent (CMO D).
In the RILEM recommendations , i t is s ta ted that the tes ts
should be conduc ted in a m anner s u c h that the average mid-span
deflec tion increases at a constant rate o f 0.2 m rrgmin. A slight
modificat ion was made with re spect to this requirement . Instead
of carrying out the tes ts under average mid-span deflect ion
control , the tes ts were carried out und er CM OD control . I t was
ant ic ipated that the beams wou ld b e s t i ff due to their s ize and the
F
DEVICE
~ ~
PPORT
O n e c o n t o c t h o s t o b e f ~ x e d
t w o d e g r e e s o f f r e e d o m )
A
6 j ~ ~ 1 m
I
I T ~
1 1
L 5 I
F tc - a 1 cr..o.~
- \ gscas om~
Fig. 1 - Schematic diagram showing the b eam bending test set-
up (after [1]).
re la t ively shal low notch. Furthermore, HSC beams were
involved in the tes t program me w hich co uld resul t in unstable
cracking for plain concrete specimens. By conU'olling the tests
via C M OD control a mo re s table tes t could be a , ta ined.
4.2 Strain rates
In the f i r s t phase o f the ro tm d rob in t e s t p rogram m e, the
C M O D s t r a i n ra t e w a s n o t s t a t e d e x p l i c it l y . I n s t e a d , th e
RIL EM recom m end a t ions were used a s a rough gu ide f ior the
SFRC specimens . Therefbre , i t was fotmd that the variou~s
tes t ing labs used differen t s t ra in rates. S om e of the labs used
varying s tra in ra tes whereas the others used a constant s t ra in
rate . Table s 3 and 4 give the s t ra in ra tes adopted fo r the pla in
I T a b l e 3 - S t r a i n r a t e r e g i m e s u s e d i n t h e f i r st
Te s t ing
lab
CSTC
DTU
C o n s t a n t / " C M O D a t w h i c h S t r a in
V a r y i n g s t r a i n r a t e w a s r a t e
strai n rate ap plie d (Era) ...... (#m /m in)
9 0 to 100 9 20
9 100 to 250 9 50
Varying 9 250 to 500 9 250
9 500 to end of test 9 500
Constant Who le of test 120
Constant Whole of test 50
* 0to 200' . . .. . *3 0
Varying 9 200 to end of est 9 60
K U L
UWC
611
8/9/2019 Round-robin analysis of the RILEM TC 162-TDF -.pdf
http://slidepdf.com/reader/full/round-robin-analysis-of-the-rilem-tc-162-tdf-pdf 4/12
T C 1 6 2 - T D F
T a b l e 4 - S t r a i n r a t e r e g i m e s u s e d i n t h e f i r st
Te s t ing
lab
C S T C
D T U
K U L
R U B
U W C
C o n s t a n t /
V a r y i n g
strain ra te
p h a s e ( .f or t h e S F R C b e a m s )
C M O D a t w h i ch
strain rate wa s
applied (~tm)
* 0 to 100
e 100 to 250
Va r y i ng 9 250 t o 500
e 500 to 4000
, 4 0 0 0 to end oftest
Cons t a n t
Cons t a n t
Constant
Va r y i ng
W ho l e o f t e s t
W ho l e o f t e s t
Who l e o f t e s t
9 0 to 200
9 200 t o e nd o f te s t
Strain rate
(~tm/min)
9 20
,,, 50
9 250
9 500
9 2000
250
200
250
* 30
* 240
T a b l e 5
-
S t r a i n r a t e r e g i m e s u s e d i n t h e s e c o n d
p h a s e
Typ e o f c oncr e te
Plain
Steel f ibre
re inforced
CM O D s train r ate s
50 ~tm/min until rupture
9 200 gm/m in until CM OD reaches 3.5 mm.
9 Af t e r CMO D o f 3 .5 mm , s pe e d c a n
opt ional ly be increased to 2000 ~tm/min
25
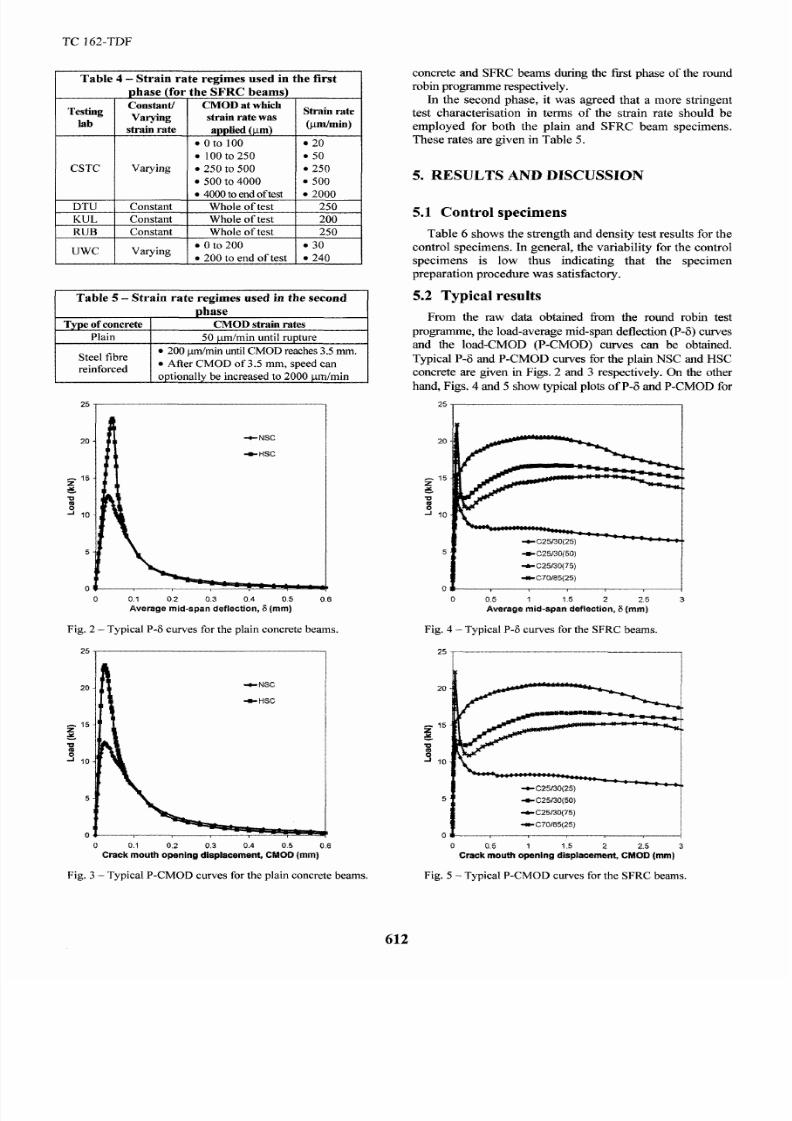
c o n c r e t e a n d S F R C b e a m s d u r i n g t h e f ir s t p h a s e o f th e r o u n d
r o b i n p r o g r a m m e r e s p e c t i v e ly .
I n t h e s e c o n d p h a s e , i t w a s a g r e e d t h a t a m o r e s t ri n g e n t
t e s t c h a r a c t e r i s a t i o n i n t e r m s o f t h e s t r a i n r a t e s h o u l d b e
e m p l o y e d f o r b o t h t h e p l a i n a n d S F R C b e a m s p e ci m c m s .
T h e s e r a t e s a r e g i v e n i n T a b l e 5 .
5 R E S U L T S A N D D I S C U S S I O N
5 1 C o n t r o l s p e c i m e n s
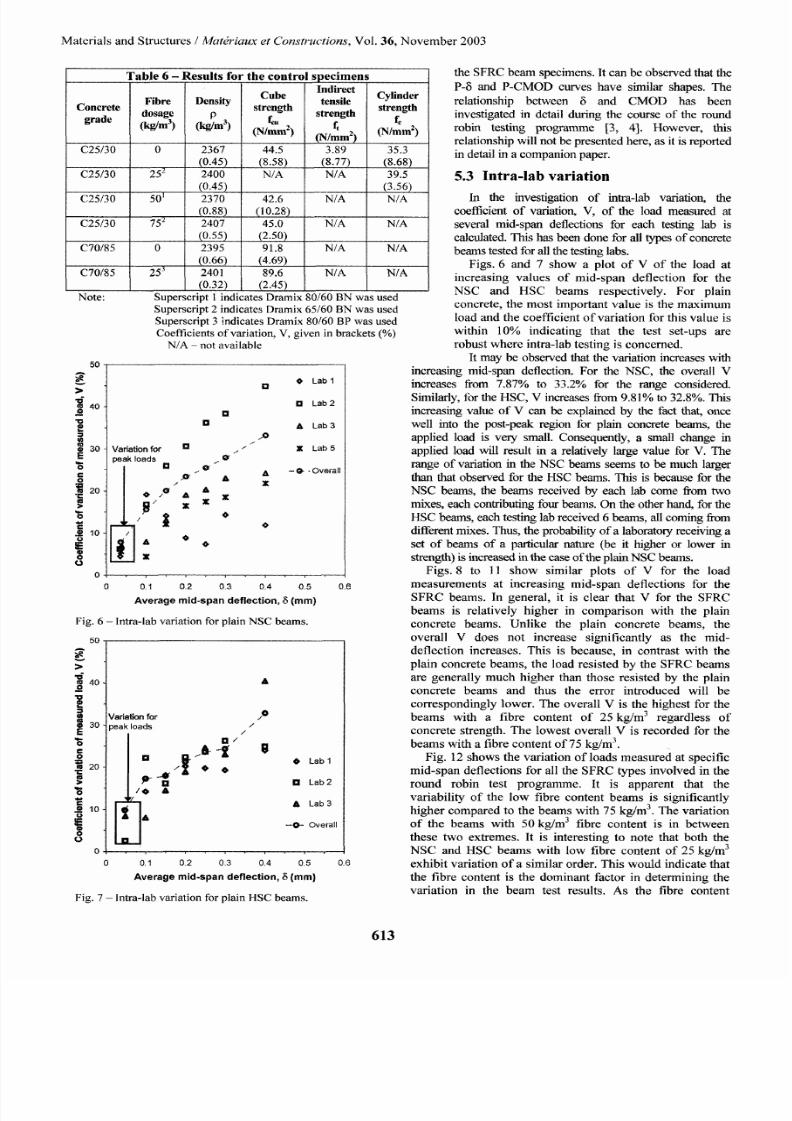
T a b l e 6 s h o w s t h e s t r e n g t h a n d d e n s i t y t e s t r e s u l t s t b r t h e
c o n t r o l s p e c i m e n s . I n g e n e r a l , t h e v a r i a b i l i t y f o r th e c o n t r o l
s p e c i m e n s i s l o w t h u s i n d i c a ti n g t h a t th e s p e c i m e n
p r e p a r a t i o n p r o c e d u r e w a s s a t is f a c to r y .
5 2 Typica l resu l ts
F r o m t h e r a w d a t a o b t a i n e d f r o m t h e r o u n d r o b i n t e s t
p r o g r a m m e , t h e l o a d - a v e r a g e m i d - s p a n d e f l e c t i o n (P - 6 ) c u r v e s
a n d t h e l o a d - C M O D ( P - C M O D ) c u r v e s c a n b e o b ta in e d .
T y p i c a l P - 5 a n d P - C M O D c u r v e s fo r t h e p la i n N S C a n d H S C
c onc r e t e a r e g i ve n i n F i g s . 2 a nd 3 r e s pe c t i ve l y . On t he o t he r
h a n d , F i g s . 4 a n d 5 s h o w t y p i c a l p l o t s o f P - 5 a n d P - C M O D I b r
25
20
15
Z
13
t@
~*NSC
-4-HSC
0
0 0,1 0,2 0,3 0,4 0,5 0,6
Average mid-span deflection ;5 (ram)
Fig. 2 - Typica l P-6 curves for the p la in concre te beams.
25
20
Z
-,,~NSC
,m-HSC
O 0.1 0,2 0,3 0.4 0,5 0.6
Crack mo u t h o p en i n g d i spl acemen t , CM O D ram)
Fig, 3 - Typica l P-C M OD curves for the p la in concre te beams,
20-
t5-
Z
,a 10,
0
o
--~- C25/30(25)
-.~- C25J3f~50)
-a- C25130(75)
-,i~ C70/85(25)
0,5 1 1,5 2 2.5
Average mid-span deflection ;5 (ram )
Fig. 4 - T ypica l P-6 curves for the SFRC b eams.
20
-~.- C25t30(25>
,.~-C25t30(50)
,.~-C25/30(75)
-~*C70185(25)
o o.5 1 ~5 2 Z5 3
C r ac k m o u th ~ n l n g d t s p l a c e ~ , C M O D m m )
Fig, 5 - Typica l P-CM OD curves for the SFR C beams.
612
8/9/2019 Round-robin analysis of the RILEM TC 162-TDF -.pdf
http://slidepdf.com/reader/full/round-robin-analysis-of-the-rilem-tc-162-tdf-pdf 5/12
Ma te r ia l s and S t r uc tur es / M a t d r i a u x e t Co n s t ru c t i o n s V o l . 3 6 , N o v e m b e r 2 0 0 3
C o n c r e t e
g r a d e
C25/30
T a b l e 6 - R e s u l t s f o r t h e c o n t r o l s p e c i m e n s
C25/30
C25/30
C25/30
C70/85
C70/85
Note:
F i b r e
d o s a g e
(kg/m~
0
25 ~
50 ~
75 ~
0
253
D e n s i t y
P
( k ~ / m 3 )
2367
(0.45)
2400
(0.45)
2370
(0.88)
2407
0.55)
2395
(0,66) ......
2401
Cube
s tr e ng th
( N / r a m2)
44.5
(8.58)
N/A
42.6
(10:28)
45.0
(2.50)
91.8
(4.69)
89.6
I n d i r e c t
te ns i l e
strength
f,
( N / m m2)
3.89
(8.77)
N/A
N/A
C y l i n d e r
s tr e ng th
N / a m 5
35.3
(8.68)
39.5
(3.56)
N/A
N/A N/A
N / A N / A
N / A N / A
0 . 3 2 ) 2 . 4 5 )
Superscript l indicates Dramix 80/60 BN was used
Superscript 2 indicates D ramix 65/60 BN was used
Superscript 3 indicates Dramix 80/60 B P was u sed
Coefficients of variation, V, given in brackets ( )
N/A - not available
5O
g
>
4
m
30 Variation for
peak loads
6
20
t ~
x
o
o
o
tn
D
Qr
A
/
O / ~ X
x x
Lab 1
O Lab 2
Lab 3
~ o
X Lab 5
A -O -Overall
x
0.1 0,2 0.3 0,4 0,5
A v e r a g e m i d - s p a n d e f l e c t i o n , <5 m m )
F i g , 6 - I n t r a - l a b v a r i a t i o n f o r p l a i n N S C b e a m s .
5o
0,6
g
>
4
m
30
E
20
6
o
8
0
0
&
Var ia tion fo r /O
3eak oads /
/
I I /
Z u
|
_.0. / * *
/ o &
i ]
0,1 0,2 0.3 0,4 0,5
A v e r a g e m i d - s p a n d e f l e c t i o n , 8 ( m m l
Lab1
[] Lab 2
Lab 3
-O- Overall
0.6
Fig. 7 - Intra-lab variation for plain HS C beams.
the S F RC beam spec im ens . I t can be obse r ved tha t the
P - 5 and P - CM OD cur ves have shna ilar shapes. Th e
r e la t ionsh ip be tween 6 and CMOD has been
invest igated in deta i l dur ing the cou rse of the round
robin tes t ing programme [3, 4] . However , this
re la t ionship wil l not be p resented here , as i t is repor ted
in deta i l in a com panio n paper .
5 . 3 I n t r a - l a b v a r i a t i o n
In the investigation of intra-lab variation, the
coef f ic ient o f varia tion, V , o f the load measured a t
several m id-spa n deflections for eac h testing lamb is
calculated. This has been done for a l l types of concrete
beam s tested for all the testing labs.
F i g s, 6 a n d 7 s h o w a p l o t o f V o f t h e l o a d a t
i n c r e as i n g v a l u e s o f m i d - s p a n d e f l e c t io n f o r t h e
N S C a n d H S C b e a m s r e s p e c t i v e l y . F o r p l a i n
c o n c r e t e , t h e m o s t i m p o r t a n t v a l u e i s t h e m a x i m u m
l o a d a n d t h e c o e f f i c ie n t o f v a r i a ti o n f o r t h i s v a l u e i s
wi th in 10 ind ica t ing tha t the t e s t s e t - ups a r e
r obus t w her e in t r a - lab t e s t ing i s conce r ned .
I t may be observed that the var ia t ion increases w ith
increasing mid-span deflection. For the NSC, the overall V
increases from 7.87 to 33.2 tbr the rang e considcq~xl.
Similarly, tb r the H SC , V inc~.ases ti,om 9.81 to 32.8 . This
increas ing value o f V can be exp lained by the thct that, once
well into the post-w-~_k region tbr plain conc rele beams, the
applied load is very, small . Cor tsequ~tly, a small change in
applied load wil l resul t in a re la t ively large value for V. The
range o f varia tion in the N SC beam_s seems to be muc h larger
than Oa t observ 'ed tbr the H SC beams. This is because for the
NS C beam s , the beam s r ece ived by each lab com e f r om two
mixes , each contr ibut ing four beams. On the othe r hand, for the
HSC beams, each tes t ing lab received 6 beam, , a l l coming f rom
different mLxes. Thu s, the probability o f a lab oratory receiving a
set of beams of a par t icular nature (be i t higher or lower in
s trength) is increased in the case o f he pla in NSC beams.
F igs . 8 to 11 show s im i la r p lo t s o f V f or the load
m e a s u r e m e n t s a t i n c r e a s i n g m i d - s p a n d e f l e c t i o n s f o r t h e
S F R C b eam s . I n gene r a l , i t i s c lea r tha t V f or the S F R C
beam s i s r e la t ive ly h ighe r in com par i son wi th the p la in
c o n c r e t e b e a m s . U n l i k e t h e p l a i n c o n c r e t e b e a m s , t h e
over a l l V does no t inc r ease s ign i f i can t ly a s the m id-
de f lec t ion inc r eases . Th is i s because , in con t r a s t wi th the
p l a in c o n c r e t e b e a m s , t h e l o a d re s i s te d b y t h e S F R C b e a m s
ar e gene r a l ly m uch h ighe r than those r e s i s ted by the p la in
c o n c r e t e b e a m s a n d t h u s t h e e r r o r i n t r o d u c e d w i l l b e
c o r r e s p o n d i n g l y lo w e r . T h e o v e r a l l V i s t h e h i g h e st t b r t h e
b e a m s w i t h a f i b r e c o n t e n t o f 2 5 k g / m 3 re g a r d le s s o f
concr e te s t r eng th . The lowes t ove r a l l V i s r ecor ded f o r the
beam s w i th a f ib r e con ten t o f 75 kg /m 3 .
F ig . 12 show s the va r ia t ion of loads m easur ed a t spec i f i c
m id- sp an d e f lec t ions f o r a l l the S F 'RC types in vo lve d in the
r ound r ob in t e s t p r ogr am m e. I t i s appa r en t tha t the
va r iab i l i ty o f the lo w f ib r e con ten t beam s i s s ign i f i can t ly
h i g h e r c o m p a r e d t o t h e b e a m s w i t h 7 5 k g / m 3. T h e v a r i a ti o n
o f t h e b e a m s w i t h 5 0 k g / m 3 fi b r e c o n t e n t i s i n b e t w e e n
these two ex t r em es . I t i s in te r e s t ing to no te tha t bo th the
N S C a n d H S C b e a m s w i t h l o w f i b r e c o n t e n t o f 2 5 k g / m 3
exhib i t va r ia t ion of a s im i la r o r de r . Th is would ind ica te tha t
the f ib r e con ten t i s the dom inan t f ac to r in de te r m in ing the
va r ia t ion in the beam te s t r e su l t s . As the f ib r e con ten t
6 1 3

8/9/2019 Round-robin analysis of the RILEM TC 162-TDF -.pdf
http://slidepdf.com/reader/full/round-robin-analysis-of-the-rilem-tc-162-tdf-pdf 6/12
T C 1 6 2 - T D F
O
C
"6
o
O
4 0
X X
X •
3 0
2 0
1 0
X
......... A A
.....
O
.............
O
............... .. ...... .... O
A A A
D
O L a b 1
O
O L a b 2
A Lab 3
x L a b 4
x L a b 5
....o
Overall
0 . 5 ~ ~ . 5 2 2 . 5 3
3 5
A v e r a g e m i d - s p a n d e f l e c ti o n , 5 ( m m )
Fig. 8 - lntra-lab variation fbr the C25/3 0 wit h 2 5 k g / m 3
o f D r a m i x
6 5 / 6 0 B N f i b re s ) S F R C
beams.
4 0 .
3 0 .
~ 20.
~
@ L a b 1
El L a b 2
L a b 3
X Lab 4
L a b 5
- -@-
Overall
- I - - I t - - t l
z
@ 0 0 I~, II , I>
0 . 5 ~ ~ 5 2 2 . 5 a
A v e r a g e m i d - s p a n d e f l e c t i o n , 6 ( r a m )
Fig . 9 - In tra-lab var ia t ion for the C25/30 with 5 0 k g / m 3
o f D r a m ix 6 5 / 6 0 B N f i b r e s) S F R C beams.
o r O O
x
x X
....... ....... [] 0 ........ .... ...... ..
0 '
A A ~
13
B A
X
A •
O Lab 1
D L a b 2
A Lab 3
x Lab 4
, o Overall
0 .5 1 1 .5 2 2 .5 3
A v e r a g e m i d - s p a n d e f l e c t io n , ~ ( m m )
3.5
3 0
>
_o
o
2 0
s
j
0
3 , 5
Fig. 10 -
Intra-lab variation for the C25/3 0 with
7 5 k g / m 3
o f D r a m i x 6 5 / 6 0 B N f i b r e s ) S F R C b e a m s .
i n c r e a s e s , t h e v a r i a b i l i t y i s r e d u c e d . T h i s i s b e c a u s e a s t h e
l i m i t o f t h e a m o u n t o f f i b r e t h a t t h e c o n c r e t e m i x c a n
>
E
>
O
40
30
2 0
1 0
o o
<> s o
0
0
• •
O ~ ZX
O Q 1~ A
A
A
O Lab 1 I
n L a b 2 I
A Lab 3 I
• L a b 4
0 0 , 5 1 t . 5 2 2 . 5 3 3 5
A v e r a g e m i d - s p a n d e f l e c ti o n , S ( m m )
Fig. 11 - lntra~lab variation fo r t h e C 7 0 / 8 5 w i t h 2 5 k g fm 3
o f D r a m i x 8 0 / 6 0 B P f i b re s ) S F R C beams.
4 0
~ x x
o
E o [3 o D o o
~ 20
0
A A
' ~ A A A A
10 o C25/30{25)
9 o C 2 5 / 3 o ( 5 o )
A C 25/30(75)
O X C70/85(25)
0 . 5 1 1 . 5 2 2 , 5 3 3 . 5
A v e r a g e m i d - s p a n d e f l ec t i o n , ~5 ( r a m )
Fig . t2 - Com pila t ion o f ov era l l varia tion for a l l the S F R C
b e a m s p e c i m e n s .
a c c o m m o d a t e i s a p p r o a c h ed , t h e p r o b a b il i ty o f a c h i e v i n g a
m o r e u n i f o r m m i x i s i n c r e a s e d . T h i s w o u l d r e d u c e t h e
v a r i a b i l i t y i n t h e f i b r e d i s ~ b u t i o n a n d t h u s t e s t r e s u l t s w i t h
l o w e r v a r ia b i li ty c a n b e e x p e c t e d .
I n g e n e r a l , fo r t h e N S C a n d H S C b e a m s w i t h t h e l o w e s t
f i b r e c o n t e n t o f 2 5 k g / m 3 , th e o v e r a l l v a r i a t i o n i s i n t h e
r e g i o n o f 2 4 % t o 3 8 % . T h e v a r i a t io n w i t h i n e a c h l a b o n t h e
o t h e r h a n d c a n v a r y f r o m a p p r o x i m a t e l y 1 2 % t o 3 5 % .
A s t h e f i b r e c o n t e n t i s i n c r e a s e d , t h e v a r i a t i o n i s
g e n e r a l ly d e c r e a s e d . F o r t h e N S C b e a m s w i t h 5 0 k g / m 3 o f
f i b r e s , t h e o v e r a l l v a r i a t i o n i s a p p r o x i m a t e l y 2 3 % f o r t h e
d i s p l a c e m e n t s c o n s i d e r e d . T h e v a r i a t i o n w i t h i n e a c h l a b
r a n g e s a p p r o x i m a t e ly i n t h e o r d er o f 1 3 % t o 2 5 % .
F o r t h e N S C b e a m s w i t h t h e h i g h e s t f i b r e c o n t e n t o f
7 5 k g / m 3 , t h e o v e r a l l a v e r a g e v a r i a t i o n i s v e r y m u c h
i m p r o v e d . G e n e r a l l y , t h e o v e r a l l v a r i a t io n i s i n t h e r e g i o n
o f 1 5 % t o 1 7% f o r t h e l o a d s c o n s i d e r e d . T h e v a r i a t io n s
w i t h i n l a b s v a r y f r o m 1 0 % t o 2 3 % . T h i s i s a s i g n i f i c a n t
i m p r o v e m e n t i n r e l a ti o n t o t h e b e a m s w i t h t h e l o w e s t f i br e
c o n t e n t o f 2 5 k g / m 3 .
In summ axy, i f a 10% variation leve l i s cons idered, the
variations obse rved are qu i te h igh for a l l th e concrete types
6 1 4

8/9/2019 Round-robin analysis of the RILEM TC 162-TDF -.pdf
http://slidepdf.com/reader/full/round-robin-analysis-of-the-rilem-tc-162-tdf-pdf 7/12
M at e r i a l s and S t r uc t u r es /
M a t O r i a u x e t C o n s t r u c t i o n s
V o l . 3 6, N o v e m b e r 2 0 0 3
cons i de r ed w i t h i n t he r ound r ob i n l i ' ~ unewor k . T he nex t t wo
sect ions wi l l t ry to identi t~r the sourc e or so urces o f var ia t ion
observed wi thin the tes t resul t s . In par t icular , a t tent ion wi l l be
g i ven t o t he i n t e r -l ab and w i t h i n - mi x va r i a t i ons.
5 . 4 I n t e r - l a b v a r i a t i o n
I n a n y t e s t p r o g r a m m e c o n d u c t e d a t d i f f e r e n t p l a c e s ,
t h e r e a r e b o u n d t o b e d i f f e r e n c e s i n t r o d u c e d b y t h e t e s t se t -
u p s u s e d . H o w e v e r , m o r e i m p o r t a n t l y , o n e w o u l d b e
i n t e r e st e d t o k n o w t h e e x t e n t a n d s e v e r i t y o f t h is v a r i a b i l it y .
T o d e t e r m i n e w h e t h e r t h e r e w a s a n y s i g n i f i c a n t
d i f f e r e n c e i n t h e t e s t r e s u l t s d u e t o a n y v a r i a t i o n i n t h e
d i f f e r en t l ab s e t - ups , s t a t i s t i ca l ana l yses wer e ca r r i ed ou t
u s i n g t h e p l a i n c o n c r e t e b e a m s p e c i m e n s . I n t h e r o u n d
r o b i n t e s t p r o g r a m m e , t w o d i f f e r e n t ty p e s o f p l a i n c o n c r e t e
b e a m s w e r e t e s te d ; o n e w a s t h e N S C , C 2 5 / 3 0 , a n d t h e o t h e r
w a s t h e H S C , C 7 0 / 8 5 . T h e p l a i n c o n c r e t e b e a m r e s u l ts w e r e
u s e d f o r th i s p a r t o f t h e s t a t is t ic a l s t u d y b e c a u s e t h i s w o u l d
r e m o v e a n y v a r i a t io n d u e t o t h e i n t r o d u c t io n o f f i b r e s in t o
t h e c o n c r e t e m a t r i x . T h e a n a l y s i s o f v a r ia t i o n ( c o m m o n l y
k n o w s a s A N O V A ) a n d p o s t - h o c t e st s (t w o s u c h t e s ts w e r e
u s e d i . e . t h e S c h e f f 6 a n d t h e B o n f e r r o n i t e s t s ) w e r e c a r r i e d
ou t i n t h i s i nves t i ga t i on .
T he ANOVA met hod i s ab l e t o i nd i ca t e whe t he r t he r e a r e
any s igni f icant di f ferences in the tes t resul t s a t a par t icular
conf i dence l eve l . An f - va l ue can be comput ed us i ng t he
di f ferent se t s of resul t s . This t=value i s then co mp ared w i th the
~t -value obtained i i -om s ta t i s t ical t ables . These s ta t i s t ical
t ab l e s a r e g i ven i n t e r ms o f f ~ ,~ v . T he va l ue o f o t he r e
r epr esen t s t he l eve l o f conf i dence , wher eas u and v a r e t he
degr ees o f f i ~ edom as soc i a t ed w i t h t he t e s t r e su l t s . T he
degr ees o f f r eedom can be s a i d t o be f ac t o r s whi ch t ake i n t o
a c c o u n t t h e n u m b e r o f tr e a t m e n ts a n d s a m p l e s. N o r m a l ly , i n
s ta t is t ical inferences , a value of a=0.0 5 i s adopted. Th is valu e
of c t has b een used i n t h i s s tudy . T he va l ue o f ~ i s t he
pr obab i l i t y o f maki n g a T yp e I ( o r a e r r o r ) i e . w h e n w e a c c e p t
t ha t t he r e i s a d i f f e r ence when i n r ea l it y t he r e i s none . A r a t io
o f f / f . r i l arger than un i ty wo uld indicate the nu l l hypo thes is ( i . e .
t ha t t he r e i s no s i gn i fi can t d i f f e rence ) has t o be r e j ec t ed a t t he
par t icular level ofct .
I n a d d i t i o n t o A N O V A , t w o o t h e r s t a t i s t i c a l t e s t s w e r e
c a r r i e d o u t . T h e s e t e s t s w e r e t h e B o n t ~ r r o n i a n d S c h e f f d
t e st s , c o l l e c t iv e l y k n o w n a s p o s t - h o c t e st s. A N O V A c a n
g i v e a n i n d i c a ti o n o f th e e x i s t e n c e o f s i g n if i c a n t d i ff e r e n c e s
b e t w e e n v a r i o u s s e t s o f re s u l t s b u t i t d o e s n o t t el l u s w h e r e
t h e d i f f e r e n c e o r d i f f e r e n c e s o c c u r . P o s t - h o c t e s t s e n a b l e s
u s t o p i n - p o i n t t h e s o u r c e s o f th e d i f f b r e n c e s . S i m i l a r to t h e
A N O V A t es t , t he po s t - hoe t e s t s r e l i e s on t he t ~ ..... s t a t i s t ica l
t a b l e s . T h e S c h e f f 6 te s t d i f f e r s f r o m t h e B o n f e r r o n i t e s t s i n
t h a t i t i s m o r e c o n s e r v a t i v e i n t h e s e n s e t h a t t h e p r o b a b i l i t y
o f a T y p e I e r r o r is l e s s .
I t i s a c k n o w l e d g e d h e r e t h a t t h e r e a r e s e v e r a l l i m i t a ti o n s
t o t he s t a t i s t i ca l t e s t s ca r r i ed ou t . T he s t a t i s t i ca l t e s t s
a s s u m e t h a t t h e s a m p l e s c o m e f r o m a n i d e n t i c a l s o u r c e ( a
p o p u l a t i o n ) a n d t h u s a n y s i g n i f i c a n t d i f f e r e n c e m u s t b e
c a u s e d o n l y b y t h e d i f f e r e n c e i n t r e a t m e n t , t h e t re a t m e n t i n
t h i s c a s e b e i n g t h e t e s t s e t - u p . H o w e v e r , i n t h e c a s e o f t h e
r o u n d r o b i n t e s t p r o g r a m m e , s a m p l e s w e r e m i x e d i n
b a t c h e s . M o r e o v e r , n o c o n s i d e r a t i o n h a s b e e n g i v e n t o
v a r i a t i o n i n t r o d u c e d b y t r a n s p o r t a ti o n o f t ile c o n c r e t e
c y l i n d e r s , n o t c h i n g p r o c e d u r e e t c . A c o m p l e t e
cons i d e r a t i on o f a ll t hese o t he r f ac t o r s i s no t pos s i b l e .
D e t a i l e d m a t h e m a t i c a l b a s i s o f t h e s e m e t h o d s c a n b e
ob t a i n ed f i 'om bo oks on s t a t i s ti c s [ 5 - 7 ] .
T ab l e 7 show s t he r e su l ts o f t he s t a t i st ica l ana l ys i s o f t he
tes t resul t s . A ra t io o f mor e than uni ty fo r tT t~nt s obtained tbr
t wo va l ues o f ma_ximum l oad
i . e .
t b r b o t h t h e N S C a n d H S C
b e a m s . A s t h e m a x i m u m l o a d i s t h e m o s t i m p o r t a n t
character i s ing paxameter for pla in concrete , thi s indicates that
i n t e r - l ab va r i a t i ons do occur . However , when cons i de r i ng t he
pos t - p eak r eg i me , a ll t he f / ~ t va l ues f b r the l oads a t t he
pr esc r i bed 6 po i n t s cons i de r ed a r c be l ow t he c r i t ica l l eve l.
T ab l e 8 shows t he r e su l t s o f t he pos t - hoc t e s t s conduc t ed .
T he t ab l e shows whi ch l abs d i f f e r s i gn i f i can t l y f r om each
o t he r a t a l eve l o f e t = 0 .05 . B o t h t he S ch e f t ? and B onf e r r on i
tes t s indicate that there i s a s igni f icant di f i%rence in the value
o f P m , ~ f o r t h e p l a i n N S C b e a m s m a d t h e p o s t - h o e t e s t s
i nd i ca t e t ha t t he s i gn i f i can t d i f f e r ence i s dom i na t ed b y L ab 5 .
Apar t f r om t hese r e su l t s , no o t he r s i gn i f i can t d i f f e r ence i s
de t ec t ed . I t i s i n t e r e s t ing t o n o t e t ha t t he pos t - hoc t e s t s do no t
i den t i f y any s i gn i f ican t d i f f e r ence f o r t he va l ue o f P m~ x f o r
t he p l a i n HS C beam r esu l t s due t o t he r a t i o f /l ~r it be i ng v e r y
c l o s e t o t h e v a l u e o f u n i ty .
Up on f u r t he r i nves t iga t i on , i t was f o und t ha t L ab s 1 t o 3
had av e r age P ~ va l ues o f 11 .4 ix .) 11 .8 kN w her eas L ab 5 had
a n a v e r a g e v a lu e o f 1 3 .5 k N . T h e s p e c i m e n s t e st e d b y L a b 5
wer e f r om t he f i r s t mi x and t he r e was a t endency f o r t he mi x t o
be a l i t t l e dry thereby causing an increase in s t rength [8] .
Ho wev er , t h i s i nc r ease i n s t r eng th i s no t s i gn i fi can t in abso l u t e
t e r m s i . e . t h e a v e r a g e v alu e o f t he m a x i m u m l o a d tb r L a b 5
w a s f o u n d t o b e a p p r o x i m a t e l y 2 k N ( ~ 1 5 % i n c re a s e ) m o r e
t han t he o t he r te s t i ng l ab ave r ages . T h i s d i f f e r ence shows u p i n
C o n c r e t e
g r a d e
F i b r e
d o s a g e )
r2
e q
t t 3
O
t ~
Note:
T a b l e 7 - C o m p i l a t i o n o f A N O V A a n a ly s is r e s u lt s f or p la i n c o n c r e te b e a m s
Stat i s t ica l
p a r a m e t e r s
u 3
v 17
f-ratio 7.56
f c r i t 3 .20
fffcrit 2.36
u 2
v I I
f-ratio 4.08
f-cri t 3.98
t7 ~t 1.02
Po.1
L oad , P , a t p r e s c r i b e d a v e r a g e ~5 v a l u e s
P0a5 P0.2 Poa5
3 3 3 3
17 17 17 17
3. t 4 2.43 1.95 1.46
3.20 3.20 3.20 3.20
0.981 0.760 0.609 0,455
11
2
11
1 11
3.48 2.05 1.32 129
3.98 3.98 3.98 3.98
0.516 t.873
0.333
0.325
V0.3
3 3
17 17
1.30 1.42
3.20 3.20
0.405 0.443
2 2
ll 11
1.51 2.95
3.98 3.98
0.379 0.74i
, , , Area
u n d e r t h e
P0 .4 P -5 curv e
3
t4
0.851
3.34
0.255
2
9
3.07
4.46
0.690
Figures in bold indicate tTt~it atios greater than unity
P• indicates the load at the prescribed 6 value of x mm
6 1 5

8/9/2019 Round-robin analysis of the RILEM TC 162-TDF -.pdf
http://slidepdf.com/reader/full/round-robin-analysis-of-the-rilem-tc-162-tdf-pdf 8/12
T C 1 6 2 - T D F
T a b l e 8 - C o m p i l a t i o n o f p o s t - h o e t es t re s u l t s o n p l a i n c o n c r e t e b e a m s
Concrete
grade (Fibre
dosage)
t t ~
r
p
L)
Post -hoe Load P at prescr ibed average ~ values Area
under the
test
Pmax
Poa Poas Po .2 Po.2s Po.3 Po.4 P-~5curve
1-5
Scheff6 2-5 * * * * * *
3-5
1-5
Bonfer roni 2-5 * * * * * *
3-5
Scheff~ * * * * * * *
Bonfer roni * * * * * * *
No t e :
1-5 means s igni f icant d i f ference observed for resul ts be tween labs 1 and 5
* mean s no statist ical differenc e identified
t he i n t e r - l a b va r i a t i on s t a t i s t i c a l a na l y s i s be c a us e t he
c o e f f i c ie n t o f v a r i a t io n o f t h e m a x i m u m l o a d i s l o w a n d
s u b s e q u e n t l y m a g n i f i e s t h e i m p a c t . I f L a b 5 i s d is r e g a r d e d f o r
t he p l a i n NSC be a ms , i t i s obv i ous t ha t t he i n t e r - l a b d i f f e r e nc e
i n th e m a x i m u m l o a d i s n o t a s s i g n i fi c a n t a s b e t b r e ( a v e r a g e s
o f 11 . 4 t o 11 .8 kN ) .
T h e r e f o r e , i t i s s a f e t o a s s u m e t h a t d i f l 'e r e n c e s i n t h e t e s t
s e t - u p s a r e m i n i m a l i n t h e s e n s e t h a t i t s h o u l d n o t a d v e r s e l y
a f f e c t t h e b e a m t e s t r e s u l t s t o t h e p o i n t w h e r e t h e v a r i a t i o n
d u e t o d i f f e re n t s e t - u p s o v e r s h a d o w t h e v a r i a ti o n d u e t o t h e
m a t e r i a l i t s e l f
W i t h r e s p e c t to t h e S F R C b e a m s , f o u r t y p e s o f c o n c re t e w e r e
t e s t e d : t h e N S C b e a m s w i t h f i b r e d o s a g e s o f 25 , 50 a nd
7 5 k g / m3 , t oge t he r w i t h HSC be a ms wi t h a s i ng l e f i b r e dos a ge
o f 2 5 k g / m 3 . T a b l e s 9 t o 1 2 s h o w a c o m p i l a ti o n o f t h e A N O V A
a nd pos t - hoc a na l y s i s r e su lt s. S i gn i f i c an t d i f f e r e nc e s be t we e n
t he t e s ti ng l a b s a r e de t e c t e d i n ma ny o f t he va l ue s c ons i de r e d f o r
t h e N S C b e a m s w i t h f ib r e d o s a g e s o f 2 5 a n d 5 0 k g / m 3. Tab les
10 a nd 12 s how t he r e s u l t s o f t he pos t - hoe t es t s. L i ke t he
t he va r i a b i l i t y i s i n t he ma t e r i a l
due t o f i b r e va r i a t i on a t t he
f a i l u r e s e c t i on . Ano t he r
pos s i b i l i t y i s t ha t t he t e s t
s p e c i m e n s h a v e r e l at i v e ly s m a l l
c r o s s s e c t i ons . Cons e que n t l y , a
s ma l l va r i a t i on o r d i f f e r e nc e i n
t he nm nbe r o f :f ib r es ha s a d i r e c t
a nd a r e l a t i ve l y l a r ge i n f l ue nc e
o n t h e t o u g h n e s s o f t h e m a t e ri a l
t e s t e d . T h i s w o u l d b e m o r e
p r o n o u n c e d i n s p e c i m e n s w i t h
l o w f i b re d o s a g e s .
5 . 5 W i t h i n - m i x
v a r i a t i o n
A n o t h e r s o u r c e o f v a r i at i o n
i s t h e i n h e r e n t v a r i a t i o n s
e x i s ti n g w i t h in a n y o n e m i x . T h e r e w e r e t o o m a n y
s p e c i m e n s i n v o l v e d w i t h i n t h e r o u n d r o b i n t e s t p r o g r a m m e
t ha t t h e y c o u l d n o t b e p r e p a r e d i n o n e g o . I n s t e a d , t h e y h a d
t o b e f a b r i c a t e d i n b a t c h e s i . e . s e v e r a l c o n c r e t e m i x e s w e r e
p r e p a r e d . T o i n v e s t i g a t e t h e i n h e r e n t m a t e r i a l v a r i a t i o n , t h e
r e s u l t s w e r e f u r t h e r c o n s i d e r e d b y s e p a x a t i n g t h e r e s t d t s
a c c o r d i n g t o t h e m i x f r o m w h i c h t h e y w e r e m a d e . T h i s ,
h o w e v e r , w a s o n l y d o n e f o r th e N S C b e a m s a n d th e N S C
b e a m s w i t h 5 0 k g / m 3 o f f i b re s
i . e .
s p e c i m e n s f r o m t h e f i rs t
p h a s e o f t h e r o u n d r o b i n p r o g r a m m e . T o e f f e c t i v e l y
i n v e s t i g a t e t h e e f f e c t s o f w i t h i n - m i x v a r i a t i o n , i t i s l o g i c a l
t h a t o n l y t h e f i r s t p h a s e r e s u l t s b e u s e d , a s a l l t h e b e a m
s p e c i m e n s f a b r i c a te d f r o m a n y p a r t i c u la r m i x w e r e s e n t t o
o n e t e s t i n g l a b o n l y ( a n d n o t d i s tr i b u te d a m o n g s t t h e t e s t i n g
l a b s ) . D u r i n g t h e f i r s t p h a s e , e a c h t e s t i n g l a b r e c e i v e d e i g h t
b e a m s , w i t h f o u r b e a m s c o m i n g f r o m o n e m i x . A s i m i l a r
a n a l y s i s c o u l d n o t b e c a r r ie d o u t o n t h e s e c o n d p h a s e
s p e c i m e n s b e c a u s e i n t h e s e c o n d p h a s e , e a c h t e s t i n g l a b
A N O V A t ec hn iq ue , T a b l e 9 - C o m p i l a t i o n o f A N O V A a n a l y s i s r e s u l t s f o r S F R C b e a m s
m a n y d i f f e r e n c e s a r e
o b s e r v e d f o r t h e a b o v e
C o n c r e t e
gra de 07ibre Pmax
m ent io ned con cre te dosage) P0.5 PL0
types, u 4 4 4
The r e s e e m s t o be a ~ v 23 22 22
sys te m at ic in t rod uct ion ~ f - ra t io 6 .97 2 .73 4 .13
o f va r i a t i on due t o t he ~ bc r i t ic a l 2 . 80 2 . 82 2 . 82
resul t s f rom La b 4 for ~ f/s 2 .49 0 .969 1 .46
the C2 5/3 0 wi th 25 , .- , u 4 4 4
O
k g / m 3 o f f i b r e s. ~ v 29 29 30
H ow ev er , th is i s no t a ~ f - ra t io 2 .62 1 .96 2 .59
cau se for con cern , as ~ f -cr it ica l 2 .70 2 .70 2 .70
La b 4 doe s no t app ear f /ref it 0 .969 0 .726 0 .957
i n t he pos t - h oc a na l y s i s ~ u 3 3 3
t-- v 15 15 15
f o r t h e o t h e r S F R C
types . Th ere tbre , there r f - ra t io 0 .735 0 .682 0 .457
i s n o
i n t e r l a b
~ f-crit ical 3.29 3.29 3.29
f / t~ 0 .223 0 .207 0 .139
s y s t e m a t i c i n t r o d u c t io n
u 3 3 3
o f v a r i a t i o n h e n c e
cq v 16 16 t6
sug ges t ing tha t the ~ f - ra t io 4 .11 2 .25 2 .06
d i f f e r e n c e s d o n o t
f-crit ical 3.24 3,24 3.24
o c c u r d u e t o t h e t e s t ~
f r e f i t
1.27 0.695 0.636
s e t - ups a l one . A mor e
l i ke l y pos s i b i l i t y i s t ha t No t e :
Statistical
parameters
Ar e a t o
PLS P~.o
P2 5 P3 O
8 = 3mm
4 4 4 4 4
22 22 22 21 22
5,03 5,42 6.12 7.37 3.83
2.82 2.82 2.82 2.84 2.82
1.79 1.92 2.17 2.59 1.36
4 4 4 3 3
29 28 27 24 24
2.91 3.15 3.53 3.78 3.80
2.70 2.71 2.73 3.01 3.01
1.08 1.16 1.29 1.26 1.26
3 3 3 3 3
15 15 14 13 13
0.509 0 .566 i . 04 0 .958 0 .892
3.29 3.29 3.34 3.41 3.41
O. 155 O. 172 0.312 0.281 0.26 2
3 3 3 3 3
16 16 16 15 15
1.81 1.82 1.79 2.12 2.34
3.24 3.24 3.24 3.29 3.29
05 58 0 .561 0 .552 0 .645 0 .712
Load P at prescr ibed average 5 values
Figure s in bo ld indicate f/fr ratios greate r than unity
Px indica tes the load a t the prescr ibed f i va lue o fx m m
6 1 6
8/9/2019 Round-robin analysis of the RILEM TC 162-TDF -.pdf
http://slidepdf.com/reader/full/round-robin-analysis-of-the-rilem-tc-162-tdf-pdf 9/12
Materials and Structures /Mat ~ria ux
e t Cons t ruc t ions
Vol. 36, November 2003
T a b l e 1 0 - C o m p i l a t i o n o f p o s t - h o e r e su l t s o n S F R C b e a m s
C o n c r e t e
g r a d e F i b r e
d o s a g e )
C25/30(25)
C25/30 50)
C25/30(75)
C70/85(25)
P o s t - h o e
t e s t P ~ x
Scheff6 3-4
Bonferroni 3-4
Scheff6 *
Bonf?rroni *
Scheffd *
Bonferroni *
Scheff6 /-2
Bonferroni 1-2
Note:
L o a d , P , a t p r e s c r i b e d a v e r a g e 6 v a l u e s A r e a
to f i =
P o .5 P ; .o P ~ .s P 2 ,0 P 2~ P 3 . 0 3r a m
4-I 4-1
4-1
* * 4-2 4-2 4-5 *
4-2
4-5 4-5
4-1 4-1 4-14-1
* 2-4 4-2 4-2 4-2 2-4
4-2
4-5 4-5 4-5
* * * * * 1 - 5 *
* * * l - 5 1 - 5 1 - 5 1 - 5
,
,
3-4 means significant difference observed between labs 3 and 4
* means no statistical difference identified
T a b l e 1 1 - C o m p i l a t i o n o f A N O V A a n a l y s i s
f o r R I L E M a r a m e t e r s
C o n c r e t e
g r a d e F i b r e S t a t i s t i c s
d o s a g e )
u 4 4 4
v 23 23 23
C25/30(25) f-ratio 6 . 9 7 1.85 3.07
f-critica l 2.80 2.80 2.80
f/f~it 2.49 0.660 1.10
u 4 4 4
v 28 28 28
C25/30(50) f-ratio 1.50 1,92 3.11
f-critical 2.71 2.71 2.71
f/fcrit 0.554 0.708 1.15
u 3 3 3
v 15 15 14
C25/30(75) f-ratio 2.71 0.678 0.956
f-critical 3.29 3.29 3.34
fff~rit 0.824 0.206 0.286
u 3 3 3
v 16 16 16
C70/85(25) f-ra tio 3,78 1.99 1,91
f-critical 3.24 3.24 3.24
f/ f~ 1.17 0.613 0.588
Note: Figures in bold indicate f/~:rit atio greater
than unity
fr~, f~q2 f~3
T a b l e 1 2 - C o m p i l a t i o n o f p o s t - h o c t e s t r e s u l ts o n
R I L E M
C o n c r e t e
gr a d e F i b r e P o s t - h oe t e s t t fc f cq 2 f~q3
d o s a g e )
Scheff~ 3-4 * *
C25/30(25) Bonf~rroni 3-4 * *
Scheff6 * * *
C25/30(50) Bonferroni * * *
Scheft~ * * *
C25/30(75) Bonferroni * * *
Scheff~ * * *
C70/85(25) Bonferroni 2-4 * *
Note: 3-4 means signifi cant difference observed for
restdts between labs 3 and 4
9 means no statistical di fference identified
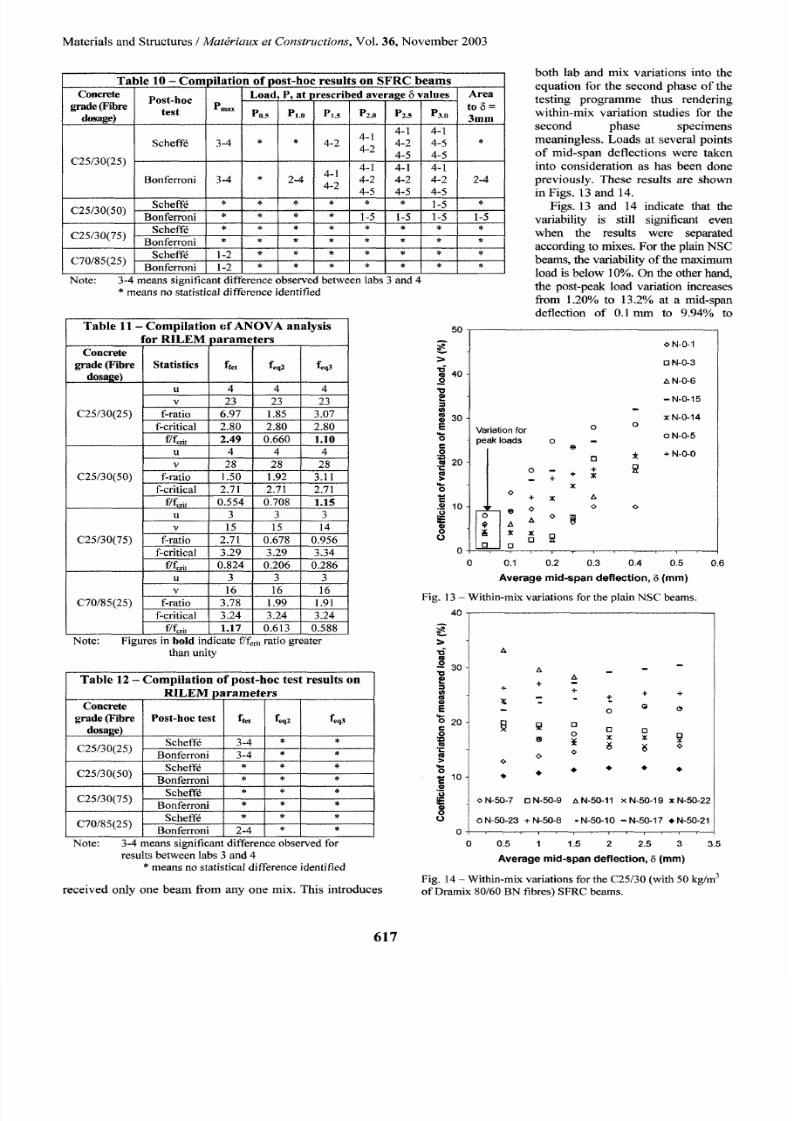
received only one beam from any one mix. This introduces
50
both lab and mix variations into the
equation for the second phase of the
testing programme thus rendering
within-mix variation studies for the
second phase specimens
meaningless. Loads at several points
of mid-span deflections were taken
into consideration as has been done
previously. These results are shown
in Figs. 13 and 14.
Figs. 13 and 14 indicate that the
variability is still significant even
when the results were separated
according to mixes. For the plain NSC
beams, the variability of the maxi mum
load is below 10%. On the other hand,
the post-peak load variation increases
from 1.20% to 13.2% at a mid-span
deflection o f 0.1 turn to 9.94% to
==
W
3 0 8 4
E
6
P
6
I
0
o
Variation o r
p e a k l o a d s
O O
O
e
o - +
§ X
_ +
0
+ X
@ <> 0
• N-0-1
r~ N-0-3
A N-0-6
- N -0 -15
x N - 0 - 1 4
o N-0-5
+ N - 0 - 0
0 .1 0 .2 0 .3 0 .4 0 ,5
A v e r a g e m i d - s p a n d e f l e c ti o n , 5 m m )
0.6
Fig, 13 -Within-m ix variations for the plain NSC beams.
40
>
v~
E
to
s..
>
3 0
2 0
I 0
A w
A
+
+ + +
Q
" O
0 0
0 X X
r
,0
o N - 5 0 - 7 o N - 5 0 - 9 / x N -5 0 - 1 1 x N - 5 0 - 2 2
o N - 5 0 - 2 3 + N - 5 0 - 8 - N - 5 0 - 1 0 - N - 5 0 - ~ 7 r
0 .5 1 1 .5 2 2 .5 3 3 .5
A v e r a g e m i d - s p a n d e f l e c t io n ,
5 ( m m )
Fig. 14 - With in-mix variat ions for the C25/30 (with 50 kg/m 3
of Dramix 80/60 BN fibres) SFRC beams.
6 1 7
8/9/2019 Round-robin analysis of the RILEM TC 162-TDF -.pdf
http://slidepdf.com/reader/full/round-robin-analysis-of-the-rilem-tc-162-tdf-pdf 10/12
TC 162-TDF
32.0% at a m id-span deflection of 0.4 mm . Clearly, mo st of the
values of V lie above 10% . However, arguably, the m ost
important coefficient of variation for the plain concrete
specimens is that fbr the maximum load. Since this is within
the arbitrary benchmark of 10%, the test method is robust
where intra-lab tests (with styzcimens fi'om a particular mix)
are concerned.
As tbr the resul ts for the NSC beams with 50 kg/m 3 of
fibres, the variations are much higher. The load varies
approximately from 10% to 30% w ithin the range of mid-
span deflections considered.
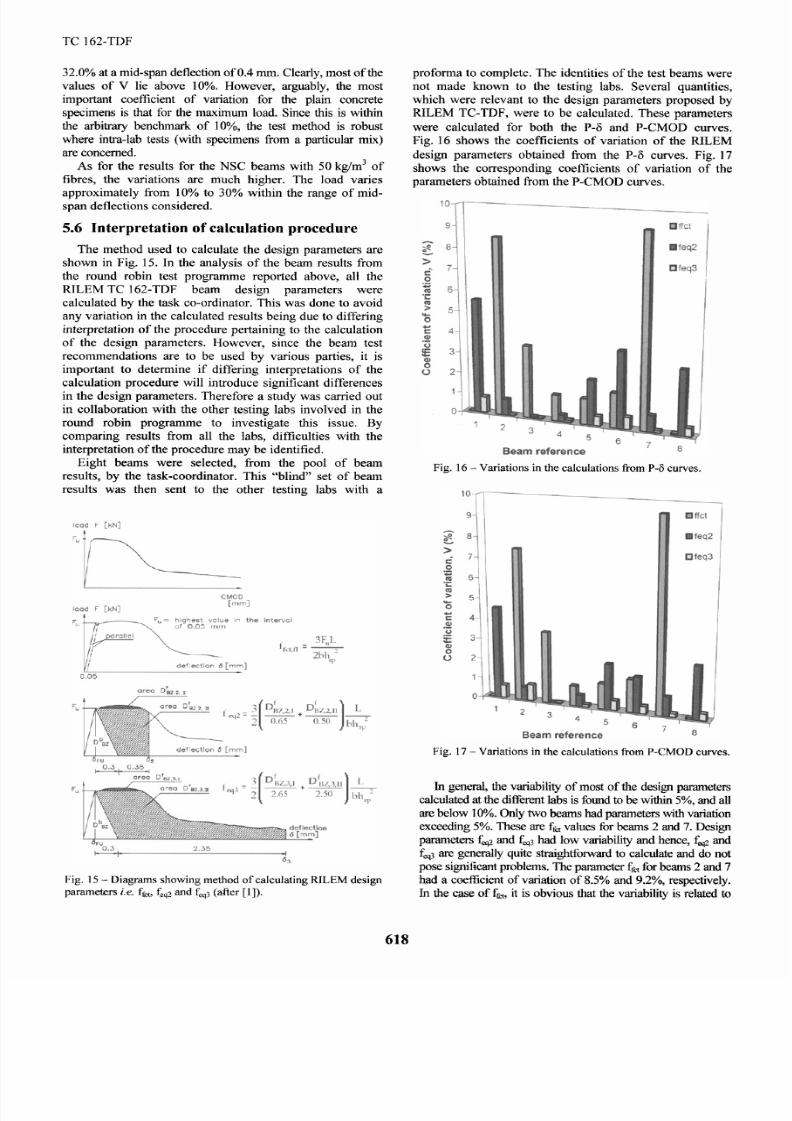
5 6 Interpretation of calculation procedure
The method used to calculate the design parameters are
shown in Fig, 15. In the analysis of the beam results from
the round robin tes t programme reported above, al l the
RIL EM TC 162-TDF beam design parameters were
calculated by the task co-ordinator. This was done to avoid
any variation in the calculated results being due to differing
interpretation of the procedure pertaining to the calculation
of the design parameters. However, since the beam test
recommendations are to be used by various parties, i t is
important to determine i f di ffering interpretat ions of the
calculation procedure will introduce significant differences
in the design parameters. Therefore a study was carried out
in collaboration with the other testing labs involved in the
round robin programme to invest igate this issue. By
com paring results from all the tabs, difficulties with the
interpretation of the procedure m ay be identified.
Eight beams were selected, from the pool of beam
results , by the task-coordinator. This bl ind set of beam
results was then sent to the other testing labs with a
protbrma to complete. The identi t ies of the tes t beams were
not made known to the testing labs. Several quantities,
which were relevant to the design parameters proposed by
RILEM TC-TDF, were to be calculated. These parameters
were calculated for both the P-8 and P-CMOD curves.
Fig. 16 shows the coefficients of variat ion of the R1LEM
design parameters obtained from the P-8 curves. Fig. 17
shows the corresponding coefficients of variat ion of the
parameters obtained from the P-CMO D curves.
Fig. 16 - Variations in the calculations from P-8 curves.
Fig. 17 - Variations in the calculations from P-CMO D curves.
Fig. 15 - Diagrams showing method of calculating RILEM design
parameters
i e
fa t, f~q2and feq3 after [1]).
In general, the variability o f most o f the design par.meters
calculated a t the different labs is foun d to be wilhin 5%, an d all
are below 10%. Only two be ams had Fararneters with variation
exceeding 5% . These are ~a values fbr beams 2 and 7. Design
p ~ e r s t ~ and t~q had low variability and hence, ~ and
f~a3 are geneea lly quite s~aighfforw-ard o calculate and do no t
pose significant probk~ns. The parmnc§ f~ f or beams 2 and 7
had a coefficient of vaf i~ on of 8.5% and 9.2%, respectively.
In th e case o f f~.~, t is obviou s that the va aab ility is related to
618
8/9/2019 Round-robin analysis of the RILEM TC 162-TDF -.pdf
http://slidepdf.com/reader/full/round-robin-analysis-of-the-rilem-tc-162-tdf-pdf 11/12
Ma t er i a l s and S t ruc t u res /
M a t d r i a u x e t C o n s t r ~ w t i o n s
Vol . 36 , No vem ber 2003
difficulties in determining F~, becaus e o f their direct relationship.
Al t hou gh t he p rocedure t b r ca l cu l a t i ng t he r equ i r ed
des i gn paramet er s does no t seem t o have s i gn i f i can t
p rob l em s i n i n t e rp re t a t ion , i t is never t he l ess qu i t e a l en g t hy
and r e l a t i ve l y d i f f i cu l t p rocedure t o car ry ou t . The
procedure i n ob t a i n i ng the necessa ry des i gn paramet er s can
be s i mp l i f i ed i f r es i dua l s t r eng t hs a t p rede t e rmi ned
def l ec t i ons (o r CM OD s) a r e u sed i n s t ead . Th i s is des i r ab le ,
as i t w i l l r educe t he t i me needed t o ca l cu l a t e t he des i gn
paramet er s . In add i t i on , i t w i l l t he i l i t a t e t he poss i b i l i t y o f
m e a s u r i n g C M O D a l o n e to o b t a i n t h e p a ra m e t e r s a s i t h a s
been fou nd t ha t t here i s a s i mp l e r e l a t ionsh i p be t ween 8 and
CM OD [3 , 4 ] . Thus , i f on l y r es i dua l s t r eng ths a r e needed
( i ns t ead o f spec i f i c a r eas under t he cu rve) , t he ca l cu l a t i on
p r o c e d u r e a n d t h e t e s t m e t h o d c a n b e s i m p l if ie d .
6 . C O N C L U S I O N
T o e v a l u a te t h e r e p r o d u c ib i li t y o f t h e R I L E M T C 1 62 -
TD F p roposed beam t es t, a s t udy on t he var i a t ion o f t he
round rob i n beam t es t r esu l t s was per fo rmed . F rom t he
s t udy o f t he i n t r a - lab var i a t i ons , i t is ev i den t t ha t mos t o f
t he var i a t i ons i n t he pos t -peak r eg i me fo r bo t h t he p l a i n
concre t e and SFR C beam s are s ign i f i can t .
t lowe ver , the in t ra- lab v ar iat ions f i~r he m axim um load tbr
t he p la i n concre te beams w ere w i t h in 1 0% . As t he mos t
important parameter for the p lain concrete beam is the
maximum load, this suggests that the test is robust , at least
where intra-lab variat ion is concerned. In addit ion, from the
intra-lab var iat ions, there does no t seem to be any sy stemat ic
large o r smal l var iat ion com ing f rom any on e par ticular lab
i . e .
one par t icular lab does no t have a large (or smal l ) var iat ion for
al l of the co ncrete types involved. This suggests that there
cot f ld be more than one source of var iat ion. Thus fur ther
investigations w ere carried out to iden tify the source o r sources
o f variations. M ore importantly, th e investigations ai m to
ident i fy the m ajor source of var iat ion.
Therefo re , i t i s sa f e to a ssum e t ha t d i f f e r ences i n the t es t
se t -ups a r e mi n i mal i n t he sense t ha t i t shou l d no t adver se l y
af f ec t t he beam t es t r esu lt s t o t he po i n t where t he var i a t i on
due t o d i f f e r en t se t -ups over shad ow t he var i a t ion due t o t he
ma ter ial i t sel f.
S i mi l a r t es t s on t he SFRC beams , however , i nd i ca t e t ha t
t here seem s t o be s i gn i f i can t d i f f e r ences i n r esu l ts f rom t he
d i f f e r en t t es ti ng l abs . How ever , t he s t a t i s t ica l t es ts assum e
t ha t t he spec i mens a l l o r i g ina t e f rom a s i ng l e popu l a t i on
i . e .
f rom a s i ng l e mi x . Th i s c l ear l y i s no t t he case and hence ,
t he i nheren t mat er i a l var i a t i on was s t ud i ed .
The w i t h i n -mi x var i a ti on s t udy was based up on t he p l a i n
N S C b e a m s a n d t h e N S C b e a m s w i t h 5 0 k g / m 3 o f f i b res.
Th i s i s because fo r t he f i r s t phase , t he beams r ece i ved by
e a c h l a b c o m e f r o m t w o m i x e s , e a c h c o n t r i b u t i n g f o u r
beams . On t he o t her hand , fo r t he second phase , each
t es t i ng l ab r ece i ved 6 beanas , a l l comi ng f rom d i f f e r en t
mi xes . Thus , t he var i a t i ons wi t h i n t he se cond phase r esu l t s
have b o t h t he i n f l uence o f in t e r - lab and w i t h i n -mi x (o r
i nheren t mat er i a l ) var i a t ions w i t h i n t hem.
From t he wi t h i n -mi x s t ud i es , i t i s apparen t t ha t t he
var i a t i on wi t h i n a m i x i t se l f i s r e l a t i ve l y h i gh . Mos t o f t he
V va l ues a t severa l p rescr i bed average mi d - span def l ec t i on
v a l u e s a r e a b o v e 1 0% ( e x c e p t f o r th e m a x i m u m l o a d f o r t h e
p l a i n concre t e beams) . T he var i ab i l i t y o f t he measu red l oad
wi t h i n t he r ange o f mi d - spa n def l ec t i ons cons i dered ( fo r t he
N S C b e a m s w i t h 5 0 k g / m 3 o f f i b re s ) i s f o u n d t o b e 1 0 % t o
3 0 % .
From t he i n t e r - l ab and wi t h i n -mi x s t ud i es , i t can be
concl uded t ha t t he i nheren t mat er i a l var i ab i l i t y i s t he
dom i nat i ng f ac t o r i n t he r e l a ti ve l y h i gh var i a t ions observed
i n t he round rob i n t es t p rog ram me .
A genera l s t udy o f t he var i a t i on due t o t i m t ype o f
ma t er i a l shows t ha t t here i s a decrease i n t he var i ab i li t y as
t he f i b re con t en t i s i ncreased . A change i n t he concre t e
s t r eng t h mat r i x f rom a no rmal s t r eng t h g rade t o a h i gh
s t r eng t h g rade does no t seem t o i mprove mat t e r s . I t i s
t herefo re ev i den t t ha t t he f f t~ re con t en t i s t he over r i d i ng
fac t o r i n i n f l uenc i ng the var i ab i l i t y i n t he bea m t es t r esu lt s .
The r eason und er l y i ng t h i s observa t i on is t ha t as t he l imi t o f
t h e a m o u n t o f f i b r e t h e c o n c r e t e m i x c a n a c c o m m o d a t e i s
app roached , t he p robab i l i t y o f ge t t i ng a more un i fo rm mi x
i s i mproved . Th i s wou l d r educe t he var i ab i l i t y i n t he f i b re
d i s t r ibu t i on and t hus t es t r esu l t s wi t h l ower var i ab i l it y can
be expec t ed .
Af t e r a t ho rough ana l ys i s o f t he var i a t i on i n t he bem-n
r e s u lt s i n t e ~ s o f b o t h i n tm - l a b , in t e r- l a b a n d w i t h in - m i x
var i a t i on , i t can be sa i d t ha t t he poss i b i l i t y o f ach i ev i ng a
10% convergence be t ween r esu l t s i s no t poss i b l e fo r t he
f i b re con t en t s cons i dered . Even w i t h i n a g i ven l ab and mi x ,
a c o n v e r g e n c e o f 1 0% a m o n g s t b e a m r e s u l ts w o u l d b e
ex t r em el y d i f f i cu l t t o ach i eve . Th i s i s due t o t he d i f f i cu l t y
i n a c h i e v i n g a u n i t b r m f i b r e d i s ~ b u t i o n e s p e c i a l l y w i t h
l ow f i b re con t en t s . An o t her poss i b l e r eason fo r t _he h i gh
var i a t i on i s t ha t t he t es t spec i mens have r e l a t i ve l y smal l
c ross sec t i ons . A smal l var i a t i on o r d i f f e r ence i n t he
number o f f i b res has a d i r ec t and a r e l a t i ve l y l a rge
i n f l uence on t he t oughne ss o f t he mat er i a l t es ted . Th i s
p h e n o m e n o n w o u l d b e m o r e p r o n o u n c e d i n s p e c im e n s w i t h
l ow f i b re dosages .
To i nves t i ga t e t he var i a t i on t o r esu l t s due t o
i n te r p r e ta t io n o f t h e R I L E M T C 1 6 2 -T D F c a l c u la t io n
p rocedure , e i gh t b l i nd beam t es t r esu l t s were sen t t o
var i ous t es t i ng l abs . The v ar i a t ions i n t he ca l cu l a t ions were
t hen a na l ysed . I t was found t ha t , i n genera l , t he var i a t i on in
t he c a l cu l a t ed va l ues o f t he RIL EM des i gn param et er s , t]-~t,
s a n d t;~q.~were wi t h i n 5%. The des i gn param et er s f cq2 and
f~q3 had very low var iab i l i ty for al l the bea ms and i t i s no t
an t i c i pa t ed t ha t t here wi l l be any maj o r p rob l ems i n t he
i n t e rp re t a t ion o f t he p rocedure t o ca l cu l a t e t hem.
I t i s p roposed t ha t t he p rocedure i n ob t a i n i ng t he
nece ssary des i gn paramet er s be s i mp l i f i ed by us i ng res i dua l
s t r eng t hs a t p rede t e rmi ned def l ec t i ons (o r CMODs) . Th i s
wi l l r educe t he t i me needed t o ca l cu l a t e t he des i gn
paramet er s . Moreover , i t w i l l f hc i l i t a t e t he poss i b i l i t y o f
m e a s u r i n g C M O D a l o n e t o o b t a i n t h e p a r a m e t e r s u s i n g a
s i mp l e r e l a t i onsh i p be t ween 6 and CMOD [3 , 4 ] . Hence
wi t h t he u se o f r es i dua l s t r eng t hs i n s t ead o f spec i f i c a r eas
under t he cu rve , t he ca l cu l a t i on p rocedure and t he t es t
me t hod can be s i mp l i f i ed .
From t he exper i ence and a na l ys i s carr i ed ou t wi t h r egards
t o t he r ecom mend ed beam-bend i ng t es t, i t was found t ha t the
t es t was a good an d robus t t es t i ng sys t em. I t was found t ha t
al though in ter- lab var iat ions do occur , th i s was relat ively
sma l l com pared to the inherent mater ial var iat ion.
6 9
8/9/2019 Round-robin analysis of the RILEM TC 162-TDF -.pdf
http://slidepdf.com/reader/full/round-robin-analysis-of-the-rilem-tc-162-tdf-pdf 12/12
T C 1 6 2 - T D F
ACKNOWLEDGEMENTS
The work reported in this paper tbrms part of the Brite-
Eurana project Test and Design M ethods for Steel Fibre
Reinforced Conca'ete , contract no. BRPR -CT98-0813. The
partners in the project are: N.V. B ekaert S.A. (Belgium co-
ordinator), Centre Scientifique et Technique de la Construction
(Belgium), Katholieke Universi tei t Leuven (Belgium),
Technical University o f Denm ark (Denmark), B al tbur Beat ty
Rail L td (Great Britain), University o f Wales C ard iff (Great
Britain), Fert ig-Decken-Union GmbH (Germany), Ruhx-
Universi ty-Bochum (Germany), Technical Universi ty of
Braunschweig (Germany), FCC Construccion S,A. (Spain),
Universi tat Polyt6cnica de Cata lunya (Spain).
REFERENCES
[ ]
RILEM T C t62-TDF, 'R1LEM TC 162-TDF: Test and design
methods for stee l fibre reintbrced concrete. Be ndin g test.
Recommendations' ,
Mater Struct
33 (22 5) (2000) 3-5.
[2] Taylor, M.R. , Lydon, F.D . and Ba n ' , B.LG. , 'Mix
proportions tbr high strength concrete',
Cons t ruc t ion and
Bui ld ing Mater ia l s
10 (6) (1996)445-4 50.
[3] B arr , B.I.G. and Lee, M.K., 'Definit ion o f round robin test .
Preparation of specimens. Execution and evaluation of
round robin testing' , R epor t for Test and D esign Methods
for Ste el Fibre Reinforced Concrete, EU Contract-BRPR -
CT98-813 (2001 ) 105 p.
[4] Ba rr, B.I.G., Le e, M .K, de Place Hansen. E.J. , Dupont, D.,
Erdem , E., Sc haerlaekens, S., S chn[itgen, S., Stan g, H. and
Van dew alle, L., 'Rour_~l-robinanalysis of the R ILEM TC 162-
TDF beam-bending test : Part 2 - Approximation of/5 from
CMO D response' ,
Mater Struct
36 (263) (2003) 621-630.
[5] Cramer ,D., 'Fundam ental statistics for social research: step-
by-step calculations and computer techniques using SPSS
for W indow s', Routledge , 1998.
[6] W ads wo rth, H.M., 'Handbook of Statist ical Methods For
Engine ers and Sc ientists, 2nd edition', (Mc Graw -Hill, 1998).
[7] K ee pin g, E.S., ' Introduction to Statis t ical Inference',
(Nostrand , 1962),
[8] N ev ill e, A.M ., 'Properties of Conc rete, 4 ~h edition',
(Longman Ltd, 1998).
62