Embed Size (px)
Citation preview

RTG 1666 GlobalFood ⋅ Heinrich Düker Weg 12 ⋅ 37073 Göttingen ⋅ Germany www.uni-goettingen.de/globalfood
ISSN (2192-3248)
www.uni-goettingen.de/globalfood
RTG 1666 GlobalFood Transformation of Global Agri-Food Systems:
Trends, Driving Forces, and Implications for Developing Countries
Georg-August-University of Göttingen
GlobalFood Discussion Papers
No. 18
Impact of Third-Party Enforcement of Contracts in Agricultural Markets –
A Field Experiment in Vietnam
Christoph Saenger Maximo Torero
Matin Qaim
January 2013

Impact of Third-Party Enforcement of Contracts in Agricultural Markets –
A Field Experiment in Vietnam
Christoph Saenger1, Maximo Torero2, Matin Qaim3
Abstract: We study the effect of alleviating information asymmetry regarding product quality
that is widespread in developing-country agricultural markets. Opportunistic buyers may
underreport quality levels back to farmers to reduce the price they have to pay. In response,
farmers may curb investment, negatively affecting farm productivity. In an experiment, we
entitle randomly selected smallholder dairy farmers in Vietnam to independently verify milk
testing results. Treatment farmers use 13 percent more inputs and also increase their output.
We show that the buying company had initially not underreported product quality, which is
why third-party monitoring led to a Pareto improvement in the supply chain.
JEL Codes: C93, D86, L14, O13, Q12, Q13
Acknowledgments: The authors thank Phi Van Le Thi, Trang Tran, Angelino Viceisza and
Holger Seebens for their support in implementing the field experiment and carrying out the
survey as well as participants at the BREAD Conference in Yale for helpful comments. The
financial support of the German Federal Ministry of Economic Development and Cooperation
(BMZ) is gratefully acknowledged.
1 Office of the Chief Economist, European Bank for Reconstruction and Development, One Exchange Square, London EC2A 2JN, United Kingdom, Email: [email protected] 2 International Food Policy Research Institute, 2033 K Street, NW, Washington, DC 20006-1002, USA, Email: [email protected] 3 Department of Agricultural Economics and Rural Development, Georg-August-University of Goettingen, Goettingen, Germany, Email: [email protected]

2
Introduction
Since Akerlof’s (1970) seminal paper on the market for used automobiles, the economics of
information has received considerable attention. Models of moral hazard, adverse selection
and signaling have been applied to study various domains of economic interaction, as diverse
as markets for labor, insurance, credit, real estate and even art (Ross 1973; Spence 1973;
Rothschild and Stiglitz 1976; Stiglitz and Weiss 1981; Grossmann 1981; Throsby 1994).
However, information asymmetry regarding product attributes is not only important in
transactions with metaphorical fruit such as lemons, but is also critical in markets for actual
agricultural produce, for example if special technology is required to assess non-visible
quality attributes, such as nutrient content or bacterial contamination, and costs of analysis
and measurement are prohibitively high for the selling farmer. Hence, in many agricultural
markets in which supply chain relations are facilitated through production contracts, the
principal (e.g. buying processor or wholesaler) has more information about output quality
than the agent (selling farmer). This information asymmetry gives scope for opportunistic
behavior on the side of the buyer who can accrue information rents from reporting lower than
actual quality levels, thus downgrading the price paid to the seller. Rational sellers forming
the belief that the buyer cheats will factor in the buyer’s opportunistic behavior, lowering their
expectations about product price. Thus, weak contract enforcement can induce sellers to
underinvest (Gow, Streeter and Swinnen 2000; Vukina and Leegomonchai 2006; Cungu et al.
2008). Underinvestment, i.e. suboptimal short-term input use or downsizing of investment in
long-term productive assets, leads to lower output, negatively affecting not only the agent’s
outcome but also increasing the principal’s per-unit transaction costs from procurement
(Saenger et al. 2013).
3
To overcome information asymmetry in the supply chain, more transparency, e.g. through
third-party quality measurement and verification, is one possible solution (Balbach 1998;
Sykuta and Cook 2001; Young and Hobbs 2002). In a laboratory experiment, Wu and Roe
(2007) have shown that third-party contract enforcement can be one way to successfully
mitigate underinvestment and enhance social efficiency. But as the laboratory systematically
differs from natural environments, external validity of this type of studies may be limited
(Levitt and List 2007). Over the past decade, randomized control trials (RCTs), in which
subjects take decisions in their natural environment, have been used extensively. Only
recently, RCTs have been carried out in the field of agriculture (Duflo, Kremer and Robinson
2008; 2011; Ashraf, Giné and Karlan 2009).
We contribute to the literature on RCTs in agriculture and information asymmetry in
contracts through a randomized field experiment, using the example of the fast growing
Vietnamese dairy industry in which third-party enforcement is missing. The industry is
characterized by a great number of small-scale dairy farmers who are contracted by a large
milk processing company. This is a typical situation for emerging markets for high-value
agricultural products in developing countries (Reardon et al. 2009; Rao, Brümmer and Qaim
2012; Bellemare 2012). In this field experiment, the contract of a randomly chosen subsample
of farmers, the treatment group, is altered such that it becomes third-party-enforced;
previously unobservable quality attributes are now measured and verified by an independent
and certified laboratory. Control group farmers continue to produce under the initial contract.
By comparing the outcomes of both groups we address the following research questions: (i)
Does contract enforcement through third-party verification of quality attributes lead to
increased production intensity and higher milk output, and (ii) does this intervention increase
the welfare of the smallholder milk producers?

4
For the field experiment we collaborated with a private dairy company that provided access
to weekly farm-level output data. These data are complemented with data from own
household surveys. We find that our intervention leads to higher input use and increased dairy
output. There is also a positive treatment effect with respect to household consumption
expenditures for a specific subgroup of the sample. We are able to attribute observed
differences in output to a behavioral change of farmers rather than the reporting strategy of
the buying company. Hence, in this specific case the buying company did not behave
opportunistically, but failed to signal its fair type to farmers. Third-party enforcement with
incomplete contracts can lead to Pareto improvement, as smallholders and buying companies
both benefit from increased farm productivity.
The Vietnamese Dairy Industry
In Vietnam, much like in other countries of Asia, milk is becoming an increasingly popular
food item leading to high growth rates in the dairy sector. For example, only two decades ago
the consumption levels of milk and dairy products were almost nil due to cultural practices
and low incomes. But with increasing income, urbanization tendencies and the spread of
Western lifestyle the demand for milk has increased tremendously (Saenger et al. 2013).
Today’s per-capita consumption of milk in Vietnam has reached 15 kg per annum, which is
about 8 percent of the amount being consumed in the US or Europe. Currently, the
Vietnamese dairy sector is dominated by local processing companies importing large
quantities of powdered milk from overseas to satisfy domestic demand. However, more and
more milk is produced domestically, especially by small-scale farmers. Fresh milk production
in Vietnam has tripled between 2003 and 2009, but it still meets only one-fifth of domestic
consumption (USDA 2011).

5
The leader in the dynamic dairy industry—and the cooperation partner in this field
experiment—is the formerly state-owned company Vinamilk. Vinamilk collects the major
share of milk produced in Vietnam and is also a main importer of powdered milk. Currently,
the company has contracted more than 5,000 small-scale dairy producers, most of them
located around Vietnam’s largest city and commercial capital Ho-Chi-Minh City (HCMC).
Supply-chain Architecture and the Standard Contract
In Vietnam, milk is produced mainly on specialized small-scale farms. Crossbreed dairy cows
are held in stables all year round. The major input is fodder; rations usually consist of forage
produced on farms, complemented with purchased fodder, primarily concentrate. Farmers
usually sell the entire milk output to one dairy processor. Alternative sales options are very
limited. Informal channels exist but can absorb only small quantities due to low demand for
highly perishable raw milk in rural areas. Hence, small-scale dairy farmers, who have
undertaken relationship-specific investment, have little bargaining power vis-à-vis large
monopsonistic dairy processors.
The raw milk is channeled through milk collection centers (MCC) located in the vicinity of
the dairy farms. An average MCC is supplied by about 100 farmers and is operated by a
private entrepreneur working on commission for the dairy processor, in our case Vinamilk.
Each MCC carries out the following tasks: collection and handling of the milk twice a day,
sampling of the milk, initial testing of quality (through staff deployed by the dairy processor)
as well as daily transport of raw milk to Vinamilk’s dairies in urban centers. The MCCs also
process the weekly payments to farmers.

6
The production contract between Vinamilk and dairy farmers is a country-wide
standardized, written agreement, determining how much milk of what quality is purchased at
which price. Until recently, it was quite costly to assess milk quality for each smallholder
farmer. Today, cheaper quality testing devices allow dairy companies to assess quality
individually for each farmer, which is a key requirement for traceability, quality management
and incentive pay. The output price for milk p received by farmers is a function of milk
quality 𝜃:
(1) 𝑝 = 𝑓(𝜃) .
Quality is a composite measure of several parameters, most importantly milk fat content
and total solid, which depend on input use 𝑥 and a random shock 𝑠 (e.g. animal disease,
changing fodder quality):
(2) 𝜃 = 𝑓(𝑥, 𝑠) .
On a daily basis, Vinamilk staff deployed at the MCC takes milk samples individually for
each farmer; one sample per week is randomly selected and analyzed in the dairy plant
employing sophisticated laboratory methods. Producers have unique identification numbers
and are paid individually according to their own output (q and θ). The base price for top-
quality milk is subject to harsh deductions if one or more of the quality parameters fall short
of the requirements set by the company. One-tenth of a gram of milk fat below the
threshold—a deviation far too small to be visually detected even by experienced farmers—
can trigger financial penalties. As milk analyses are carried out in the company’s own
laboratory and cannot be observed by farmers, milk quality remains private information of the
dairy company. Currently, smallholders cannot overcome the asymmetry of information
7
regarding milk quality by systematically cross-checking the results provided by the processor,
because individual milk testing is prohibitively costly, and collective action fails.
A Simple Model of Underinvestment
Building on a model described by Sandmo (1971), we formally derive how the asymmetric
information on quality attributes leads to lower input use and suboptimal output compared to
a situation of symmetric information. It is assumed that farmers maximize expected utility of
profits. The utility function is a well behaved, i.e. concave, continuous and differentiable
function of dairy farming profits.
The farmer’s cost function is defined as
(3) 𝑇(𝑞) = 𝑉(𝑞) + 𝐹,
where q is output, 𝑉(𝑞) is the variable cost function and F represents the fixed cost. Further
we assume that the cost function has the following properties:
(4) 𝑉(0) = 0, 𝑉′(𝑞) > 0.
In a contract with incomplete but symmetric information the profit function can be defined
as
(5) 𝜋(𝑞) = 𝑝𝑞 − [𝑉(𝑞) + 𝐹],
where the product of p and q is the total revenue (TR). Farmers maximize profits where
marginal revenue (MR) equals marginal cost (MC)
(6) 𝑀𝑅 = 𝑀𝐶,

8
where
(7) 𝑀𝑅 = 𝜕𝑇𝑅𝜕𝑞
= 𝑝
(8) 𝑀𝐶 = 𝜕𝑇𝜕𝑞
= 𝑇′(𝑞).
In this situation, θ is known to both participants in the transaction. We take this as the
benchmark and analyze how optimal input use changes when the buying company has private
information about θ. Exploiting its informational advantage, a rational dairy processor may
report a lower level of quality to the farmer than the quality actually assessed in the
laboratory. According to (1), withholding private information negatively affects the output
price, while increasing the residual income for the dairy processor. When there is asymmetric
information, a rational dairy producer i will form a specific belief to what degree the
processor underreports. This is represented by
(9) 𝑝𝑖𝑟𝑒𝑝𝑜𝑟𝑡𝑒𝑑 = 𝛾𝑖𝑝𝑖𝑡𝑟𝑢𝑒 + λi,
where the reported milk price 𝑝𝑖𝑟𝑒𝑝𝑜𝑟𝑡𝑒𝑑 is the actual price 𝑝𝑖𝑡𝑟𝑢𝑒 based on the milk quality
assessed in the laboratory, corrected by multiplicative and additive shift factors 𝛾𝑖 and λi. If
𝛾𝑖 < 1 then 𝑝𝑖𝑡𝑟𝑢𝑒 is reduced proportionally; if λi < 0 a lump sum is deducted at any given
level of 𝑝𝑖𝑡𝑟𝑢𝑒. For those farmer who believe that Vinamilk cheats we follow that
(10) 𝑝𝑖𝑟𝑒𝑝𝑜𝑟𝑡𝑒𝑑 < 𝑝𝑖𝑡𝑟𝑢𝑒.
If farmers maximize expected utility by setting marginal cost equal to marginal revenue, the
lower expected product price translates into lower marginal revenue. Hence, the optimal
output level q decreases given that farmers are price takers for inputs, and input prices remain
unchanged.

9
Third-party contract enforcement would mitigate the negative effect on the expected output
price level, because formerly unobservable quality attributes become verifiable for farmers,
forcing the dairy company to report the real output quality and thus output price. In terms of
the shift parameters, this implies that 𝛾𝑖 takes the value 1, while λi takes the value 0. If
plugged into the profit function, the higher expected output price would according to (6) lead
to more input use and higher output than in the current situation with information asymmetry.
How can farmers practically respond to higher expected output prices? Generally, they can
raise the output of milk fat and total solid—the value defining parts of the raw milk—in three
ways: (a) Increase the quality (milk composition) while keeping the milk quantity constant,
(b) keep the quality constant while increasing the quantity, or (c) simultaneously increase
quality and quantity. At the farm level, the goal of increasing the absolute quantity of milk fat
and total solid can be achieved in different ways. For example, in the short run, farmers can
increase the amount of purchased fodder (e.g. concentrate) to make the ration more nutritious.
All other inputs are de-facto fixed in the short term. The supply of forage produced on the
farm can only be increased in the medium or long run, as additional land would have to be
acquired. Likewise, total herd output could be raised by increasing the herd size through
buying cattle on the market or breeding. In the long run, selective breeding may also improve
the herd’s overall genetic potential for milk production.
Experimental Design and Implementation
After having outlined the theoretical framework of third-party contract enforcement, we now
describe the design and practical implementation of the intervention in which randomly

10
selected dairy producers were provided with the opportunity to verify milk testing results
provided by Vinamilk.
Every treatment farmer received three non-transferable vouchers, each valid for one
independent analysis of milk quality (milk fat and total solid). Vouchers were meant to be
executed whenever eligible farmers challenged the testing results reported by Vinamilk.
Providing farmers with third-party quality verification implied setting up complex transport
and testing logistics. For each milk sample obtained at the MCC under the original contract
(hereafter A-sample), an additional identical sample (hereafter B-sample) had to be taken for
each treatment farmer. The B-sample was sent to an independent and certified laboratory in
HCMC where it was stored. If a farmer executed a voucher, the B-sample was analyzed by
the third-party laboratory and the testing results were reported by mail to the farmer. This
allowed the farmer to compare if the results based on the A-sample reported by Vinamilk are
identical to the results of the corresponding B-sample provided by the independent laboratory.
While Vinamilk knew the identity of the treatment farmers, the actual execution of
vouchers could not be observed, i.e. the dairy company did not know when an individual
farmer in the treatment group executed her voucher. Hence, there was a constant threat to the
company that any of the farmers in the treatment group could in any given week verify their
testing results, effectively eliminating the possibility that Vinamilk behaves opportunistically.
Compared to validating the results of every sample analyzed by Vinamilk, the voucher
mechanism enabled us to implement a system to systematically overcome the information
asymmetry on milk quality attributes at relatively low cost. All outlays arising from setting up
a parallel testing infrastructure for the B-samples and milk analyses were borne by the project,
ruling out that farmers would not request independent milk testing for cost reasons.

11
The logistics of the voucher treatment are complex. Thus, it was especially important that
both the treatment farmers delivering milk and the Vinamilk staff taking the B-samples
thoroughly understood the procedure. During a compulsory half-day workshop, treatment
farmers were informed about the independent milk testing and learned how to use the
vouchers. Every treatment farmer received written instructions supplementing the information
presented during the workshop and was provided with a phone number of trained field staff.
To assure that farmers regarded the third-party testing as credible and independent, we had
identified a certified third-party laboratory which both farmers and Vinamilk explicitly agreed
on. Further, to ensure the comparability of the A- and B-sample, we calibrated the third-party
laboratory and Vinamilk’s in-house laboratory using imported reference milk. By employing
the same cooling technology we also assured that during transport and storage the A- and B-
samples were kept in identical environments with regard to factors potentially affecting milk
quality such as temperature or exposure to sunlight.
To avoid contamination, i.e. that control group farmers get access to the third-party milk
testing and thus effectively become treated, the emergence of a secondary market for
vouchers had to be prevented. We handed out personalized vouchers tagged with a unique
identification number. Vouchers passed on to other farmers (also outside the treatment group)
automatically became invalid. A scenario in which control farmers sell their milk through
treatment farmers to benefit indirectly from the independent quality verification and resulting
higher expected milk prices is possible but very unlikely. If a treatment farmer accepts milk
from a control farmer (or an unknown source) she takes the risk of mixing milk of unknown
quality with her own milk, potentially leading to lower average quality and financial loss.
If take-up is voluntary in field experiments, individuals who are assigned to the treatment
group may refuse to get treated. This may lead to low compliance rates which can be a
12
challenge for the subsequent impact analysis. Cole et al. (2012) found that adoption rates for
innovative crop insurances in India were as low as 5 to 10 percent despite high potential
benefits. Hill and Viceisza (2011) overcame the problem of low take-up in a framed field
experiment by imposing mandatory insurance. Our intervention is unique with respect to
compliance, as for the voucher treatment to be effective a high compliance, i.e. high voucher
execution rate is not a necessary condition. The specific design of the third-party contract
enforcement does not depend on an individual farmer’s decision to execute a voucher to build
a direct threat to Vinamilk. Instead, it is sufficient if farmer A believes that farmers B or C
may request an analysis. This believe—from farmer A’s point of view—would be an indirect
but sufficiently powerful threat to the dairy processor to be monitored, ruling out
underreporting. Ultimately, this implies that all farmers in the treatment group can be
regarded as treated, regardless of their actual voucher execution.
It should be stressed that when designing the voucher treatment, we were interested in
isolating the general effect of third-party contract enforcement, rather than evaluating a
particular way of providing farmers with independent testing of quality attributes. Like in
Thomas et al. (2003), who investigated the impact of an iron-supplementation program, our
voucher-based approach is too costly to be easily scaled up. In a non-experimental setting,
complete outsourcing of milk testing to an independent laboratory would be more efficient
than establishing a parallel structure for B-sample analyses.
Study Area, Sample and Randomization
Almost 70 percent of the domestically produced milk in Vietnam stems from the region
around HCMC. The study area is located in Long An and Tien Giang, two provinces south of

13
HCMC where Vinamilk has contracted 402 dairy farmers. The milk supply is channeled
through four MCCs.
At MCC level, differences with respect to average dairy output (quantity, quality) can be
observed (Table A1 in the Appendix). Three out of the four collection centers (MCCs B, C
and D) are spatially clustered, so it is unlikely that agro-ecological factors cause the
performance differential. As farmers can choose freely which MCC to supply their milk to,
we suppose that selection based on unobservables may cause the farmer population of one
MCC to systematically differ from farmers at other MCCs. For example, dairy producers do
not only choose an MCC based on the distance to their farm but also based on soft factors
such as trust towards the management of the MCC. Beside the three clustered MCCs, there is
also one more isolated collection center (MCC A) where farmers do not have the option to
choose between different Vinamilk MCCs. However, a competitor of Vinamilk sources raw
milk in the area of MCC A. Hence, farmers could entirely switch to the competing dairy
processor, if they were unhappy with Vinamilk, the contract or the collection center
management. We reckon that farmers who deliver to Vinamilk despite having an alternative
may be systematically different from Vinamilk farmers without such an outside option. Such
possible differences are accounted for in our analysis through MCC dummies.
Given the limited number of MCCs and significant mean differences in observable
characteristics, a randomization of treatment status over MCCs—even though easier to
manage—might have confounded our results. Hence, we randomized over the entire
population of 402 dairy farmers. In May 2009, all farmers attended a public lottery in which
102 farmers were randomly assigned to the treatment group. Another 100 farmers were
randomly assigned to the control group, continuing to produce under the original, incomplete
contract without enforcement. Farmers were informed that due to a budget constraint and for

14
the sake of a clear evaluation of the project (the term experiment was avoided when
communicating with farmers due to its negative connotation) only a limited number of slots
would be available in the treatment group. Owing to the complexity of the treatment design,
the implementation had to be delayed several times. The intervention eventually started in
May 2010 when the first batch of B-samples was obtained. It was continued for a period of 12
months.
Data
We collected detailed information for all farmers participating in the experiment. Through
two rounds of structured household surveys we generated a data set comprising socio-
economic details on dairy production, income from agricultural and non-agricultural
activities, household expenditure and assets owned. Additionally, questions measuring social
capital, trust, time and risk preferences were included in the questionnaire. The first round of
interviews, the baseline survey, took place in May 2009 before the experiment started. In
May/June 2011, all farmers were revisited for the follow-up survey when the experiment was
completed.
The household data were complemented with farm-level output data for each producer in
the sample provided by the processing company. Vinamilk provided these data for the period
from May 2008 to May 2011, covering 24 months prior to the intervention and the time
period of the intervention. On the one hand, it can be assumed that these data are of higher
quality than self-reported recall data on output obtained through household surveys, as this
weekly reported information—disaggregated by milk quantity and three quality parameters—
is the basis for farmers’ payment. On the other hand, the dairy company may have an

15
incentive to strategically release information, i.e. provide manipulated data to mask
underreporting of milk quality and price in case farmers were cheated before the intervention.
We carefully address this issue in the discussion section when we assess the internal validity
of the results.
Identification Strategy and Econometric Estimation
The impact of third-party quality verification is assessed in three dimensions: (a) input use in
dairy production, (b) output generation in dairy production, and (c) welfare of the farming
household.
While (a) is measured by the amount of purchased fodder (concentrate) used per cow and
day reported by farmers, (b) is captured by three variables, the total amount of milk fat and
total solid produced during the twelve months when the experiment was ongoing and
revenues from dairy farming for the same time period. Data on these output variables are
provided by the dairy company. For (c) we use total annual household consumption
expenditures on food (own produced food items were valued at the market price), other
consumer goods and durables obtained through the household survey.
We seek to identify two types of treatment effects. First, the average treatment effect on the
treated (ATT) which is estimated according to
(11) ATT = E(𝑦1 − 𝑦0|𝑣 = 1),
where ATT is the difference of 𝑦1, the average outcome of the treated, and 𝑦0, the
counterfactual outcome of the untreated, conditioned on the treatment status 𝑣 = 1, which
16
means being treated. Given the random assignment of v, the control group constitutes an
adequate counterfactual of the treatment group.
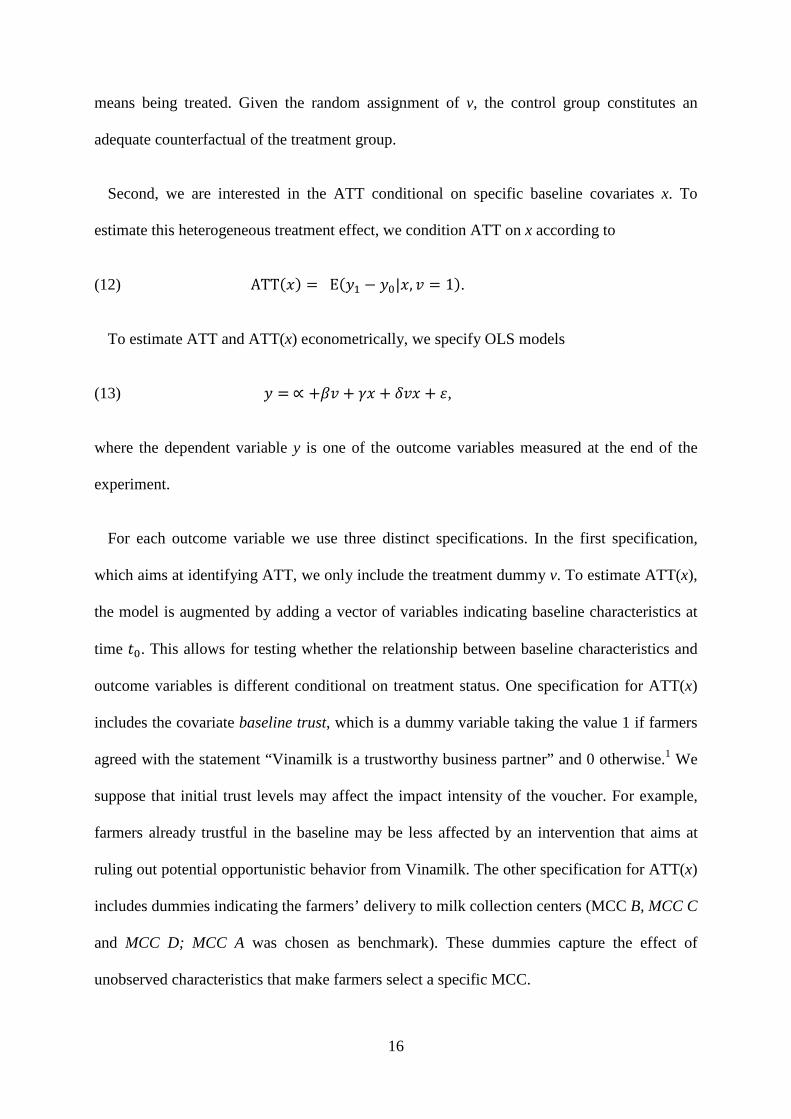
Second, we are interested in the ATT conditional on specific baseline covariates x. To
estimate this heterogeneous treatment effect, we condition ATT on x according to
(12) ATT(𝑥) = E(𝑦1 − 𝑦0|𝑥, 𝑣 = 1).
To estimate ATT and ATT(x) econometrically, we specify OLS models
(13) 𝑦 = ∝ +𝛽𝑣 + 𝛾𝑥 + 𝛿𝑣𝑥 + 𝜀,
where the dependent variable y is one of the outcome variables measured at the end of the
experiment.
For each outcome variable we use three distinct specifications. In the first specification,
which aims at identifying ATT, we only include the treatment dummy v. To estimate ATT(x),
the model is augmented by adding a vector of variables indicating baseline characteristics at
time 𝑡0. This allows for testing whether the relationship between baseline characteristics and
outcome variables is different conditional on treatment status. One specification for ATT(x)
includes the covariate baseline trust, which is a dummy variable taking the value 1 if farmers
agreed with the statement “Vinamilk is a trustworthy business partner” and 0 otherwise.1 We
suppose that initial trust levels may affect the impact intensity of the voucher. For example,
farmers already trustful in the baseline may be less affected by an intervention that aims at
ruling out potential opportunistic behavior from Vinamilk. The other specification for ATT(x)
includes dummies indicating the farmers’ delivery to milk collection centers (MCC B, MCC C
and MCC D; MCC A was chosen as benchmark). These dummies capture the effect of
unobserved characteristics that make farmers select a specific MCC.

17
Randomization
Prior to the impact analysis we verified that treatment and control groups are similar
statistically with respect to the large number of observables available from the baseline
survey, including the outcome variables (Table 1). The only statistically significant (at 10
percent error rate) differences are for the variables capturing road infrastructure and time
preferences2, indicating that treatment farmers are located slightly closer to paved roads and
are less patient than their peers in the control group. Given the random assignment of the
treatment status, the observed differences are not systematic, e.g. better infrastructure did not
make a household more likely to be assigned to the treatment group.3
Attrition
Between the baseline survey in May 2009 and the implementation of the treatment in May
2010 a number of milk farmers ceased production or switched from Vinamilk to the
competing dairy processor. The number of households in the treatment and control group
decreased from 100 and 102 to 94 and 91, respectively. Those producers dropping out of the
sample have significantly (at 10 percent level) smaller baseline heard sizes, are less
productive and have lower revenues from milk. The attrition rate is balanced between
treatment and control groups.
Compliance
As pointed out above the intervention did not require high compliance rates (primary
enforcement), i.e. voucher being executed by a large number or farmers, in order to be

18
effective. However, from treatment farmers’ perspective a minimum compliance in the
treatment group is (psychologically) desirable to credibly build up the threat to the dairy
processor of being effectively monitored.
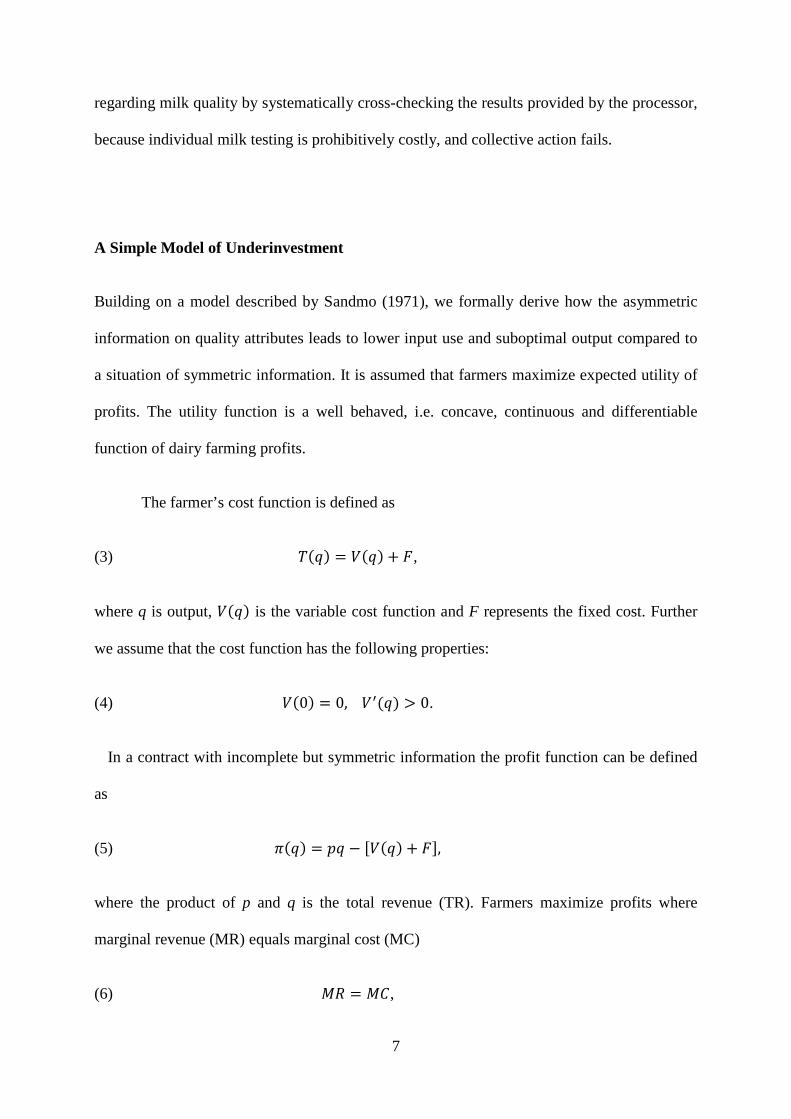
We find that only seven farmers (out of 93) have actually requested independent
verification of milk testing results despite it is easy, cheap and safe. It is worthwhile
mentioning that those farmers who have executed vouchers on average had larger herd sizes
with more productive dairy cows. A possible explanation could be that these larger farmers
had a higher interest in verifying the milk testing results, because even little underreporting of
quality by the processor would lead to substantial losses due to larger quantities involved. We
have systematically evaluated the voucher treatment in the follow-up survey to identify
reasons for low take-up rates; selected results are presented in figure 1. The majority of
farmers who have not executed vouchers agreed that third-party quality assessment was
useful, easy to request, and that the independent laboratory is trustworthy. Some 50 percent of
all treated farmers stated to not have executed a voucher because they were satisfied with the
milk quality results provided by Vinamilk. A significant proportion indicated that they would
feel uneasy to secretly check up on Vinamilk.
It should be stressed again that due to the fact that indirect threat is sufficient for the
voucher treatment to be effective the low execution rate of vouchers does not pose a problem
to the subsequent impact analysis; hence, all individuals assigned to the treatment group
(expect for drop-outs) can be regarded as treated.
19
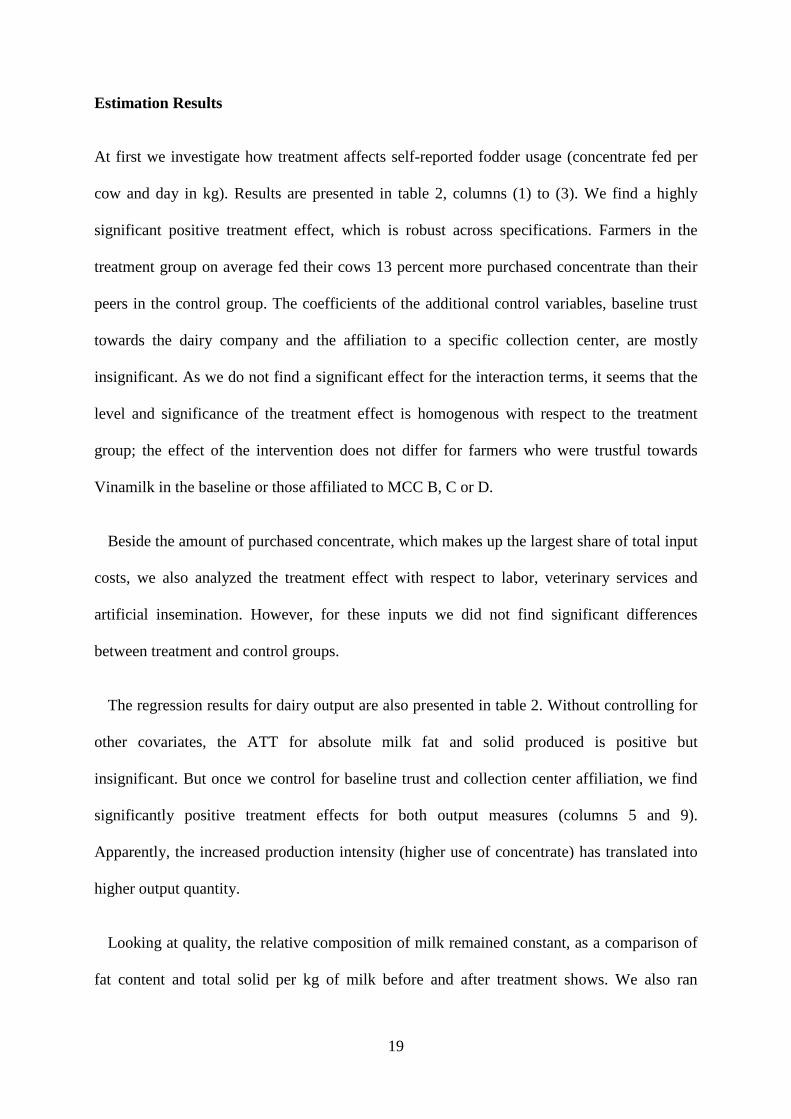
Estimation Results
At first we investigate how treatment affects self-reported fodder usage (concentrate fed per
cow and day in kg). Results are presented in table 2, columns (1) to (3). We find a highly
significant positive treatment effect, which is robust across specifications. Farmers in the
treatment group on average fed their cows 13 percent more purchased concentrate than their
peers in the control group. The coefficients of the additional control variables, baseline trust
towards the dairy company and the affiliation to a specific collection center, are mostly
insignificant. As we do not find a significant effect for the interaction terms, it seems that the
level and significance of the treatment effect is homogenous with respect to the treatment
group; the effect of the intervention does not differ for farmers who were trustful towards
Vinamilk in the baseline or those affiliated to MCC B, C or D.
Beside the amount of purchased concentrate, which makes up the largest share of total input
costs, we also analyzed the treatment effect with respect to labor, veterinary services and
artificial insemination. However, for these inputs we did not find significant differences
between treatment and control groups.
The regression results for dairy output are also presented in table 2. Without controlling for
other covariates, the ATT for absolute milk fat and solid produced is positive but
insignificant. But once we control for baseline trust and collection center affiliation, we find
significantly positive treatment effects for both output measures (columns 5 and 9).
Apparently, the increased production intensity (higher use of concentrate) has translated into
higher output quantity.
Looking at quality, the relative composition of milk remained constant, as a comparison of
fat content and total solid per kg of milk before and after treatment shows. We also ran

20
regressions using average fat and solid content per kg of milk as dependent variables, without
finding significant treatment effects (results not presented here). Above we proposed three
ways how farm-level dairy output could be increased. These results suggest that farmers
mainly realized the second option, namely increasing milk quantity (in kg) while keeping
quality (milk fat and total solid content per kg) constant. A possible explanation for the
observed increase in milk quantity instead of quality can be found in the physiology of dairy
cows. To produce large quantities of milk, the dairy cow requires a nutritious and balanced
fodder ration, especially with respect to protein and energy. If the ration is unbalanced, for
example if it contains too little protein relative to energy, milk yield will drop (Roth, Schwarz
and Stangl 2011). The concentrate purchased by farmers in Vietnam is rich in protein. It is
therefore plausible that an increase in concentrate use, as observed among treated farmers,
contributes to relaxing a protein constraint in the fodder ration.
Higher output leads to more revenues from dairy production, as shown in table 3. The
positive and significant (at 10 percent error rate) coefficient of the treatment dummy in
column (3), in which baseline characteristics are controlled for, points to a heterogeneous
treatment effect, especially with respect to milk collection center affiliation. As milk quality
was not affected by the treatment (and thus the average price received remained unchanged),
the increment in revenue can entirely be attributed to increased production quantity.
Finally, we look into the intervention’s impact on total household consumption
expenditures, a commonly used measure of living standard and welfare. We do not find a
significant ATT (Table 3, columns 4 to 6). This is not very surprising, because households
tend to adjust their consumption expenditures only slowly, that is, an increase in revenue or
profit may not immediately be reflected in changed consumption behavior. To measure
21
impacts on consumption expenditure, the duration of the experiment may have simply been
too short.
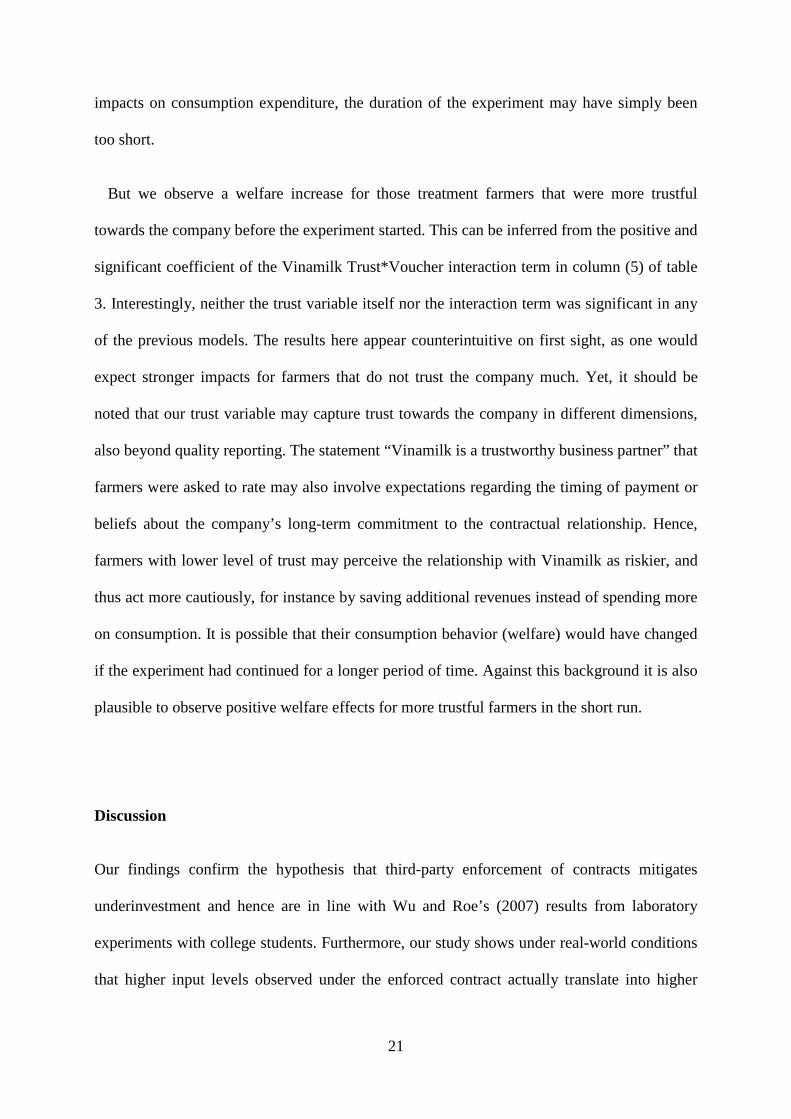
But we observe a welfare increase for those treatment farmers that were more trustful
towards the company before the experiment started. This can be inferred from the positive and
significant coefficient of the Vinamilk Trust*Voucher interaction term in column (5) of table
3. Interestingly, neither the trust variable itself nor the interaction term was significant in any
of the previous models. The results here appear counterintuitive on first sight, as one would
expect stronger impacts for farmers that do not trust the company much. Yet, it should be
noted that our trust variable may capture trust towards the company in different dimensions,
also beyond quality reporting. The statement “Vinamilk is a trustworthy business partner” that
farmers were asked to rate may also involve expectations regarding the timing of payment or
beliefs about the company’s long-term commitment to the contractual relationship. Hence,
farmers with lower level of trust may perceive the relationship with Vinamilk as riskier, and
thus act more cautiously, for instance by saving additional revenues instead of spending more
on consumption. It is possible that their consumption behavior (welfare) would have changed
if the experiment had continued for a longer period of time. Against this background it is also
plausible to observe positive welfare effects for more trustful farmers in the short run.
Discussion
Our findings confirm the hypothesis that third-party enforcement of contracts mitigates
underinvestment and hence are in line with Wu and Roe’s (2007) results from laboratory
experiments with college students. Furthermore, our study shows under real-world conditions
that higher input levels observed under the enforced contract actually translate into higher

22
output, a result which would be impossible to obtain in the laboratory. The findings also
suggest that specific subgroups are affected to varying degrees by the intervention, especially
those delivering to particular collection centers. Given data limitations, we are not able to
further analyze possible mechanisms that may explain the differences in treatment effects
between farmers that deliver to different MCCs. In part, these differences may be due to
unobserved factors that determine farmers’ self-selection into specific MCCs.
Contamination
As pointed out in Section I, by issuing personalized vouchers to treatment farmers we avoided
control farmers getting direct access to third-party quality assessment. However, the random
assignment of the treatment status may still have led to positive contamination. Farmers in the
control group could have gotten indirect access to the treatment through trust spillovers, e.g.,
if a control group farmer updated her belief about Vinamilk’s type from “unfair” to “fair”
after communicating with a neighboring treatment farmer. We evaluated this possibility
through specific questions in the follow-up survey. Trust levels4 significantly increased in
both treatment and control farmers (though more for treatment farmers), suggesting the
existence of positive spillovers. We follow that the treatment effect we measured actually
underestimates the real impact of third-party contract enforcement.
A cleaner design, less susceptible to positive contamination, would have implied to strictly
separate treatment and control farmers, to avoid communication between groups. However,
choosing the milk collection center as unit of randomization, as one possible way of
separating treatment and control farmers, would have been much more costly due to the large
number of collection centers needed for proper randomization. With only a small number of

23
MCCs, as in our case, randomization between MCCs could have led to biased treatment
effects due to systematic differences, as discussed above.
Data Provision and Incentive Compatibility
We attribute the entire treatment effect to a behavioral change of treatment farmers, not to a
change in Vinamilk’s reporting behavior. This is justified but deserves further explanation. If
the company had underreported output quality before the independent quality verification was
implemented, we would not be able to easily attribute observed effects to changes in either
farmer or company behavior. In an extreme case, higher output could be entirely the result of
Vinamilk ceasing to underreport quality.
Before we analyze patterns in the data to reveal whether Vinamilk deliberately
underreported quality and thus the price of output, we introduce some additional notation. Let
t0 represent the starting point of the intervention, t+1 the point when the intervention ended
after twelve months and t-1 the point twelve months prior to the intervention start. We
distinguish between the output (quantity and quality) reported by Vinamilk and the real output
obtained using laboratory methods, which for quality is private information in the standard
contract. If Vinamilk had exploited the informational advantage, reported output levels would
have been lower than true output levels. If instead Vinamilk played fair, reported and true
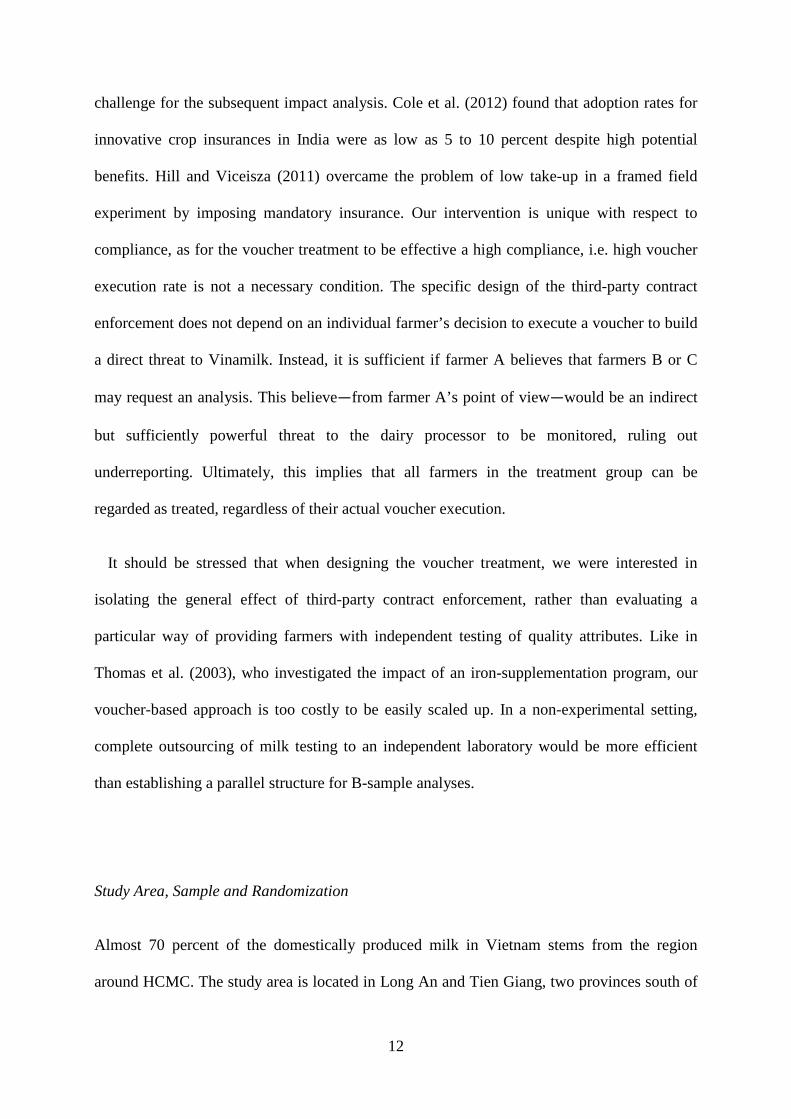
output levels would have been identical. This is shown in a stylized way in figure 2 in which
reported output for the treatment group is represented by a solid line, true output by a dashed
line.
We have shown that independent verification of quality attributes made farmers produce
more milk fat and total solid in the time interval [t0, t+1] than during interval [t-1, t0[. This was

24
a result of an increase in milk quantity q at constant milk quality θ. This effect on q is
graphically represented in the left panel of figure 2 by the positive slope in reported average
quantity delivered to the company in the interval [t0, t+1]. It is important to note that the
amount of milk delivered has always been observable to both farmers and the company,
because milk is weighed under the eyes of the farmers at the MCC. Hence, there has never
been information asymmetry with respect to quantity. As a result, reported and true output
must be identical, which is indicated by the coinciding dashed and solid lines.5 Thus, the
observed treatment effect with respect to q can unambiguously be attributed to a change in
farmers’ input use.
While q increased, θ was not affected by the intervention. For the interval [t0, t+1], in which
quality was verifiable through the independent laboratory, we know with certainty that
reported θ and true θ must be identical. This is graphically depicted in the right panel of
figure 2 by the coinciding solid and dashed lines for the interval [t0, t+1]. If the dairy processor
cheated before t0 and stopped doing so when the third-party testing started, we would have
been able to identify a discontinuity (jump) in the reported average quality between [t0, t+1]
and [t-1, t0[. This is not what we actually observe in the data.
However, before we can infer that Vinamilk did not underreport in [t-1, t0[, we need to rule
out a possible alternative explanation for the missing discontinuity: Vinamilk could have
stopped cheating farmers as soon as they learned about the nature of our intervention. In this
case, Vinamilk would have ceased underreporting at some point before t0 to avoid providing
evidence for cheating. This possibility can be ruled out, because Vinamilk had already started
providing production data (quantity and quality) at a very early stage of our cooperation,
before we actually discussed the nature of the specific intervention. Hence, we had already
received data at a time when Vinamilk could not anticipate that we planned to look into

25
independent quality verification. This precludes that the company provided us with “tailored”
data to mask strategic underreporting of quality. The mere fact that they actually agreed to
this intervention is also a sign that Vinamilk did not cheat on quality reporting prior to the
experiment.
Pareto Improvement in the Supply Chain
Putting the pieces of evidence together, we conclude that the company has not been
deliberately underreporting milk quality and price, neither in [t-1, t0[ nor in [t0, t+1]. This
finding has strong implications for the distribution of gains from third-party monitoring. If the
company did not behave opportunistically, no information rents actually accrued. Thus, in a
situation in which the principal plays “fair” but—due to the architecture of the supply chain—
is unable to send a credible signal of his type, third-party verification leads to a Pareto
improvement, increasing the welfare of both actors in the supply chain, sellers and buyer.
While farmers benefit from unlocked productivity reserves, the processor’s per-unit
transaction costs decrease if procuring from farmers who are more productive in a situation of
symmetric information.
Generally, for a rational buyer to refrain from cheating, expected benefits from
underreporting quality should be lower than expected costs. Such costs could arise from two
sources: first, as forgone operational profits from farmers’ suboptimal milk output (as we
could show) and second, from the expected damage when cheating is detected. Reputational
damage in particular could be severe for Vinamilk, given the company’s size and the fact that
it has established several high-profile brands in the national market. But this may not be so
obvious for farmers. While company decision makers have more information to assess

26
expected costs of cheating, contracted smallholder farmers may underestimate Vinamilk’s risk
and damage of being caught. For example, farmers may find it unlikely that Vinamilk would
be convicted for fraudulent behavior. Anecdotal evidence suggests that Vinamilk is perceived
as a powerful and politically influential player, due to its history as a state-owned company.
From this we cautiously conclude that for Vinamilk it is the dominant strategy to play fair,
but that farmers may nevertheless form the belief that the company behaves opportunistically.
It remains to be discussed why in this situation the company itself has not established an
independent system of quality verification to signal its fair type, even though this could be
profitable. One explanation could be that the credibility of any processor-driven initiative to
increase transparency may be low. Duflo et al. (2012) showed for industrial pollution in India
that―if incentives are not aligned―firms employ auditors who write favorable reports,
actually understating pollution caused by the company. The current equilibrium of distrust
that we find could probably be broken by a credible intervention from outside, such as by
research institutions like in our experiment or by the government. A study by Olken (2007)
found top-down monitoring to be relatively effective, even in an environment notorious for
corruption. But governments do not necessarily need to undertake controls by themselves. As
Yang (2008) has shown for import tax fraud, governments can “hire integrity” from private
firms, which is comparable to the independent laboratory in our case. The fact that no such
attempt has yet been undertaken by the Vietnamese government may not surprise, given that
the local dairy industry is still emerging. Also in other sectors of developing countries, such
as health and education, market and policy failures are widespread phenomena (World Bank
2003).

27
Conclusion
Contracting has become a widely embraced approach to facilitate supply chain relations
between selling farmers and buying companies, especially in emerging markets for high-value
agricultural products. Smallholders entering contractual relations with buyers of high-value
products – such as fruit and vegetables, meat or milk – often become highly specialized and
derive a considerable income share from the output sold under contract. However, production
contracts remain incomplete if product quality attributes are observable to the buyer but not to
the selling farmer. If buyers behave opportunistically and exploit this information asymmetry
to increase their profit, output prices for producers are lower than in a situation of symmetric
information. Farmers taking this into account may underinvest, i.e. use suboptimal levels of
input translating into lower output levels, a non-desirable outcome for both farmers and
buyers.
In this study we have shown that third-party contract enforcement can be one way to
mitigate the adverse effects of information asymmetry. Conducting a field experiment with
dairy farmers in Vietnam we found that the provision of third-party contract enforcement had
a positive impact on input use (purchased fodder) and output levels (quantity of milk fat and
total solid), ultimately translating into higher revenue and also household welfare for specific
subgroups of the sample. Given the design of our intervention we cannot fully avoid positive
contamination of the control group, and thus may actually underestimate the treatment effect.
From the available data we infer that the observed treatment effect can be fully attributed to
a behavioral change on the side of farmers, instead of a change in the company’s reporting
strategy. It can also be concluded that in this specific case, the company had not exploited the
informational advantage when the contract was yet incomplete. Instead, the company was
playing fair but could not credibly signal its type to the farmers due to the specific

28
architecture of the supply chain. Hence, not only the smallholders can benefit from more
transparency regarding quality assessment. If more output per farmer is generated, per-unit
transaction cost for the buying company goes down. As both sides in the transaction are better
off, the contract enforcement leads to a Pareto improvement.
Our results were obtained in an environment that is representative for the fast growing
Vietnamese dairy sector. The findings may also be transferable to other agricultural sectors,
especially those where competition between buyers is low and information asymmetry exists.
If quality attributes determine the output price but testing requires costly equipment,
independent monitoring helps to overcome problems associated with information asymmetry,
whether this is for fat content in milk, sugar concentration in beets or cane or protein content
in grains—in Vietnam and beyond. In situations without a monopsony, contracts may be less
biased towards the buyer.
Endnotes
1 In the baseline survey, interviewees had to rate this statement on a four-point Likert-scale
(“very much agree”, “agree”, “disagree”, “very much disagree”; the option “I don’t know”
was also included). We collapsed the responses into a dummy taking the value 1 if farmers
opted for “agree” or “fully agree” and 0 otherwise.
2 In the baseline survey we revealed through a battery of choices between hypothetical
payoffs the discount rates at which farmers accepted to wait for one month to receive a
significant lump sum payment. The variable was converted into a dummy which takes the

29
value 1 if farmers agreed to wait one month if a monthly interest rate of up to 3.5 percent is
paid.
3 As robustness check, both variables were included in the regression equation but their
inclusion neither led to significant coefficients for these variables nor to notable changes in
the treatment effects.
4 Trust levels were measured before and after the treatment. The variable is constructed in the
same way as baseline trust.
5 For illustrative purposes, the coinciding solid and dashed lines have been separated in the
graphs.

30
References
Akerlof, G. A. 1970. The market for ‘lemons’: Quality uncertainty and the market
mechanism. Quarterly Journal of Economics 84(3): 488–500
Ashraf, N., X. Giné, and D. Karlan. 2009. Finding missing markets (and a disturbing
epilogue): Evidence from an export crop adoption and marketing intervention in Kenya.
American Journal of Agricultural Economics 91(4): 973–990
Balbach, J. K. 1998. The effect of ownership on contract structure, costs, and quality: The
case of the U.S. beet sugar industry. In: The industrialization of agriculture: Vertical
coordination in the U.S. food system. J. S. Royer and R. T. Rogers, eds., pp. 155-184.
Aldershot, England: Ashgate Publishing
Bellemare, M. F. 2012. As you sow, so shall you reap: The welfare impacts of contract
farming. World Development 40(7): 1418—1434
Birthal, P. S., P.K. Joshi, and A.Gulati. 2005. Vertical coordination in high-value food
commodities: Implications for smallholders. MTID Discussion Paper No. 85. International
Food Policy Research Institute, Washington, D.C.
Cungu, A., H. Gow, J. F. M. Swinnen, and L. Vranken. 2008. Investment with weak contract
enforcement: evidence from Hungary during transition. European Review of Agricultural
Economics 35(1): 75–91
Duflo, E., M. Kremer, and J. Robinson. 2008. How high are rates of return to fertilizer?
Evidence from field experiments in Kenya. American Economic Review 98(2): 482–88
Duflo, E., M. Kremer, and J. Robinson. 2011. Nudging farmers to use fertilizer: theory and
experimental evidence from Kenya. American Economic Review 101(6): 2350–2390
Duflo, E., M. Greenstone, R. Pande, and N. Ryan. 2012. Truth-telling by third-party auditors:
Evidence from a randomized field experiment in India. Paper presented at 21st BREAD
Conference, 12-13 May 2012, Yale University, New Haven, CT
Gow, H. R., D. H. Streeter, and J. F. M. Swinnen. 2000. How private contract enforcement
mechanisms can succeed where public institutions fail: the case of Juhocukor as.

31
Agricultural Economics 23(3): 253–256
Gow, H. R., and J. F. M. Swinnen. 1998. Up- and downstream restructuring, foreign direct
investment, and hold-up problems in agricultural transition. European Review of
Agricultural Economics 25(3): 331–350
Grossmann, S. J. 1981. The informational role of warranties and private disclosure about
product quality. Journal of Law and Economics 24(3): 461–483
Hill, R. V., and A. Viceisza. 2011. A field experiment on the impact of weather shocks and
insurance on risky investment. Experimental Economics. DOI: 10.1007/s10683-011-9303-7
Kremer, M., N. Chaudhury, K. Muralidharan, F. H. Rogers, and J. Hammer. 2005. Teacher
absence in India: A snapshot. Journal of the European Economic Association 3(2-3): 658–
667
Levitt, S. D., and J. A. List. 2007. What do laboratory experiments measuring social
preferences reveal about the real world? Journal of Economic Perspectives 21(2): 153–174
Mergenthaler, M., K. Weinberger, and M. Qaim. 2009. Consumer valuation of food quality
and food safety attributes in Vietnam. Review of Agricultural Economics 31(2): 266–283
Miguel, E., and M. Kremer. 2004. Worms: Identifying impacts on education and health in the
presence of treatment externalities. Econometrica 72(1): 159–217
Olken, B. A. 2007. Monitoring Corruption: Evidence from a Field Experiment in Indonesia.
Journal of Political Economy 115(2):200–249
Rao, E. J. O., B. Brümmer, and M. Qaim. 2012. Farmer participation in supermarket
channels, production technology, and efficiency: The case of vegetables in Kenya.
American Journal of Agricultural Economics 94(4): 891–912
Reardon, T., C. B. Barrett, J. A. Berdegué, and J. F. M. Swinnen. 2009. Agrifood industry
transformation and small farmers in developing countries. World Development 37(11):
1717–1727
Ross, S. A. 1973. The economic theory of agency: The principal’s problem. American
Economic Review 63(2): 134–139

32
Roth F. X., F. J. Schwarz and G. I. Stangl. 2011. Tierernährung. DLG-Verlag, Frankfurt am
Main, Germany
Rothschild, M., and J. Stiglitz. 1976. Equilibrium in competitive insurance markets: An essay
in the economics of imperfect information. Quarterly Journal of Economics 90(4): 629–650
Saenger, C., M. Qaim, M. Torero, A. Viceisza (2013). Contract farming and smallholder
incentives to produce high quality: Experimental evidence from the Vietnamese dairy
sector. Agricultural Economics, DOI: 10.1111/agec.12012
Skoufias, E. 2001. PROGRESA and Its Impact on the Welfare of Rural Households in
Mexico. IFPRI Research Report 139. International Food Policy Research Institute,
Washington D.C.
Sandmo, A. 1971. On the theory of the competitive firm under price uncertainty. American
Economic Review 61(1): 65–73
Spence, M. 1973. Job market signaling. Quarterly Journal of Economics 87(3): 355–374
Stiglitz, J., and A. Weiss. 1981. Credit rationing in markets with imperfect information.
American Economic Review 71(3): 393–410.
Sykuta, M. E., and M. L. Cook. 2001. A new institutional approach to contracts and
cooperatives. American Journal of Agricultural Economics 83(5): 1273–1279
Thomas, D., E. Frankenberg, J. Friedman, J.-P. Habicht, and E. Al. 2003. “Iron deficiency
and the well-being of older adults: Early results from a randomized nutrition intervention.
Working Paper, University of California, Los Angeles:
http://emlab.berkeley.edu/users/webfac/emiguel/e271_s04/ friedman.pdf (accessed on
04/14/2010)
Throsby, David. 1994. The production and consumption of the arts: A view of cultural
economics. Journal of Economic Literature 32(1): 1–29
Cole, S., X. Giné, J. Tobacman, P. Topalova, R. Townsend, and J. Vickery. 2012. Barriers to
household risk management: Evidence from India. IMF Working Papers 12/195.
International Monetary Fund, Washington, DC, USA.

33
USDA. 2011. Colossal growth in the Vietnamese dairy industry. GAIN Report. United States
Department of Agriculture Foreign Agricultural Service, Washington D.C., USA.
http://www.globaltrade.net/f/market-research/pdf/Vietnam/Processing-of-Food-and-
Agricultural-Products-Colossal-Growth-in-the-Dairy-Industry.html (accessed on
30/01/2012)
Vukina, T., and P. Leegomonchai. 2006. Oligopsony power, asset specificity, and hold-up:
Evidence from the broiler industry. American Journal of Agricultural Economics 88(3):
589–605
World Bank. 2003. World Development Report 2004: Making Services for the Poor. World
Bank, Washington D.C., USA
Wu, S. Y., and B. Roe. 2007. Contract enforcement, social efficiency, and distribution: Some
experimental evidence. American Journal of Agricultural Economics 89(2): 243–258
Yang, D. 2008. Integrity for Hire: An Analysis of a Widespread Customs Reform. Journal of
Law and Economics 51(1): 25–57
Young, L. M., and J. E. Hobbs. 2002. Vertical linkages in agri-food supply chains: Changing
roles for producers, commodity groups, and government policy. Review of Agricultural
Economics 24(2): 428–441
34
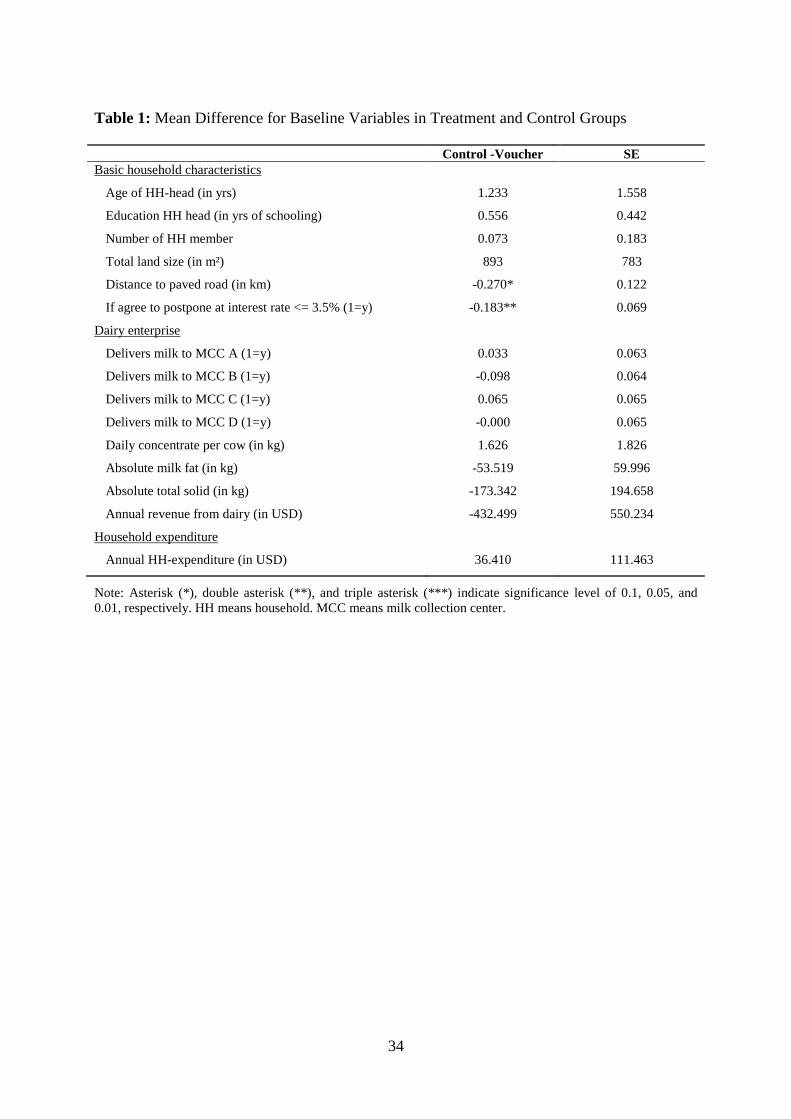
Table 1: Mean Difference for Baseline Variables in Treatment and Control Groups
Control -Voucher SE Basic household characteristics
Age of HH-head (in yrs) 1.233 1.558
Education HH head (in yrs of schooling) 0.556 0.442
Number of HH member 0.073 0.183
Total land size (in m²) 893 783
Distance to paved road (in km) -0.270* 0.122
If agree to postpone at interest rate <= 3.5% (1=y) -0.183** 0.069
Dairy enterprise
Delivers milk to MCC A (1=y) 0.033 0.063
Delivers milk to MCC B (1=y) -0.098 0.064
Delivers milk to MCC C (1=y) 0.065 0.065
Delivers milk to MCC D (1=y) -0.000 0.065
Daily concentrate per cow (in kg) 1.626 1.826
Absolute milk fat (in kg) -53.519 59.996
Absolute total solid (in kg) -173.342 194.658
Annual revenue from dairy (in USD) -432.499 550.234
Household expenditure
Annual HH-expenditure (in USD) 36.410 111.463
Note: Asterisk (*), double asterisk (**), and triple asterisk (***) indicate significance level of 0.1, 0.05, and 0.01, respectively. HH means household. MCC means milk collection center.

35
Table 2: Estimation Results for Input Use and Output Produced
Input Output Daily concentrate per cow (in kg) Absolute milk fat (in kg) Absolute total solid (in kg) (1) (2) (3) (4) (5) (6) (7) (8) (9) Voucher treatment (1=y) 0.826*** 0.869** 0.973* 71.31 119.1 289.7** 227.6 387.8 913.9** [0.266] [0.364] [0.512] [70.19] [95.14] [136.9] [221.6] [300.4] [433.4] Trust towards Vinamilk (1=y) -0.0202 157.6 505.5 [0.391] [102.2] [322.6] Vinamilk Trust * Voucher -0.0334 -82.03 -279.7 [0.542] [141.3] [446.1] MCC B (1=y) -0.935* 212.8 683.3 [0.504] [134.5] [425.7] MCC C (1=y) -0.847 29.50 105.6 [0.541] [151.7] [480.1] MCC D (1=y) 0.136 110.3 367.7 [0.541] [144.9] [458.6] MCC B * Voucher 0.271 -154.8 -522.8 [0.701] [193.4] [611.9] MCC C * Voucher -1.059 -271.9 -829.2 [0.709] [198.5] [628.3] MCC D * Voucher 0.0875 -363.7* -1,139* [0.720] [197.0] [623.5] Constant 6.905*** 6.915*** 7.375*** 515.2*** 443.2*** 415.2*** 1,630*** 1,399*** 1,304*** [0.194] [0.268] [0.393] [51.05] [69.06] [101.1] [161.2] [218.0] [320.1] Observations1 164 162 164 172 170 172 172 170 172 R-squared 0.056 0.060 0.221 0.006 0.025 0.071 0.006 0.026 0.066
Note: Asterisk (*), double asterisk (**), and triple asterisk (***) indicate significance level of 0.1, 0.05, and 0.01, respectively. Standard errors in brackets. MCC means milk collection center. 1 The number of observation varies because of randomly missing values for specific dependent or independent variables.

36
Table 3: Estimation Results for Revenue and Household Welfare
Revenue Welfare Annual from dairy
(in USD) Annual HH expenditure
(in USD) (1) (2) (3) (4) (5) (6) Voucher treatment (1=y) 812.8 1,446 3,164* 82.95 -733.6 153.5 [845.3] [1,146] [1,659] [451.9] [607.9] [931.4] Trust towards Vinamilk (1=y) 1,940 -661.5 [1,231] [647.9] Vinamilk Trust * Voucher -1,119 1,731* [1,702] [911.2] MCC B (1=y) 3,173* -63.94 [1,629] [907.6] MCC C (1=y) 874.4 -344.6 [1,837] [972.8] MCC D (1=y) 1,931 -778.6 [1,755] [940.5] MCC B * Voucher -1,825 -1,185 [2,342] [1,310] MCC C * Voucher -2,704 658.8 [2,404] [1,300] MCC D * Voucher -3,859 -17.20 [2,386] [1,294] Constant 6,118*** 5,232*** 4,474*** 4,106*** 4,400*** 4,401*** [614.8] [831.8] [1,225] [323.0] [431.9] [687.9] Observations1 172 170 172 184 182 184 R-squared 0.005 0.025 0.060 0.000 0.021 0.026 Note: Asterisk (*), double asterisk (**), and triple asterisk (***) indicate significance level of 0.1, 0.05, and 0.01, respectively. Standard errors in brackets. HH means household. MCC means milk collection center. 1 The number of observation varies because of randomly missing values for specific dependent or independent variables.

37
Panel (a)
Panel (b)
Figure 1: Farmers who have not executed a voucher evaluate the treatment (n=86)
0%
10%
20%
30%
40%
50%
60%
70%
I stronglydisagree
I disagree I agree I stronglyagree
I don't know
It is easy to executethe voucher
I haven't executedthe voucher becausemilk quality wasgood
I don't feelcomfortable doublechecking behindVinamilk's back
0%
10%
20%
30%
40%
50%
60%
70%
I stronglydisagree
I disagree I agree I stronglyagree
I don't know
Voucher to test milkquality is useful
Independentlaboratory istrustworthy
It would be good if3rd party testingcontinues after theproject phase

38
Figure 2: Stylized development of output levels (treatment group)

39
Appendix
A1: Summary Statistics of Selected Variables and Pair-wise Comparisons by Milk Collection Center
(MCC)
Mean (SD in parentheses)
MCC A MCC B MCC C MCC D
(n=113) n=(103) (n=86) n=(83) HH-characteristics
No. of HH member 4.513 4.641 4.244 4.341
[1.536] [1.514] [1.255] [1.399] Age of HH-head 45.46 44.66 47.61 47.38
[11.53] [9.161] [11.74] [11.39] Total HH income (VND) 74,192,179 82,514,741 67,618,558 73,970,047
[49,567,765] [69,491,153] [58,362,681] [53,442,489] Dairy income (VND) 45,968,059 53,551,420 44,313,419 52,171,927
[35,675,422] [55,525,486] [53,633,181] [47,796,603] Dairy production Herd size (heads) 7.611 8.194 7.744 6.398
[5.417] [5.369] [4.587] [3.751] Productivity per Cow (kg) 4,051.6 4,925.9* 4,477.3 n.a.
[2,888.4] [2,229.7] [2,472.7] Average milk price (VND) 6,850.0 6,730.9** 6,542.4*** 6,671.4*
[275.6] [294.7] [416.7] [772.3] Total solid (%) 12.63 12.50 12.35*** 12.61
[0.520] [0.496] [0.427] [0.641] Milk fat (%) 3.980 3.907* 3.862** 4.074
[0.280] [0.245] [0.221] [0.482] Milk hygiene score 3.572 3.642 3.686** 3.578
[0.368] [0.205] [0.162] [0.465] Note: Mean differences are tested for MCC B – MCC A, MCC C – MCC A and MCC D – MCC C. Asterisk (*), double asterisk (**), and triple asterisk (***) indicate significance level of 0.1, 0.05, and 0.01, respectively