Embed Size (px)
Citation preview
RTG 1666 GlobalFood ⋅ Heinrich Düker Weg 12 ⋅ 37073 Göttingen ⋅ Germany www.uni-goettingen.de/globalfood
ISSN (2192-3248)
www.uni-goettingen.de/globalfood
RTG 1666 GlobalFood Transformation of Global Agri-Food Systems:
Trends, Driving Forces, and Implications for Developing Countries
Georg-August-University of Göttingen
GlobalFood Discussion Papers
No. 95
Can Mobile Phones Improve Gender Equality and Nutrition?
Panel Data Evidence from Farm Households in Uganda
Haruna Sekabira Matin Qaim
April 2017

Suggested Citation:
Sekabira, H., M. Qaim (2017). Can Mobile Phones Improve Gender Equality and Nutrition? Panel Data Evidence from Farm Households in Uganda. GlobalFood Discussion Paper 95, University of Göttingen. http://www.uni-goettingen.de/de/213486.html.
1
Can Mobile Phones Improve Gender Equality and Nutrition?
Panel Data Evidence from Farm Households in Uganda
Haruna Sekabira1* and Matin Qaim1
1 University of Goettingen, Department of Agricultural Economics and Rural Development,
37073 Goettingen, Germany
*corresponding author: [email protected]
Acknowledgements
This research was financially supported by the German Research Foundation (DFG) through the
GlobalFood Research Training Group (RTG 1666). Haruna Sekabira was also supported by the
German Academic Exchange Service (DAAD). We thank Brian Chiputwa for sharing data from
the 2012 survey round in Uganda.
2
Can Mobile Phones Improve Gender Equality and Nutrition?
Panel Data Evidence from Farm Households in Uganda
Abstract
During the last 10-15 years, mobile phone technologies have been widely adopted in most
developing countries, including adoption by rural households that never had access to landline
phones before. Existing research shows that use of mobile phones has improved market access
for smallholder farmers and thus household income. Beyond income, mobile phones can possibly
also affect other dimensions of social welfare, such as gender equality and nutrition. Such
broader social welfare effects have hardly been analyzed up till now. Here, we address this
research gap, using panel data from smallholder farm households in Uganda. Regression results
show that mobile phones have significantly contributed to household income gains and women
empowerment. Mobile phone use has also improved household food security and dietary quality.
Simultaneous equation models are estimated to show that the positive nutrition effects are
primarily channeled through the influence of mobile phones on household income and gender
equality. Gender disaggregation reveals that female mobile phone use has stronger positive
welfare effects than if males alone use mobile phones. We conclude that equal access to mobile
phones cannot only foster economic development, but can also contribute to gender equality,
food security, and broader social development.
Key words: mobile phones, women empowerment, dietary diversity, Uganda, gender, incomes
JEL Codes: I15; O16; O33; Q12
3
1. Introduction
During the last 10-15 years, mobile phone technologies have been widely adopted in developing
countries. Mobile phones have significantly improved people’s access to information, especially
for the rural poor who were never connected to landline phones before. Mobile phones have also
reduced other types of transaction costs, thus improving the functioning of markets in various
sectors, including agriculture, health, education, financial services, and many more (Fozdar and
Kumar, 2007; Jensen, 2007; Duncombe and Boateng, 2009; Aker and Mbiti, 2010; Aker, 2011;
Boulos et al., 2011; Aker and Ksoll, 2016; Blauw and Franses, 2016, Nakasone and Torero,
2016). Currently, about 4 billion people globally are using mobile phones. More than two-thirds
of these people live in developing countries; with 89% the highest penetration of mobile phones
being recorded in sub-Saharan Africa (PRC, 2015). People in Africa use their mobile phones for
a large number of activities and services, including communication with business partners and
friends via calls and text messages, access to news and various other types of information,
financial transactions, and entertainment (PRC, 2015; UCC, 2015).
A growing body of literature has used micro-level data to analyze the effects of mobile phone use
on market access, input and output prices, agricultural production patterns, and household income
(Donner, 2007; Jensen, 2007; Aker, 2010; Aker and Mbiti, 2010; Aker, 2011; Kikulwe et al.,
2014; Aker and Ksoll, 2016; Nakasone and Torero, 2016; Sekabira and Qaim, 2017). However,
mobile phones can possibly also affect various other dimensions of social welfare, such as gender
equality and nutrition. Understanding such broader effects is important especially against the
background of the United Nations’ Sustainable Development Goals, which go far beyond a
narrow set of economic development indicators. While a few recent studies have conceptually
discussed how mobile phones could influence food security and other welfare dimensions (e.g.,
4
Aker and Mbiti, 2010; Nakasone et al., 2014; Nakasone and Torero, 2016), empirical data that
actually measure such broader social outcomes are scarce.
Here, we address this research gap by using panel data from a farm household survey carried out
in Uganda. In particular, beyond looking at income effects, we analyze impacts of mobile phone
use on gender equality and nutrition. As in other African countries, mobile phones were adopted
very rapidly in Uganda during the last 10 years and are now widely used even by very poor
households in remote rural locations (Muto and Yamano, 2009; UCC, 2015; Munyegera and
Matsumoto, 2016).
How can mobile phone use influence gender equality and nutrition? A few early studies
discussed possible effects on gender roles (Bayes, 2001; Nath, 2001), yet without really
evaluating them empirically. For farming households, improved market access through mobile
phones will likely increase the degree of commercialization, which could reduce the decision-
making power of women. Agricultural commercialization is often associated with men taking
stronger control of agricultural production and income (Udry, 1996; Fischer and Qaim, 2012). On
the other hand, women are often particularly constrained in their access to markets and
information. Hence, if women themselves were able to use mobile phones, they could possibly
benefit even more than men (Aker and Ksoll, 2016). This could contribute to women
empowerment and improved gender equality within the household. Some of our data in Uganda
were collected in gender-disaggregated form, so we are able to examine such aspects.
Nutrition effects of mobile phone use can occur through various pathways. Better market access
and related income gains are typically associated with improved food security and dietary quality
(Sibhatu et al., 2015). Changing gender roles within the household can also influence nutrition
5
(Fischer and Qaim, 2012). As women tend to spend more on healthcare and dietary quality than
men, women empowerment can improve nutrition even in the absence of income gains
(Quisumbing and Maluccio, 2003; Hoddinott, 2012). Furthermore, easier access to all sorts of
news services and information through mobile phones may raise people’s nutrition knowledge
and awareness, which could also contribute to improved dietary practices.
2. Materials and Methods
2.1. Farm household survey
We use panel data collected in two survey rounds from randomly selected farm households in
Masaka and Luwero Districts, Central Uganda. Farmers in these districts grow coffee as their
major cash crop, in addition to banana, maize, sweet potato and various other food crops. Within
the two districts, we used a two-stage sampling procedure, first selecting three locations and then
randomly selecting farmers in each of these locations. The first survey round was conducted in
2012 and covered 419 farm households (Chiputwa et al., 2015). The second survey round was
conducted in 2015, targeting the same households. Due to sample attrition, we had to replace 25
households. In addition, we increased the sample size to a total of 455 households in 2015.
Additional households and replacements were randomly selected in the same locations. For the
analysis, we use the unbalanced panel with 874 observations from 480 households.
In both survey rounds, we used a structured questionnaire for face-to-face interviews with the
household head. Certain sections of the questionnaire were also answered separately by the
spouse of the household head. The questionnaire focused on agricultural production and
marketing, non-farm economic activities and income sources, household consumption, as well as
6
other socio-demographic and contextual details. Household diets were assessed through a 7-day
food consumption recall covering more than 100 different food items. We also asked for mobile
phone ownership and use at the household level, as well as separately for different household
members. In this study, we are particularly interested in the mobile phone use by male and female
adults in each household. Similarly, ownership of assets was captured in a gender-disaggregated
way.
2.2. Measurement of key variables
The main explanatory variable of interest in our analysis is mobile phone (MP) use. We consider
a household to be a MP user if at least one adult household member owned a mobile phone
during a particular survey year. Furthermore, we differentiate between households where only
male adults own a mobile phone (MMP) and households where at least one female adult owns a
mobile phone (FMP).
In terms of outcomes, we are particularly interested in household income, gender equality within
households, and nutrition. Household income is measured as the total income of the household
from all sources over a period of 12 months. For farm income, this also includes the value of
production not sold in the market. The cost of production was subtracted for all income derived
from self-employed activities. Annual household income is expressed in Ugandan shillings
(UGX) (1 US$ = 2,690 UGX). To be able to compare incomes between the two survey rounds,
income in 2012 was adjusted to 2015 values using the official consumer price index (UBOS,
2015).
Gender equality within the household is measured in terms of the proportion of productive assets
owned by women or jointly by male and female household members. The proportion refers to the
7
monetary value of the assets. Looking at asset ownership is common in the literature when
assessing the economic situation of women within households (Quisumbing and Maluccio, 2003;
Alsop et al. 2006; Doss et al., 2014). We are interested in how mobile phone use may influence
asset ownership. In order to reduce possible issues of reverse causality, we do not consider very
durable assets such as land or buildings. We only include short- and medium-term productive
assets such as agricultural equipment (hoes, saws, wheelbarrow, sprayers etc.) and vehicles (bike,
motorbikes, trucks etc.). In male-dominated households, such assets are predominantly owned by
the male household head or other male members. A larger proportion of such assets being owned
by females or jointly owned by male and female household members can be interpreted as a
higher degree of women empowerment.
Nutrition outcomes can be measured in different ways, including anthropometric indicators, food
consumption based measures, and households’ subjective assessments of food access (Ruel,
2003; Masset et al., 2012; Shiferaw et al. 2014; Kabunga et al., 2014; Chiputwa and Qaim, 2016).
Here, we are particularly interested in how mobile phones affect household food consumption
and dietary practices, which we measure through household dietary diversity scores. Dietary
diversity scores count the number of different food groups consumed over a specified period of
time and are a common tool to assess food security and dietary quality (Ruel, 2003; Jones et al.,
2014; Koppmair et al., 2017). Dietary diversity was also shown to be a good proxy of child
nutritional status in many situations (Arimond, 2004).
We use the data from the 7-day food consumption recall to calculate two types of dietary
diversity scores (DDS) at the household level. First, we use a DDS with 12 food groups, as is
common in the literature to calculate household dietary diversity scores for food security
assessment (Kennedy et al., 2011). The 12 food groups considered are: cereals; white roots and
8
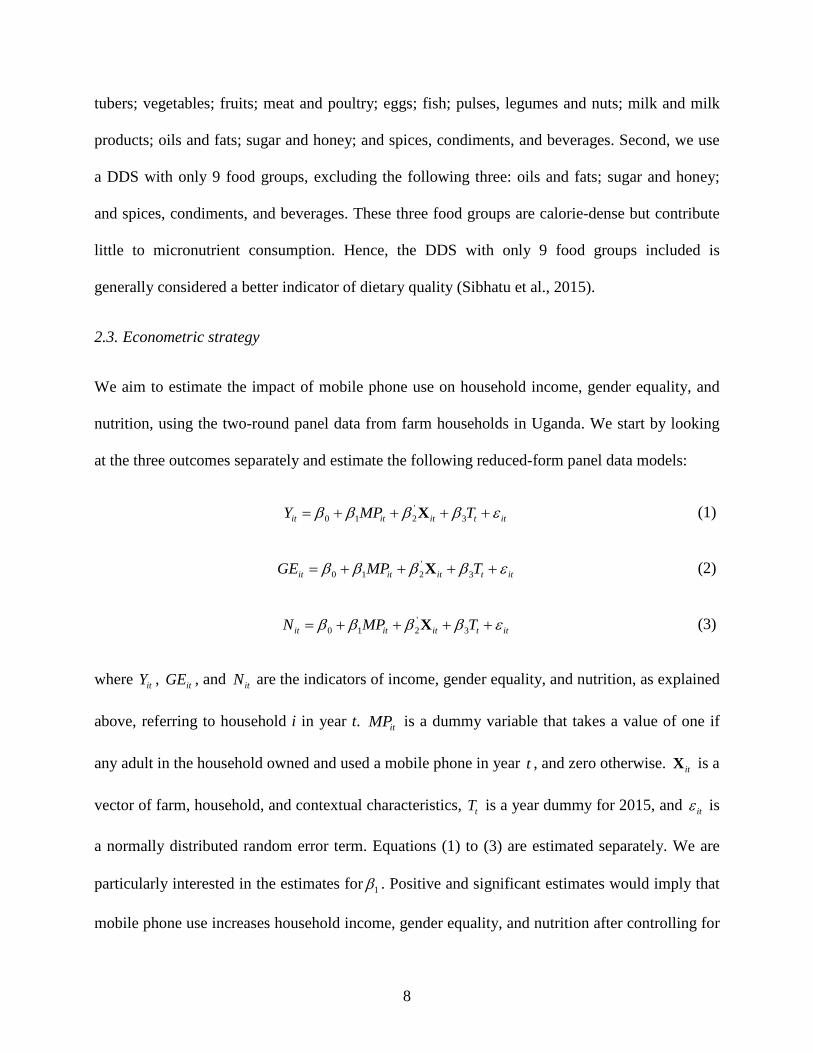
tubers; vegetables; fruits; meat and poultry; eggs; fish; pulses, legumes and nuts; milk and milk
products; oils and fats; sugar and honey; and spices, condiments, and beverages. Second, we use
a DDS with only 9 food groups, excluding the following three: oils and fats; sugar and honey;
and spices, condiments, and beverages. These three food groups are calorie-dense but contribute
little to micronutrient consumption. Hence, the DDS with only 9 food groups included is
generally considered a better indicator of dietary quality (Sibhatu et al., 2015).
2.3. Econometric strategy
We aim to estimate the impact of mobile phone use on household income, gender equality, and
nutrition, using the two-round panel data from farm households in Uganda. We start by looking
at the three outcomes separately and estimate the following reduced-form panel data models:
ittititit TMPY εββββ ++++= 3'210 X (1)
ittititit TMPGE εββββ ++++= 3'210 X (2)
ittititit TMPN εββββ ++++= 3'210 X (3)
where itY , itGE , and itN are the indicators of income, gender equality, and nutrition, as explained
above, referring to household i in year t. itMP is a dummy variable that takes a value of one if
any adult in the household owned and used a mobile phone in year t , and zero otherwise. itX is a
vector of farm, household, and contextual characteristics, tT is a year dummy for 2015, and itε is
a normally distributed random error term. Equations (1) to (3) are estimated separately. We are
particularly interested in the estimates for 1β . Positive and significant estimates would imply that
mobile phone use increases household income, gender equality, and nutrition after controlling for
9
other factors.
In a second set of estimates, we use the same reduced-form equations (1) to (3) but replace the
aggregate mobile phone use dummy with gender-disaggregated dummies. As explained above,
we use itFMP for households where at least one female adult owns a mobile phone and itMMP
for households where only male adults own and use mobile phones. To avoid collinearity
problems, we estimate separate models with each gender-specific mobile phone dummy.
All models are estimated with random effects (RE) panel estimator. However, mobile phone use
is not a completely random variable. In our sample, households deliberately chose whether or not
to adopt mobile phone technology based on preferences and constraints, some of which may be
unobserved. If mobile phone use is correlated with unobserved factors that also influence the
outcome variables directly, the RE estimator can lead to biased estimates of 1β . To test for
unobserved heterogeneity and reduce potential bias, we also use a fixed effects (FE) estimator,
which employs differencing techniques within households over time and therefore eliminates any
bias from time-invariant unobserved heterogeneity. RE and FE estimates are compared with a
Hausman test (Cameron and Trivedi, 2005). An insignificant Hausman test statistic suggests that
the RE estimator leads to consistent results and is preferable due to its higher efficiency. A
significant test statistic, on the other hand, points at problems with unobserved heterogeneity, so
that the FE estimator is preferred.
One drawback of the FE estimator is that for each variable of interest it requires sufficient
variation within households over time to produce efficient estimates. Completely time-invariant
variables drop out during estimation, and for variables with little time variation the estimates are
often unreliable. One alternative is the Mundlak approach that produces more efficient estimates
10
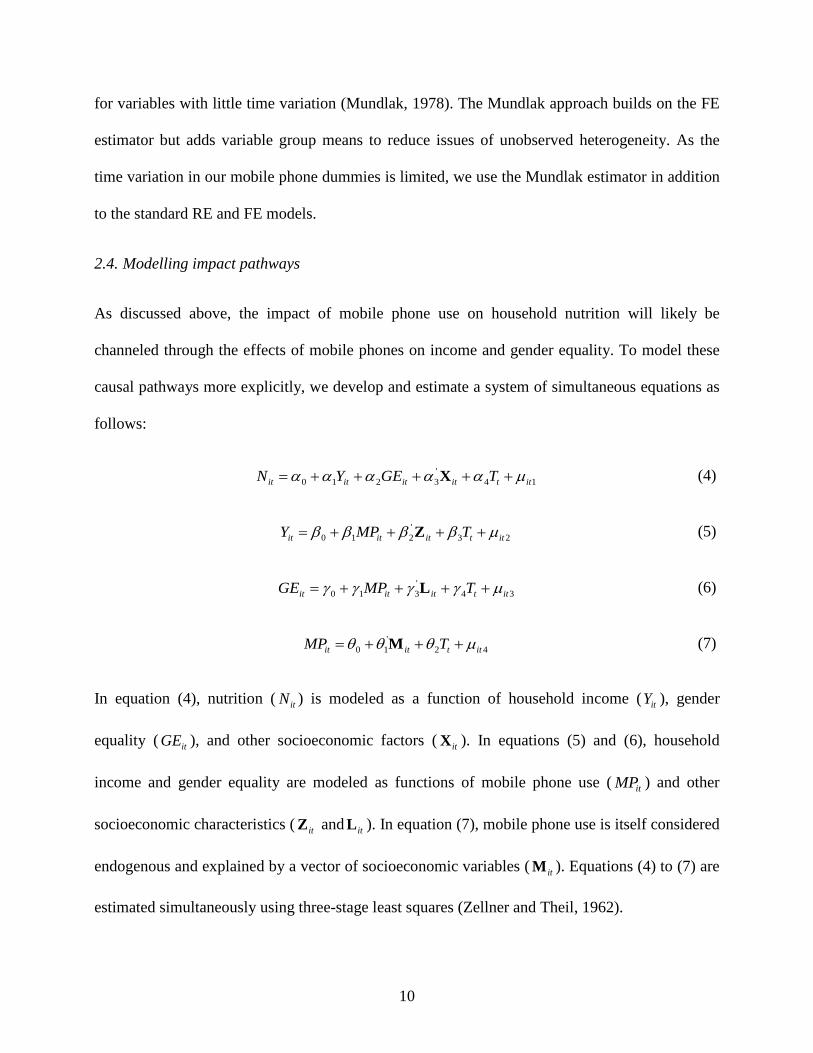
for variables with little time variation (Mundlak, 1978). The Mundlak approach builds on the FE
estimator but adds variable group means to reduce issues of unobserved heterogeneity. As the
time variation in our mobile phone dummies is limited, we use the Mundlak estimator in addition
to the standard RE and FE models.
2.4. Modelling impact pathways
As discussed above, the impact of mobile phone use on household nutrition will likely be
channeled through the effects of mobile phones on income and gender equality. To model these
causal pathways more explicitly, we develop and estimate a system of simultaneous equations as
follows:
14'3210 ittitititit TGEYN µααααα +++++= X (4)
23'210 ittititit TMPY µββββ ++++= Z (5)
34'310 ittititit TMPGE µγγγγ ++++= L (6)
42'
10 ittitit TMP µθθθ +++= M (7)
In equation (4), nutrition ( itN ) is modeled as a function of household income ( itY ), gender
equality ( itGE ), and other socioeconomic factors ( itX ). In equations (5) and (6), household
income and gender equality are modeled as functions of mobile phone use ( itMP ) and other
socioeconomic characteristics ( itZ and itL ). In equation (7), mobile phone use is itself considered
endogenous and explained by a vector of socioeconomic variables ( itM ). Equations (4) to (7) are
estimated simultaneously using three-stage least squares (Zellner and Theil, 1962).
11
The vectors itX , itZ , itL ,and itM include farm, household, and contextual characteristics that
may overlap across the different equations. For instance, in all equations we include age,
education, and gender of the household head, household size (measured in terms of adult
equivalents), land owned, distance to road, and a district dummy that can all influence mobile
phone adoption and the different welfare outcomes. For itM in equation (7) we additionally
include two instruments that are correlated with mobile phone adoption but have no effect on
household welfare through other pathways. These instruments are the strengths of the mobile
network coverage in the location of household i and the number of households using mobile
phones out of the 10 closest neighbors. Valid instruments control for unobserved heterogeneity
and also for possible reverse causality. For instance, it could be possible that the links between
mobile phone use, household income, and gender equality work in several directions. Since the
FE and Mundlak estimators cannot control for reverse causality, estimates from this simultaneous
equation model with instruments for mobile phone use can also serve as a robustness check for
the reduced-form results from equations (1) to (3).
3. Results and Discussion
3.1. Descriptive statistics
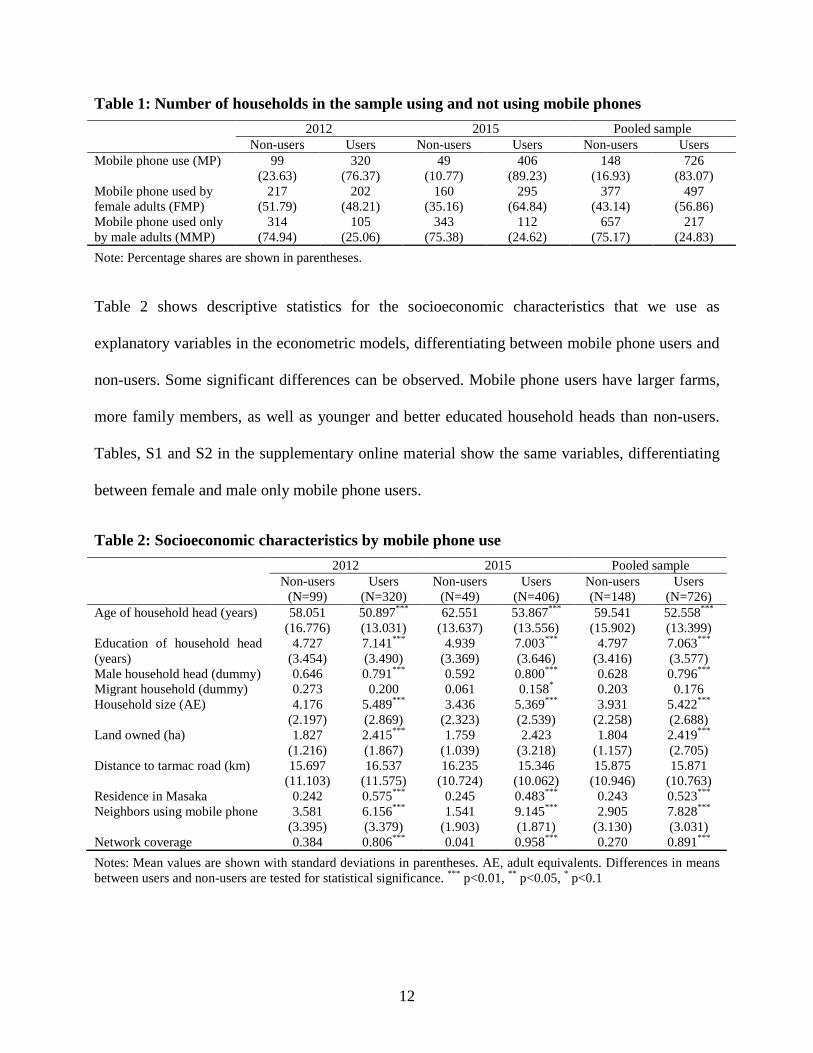
Table 1 shows the patterns of mobile phone use by households in our sample and how these
patterns developed between the two survey rounds. In 2012, 76% of the households used mobile
phones. By 2015, this proportion had increased to 89%. Table 1 also shows who within the
households actually used mobile phones. While the number of male mobile phone users did not
change much, the number of households in which females also use mobile phones increased
substantially between 2012 and 2015.
12
Table 1: Number of households in the sample using and not using mobile phones 2012 2015 Pooled sample Non-users Users Non-users Users Non-users Users Mobile phone use (MP) 99 320 49 406 148 726
(23.63) (76.37) (10.77) (89.23) (16.93) (83.07) Mobile phone used by female adults (FMP)
217 202 160 295 377 497 (51.79) (48.21) (35.16) (64.84) (43.14) (56.86)
Mobile phone used only by male adults (MMP)
314 105 343 112 657 217 (74.94) (25.06) (75.38) (24.62) (75.17) (24.83)
Note: Percentage shares are shown in parentheses.
Table 2 shows descriptive statistics for the socioeconomic characteristics that we use as
explanatory variables in the econometric models, differentiating between mobile phone users and
non-users. Some significant differences can be observed. Mobile phone users have larger farms,
more family members, as well as younger and better educated household heads than non-users.
Tables, S1 and S2 in the supplementary online material show the same variables, differentiating
between female and male only mobile phone users.
Table 2: Socioeconomic characteristics by mobile phone use 2012 2015 Pooled sample Non-users
(N=99) Users
(N=320) Non-users
(N=49) Users
(N=406) Non-users (N=148)
Users (N=726)
Age of household head (years) 58.051 50.897*** 62.551 53.867*** 59.541 52.558*** (16.776) (13.031) (13.637) (13.556) (15.902) (13.399)
Education of household head (years)
4.727 7.141*** 4.939 7.003*** 4.797 7.063*** (3.454) (3.490) (3.369) (3.646) (3.416) (3.577)
Male household head (dummy) 0.646 0.791*** 0.592 0.800*** 0.628 0.796*** Migrant household (dummy) 0.273 0.200 0.061 0.158* 0.203 0.176 Household size (AE) 4.176 5.489*** 3.436 5.369*** 3.931 5.422***
(2.197) (2.869) (2.323) (2.539) (2.258) (2.688) Land owned (ha) 1.827 2.415*** 1.759 2.423 1.804 2.419***
(1.216) (1.867) (1.039) (3.218) (1.157) (2.705) Distance to tarmac road (km) 15.697 16.537 16.235 15.346 15.875 15.871
(11.103) (11.575) (10.724) (10.062) (10.946) (10.763) Residence in Masaka 0.242 0.575*** 0.245 0.483*** 0.243 0.523*** Neighbors using mobile phone 3.581 6.156*** 1.541 9.145*** 2.905 7.828***
(3.395) (3.379) (1.903) (1.871) (3.130) (3.031) Network coverage 0.384 0.806*** 0.041 0.958*** 0.270 0.891*** Notes: Mean values are shown with standard deviations in parentheses. AE, adult equivalents. Differences in means between users and non-users are tested for statistical significance. *** p<0.01, ** p<0.05, * p<0.1
13
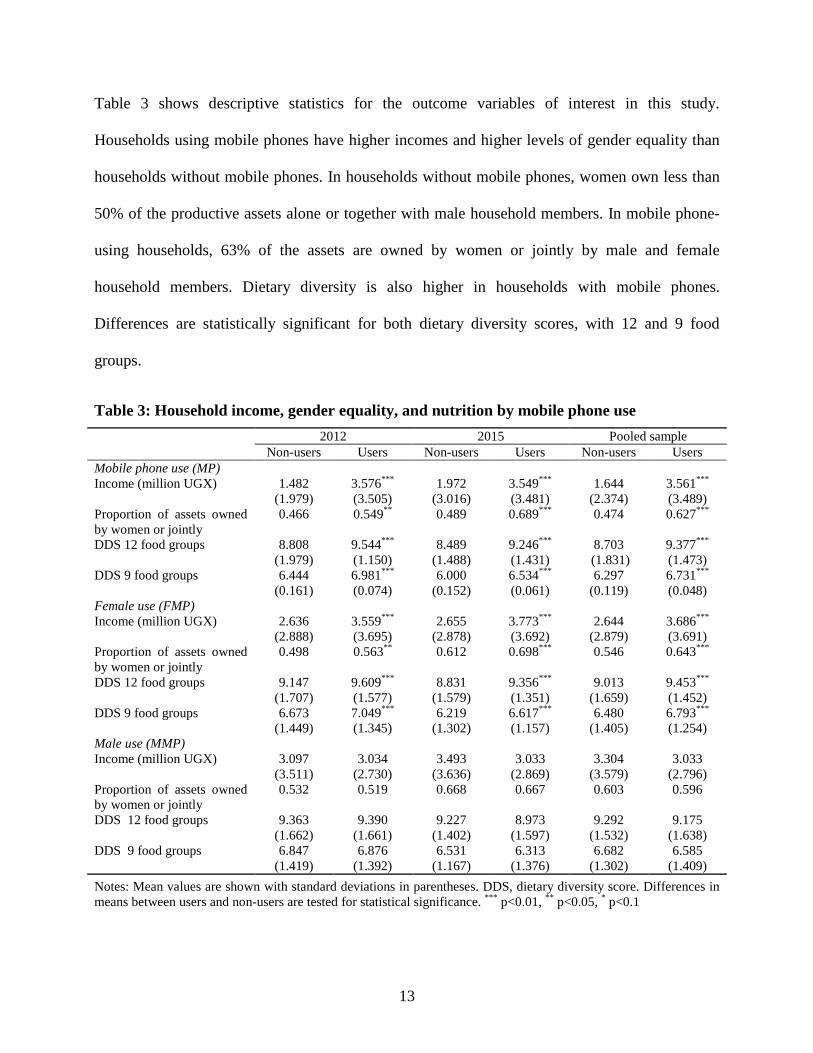
Table 3 shows descriptive statistics for the outcome variables of interest in this study.
Households using mobile phones have higher incomes and higher levels of gender equality than
households without mobile phones. In households without mobile phones, women own less than
50% of the productive assets alone or together with male household members. In mobile phone-
using households, 63% of the assets are owned by women or jointly by male and female
household members. Dietary diversity is also higher in households with mobile phones.
Differences are statistically significant for both dietary diversity scores, with 12 and 9 food
groups.
Table 3: Household income, gender equality, and nutrition by mobile phone use 2012 2015 Pooled sample Non-users Users Non-users Users Non-users Users Mobile phone use (MP) Income (million UGX) 1.482 3.576*** 1.972 3.549*** 1.644 3.561*** (1.979) (3.505) (3.016) (3.481) (2.374) (3.489) Proportion of assets owned by women or jointly
0.466 0.549** 0.489 0.689*** 0.474 0.627***
DDS 12 food groups 8.808 (1.979)
9.544*** (1.150)
8.489 (1.488)
9.246*** (1.431)
8.703 (1.831)
9.377*** (1.473)
DDS 9 food groups 6.444 6.981*** 6.000 6.534*** 6.297 6.731*** (0.161) (0.074) (0.152) (0.061) (0.119) (0.048)
Female use (FMP) Income (million UGX) 2.636 3.559*** 2.655 3.773*** 2.644 3.686*** (2.888) (3.695) (2.878) (3.692) (2.879) (3.691) Proportion of assets owned by women or jointly
0.498 0.563** 0.612 0.698*** 0.546 0.643***
DDS 12 food groups 9.147 (1.707)
9.609*** (1.577)
8.831 (1.579)
9.356*** (1.351)
9.013 (1.659)
9.453*** (1.452)
DDS 9 food groups 6.673 7.049*** 6.219 6.617*** 6.480 6.793*** (1.449) (1.345) (1.302) (1.157) (1.405) (1.254)
Male use (MMP) Income (million UGX) 3.097 3.034 3.493 3.033 3.304 3.033 (3.511) (2.730) (3.636) (2.869) (3.579) (2.796) Proportion of assets owned by women or jointly
0.532 0.519 0.668 0.667 0.603 0.596
DDS 12 food groups 9.363 (1.662)
9.390 (1.661)
9.227 (1.402)
8.973 (1.597)
9.292 (1.532)
9.175 (1.638)
DDS 9 food groups 6.847 6.876 6.531 6.313 6.682 6.585 (1.419) (1.392) (1.167) (1.376) (1.302) (1.409)
Notes: Mean values are shown with standard deviations in parentheses. DDS, dietary diversity score. Differences in means between users and non-users are tested for statistical significance. *** p<0.01, ** p<0.05, * p<0.1
14
The middle and lower parts of Table 3 show the same outcome variables differentiated by female
and male mobile phone use. While male-only use of mobile phones is not associated with
significant differences in any of the outcome variables, female use of mobile phones is.
Households in which females use mobile phones have higher incomes, more equal gender
relations, and higher levels of dietary diversity than households in which females do not use
mobile phones. The results in Table 3 lend support to the hypothesis that mobile phone use by
females has stronger positive social welfare effects than mobile phone use by males alone,
although these simple comparisons should not be over-interpreted in a causal sense. Causal
relationships are analyzed more formally below.
3.2. Aggregate effects of mobile phone use
Table 4 shows the estimation results of equations (1) and (2), using random effects (RE), fixed
effects (FE), and Mundlak (MK) estimators, as explained above. For the income model, the RE
estimator produces a positive and significant coefficient for the mobile phone use dummy.
However, the Hausman test is statistically significant, so that the RE estimate may be biased.
With the FE estimator, the effect of mobile phones is insignificant, due to a relatively large
standard error. But the MK estimator produces a positive and significant coefficient, which we
use here for interpretation. The results in column (3) of Table 4 suggest that mobile phone use
has increased household income by 0.43 million UGX, which is equivalent to a 26% gain
compared to the mean income of households without mobile phones. This is a substantial effect
that can be explained through mobile phones improving households’ access to information and
markets, lower transaction costs, and hence higher returns in agricultural and non-agricultural
activities. That mobile phones can have sizeable economic effects at the micro level was also
shown in number of previous studies (Donner, 2007; Jensen, 2007; Muto and Yamano, 2009;
15
Aker, 2010; Blauw and Franses, 2016).
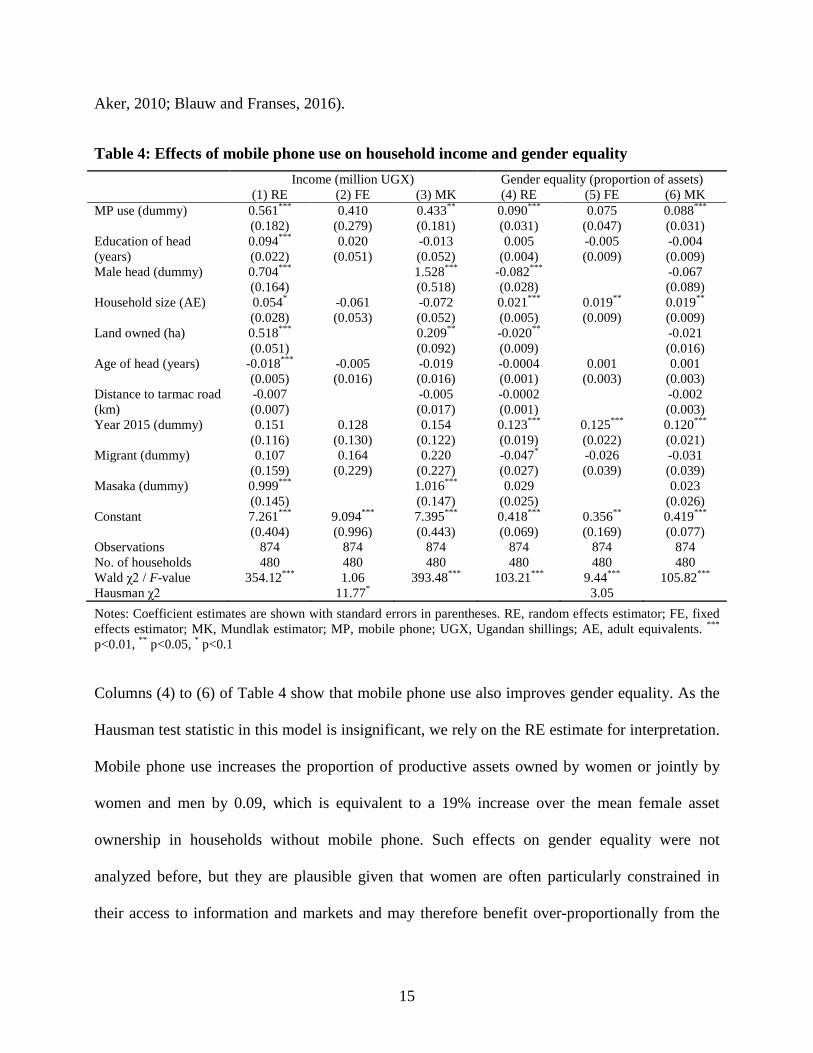
Table 4: Effects of mobile phone use on household income and gender equality Income (million UGX) Gender equality (proportion of assets) (1) RE (2) FE (3) MK (4) RE (5) FE (6) MK MP use (dummy) 0.561*** 0.410 0.433** 0.090*** 0.075 0.088***
(0.182) (0.279) (0.181) (0.031) (0.047) (0.031) Education of head (years)
0.094*** 0.020 -0.013 0.005 -0.005 -0.004 (0.022) (0.051) (0.052) (0.004) (0.009) (0.009)
Male head (dummy) 0.704*** 1.528*** -0.082*** -0.067 (0.164) (0.518) (0.028) (0.089)
Household size (AE) 0.054* -0.061 -0.072 0.021*** 0.019** 0.019** (0.028) (0.053) (0.052) (0.005) (0.009) (0.009)
Land owned (ha) 0.518*** 0.209** -0.020** -0.021 (0.051) (0.092) (0.009) (0.016)
Age of head (years) -0.018*** -0.005 -0.019 -0.0004 0.001 0.001 (0.005) (0.016) (0.016) (0.001) (0.003) (0.003)
Distance to tarmac road (km)
-0.007 -0.005 -0.0002 -0.002 (0.007) (0.017) (0.001) (0.003)
Year 2015 (dummy) 0.151 0.128 0.154 0.123*** 0.125*** 0.120*** (0.116) (0.130) (0.122) (0.019) (0.022) (0.021)
Migrant (dummy) 0.107 0.164 0.220 -0.047* -0.026 -0.031 (0.159) (0.229) (0.227) (0.027) (0.039) (0.039)
Masaka (dummy) 0.999*** 1.016*** 0.029 0.023 (0.145) (0.147) (0.025) (0.026)
Constant 7.261*** 9.094*** 7.395*** 0.418*** 0.356** 0.419*** (0.404) (0.996) (0.443) (0.069) (0.169) (0.077)
Observations 874 874 874 874 874 874 No. of households 480 480 480 480 480 480 Wald χ2 / F-value 354.12*** 1.06 393.48*** 103.21*** 9.44*** 105.82*** Hausman χ2 11.77* 3.05 Notes: Coefficient estimates are shown with standard errors in parentheses. RE, random effects estimator; FE, fixed effects estimator; MK, Mundlak estimator; MP, mobile phone; UGX, Ugandan shillings; AE, adult equivalents. *** p<0.01, ** p<0.05, * p<0.1
Columns (4) to (6) of Table 4 show that mobile phone use also improves gender equality. As the
Hausman test statistic in this model is insignificant, we rely on the RE estimate for interpretation.
Mobile phone use increases the proportion of productive assets owned by women or jointly by
women and men by 0.09, which is equivalent to a 19% increase over the mean female asset
ownership in households without mobile phone. Such effects on gender equality were not
analyzed before, but they are plausible given that women are often particularly constrained in
their access to information and markets and may therefore benefit over-proportionally from the
16
use of mobile phone technologies.
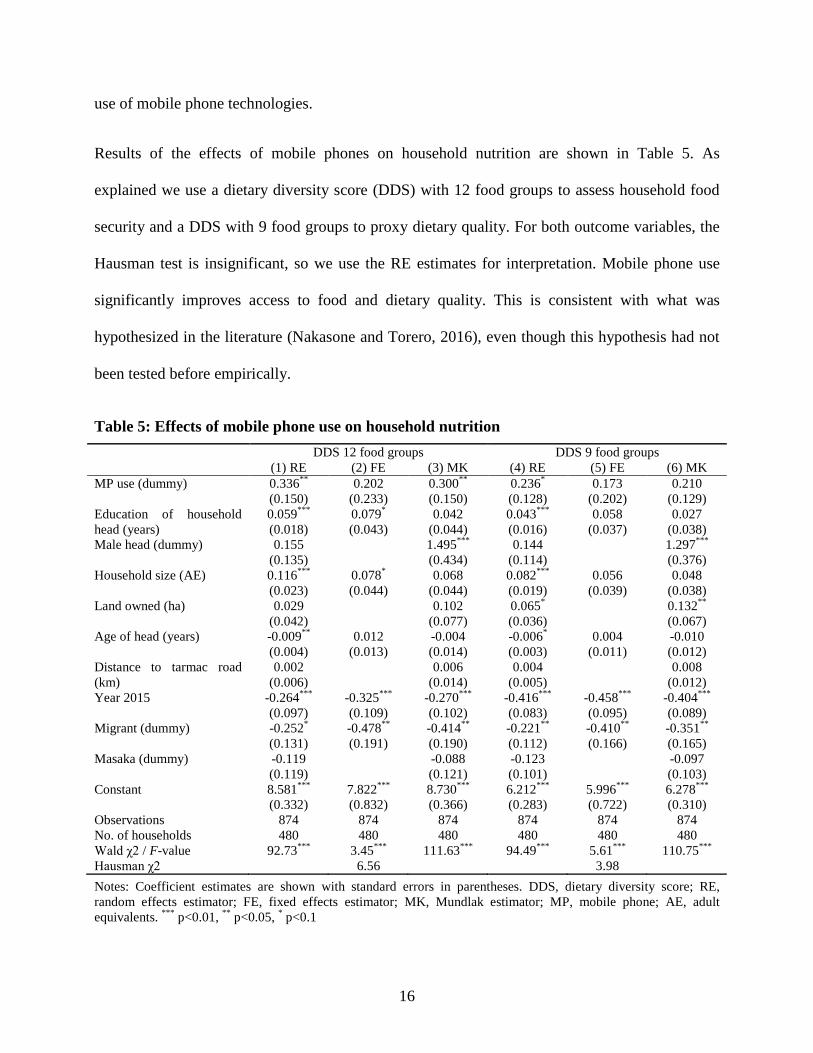
Results of the effects of mobile phones on household nutrition are shown in Table 5. As
explained we use a dietary diversity score (DDS) with 12 food groups to assess household food
security and a DDS with 9 food groups to proxy dietary quality. For both outcome variables, the
Hausman test is insignificant, so we use the RE estimates for interpretation. Mobile phone use
significantly improves access to food and dietary quality. This is consistent with what was
hypothesized in the literature (Nakasone and Torero, 2016), even though this hypothesis had not
been tested before empirically.
Table 5: Effects of mobile phone use on household nutrition DDS 12 food groups DDS 9 food groups (1) RE (2) FE (3) MK (4) RE (5) FE (6) MK MP use (dummy) 0.336** 0.202 0.300** 0.236* 0.173 0.210
(0.150) (0.233) (0.150) (0.128) (0.202) (0.129) Education of household head (years)
0.059*** 0.079* 0.042 0.043*** 0.058 0.027 (0.018) (0.043) (0.044) (0.016) (0.037) (0.038)
Male head (dummy) 0.155 1.495*** 0.144 1.297*** (0.135) (0.434) (0.114) (0.376)
Household size (AE) 0.116*** 0.078* 0.068 0.082*** 0.056 0.048 (0.023) (0.044) (0.044) (0.019) (0.039) (0.038)
Land owned (ha) 0.029 0.102 0.065* 0.132** (0.042) (0.077) (0.036) (0.067)
Age of head (years) -0.009** 0.012 -0.004 -0.006* 0.004 -0.010 (0.004) (0.013) (0.014) (0.003) (0.011) (0.012)
Distance to tarmac road (km)
0.002 0.006 0.004 0.008 (0.006) (0.014) (0.005) (0.012)
Year 2015 -0.264*** -0.325*** -0.270*** -0.416*** -0.458*** -0.404*** (0.097) (0.109) (0.102) (0.083) (0.095) (0.089)
Migrant (dummy) -0.252* -0.478** -0.414** -0.221** -0.410** -0.351** (0.131) (0.191) (0.190) (0.112) (0.166) (0.165)
Masaka (dummy) -0.119 -0.088 -0.123 -0.097 (0.119) (0.121) (0.101) (0.103)
Constant 8.581*** 7.822*** 8.730*** 6.212*** 5.996*** 6.278*** (0.332) (0.832) (0.366) (0.283) (0.722) (0.310)
Observations 874 874 874 874 874 874 No. of households 480 480 480 480 480 480 Wald χ2 / F-value 92.73*** 3.45*** 111.63*** 94.49*** 5.61*** 110.75*** Hausman χ2 6.56 3.98 Notes: Coefficient estimates are shown with standard errors in parentheses. DDS, dietary diversity score; RE, random effects estimator; FE, fixed effects estimator; MK, Mundlak estimator; MP, mobile phone; AE, adult equivalents. *** p<0.01, ** p<0.05, * p<0.1
17
A few other explanatory variables in Table 5 also have significant effects. Education of the
household head and household size tend to increase dietary diversity at the household level, while
age decreases dietary diversity, as one would expect. The 2015 dummy has a negative effect,
which can be explained by lower rainfall in the 2014 season and thus poorer agricultural harvests
than in the 2011 season that was captured in the 2012 survey round.
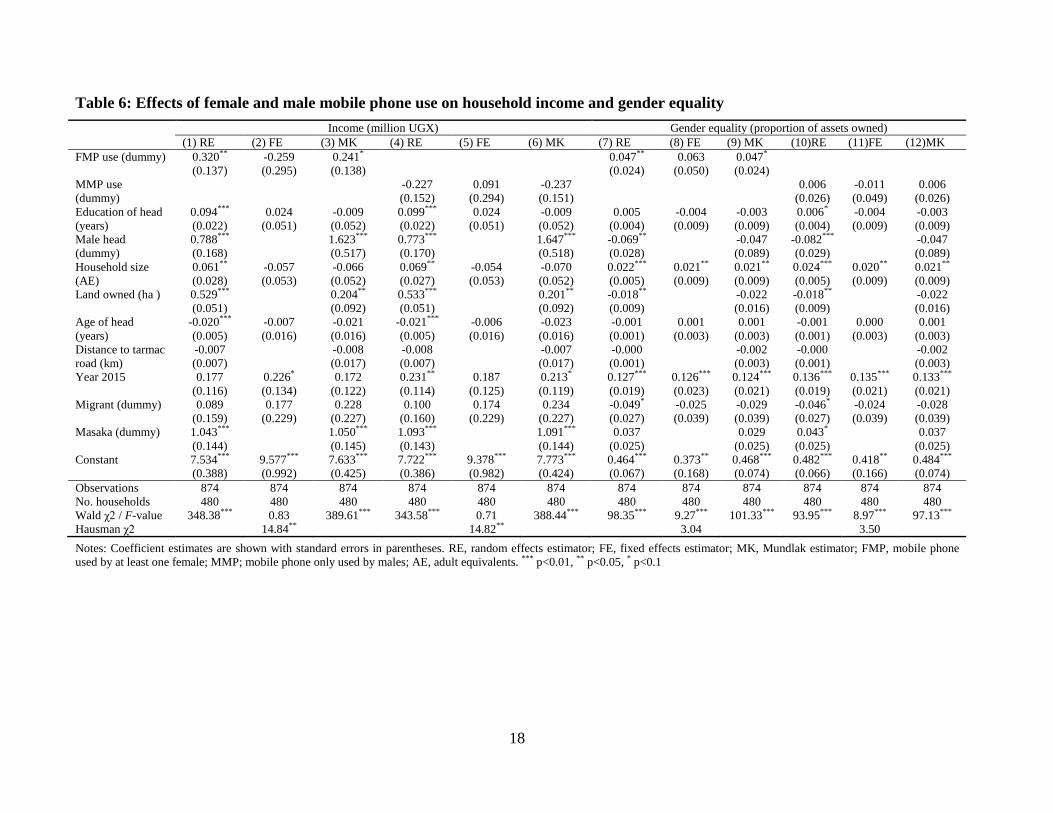
3.3. Gender-disaggregated effects of mobile phone use
So far, we have used household-level mobile phone use as the main explanatory variable in the
models, regardless of who in the household actually used mobile phones. We now differentiate
between female and male mobile phone use to gain further insights into gendered effects. Table 6
shows the estimation results for household income and gender equality. Female mobile phone use
has significantly positive effects on both outcome variables, while male mobile phone use has
not. The same pattern is also observed for the effects of female and male mobile phone use on
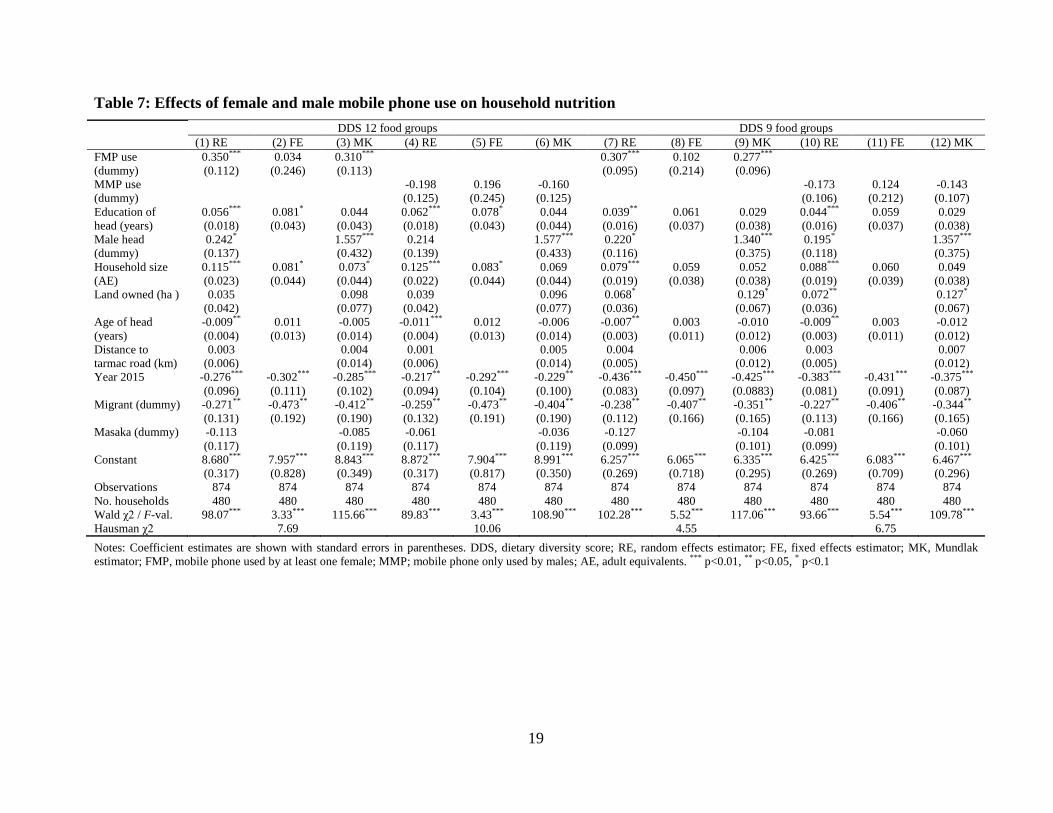
household diets, which are shown in Table 7.
The insignificant coefficients of male mobile phone use should not be over-interpreted. As
explained, the MMP dummy only captures households in which males alone use mobile phones.
In many cases, both male and female household members use mobile phones, and these cases are
captured by the FMP dummy. Nevertheless, that female mobile phone use seems to be more
important for positive social welfare effects than male mobile phone use is remarkable and in line
with our hypothesis on gendered implications. Women benefit over-proportionally from the use
of mobile phone technologies, and larger economic benefits are also reflected in enhanced gender
equality within the household and better household nutrition.
18
Table 6: Effects of female and male mobile phone use on household income and gender equality Income (million UGX) Gender equality (proportion of assets owned) (1) RE (2) FE (3) MK (4) RE (5) FE (6) MK (7) RE (8) FE (9) MK (10)RE (11)FE (12)MK FMP use (dummy) 0.320** -0.259 0.241* 0.047** 0.063 0.047*
(0.137) (0.295) (0.138) (0.024) (0.050) (0.024) MMP use (dummy)
-0.227 0.091 -0.237 0.006 -0.011 0.006 (0.152) (0.294) (0.151) (0.026) (0.049) (0.026)
Education of head (years)
0.094*** 0.024 -0.009 0.099*** 0.024 -0.009 0.005 -0.004 -0.003 0.006* -0.004 -0.003 (0.022) (0.051) (0.052) (0.022) (0.051) (0.052) (0.004) (0.009) (0.009) (0.004) (0.009) (0.009)
Male head (dummy)
0.788*** 1.623*** 0.773*** 1.647*** -0.069** -0.047 -0.082*** -0.047 (0.168) (0.517) (0.170) (0.518) (0.028) (0.089) (0.029) (0.089)
Household size (AE)
0.061** -0.057 -0.066 0.069** -0.054 -0.070 0.022*** 0.021** 0.021** 0.024*** 0.020** 0.021** (0.028) (0.053) (0.052) (0.027) (0.053) (0.052) (0.005) (0.009) (0.009) (0.005) (0.009) (0.009)
Land owned (ha ) 0.529*** 0.204** 0.533*** 0.201** -0.018** -0.022 -0.018** -0.022 (0.051) (0.092) (0.051) (0.092) (0.009) (0.016) (0.009) (0.016)
Age of head (years)
-0.020*** -0.007 -0.021 -0.021*** -0.006 -0.023 -0.001 0.001 0.001 -0.001 0.000 0.001 (0.005) (0.016) (0.016) (0.005) (0.016) (0.016) (0.001) (0.003) (0.003) (0.001) (0.003) (0.003)
Distance to tarmac road (km)
-0.007 -0.008 -0.008 -0.007 -0.000 -0.002 -0.000 -0.002 (0.007) (0.017) (0.007) (0.017) (0.001) (0.003) (0.001) (0.003)
Year 2015 0.177 0.226* 0.172 0.231** 0.187 0.213* 0.127*** 0.126*** 0.124*** 0.136*** 0.135*** 0.133*** (0.116) (0.134) (0.122) (0.114) (0.125) (0.119) (0.019) (0.023) (0.021) (0.019) (0.021) (0.021)
Migrant (dummy) 0.089 0.177 0.228 0.100 0.174 0.234 -0.049* -0.025 -0.029 -0.046* -0.024 -0.028 (0.159) (0.229) (0.227) (0.160) (0.229) (0.227) (0.027) (0.039) (0.039) (0.027) (0.039) (0.039)
Masaka (dummy) 1.043*** 1.050*** 1.093*** 1.091*** 0.037 0.029 0.043* 0.037 (0.144) (0.145) (0.143) (0.144) (0.025) (0.025) (0.025) (0.025)
Constant 7.534*** 9.577*** 7.633*** 7.722*** 9.378*** 7.773*** 0.464*** 0.373** 0.468*** 0.482*** 0.418** 0.484*** (0.388) (0.992) (0.425) (0.386) (0.982) (0.424) (0.067) (0.168) (0.074) (0.066) (0.166) (0.074)
Observations 874 874 874 874 874 874 874 874 874 874 874 874 No. households 480 480 480 480 480 480 480 480 480 480 480 480 Wald χ2 / F-value 348.38*** 0.83 389.61*** 343.58*** 0.71 388.44*** 98.35*** 9.27*** 101.33*** 93.95*** 8.97*** 97.13*** Hausman χ2 14.84** 14.82** 3.04 3.50 Notes: Coefficient estimates are shown with standard errors in parentheses. RE, random effects estimator; FE, fixed effects estimator; MK, Mundlak estimator; FMP, mobile phone used by at least one female; MMP; mobile phone only used by males; AE, adult equivalents. *** p<0.01, ** p<0.05, * p<0.1
19
Table 7: Effects of female and male mobile phone use on household nutrition DDS 12 food groups DDS 9 food groups (1) RE (2) FE (3) MK (4) RE (5) FE (6) MK (7) RE (8) FE (9) MK (10) RE (11) FE (12) MK FMP use (dummy)
0.350*** 0.034 0.310*** 0.307*** 0.102 0.277*** (0.112) (0.246) (0.113) (0.095) (0.214) (0.096)
MMP use (dummy)
-0.198 0.196 -0.160 -0.173 0.124 -0.143 (0.125) (0.245) (0.125) (0.106) (0.212) (0.107)
Education of head (years)
0.056*** 0.081* 0.044 0.062*** 0.078* 0.044 0.039** 0.061 0.029 0.044*** 0.059 0.029 (0.018) (0.043) (0.043) (0.018) (0.043) (0.044) (0.016) (0.037) (0.038) (0.016) (0.037) (0.038)
Male head (dummy)
0.242* 1.557*** 0.214 1.577*** 0.220* 1.340*** 0.195* 1.357*** (0.137) (0.432) (0.139) (0.433) (0.116) (0.375) (0.118) (0.375)
Household size (AE)
0.115*** 0.081* 0.073* 0.125*** 0.083* 0.069 0.079*** 0.059 0.052 0.088*** 0.060 0.049 (0.023) (0.044) (0.044) (0.022) (0.044) (0.044) (0.019) (0.038) (0.038) (0.019) (0.039) (0.038)
Land owned (ha ) 0.035 0.098 0.039 0.096 0.068* 0.129* 0.072** 0.127* (0.042) (0.077) (0.042) (0.077) (0.036) (0.067) (0.036) (0.067)
Age of head (years)
-0.009** 0.011 -0.005 -0.011*** 0.012 -0.006 -0.007** 0.003 -0.010 -0.009** 0.003 -0.012 (0.004) (0.013) (0.014) (0.004) (0.013) (0.014) (0.003) (0.011) (0.012) (0.003) (0.011) (0.012)
Distance to tarmac road (km)
0.003 0.004 0.001 0.005 0.004 0.006 0.003 0.007 (0.006) (0.014) (0.006) (0.014) (0.005) (0.012) (0.005) (0.012)
Year 2015 -0.276*** -0.302*** -0.285*** -0.217** -0.292*** -0.229** -0.436*** -0.450*** -0.425*** -0.383*** -0.431*** -0.375*** (0.096) (0.111) (0.102) (0.094) (0.104) (0.100) (0.083) (0.097) (0.0883) (0.081) (0.091) (0.087)
Migrant (dummy) -0.271** -0.473** -0.412** -0.259** -0.473** -0.404** -0.238** -0.407** -0.351** -0.227** -0.406** -0.344** (0.131) (0.192) (0.190) (0.132) (0.191) (0.190) (0.112) (0.166) (0.165) (0.113) (0.166) (0.165)
Masaka (dummy) -0.113 -0.085 -0.061 -0.036 -0.127 -0.104 -0.081 -0.060 (0.117) (0.119) (0.117) (0.119) (0.099) (0.101) (0.099) (0.101)
Constant 8.680*** 7.957*** 8.843*** 8.872*** 7.904*** 8.991*** 6.257*** 6.065*** 6.335*** 6.425*** 6.083*** 6.467*** (0.317) (0.828) (0.349) (0.317) (0.817) (0.350) (0.269) (0.718) (0.295) (0.269) (0.709) (0.296) Observations 874 874 874 874 874 874 874 874 874 874 874 874 No. households 480 480 480 480 480 480 480 480 480 480 480 480 Wald χ2 / F-val. 98.07*** 3.33*** 115.66*** 89.83*** 3.43*** 108.90*** 102.28*** 5.52*** 117.06*** 93.66*** 5.54*** 109.78*** Hausman χ2 7.69 10.06 4.55 6.75 Notes: Coefficient estimates are shown with standard errors in parentheses. DDS, dietary diversity score; RE, random effects estimator; FE, fixed effects estimator; MK, Mundlak estimator; FMP, mobile phone used by at least one female; MMP; mobile phone only used by males; AE, adult equivalents. *** p<0.01, ** p<0.05, * p<0.1
20
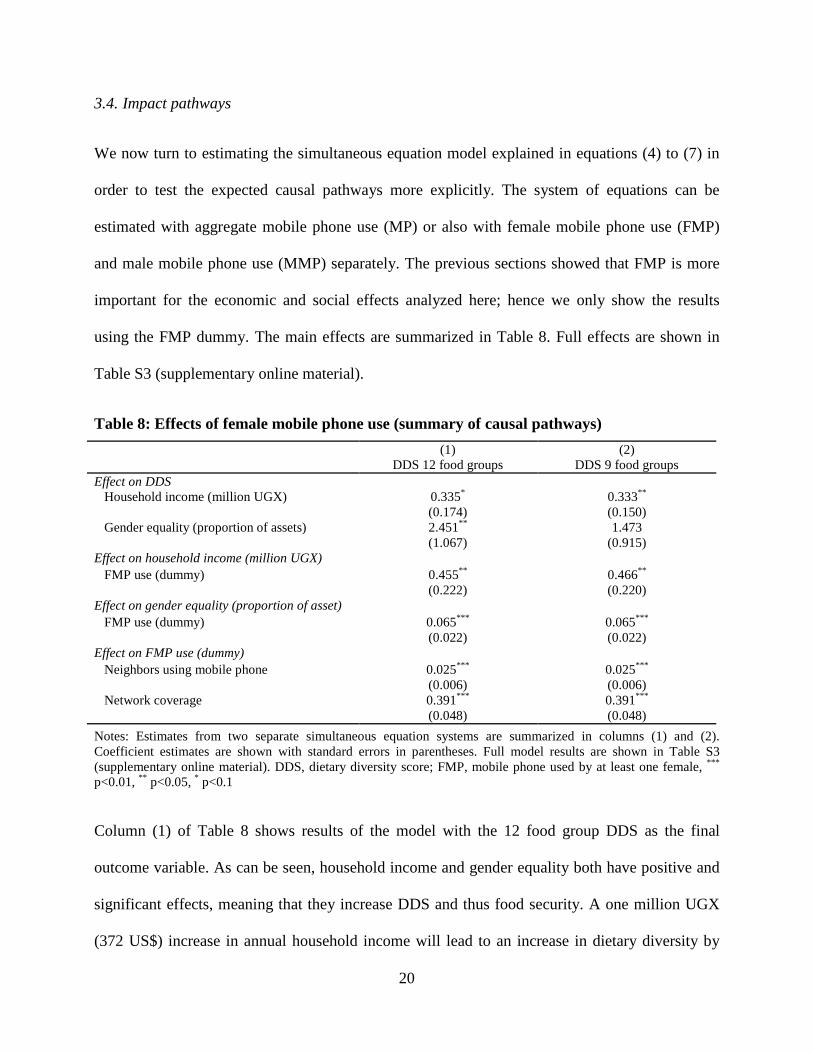
3.4. Impact pathways
We now turn to estimating the simultaneous equation model explained in equations (4) to (7) in
order to test the expected causal pathways more explicitly. The system of equations can be
estimated with aggregate mobile phone use (MP) or also with female mobile phone use (FMP)
and male mobile phone use (MMP) separately. The previous sections showed that FMP is more
important for the economic and social effects analyzed here; hence we only show the results
using the FMP dummy. The main effects are summarized in Table 8. Full effects are shown in
Table S3 (supplementary online material).
Table 8: Effects of female mobile phone use (summary of causal pathways)
Notes: Estimates from two separate simultaneous equation systems are summarized in columns (1) and (2). Coefficient estimates are shown with standard errors in parentheses. Full model results are shown in Table S3 (supplementary online material). DDS, dietary diversity score; FMP, mobile phone used by at least one female, *** p<0.01, ** p<0.05, * p<0.1
Column (1) of Table 8 shows results of the model with the 12 food group DDS as the final
outcome variable. As can be seen, household income and gender equality both have positive and
significant effects, meaning that they increase DDS and thus food security. A one million UGX
(372 US$) increase in annual household income will lead to an increase in dietary diversity by
(1) DDS 12 food groups
(2) DDS 9 food groups
Effect on DDS Household income (million UGX) 0.335* 0.333**
(0.174) (0.150) Gender equality (proportion of assets) 2.451** 1.473
(1.067) (0.915) Effect on household income (million UGX) FMP use (dummy) 0.455** 0.466**
(0.222) (0.220) Effect on gender equality (proportion of asset) FMP use (dummy) 0.065*** 0.065***
(0.022) (0.022) Effect on FMP use (dummy) Neighbors using mobile phone 0.025*** 0.025***
(0.006) (0.006) Network coverage 0.391*** 0.391***
(0.048) (0.048)
21
0.34 food groups. The coefficient of gender equality is larger, which is also due to the fact that
this variable is measured as the proportion of assets owned. When all productive assets are owned
by females or jointly by males and females in the household (as opposed to ownership by males
only), the number of food groups consumed in the household will increase by 2.45. This is a very
substantial effect, clearly underlining the importance of women empowerment for food security.
The middle part in column (1) of Table 8 shows that both variables – household income and
gender equality – are positively affected by female mobile phone use. Thus, the simultaneous
equation model confirms that the effects of mobile phones on nutrition are channeled through
household income and gender equality. We can also use the coefficient estimates in Table 8 to
calculate the relative contribution of each of these two pathways. The effect of female mobile
phone use on DDS through the income pathway is 0.455×0.335=0.152, whereas the effect
through the gender equality pathway is 0.065×2.451=0.159. Hence, female mobile phone use
contributes to improved nutrition almost equally through both pathways. And the combined effect
of 0.152+0.159=0.311 is similar in magnitude to the directly estimated effect of female mobile
phone use on DDS of 0.350 in the reduced-form model in Table 7. In other words, the two
pathways modeled here seem to explain most of the effects of mobile phones on household food
security.
The lowest part of column (1) in Table 8 shows that the two instruments employed for female
mobile phone use – number of neighbors using mobile phones and network coverage – are highly
significant. The consistency of this instrumental variable approach with the earlier results
confirms the robustness of the findings and also suggests that reverse causality is not an issue.
Column (2) of Table 8 shows estimates for the same simultaneous equation model but now using
the 9 food group DDS as the final outcome variable. The results are very similar to those in
22
column (1), only that the gender equality effect on DDS is smaller and statistically insignificant.
This model suggests that income is more important for dietary quality than women
empowerment. However, concluding that gender equality would not matter at all would be
wrong. When excluding income from this model, the coefficient of gender equality increases and
turns significant, meaning that income and gender equality are positively correlated.
4. Conclusion
Mobile phone technologies have spread very rapidly in rural Africa and other parts of the
developing world. While previous studies had analyzed effects of mobile phone use on economic
indicators – such as input and output prices, profits, and income – research on implications for
broader social development is scarce. Better understanding social welfare effects is of particular
importance against the background of the United Nations’ Sustainable Development Goals. In
this paper, we have used data from farm households in Uganda to analyze effects of mobile
phone use on household income, gender equality, and nutrition. Gender equality was measured in
terms of the proportion of household productive assets owned by females or jointly by female and
male household members, as opposed to ownership by male members alone. Nutrition was
measured in terms of two dietary diversity scores that portray food security and dietary quality.
Results from reduced-form panel regressions showed that mobile phone use has positive and
significant effects on income and gender equality. After controlling for other factors, mobile
phone use has increased household income by 26% and gender equality by 19%. Likewise,
mobile phone use has enhanced household food security and dietary quality. Gender
disaggregation further revealed that female mobile phone use has stronger positive effects than
23
male mobile phone use alone. Women seem to benefit over-proportionally from mobile phone
technologies, which is plausible given that women are often particularly constrained in their
access to markets and information. Hence, a new technology that helps reduce transaction costs
and allows new forms of communication can be particularly advantageous for women. Higher
incomes and better access to information for women influence their bargaining position within
the household, thus also improving gender equality.
Simultaneous equation models were used to analyze causal pathways of these effects more
explicitly. Estimation results showed that the effects of mobile phones on household diets are
primarily channeled through the income and gender equality pathways. Both variables
significantly affect dietary diversity, and both variables are positively affected by mobile phone
use. In terms of relative magnitudes, both channels play almost equal roles for the nutrition
effects of mobile phone technologies. In the simultaneous equation models, we also used
instrumental variables to explain mobile phone adoption, thus controlling for reverse causality
and other possible endogeneity issues. The similarity of the results between the reduced-form and
the simultaneous equation models underlines the robustness of the findings.
Nevertheless, a few limitations are worth highlighting. First, our results refer to the specific
setting in Uganda and cannot be generalized without further analysis in other regions. Second,
our panel data only include two survey rounds. While a panel has clear advantages over cross-
section data, more survey rounds would be useful for increasing the reliability of the impact
estimates and for better capturing possible long-term effects. Third, and related to the previous
point, our panel survey covers a time span in which many of the rural households in Uganda had
already adopted mobile phones. Adoption rates further increased between the first and the second
survey round, but it is possible that an earlier baseline survey with lower adoption rates would
24
have led to somewhat different results. Unfortunately, such baseline data were not available. In
spite of these limitations, we cautiously conclude that mobile phone technologies can improve
gender equality and nutrition in rural households, especially when women have access to mobile
phones. Gender-sensitive promotion strategies will have to ensure that these potentials are
realized at large scale.
References
Aker, J. C., 2010. Information from markets near and far: mobile phones and agricultural markets
in Niger. American Economic Journal: Applied Economics 2 (3): 46–59.
Aker, J. C., 2011. Dial “A” for agriculture: a review of information and communication
technologies for agricultural extension in developing countries. Agricultural Economics,
42 (6): 631–647.
Aker, J.C., Ksoll, C., 2016. Can mobile phones improve agricultural outcomes? Evidence from a
randomized experiment in Niger. Food Policy, 60: 44–51.
Aker, J. C., Mbiti, I.M., 2010. Mobile phones and economic development in Africa. Journal of
Economic Perspectives, 24 (3): 207–232.
Alsop, R., Bertelsen, F. M., Holland, J., 2006. Empowerment in Practice: From Analysis to
Implementation. The World Bank, Washington, DC.
Arimond, M. 2004. Dietary diversity is associated with child nutritional status: evidence from 11
demographic and health surveys. Journal of Nutrition, 134 (10): 2579-2585.
Bayes, A., 2001. Infrastructure and rural development: Insights from Grameen Bank village
phone initiative in Bangladesh. Agricultural Economics, 25: 261–272.
25
Blauw, S., Franses, H. P., 2016. Off the hook: measuring the impact of mobile telephone use on
economic development of households in Uganda using copulas. Journal of Development
Studies 52 (3), 315–330.
Boulos, K. N. M., Wheeler, S., Tavares, C., Jones, R., 2011. How smartphones are changing the
face of mobile and participatory healthcare: an overview, with example from eCAALYX.
BioMedical Engineering OnLine 10(24): 1–14.
Cameron, A.C., Trivedi, P.K., 2005. Microeconometrics: Methods and Applications. Cambridge
University Press, Cambridge.
Chiputwa, B., Qaim, M., 2016. Sustainability standards, gender, and nutrition among smallholder
farmers in Uganda. Journal of Development Studies 52 (9): 1241-1257.
Chiputwa, B., Spielman, D.J., Qaim, M., 2015. Food standards, certification, and poverty among
coffee farmers in Uganda. World Development 66 (1): 400-412.
Donner, J., 2007. The use of mobile phones by microentrepreneurs in Kigali, Rwanda: Changes
to social and business networks. Information Technologies and International Development
3 (2): 3–19.
Doss, C.R., Deere, C.D., Oduro, A.D., Swaminathan, H., 2014. The gender asset and wealth gaps.
Development 57 (3-4): 400–409.
Duncombe, R., Boateng, R., 2009. Mobile phones and financial services in developing countries:
A review of concepts, methods, issues, evidence and future research directions. Third
World Quarterly 30 (7): 1237–1258.
Fischer, E., Qaim, M., 2012. Gender, agricultural commercialization, and collective action in
Kenya. Food Security 4 (3): 441-453.
26
Fozdar, I. B., Kumar, S. L., 2007. Mobile learning and student retention. International Review of
Research in Open and Distance Learning 8 (2): 1–18.
Hoddinott, J., 2012. Agriculture, health, and nutrition: Towards conceptualizing the linkages. In:
Fan, S., Pandya-Lorch, R., Eds. Reshaping Agriculture for Nutrition and Health.
International Food Policy Research Institute, Washington, DC, pp. 13-20.
Jensen, T. R., 2007. The digital provide: Information (technology), market performance, and
welfare in the South Indian fisheries sector. Quarterly Journal of Economics 122(3): 879–
924.
Jones, A. D., Shrinivas, A., Bezner-Kerr, R., 2014. Farm production diversity is associated with
greater household dietary diversity in Malawi: Findings from nationally representative
data. Food Policy, 46: 1–12.
Kabunga, N. S., Dubois, T., Qaim, M., 2014. Impact of tissue culture banana technology on farm
household income and food security in Kenya. Food Policy, 45: 25–34.
Kennedy, G., Ballard, T., Dop, M.C., 2011. Guidelines for Measuring Household and Individual
Dietary Diversity. Food and Agriculture Organization, Rome.
Kikulwe, E.M., Fischer, E., Qaim, M., 2014. Mobile money, smallholder farmers, and household
welfare in Kenya. PLOS ONE 9 (10), e109804.
Koppmair, S., Kassie, M., M, Qaim., 2017. Farm production, market access and dietary diversity
in Malawi. Public Health Nutrition, 20 (2): 325–335.
Masset, E., Haddad, L., Cornelius, A., Isaza-Castro, J., 2012. Effectiveness of agricultural
interventions that aim to improve nutritional status of children: Systematic review. British
Medical Journal 344, doi. 10.1136/bmj.d8222.
27
Mundlak, Y., 1978. On the pooling of time series and cross section data. Econometrica, 46 (1):
69–85.
Munyegera, G.K., Matsumoto, T., 2016. Mobile money, remittances, and household welfare:
panel evidence from rural Uganda. World Development, 79: 127–137.
Muto, M., Yamano, T., 2009. The impact of mobile phone coverage expansion on market
participation: panel data evidence from Uganda. World Development, 37 (12): 1887–
1896.
Nakasone, E., Torero, M., Minten, B., 2014. The power of information: the ICT revolution in
agricultural development. Annual Review of Resource Economics 6: 533–550.
Nakasone, E., Torero, M., 2016. A text message away: ICTs as a tool to improve food security.
Agricultural Economics, 47: 49 – 59
Nath, V., 2001. Empowerment and governance through information and communications
technologies: Women’s perspective. International Information & Library Review 33:
317– 339.
PRC, 2015. Cell Phones in Africa: Communication Lifeline. Pew Research Center, Washington,
DC.
Quisumbing, A. R., Maluccio, J. A., 2003. Resources at marriage and intrahousehold allocation:
Evidence from Bangladesh, Ethiopia, Indonesia, and South Africa. Oxford Bulletin of
Economics and Statistics, 65: 283–327.
Ruel, M.T., 2003. Operationalizing dietary diversity: A review of measurement issues and
research priorities. Journal of Nutrition, 133: 3911S–3926S.

28
Sekabira, H., Qaim, M., 2017. Mobile money, agricultural marketing, and off-farm income in
Uganda. Agricultural Economics, in press.
Sibhatu, K. T., Krishna, V. V., Qaim, M., 2015. Production diversity and dietary diversity in
smallholder farm households. Proceedings of the National Academy of Sciences USA
112: 10657–10662.
Shiferaw, B., Kassie, M., Jaleta, M., Yirga, C., 2014. Adoption of improved wheat varieties and
impacts on household food security in Ethiopia. Food Policy 44: 272–284.
UBOS, 2015. Statistical Abstract. Uganda Bureau of Statistics. Kampala.
UCC, 2015. Postal, Broadcasting and Telecommunications Annual Market and Industry Report.
Uganda Communications Commission, Kampala.
Udry, C., 1996. Gender, agricultural production, and the theory of the household. Journal of
Political Economy 104 (5): 1010–1046.
Zellner, A., Theil, H., 1962. Three-stage least squares: Simultaneous estimation of simultaneous
equations. Econometrica. 30 (1): 54–78.