Embed Size (px)
Citation preview

Netsu Sokutei 43 (W43), 29-38 (2016)
Netsu Sokutei 43 (W43) 2016 © 2016 The Japan Society of Calorimetry and Thermal Analysis 29
Netsu Sokutei - Special Issue of “Education and Practice on Calorimetry and Thermal Analysis” 【 Review 】
Rubber Elasticity in Thermodynamics Courses
Takasuke Matsuoa and Nobuaki Azumab
a Clark Memorial International High School,
Tennouji Campus and Graduate School of Science, Osaka University b Research Center for Structural Thermodynamics,
Graduate School of Science, Osaka University
(Received Feb. 1, 2016; Accepted Feb. 2, 2016)
We have constructed an apparatus by which the temperature of a piece of rubber is measured while it is stretched or allowed to shrink. The length of the rubber piece and the tension on it are also measured. Resulting data represent the mechanocaloric effect in rubber in which the entropy behaves as a conserved quantity under a favorable condition. Its transfer between the conformational and thermal degrees of freedom allows the entropy of deformation to be determined quantitatively for the polymer material. The explicit change of the mode of entropy is useful in introduction of the entropy concept in thermodynamic courses. Construction of the apparatus and its operation are described in detail for those who will take up the subject in a thesis for a bachelor’s or higher degree. Possible uses of the mechanocaloric method in soft matter research are also discussed. Keywords: Mechanocaloric Effect, Entropy Elasticity, Natural Rubber, PDMS Rubber, EP Rubber, Reversibility, Irreversibility
松尾 隆祐 Takasuke Matsuo E-mail: [email protected]
東 信晃 Nobuaki Azuma E-mail: [email protected]

Netsu Sokutei - Special Issue of “Education and Practice on Calorimetry and Thermal Analysis”
Netsu Sokutei 43 (W43) 2016 30
1. Introduction Students who start learning thermodynamics often find the
quantity entropy most difficult to understand and internalize. Its definition as the amount of heat divided by the temperature does not allow us to understand it as we understand, e.g., the mass density of a substance as the mass divided by the volume. In the kinetic theory of gas, we understand a macroscopic property of a gas as the sum of the corresponding property of the constituent molecule. For the energy, the sum of the kinetic energy of the molecules gives the internal energy of the gas, and the sum of the impulse by molecules hitting the wall gives the pressure. The sum of a component of the dipole moment of polar molecules gives the macroscopic polarization of the gas in an electric field. Similarly, it is reasonable to assume that the heat capacity of a gas is equal to the increment, per kelvin, of the total molecular energy of the gas with temperature. But we cannot interpret the entropy of a gas in the same fashion, despite the same dimension (i.e., the energy divided by temperature) that entropy shares with heat capacity. This is because we cannot define the entropy of a single molecule as we do its energy, momentum or dipole moment.
In our daily life, we frequently experience combustion heating, frictional heating, Joule electrical heating and other thermal phenomena. Through all of these we understand, at least in principle, how the energy is conserved, which helps us accept the first law of thermodynamics as the fundamental rule behind all the natural phenomena. By contrast, the three thermal phenomena mentioned above are processes in which the entropy increases. We cannot experience the entropy as a conserved quantity in our daily life. This is because our daily experiences with heat involve its transfer by conduction in solids, convection in fluids or radiation through space over a macroscopic distance. These are by definition processes by which the entropy increases.
We may think of a process in which the entropy is conserved, e.g., adiabatic compression of gas. Isaac Newton (1687) derived a mathematical expression for the speed of sound in air. Using the isothermal compressibility of air in his equation, he calculated a sound speed which does not agree with the experimental value. Later, Simon Laplace obtained the correct value by using the adiabatic compressibility instead of the isothermal compressibility.1) The calculation tells that the temperature of air rises where it is densified and falls where it is rarified as the sound wave propagates through it. There was a complicated history of assertion and rebuttal on the calculation by Biot, Laplace, Poisson and others until it was finally settled, showing the difficulty of an indirect logic in the subtle discussion involving quantities which are not directly measurable (i.e., the change of temperature of air as sound waves traverse it), though it should be pointed out that scientific progress is achieved as a result of the endeavor to solve such difficulties.2)
Rise of the temperature of air on compression can be known from the warming of a bicycle air pump, the glowing of shooting stars or meteorological Foehn warming. Analysis of thermodynamics involved in these is important and immensely interesting. But it is still desirable to have an easily realizable thermodynamic device in which we can measure the entropy as a conserved physical quantity.
2. Mechanocaloric Effect in Rubber
There is a process that reveals directly the relation
between the heat and entropy; the mechanocaloric effect. It is a reversible thermodynamic process in which heat is generated in a matter when it is deformed, and the same amount of heat is absorbed when it is allowed to revert to the original state. In mechanics we discuss the relation between the deformation and its conjugate force. In thermodynamics we discuss the relation
between the conjugate quantities as well as non-conjugate quantities. The mechanocaloric effect arises from coupling between these non-conjugate quantities. Similar effects are known in dielectrics. An electric polarization resulting from an external force is the piezoelectricity and one that occurs as a result of temperature change is the pyroelectricity. The electrocaloric effect is also known,3) which means heat evolution caused by an applied electric field, in close analogy with the mechanocaloric effect. The temperature of this type of dielectric material changes if the field is applied adiabatically, and a certain amount of heat evolves from the material if the field is applied isothermally. Magnetocaloric effects are also known as an established technique for production of low temperature by adiabatic demagnetization.1)
The simplest case of the mechanocaloric effect may be the adiabatic compression / decompression of a gas, resulting in temperature rise / fall. Actual measurement of the temperature change is difficult because the heat capacity density of gas is much smaller than that of the piston-cylinder containing it. Incidentally it should be remembered that compression of gas corresponds to elongation of rubber and decompression to contraction. This is sometimes stated erroneously the other way around.
In the discussion so far, we have assumed that all the processes take place reversibly. But in an actual situation, the gas has viscosity and rubber internal friction. These cause the mechanical energy to be dissipated. Energy dissipation results in the rise of the temperature. If this effect is not negligible, the reversible temperature rise is further increased by irreversible heating and the reversible temperature fall is partially cancelled thereby. Both cases are actually known for different rubber materials, as will be shown below.
The mechanocaloric effect in rubber has been taken up in the context of rubber elasticity in general.4-6) But its treatment has been rather limited partly because of the limited number of experimental investigations published so far compared with mechanical measurements which have been more actively undertaken.
3. Historical Remarks
In 1859, J. P. Joule described the measurement of the
mechanocaloric effect in rubber.7) He constructed an extremely sensitive and stable galvanometer and measured the electromotive forces (emf) of metals, alloys and semi-metal elements with it. Following a suggestion from Thomson and utilizing his own emf data, he developed a method of temperature measurement, which we now know as the thermocouple.8) The temperature scale had been established fairly well by that time, so that he was able to determine the temperature change with a resolution of 1/8800 K from the deflection of his galvanometer. The small size of a thermocouple junction made it possible to measure the temperature of a small part of a material. He studied the effect of tensile force on pure metals, alloys, India rubber, gutta-percha and various woods. All the metals and most of the woods gave small negative values of temperature change (i.e., the temperature decreased) when stretched. But vulcanized India rubber gave a large positive temperature change. His rubber sample was a rod 9.53 × 9.53 cm2 square in the cross-section. It required a weight of 22 kg to stretch to twice the natural length. This large size of the rubber apparently allowed him to take a long enough time to measure the temperature precisely. Figure 1 shows his data of the temperature change of rubber vs. relative elongation (= the length under stress / free length) taken from his publication.7) His data (blue diamonds) are reproduced well by ours. We see that he measured very small temperature changes with high precision. Our data for elongation and contraction are slightly different from each other. He states that he obtained the same results for the two processes, i.e., the elongation and contraction
Rubber Elasticity in Thermodynamics Courses
Netsu Sokutei 43 (W43) 2016 31
were reversible. This may be explained by the different time rate of deformation in his and our experiments. He does not give the time rate of elongation in his paper but it is likely that the large weight needed in his experiment took a much longer time to stress and un-stress the sample than the lighter device in our experiment.
The good agreement between his and our data means that the rubber material he obtained in Manchester in 1850s was essentially the same as the one we bought in a stationery store in Osaka in 2013 with respect to their mechanocaloric properties. This is gratifying but there may be lucky coincidence involved here, because there are a number of variables such as vulcanizing agents, their concentration, fillers and others that change the properties of rubber.
Fig.1 Temperature change of a natural rubber sample vs. relative elongation. Red pluses: elongation, green pluses: contraction. Blue diamonds: Joule’s 1859 data (ref. 7).
As to the measurement of temperature, Joule employed thermocouple wires of a relatively large diameter of 0.6 mm. Low electric resistance thus realized gave his galvanometer a high current sensitivity. He calibrated the thermocouple frequently, ensuring high accuracy of the temperature he determined from the galvanometer reading. Our present digital apparatus measures the thermocouple signal as voltage. This is immensely more convenient than the current measurement. But the convenience comes at a cost of losing the temperature resolution below 1 V (approximately equal to 0.016 K). If we follow Joule’s method with the today’s technology of current measurement, we should be able to obtain a better current resolution than his. However, fine thermocouple wires useful for the present purpose will not be compatible with stable and sensitive current detection. It may be added that our data points plotted in Fig.1 are those in the smallest elongation region of our measurement.
4. Experimental Apparatus for Measurement of Mechanocaloric Effects
Mechanocaloric effects continued to attract the attention
of researchers as an interesting response of matter to force and as a way of investigating rubber as an industrial material.9-11) The principle of the experiment was the same, i.e., the temperature of a rubber sample was measured while it is deformed. Effects of the time rate of deformation were also studied12) and precise determination of the heat effect was achieved by the use of a sensitive calorimeter.13)
The apparatus to be described here is based on the same principle but it has been designed to be made with easily available materials. A rubber sample is stretched and the tension on the sample is measured with a spring balance. The length of the sample is measured as the distance between a pair of marks painted on it. The temperature is measured with a thermocouple inserted between the sample (rubber tapes, see below for detail).
The tensile force on the sample, its length and its temperature change thus determined are the set of data obtained from the measurement. In an early version of the apparatus we used analog electronics for the temperature measurement.14) It was digitalized15,16) and further changed as described below for better performance of the experiment. A block diagram of the apparatus is shown in Fig.2.
Fig.2 Block diagram of the apparatus. The Sample Stage The sample is fixed on a vertically held wooden pole, 160 cm long and 4.5 cm × 1.5 cm in the cross-section (See Fig.3). A triangle made of an iron piece, 2 mm in diameter and 20mm in the side, is held on the pole at ca. 7 cm from the top. A sample rubber tape, 15 mm wide, is hung on its lower side, as shown in Fig.3. Its lower ends are rolled on a small iron piece (2 mm × 20 mm) and caught between the jaws of a small but strong clip. To secure good thermal contact between the sample and thermocouple, it is important to keep the folded sections of the rubber tape in touch with each other, with the thermocouple junction held in between. This is done with a piece of stainless steel wire formed into a tiny paper clip.
Fig.3 The upper part of the apparatus showing the sample, its triangular support, coiled thermocouple wire, clip, and centimeter scale, covered with a transparent box. One of the two fans and two fins separating the front and rear halves of the sample space are also shown.

Netsu Sokutei - Special Issue of “Education and Practice on Calorimetry and Thermal Analysis”
Netsu Sokutei 43 (W43) 2016 32
The length of the folded rubber tape is ca. 60 mm, with two marks for measurement of the length painted at a separation of 40~50 mm. A 40 cm length of stainless steel wire is connected to the clip that catches lower end of the sample. The other end of the wire is further connected to a spring balance (2 kg or 5 kg full scale force). The lower end of the balance (the part ending with a hook) is hooked onto one of 60 screw nails planted at 1 cm intervals along the center line of the pole. One can give a desired elongation to the sample by choosing one of the sixty stoppers.
The distance between the marks is measured with a 50 cm ruler attached to the pole along its length close to but not in touch with the sample. Likely random errors in the measurement of the length of the sample thus determined are 0.5 to 1 mm, corresponding to 1 to 2 % of the actual length.
Fig.4 The entire apparatus with the thermal insulation jacket removed. Temperature control of the sample environment The upper part of the pole where the sample is located is covered with an aluminum box 35 cm long, 4.5 cm wide and 3.5 cm high. The main face of the cover is made of a transparent plastic plate through which the length of the sample tape is read. The upper face of the box has a cut through which the metal wire supporting the sample in the box is connected to a screw fixed to the upper end of the pole as shown in Fig.3. The lower end of the box is open. The box provides a stable environment of air for the sample and is indispensable for stabilization of the temperature of the sample. Without this box, the air stream from the fans immediately cools the sample as its temperature rises by the mechanocaloric effect, thus making it impossible to measure the temperature rise. The temperature of the sample environment is measured with an alcohol thermometer placed outside the box.
The upper part of the pole where the sample is situated in the box is covered with a cylinder (55 cm high and 18 cm in diameter) made of a transparent sheet of plastic. It is thermally insulated by three layers of insulating material. The insulation has a 1 cm wide slit through which the sample length and the alcohol thermometer are read. If one wants to measure the mechanocaloric response only at room temperature, the sample environment thus realized is sufficiently stable without addition of an active temperature controller.
For measurement at higher temperatures, the temperature of the sample space is controlled. For this purpose, a small electric fan (power consumption of 2 W) is placed on the rear side of the pole at 35 cm from the top. It sends a stream of air upwards. Two separate coils of heating wire (of 30 Nichrome each) wound on crossed boards of insulating material (40 mm by 60 mm) are fixed above the fan at the center of the air stream to ensure efficient transfer of heat from the wire to the air. A thermistor of a nominal resistance of 10 ksenses the temperature at 12 cm down-stream from the upper heating coil. The thermistor forms an arm of a DC Wheatstone bridge whose off-balance signal is amplified and fed back to the lower of the two heating wires (see Fig.2). The temperature-controlled stream of air flows up the rear space in the insulation cylinder to the top. There it is circulated down by another fan located on the front side of the central pole near its top. Unwanted mixing of the upward and downward streams of air is avoided by two fins (20 cm by 6 cm) of plastic material attached to both sides of the central pole. This effectively separates the up-current in the rear space and the down-current in the front in the temperature controlled cylinder. The thermistor is calibrated against the alcohol thermometer (or the thermocouple described below) to relate the temperature of the sample space to the setting of the potentiometer of the Wheatstone bridge.
For measurement at higher temperatures (40 °C and above) where a larger heating power is needed, a constant power is supplied to the second heating wire. Since the power of this second heater need not be controlled, it is simply powered with an adjustable AC source so as to let the first heater work properly within its available power. The maximum current for the controlled heater is 0.84 A from a stabilized DC source. In designing and using this type of an air thermostat, it is immensely important that the air stream from the fans takes the heat generated in the heating wire as fast as possible and that any local overheating should be avoided. The maximum allowed heating power should be determined by changing the power in a dry run and never be exceeded in an actual experiment. Most importantly, the heating power should never be turned on without first turning on the fans. Otherwise, the heating wire will be destroyed by overheating in 10 seconds. Thermometry There are two temperature measurements in this experiment. One is the measurement of the temperature change of the sample as it undergoes deformation and the other is the measurement of the absolute temperature of the sample.
Temperature change of the sample is measured with a thermocouple inserted between the sample rubber tapes. The reference junction is fixed on the pole at a position near the upper end of the sample. This temperature measurement differs from usual thermocouple thermometry in that the sample moves while its temperature is measured. It is important that the thermocouple junction be not displaced from its initial position relative to the rubber sample. Otherwise, it will slip out of the folded tapes of rubber after repeated stretching and shrinkage. Since the temperature of the rubber changes uniformly over the entire sample, the position of the thermocouple junction is not critical so long as it is reasonably apart from the sample’s ends where the triangular metallic support or the jaws of the clip perturb the uniformity of the stress and temperature distributions. We usually place the junction at 8mm from the upper end of the sample. For a 400 % elongation of the sample, the junction moves downwards by 32 mm. A free portion of the thermocouple wire allows this movement. One can watch the junction from outside so that any unsuitable positioning can be corrected.
A Chromel-Constantan pair of thermocouple, each 0.12 mm in diameter, is used. The junction has been soldered with as small an amount of solder as is compatible with its mechanical strength. One can know the acceptable range of variation of fabrication and positioning of the thermocouple junction by actually measuring the mechanocaloric temperature changes of a
Rubber Elasticity in Thermodynamics Courses
Netsu Sokutei 43 (W43) 2016 33
stable rubber sample (e.g., PDMS rubber) for different settings of the thermocouple. This also gives a measure of reproducibility of the present experimental method. A recent experience by us has shown that a very thin thermocouple wire (a 0.05 mm C-C pair) is more suitable for the present purpose than the 0.12mm pair, even though one may still find the latter to be easier to handle because of its strength.
The absolute temperature of the sample (i.e., the temperature of the sample space) is measured with a C-C thermocouple junction fixed on the pole next to the reference junction of the thermocouple for the T measurement. Its reference junction is kept in an ice jar. The absolute temperature thus determined may be compared with the Celsius temperature read on the alcohol thermometer fixed on the box covering the sample. This comparison is useful for checking the uniformity of the temperature within the insulated sample space, especially when the apparatus is being heated to a higher experimental temperature.
The output voltage of the two thermocouples is measured with a digital voltmeter (AD7451, Advantest) to 1 V. The two signal sources are selected by the use of a two-circuit two-way switch. The type of switches commonly available as circuit components is free from a stray emf to less than 1 V under a normal condition and thus is suitable for the present purpose.
The software for data acquisition by Excel is obtained from the Website of the Advantest Company.
5. Measurement
Operation of the apparatus to measure the mechanocaloric response of rubber has been described at the beginning of the previous section 4. Some additional points are given here.
The sample, assuming that it is available as a sheet e.g., 1 mm thick is cut in a tape of 15 mm width (the width may not be exactly this value so long as it is uniform along the length). It is held on the trianglar piece described in the previous section and fixed near the upper end to the pole as shown in Fig.3. The lower end of the sample tape, caught by the clip is further connected with a spring balance by a length of wire. The thermocouple junction is inserted between the folded tapes, paying attention to it that the junction will not be dislocated from the original position when the sample is stretched. For this purpose, it may be helpful to form the free portion of the thermocouple wire into two turns of a loose coil around the sample tape and then insert it between the folds. This makes the troublesome restoring force of the thermocouple wire effectively small. The thinner thermocouples (0.05mm) mentioned above is a good choice in this respect.
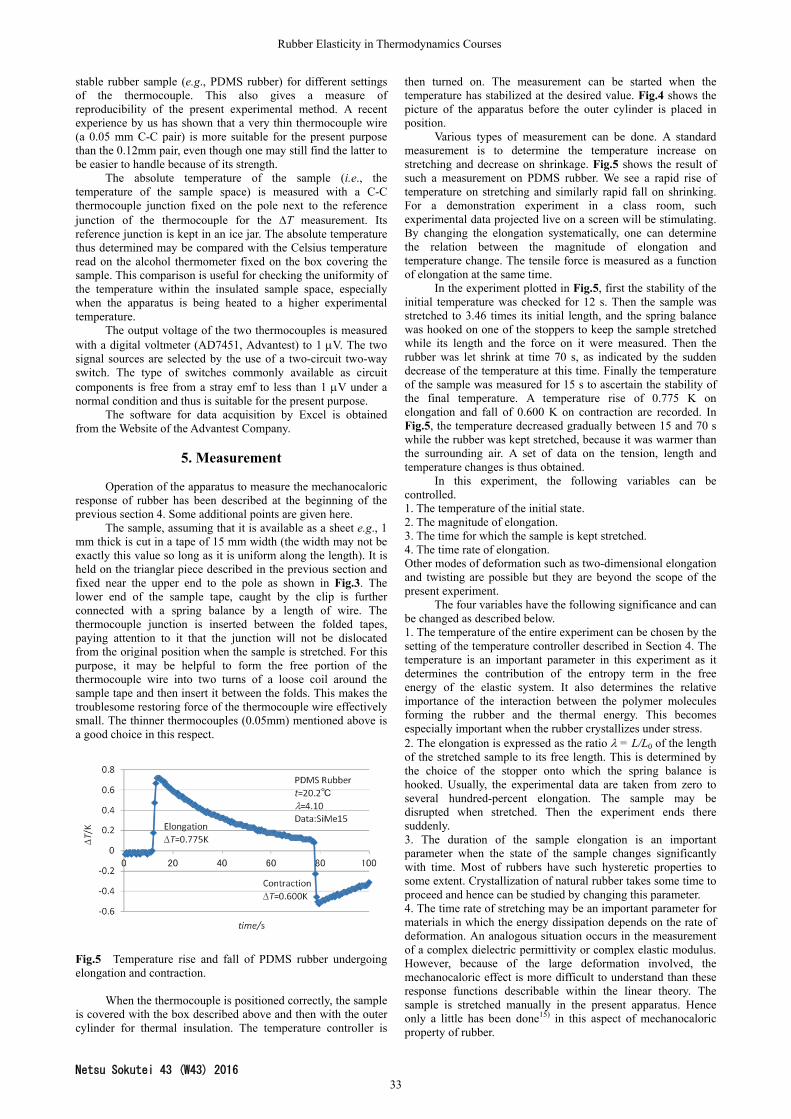
Fig.5 Temperature rise and fall of PDMS rubber undergoing elongation and contraction.
When the thermocouple is positioned correctly, the sample is covered with the box described above and then with the outer cylinder for thermal insulation. The temperature controller is
then turned on. The measurement can be started when the temperature has stabilized at the desired value. Fig.4 shows the picture of the apparatus before the outer cylinder is placed in position.
Various types of measurement can be done. A standard measurement is to determine the temperature increase on stretching and decrease on shrinkage. Fig.5 shows the result of such a measurement on PDMS rubber. We see a rapid rise of temperature on stretching and similarly rapid fall on shrinking. For a demonstration experiment in a class room, such experimental data projected live on a screen will be stimulating. By changing the elongation systematically, one can determine the relation between the magnitude of elongation and temperature change. The tensile force is measured as a function of elongation at the same time.
In the experiment plotted in Fig.5, first the stability of the initial temperature was checked for 12 s. Then the sample was stretched to 3.46 times its initial length, and the spring balance was hooked on one of the stoppers to keep the sample stretched while its length and the force on it were measured. Then the rubber was let shrink at time 70 s, as indicated by the sudden decrease of the temperature at this time. Finally the temperature of the sample was measured for 15 s to ascertain the stability of the final temperature. A temperature rise of 0.775 K on elongation and fall of 0.600 K on contraction are recorded. In Fig.5, the temperature decreased gradually between 15 and 70 s while the rubber was kept stretched, because it was warmer than the surrounding air. A set of data on the tension, length and temperature changes is thus obtained.
In this experiment, the following variables can be controlled. 1. The temperature of the initial state. 2. The magnitude of elongation. 3. The time for which the sample is kept stretched. 4. The time rate of elongation. Other modes of deformation such as two-dimensional elongation and twisting are possible but they are beyond the scope of the present experiment.
The four variables have the following significance and can be changed as described below. 1. The temperature of the entire experiment can be chosen by the setting of the temperature controller described in Section 4. The temperature is an important parameter in this experiment as it determines the contribution of the entropy term in the free energy of the elastic system. It also determines the relative importance of the interaction between the polymer molecules forming the rubber and the thermal energy. This becomes especially important when the rubber crystallizes under stress. 2. The elongation is expressed as the ratio = L/L0 of the length of the stretched sample to its free length. This is determined by the choice of the stopper onto which the spring balance is hooked. Usually, the experimental data are taken from zero to several hundred-percent elongation. The sample may be disrupted when stretched. Then the experiment ends there suddenly. 3. The duration of the sample elongation is an important parameter when the state of the sample changes significantly with time. Most of rubbers have such hysteretic properties to some extent. Crystallization of natural rubber takes some time to proceed and hence can be studied by changing this parameter. 4. The time rate of stretching may be an important parameter for materials in which the energy dissipation depends on the rate of deformation. An analogous situation occurs in the measurement of a complex dielectric permittivity or complex elastic modulus. However, because of the large deformation involved, the mechanocaloric effect is more difficult to understand than these response functions describable within the linear theory. The sample is stretched manually in the present apparatus. Hence only a little has been done15) in this aspect of mechanocaloric property of rubber.
Netsu Sokutei - Special Issue of “Education and Practice on Calorimetry and Thermal Analysis”
Netsu Sokutei 43 (W43) 2016 34
6. Experimental Results and Discussion Relation with the second law of thermodynamics This experiment is different in many respects from other calorimetric experiments. The most notable point is the very fast temperature response of rubber to the external force as shown in Fig.5. Rubbers are material of low thermal conductivity as we understand from its amorphous structure and by actually touching them. But the experiment records a temperature rise and fall of ~0.7 K in a short time ~1s. In former times when we used an analog amplifier and chart recorder, a still faster response was recorded14). We may be losing some part of time and voltage resolutions for the convenience of the digitalized measurement. There will be a balanced combination of these two.
The rapid response of the mechanocaloric temperature change can be traced back to its physical mechanism. When a piece of rubber is stretched uniformly, the heat is generated uniformly throughout the sample. The thermocouple junction is therefore in direct contact with the heat source. The heat is simply conducted from the rubber to the thermocouple, without involving thermal conduction through a layer of rubber at least to a first approximation. This explains the seemingly improbable fast thermal response. It should be added the heat capacity of a thermocouple junction is not zero and may be causing a delay of the response and underestimation of the amplitude of the temperature changes. A thin thermocouple wire is preferable in these respects.
Thermal phenomena we experience in our daily life (boiling water in a kettle, warmth of sun light, thermal insulation in the house, etc.) and our laboratory instruments (DTA, DSC, ITC, various types of reaction and non-reaction calorimeters) are ones in which an amount of heat is conducted over a macroscopic distance across a room or across the wall of a reaction vessel. We observe and record the consequence of such thermal conduction. These are by definition processes in which the entropy of the system increases. By contrast, the mechanocaloric effect is a thermal process that takes place without a temperature gradient, and as such it is a reversible thermal phenomenon in which the entropy of the system is conserved. We can derive the entropy as a conserved quantity from the experimentally determined quantities. This will help our understanding of entropy, just as our experiences with the energy as a conserved quantity helps us to understand the energy concept.
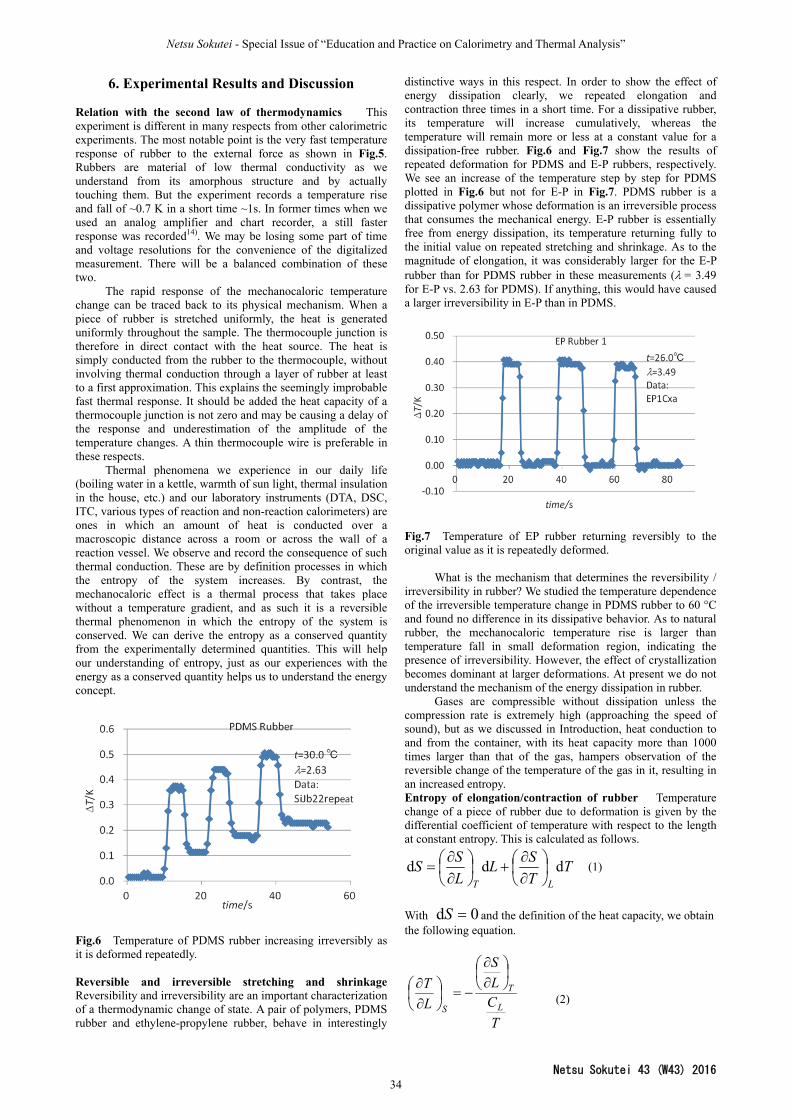
Fig.6 Temperature of PDMS rubber increasing irreversibly as it is deformed repeatedly. Reversible and irreversible stretching and shrinkage Reversibility and irreversibility are an important characterization of a thermodynamic change of state. A pair of polymers, PDMS rubber and ethylene-propylene rubber, behave in interestingly
distinctive ways in this respect. In order to show the effect of energy dissipation clearly, we repeated elongation and contraction three times in a short time. For a dissipative rubber, its temperature will increase cumulatively, whereas the temperature will remain more or less at a constant value for a dissipation-free rubber. Fig.6 and Fig.7 show the results of repeated deformation for PDMS and E-P rubbers, respectively. We see an increase of the temperature step by step for PDMS plotted in Fig.6 but not for E-P in Fig.7. PDMS rubber is a dissipative polymer whose deformation is an irreversible process that consumes the mechanical energy. E-P rubber is essentially free from energy dissipation, its temperature returning fully to the initial value on repeated stretching and shrinkage. As to the magnitude of elongation, it was considerably larger for the E-P rubber than for PDMS rubber in these measurements (= 3.49 for E-P vs. 2.63 for PDMS). If anything, this would have caused a larger irreversibility in E-P than in PDMS.
Fig.7 Temperature of EP rubber returning reversibly to the original value as it is repeatedly deformed.
What is the mechanism that determines the reversibility / irreversibility in rubber? We studied the temperature dependence of the irreversible temperature change in PDMS rubber to 60 °C and found no difference in its dissipative behavior. As to natural rubber, the mechanocaloric temperature rise is larger than temperature fall in small deformation region, indicating the presence of irreversibility. However, the effect of crystallization becomes dominant at larger deformations. At present we do not understand the mechanism of the energy dissipation in rubber.
Gases are compressible without dissipation unless the compression rate is extremely high (approaching the speed of sound), but as we discussed in Introduction, heat conduction to and from the container, with its heat capacity more than 1000 times larger than that of the gas, hampers observation of the reversible change of the temperature of the gas in it, resulting in an increased entropy. Entropy of elongation/contraction of rubber Temperature change of a piece of rubber due to deformation is given by the differential coefficient of temperature with respect to the length at constant entropy. This is calculated as follows.
TT
SL
L
SS
LT
ddd
(1)
With 0d S and the definition of the heat capacity, we obtain the following equation.
(2)
T
CL
S
L
T
L
T
S
Rubber Elasticity in Thermodynamics Courses
Netsu Sokutei 43 (W43) 2016 35
LHS of eq.2 gives the coefficient of the adiabatic change of temperature against elongation. The condition for constant entropy is satisfied by the properties of the actual process that (1) it follows a reversible path and (2) it takes place in a short time. The partial derivative in the numerator of RHS of eq.2 expresses the dependence of the entropy of rubber on its length, and the denominator is the heat capacity of rubber at constant length divided by absolute temperature. This latter is a positive quantity. We see in Fig.5, Fig.6 and Fig.7 that the temperature of rubber increases when it is stretched abiabatically. Hence, with a minus sign on it, the numerator (the slope of entropy function vs. length) in RHS of eq.2 is a negative quantity: the entropy of rubber decreases on elongation. The two requirements (1) and (2) given above for the constancy of entropy apparently demands opposite situations, one for a slow change and the other for a rapid change. These are satisfied for E-P rubber at least. For other materials, there are other factors that need be considered.
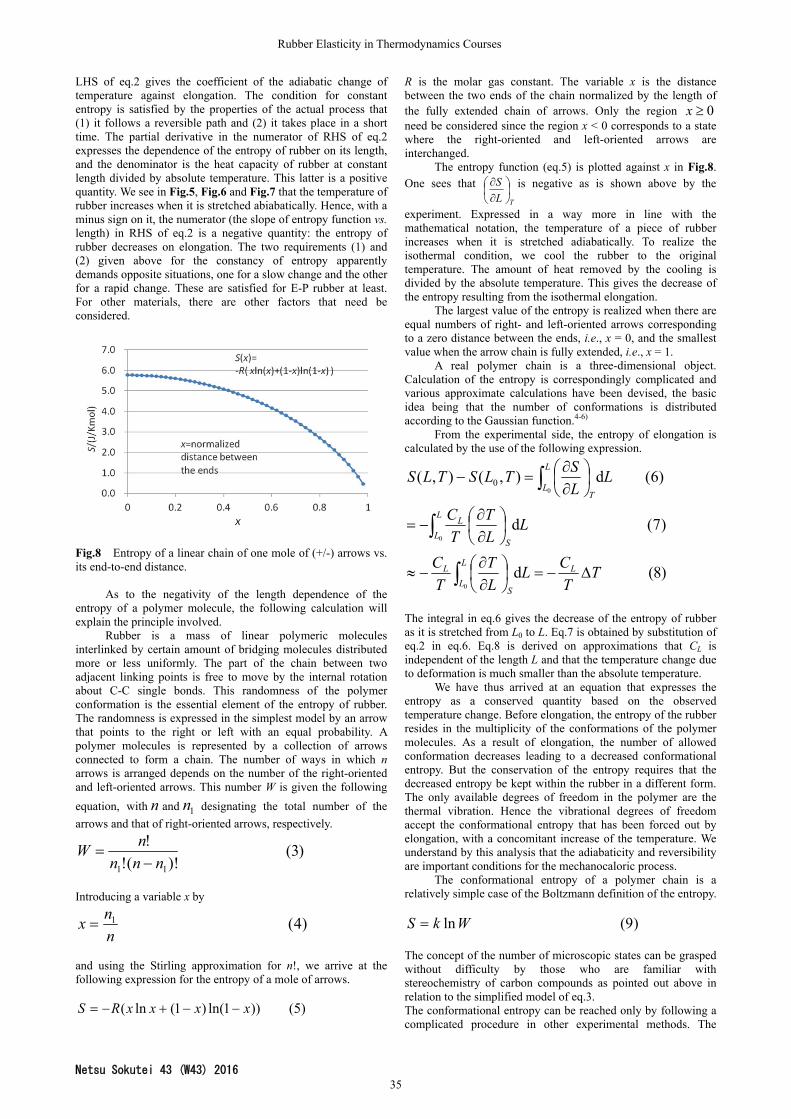
Fig.8 Entropy of a linear chain of one mole of (+/-) arrows vs. its end-to-end distance.
As to the negativity of the length dependence of the entropy of a polymer molecule, the following calculation will explain the principle involved.
Rubber is a mass of linear polymeric molecules interlinked by certain amount of bridging molecules distributed more or less uniformly. The part of the chain between two adjacent linking points is free to move by the internal rotation about C-C single bonds. This randomness of the polymer conformation is the essential element of the entropy of rubber. The randomness is expressed in the simplest model by an arrow that points to the right or left with an equal probability. A polymer molecules is represented by a collection of arrows connected to form a chain. The number of ways in which n arrows is arranged depends on the number of the right-oriented and left-oriented arrows. This number W is given the following
equation, with n and 1n designating the total number of the
arrows and that of right-oriented arrows, respectively.
)3()!(!
!
11 nnn
nW
Introducing a variable x by
)4(1
n
nx
and using the Stirling approximation for n!, we arrive at the following expression for the entropy of a mole of arrows.
)5())1ln()1(ln( xxxxRS
R is the molar gas constant. The variable x is the distance between the two ends of the chain normalized by the length of the fully extended chain of arrows. Only the region 0x need be considered since the region x < 0 corresponds to a state where the right-oriented and left-oriented arrows are interchanged.
The entropy function (eq.5) is plotted against x in Fig.8. One sees that
TL
S
is negative as is shown above by the
experiment. Expressed in a way more in line with the mathematical notation, the temperature of a piece of rubber increases when it is stretched adiabatically. To realize the isothermal condition, we cool the rubber to the original temperature. The amount of heat removed by the cooling is divided by the absolute temperature. This gives the decrease of the entropy resulting from the isothermal elongation.
The largest value of the entropy is realized when there are equal numbers of right- and left-oriented arrows corresponding to a zero distance between the ends, i.e., x = 0, and the smallest value when the arrow chain is fully extended, i.e., x = 1.
A real polymer chain is a three-dimensional object. Calculation of the entropy is correspondingly complicated and various approximate calculations have been devised, the basic idea being that the number of conformations is distributed according to the Gaussian function.4-6)
From the experimental side, the entropy of elongation is calculated by the use of the following expression.
)8(d
)7(d
)6(d),(),(
0
0
00
TT
CL
L
T
T
C
LL
T
T
C
LL
STLSTLS
L
S
L
L
L
S
L
L
L
T
L
L
The integral in eq.6 gives the decrease of the entropy of rubber as it is stretched from L0 to L. Eq.7 is obtained by substitution of eq.2 in eq.6. Eq.8 is derived on approximations that CL is independent of the length L and that the temperature change due to deformation is much smaller than the absolute temperature.
We have thus arrived at an equation that expresses the entropy as a conserved quantity based on the observed temperature change. Before elongation, the entropy of the rubber resides in the multiplicity of the conformations of the polymer molecules. As a result of elongation, the number of allowed conformation decreases leading to a decreased conformational entropy. But the conservation of the entropy requires that the decreased entropy be kept within the rubber in a different form. The only available degrees of freedom in the polymer are the thermal vibration. Hence the vibrational degrees of freedom accept the conformational entropy that has been forced out by elongation, with a concomitant increase of the temperature. We understand by this analysis that the adiabaticity and reversibility are important conditions for the mechanocaloric process.
The conformational entropy of a polymer chain is a relatively simple case of the Boltzmann definition of the entropy.
)9(lnWkS
The concept of the number of microscopic states can be grasped without difficulty by those who are familiar with stereochemistry of carbon compounds as pointed out above in relation to the simplified model of eq.3. The conformational entropy can be reached only by following a complicated procedure in other experimental methods. The
Netsu Sokutei - Special Issue of “Education and Practice on Calorimetry and Thermal Analysis”
Netsu Sokutei 43 (W43) 2016 36
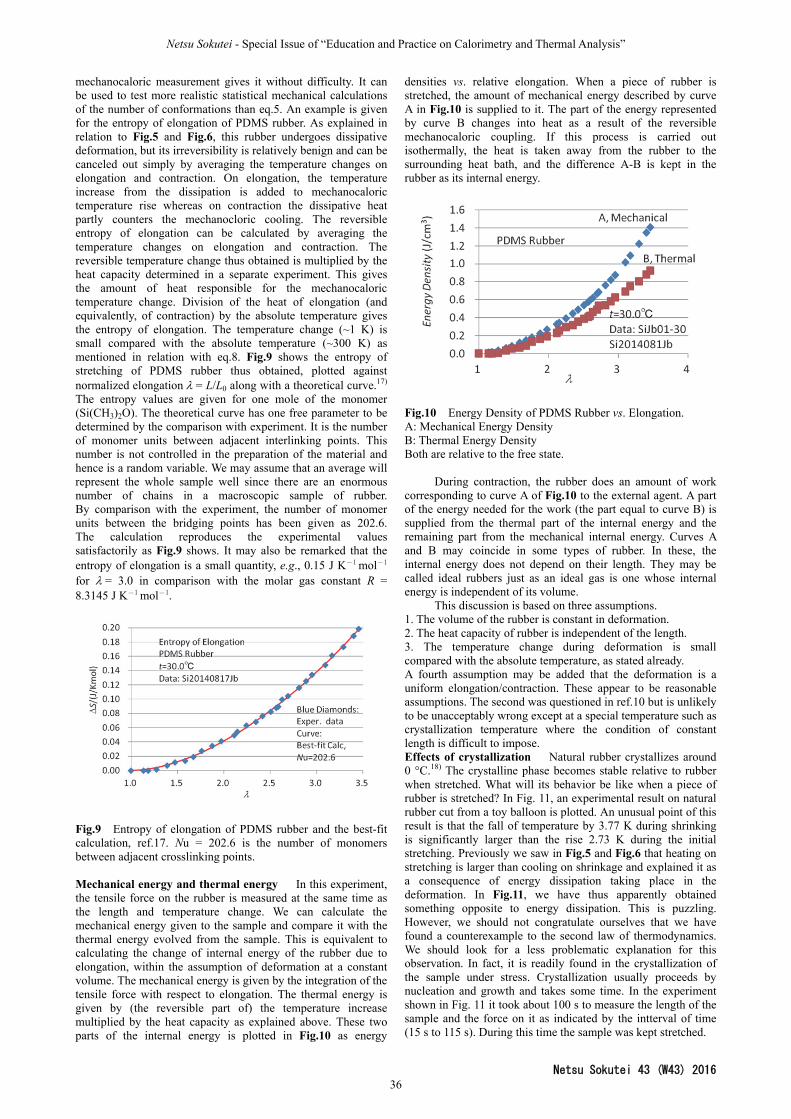
mechanocaloric measurement gives it without difficulty. It can be used to test more realistic statistical mechanical calculations of the number of conformations than eq.5. An example is given for the entropy of elongation of PDMS rubber. As explained in relation to Fig.5 and Fig.6, this rubber undergoes dissipative deformation, but its irreversibility is relatively benign and can be canceled out simply by averaging the temperature changes on elongation and contraction. On elongation, the temperature increase from the dissipation is added to mechanocaloric temperature rise whereas on contraction the dissipative heat partly counters the mechanocloric cooling. The reversible entropy of elongation can be calculated by averaging the temperature changes on elongation and contraction. The reversible temperature change thus obtained is multiplied by the heat capacity determined in a separate experiment. This gives the amount of heat responsible for the mechanocaloric temperature change. Division of the heat of elongation (and equivalently, of contraction) by the absolute temperature gives the entropy of elongation. The temperature change (~1 K) is small compared with the absolute temperature (~300 K) as mentioned in relation with eq.8. Fig.9 shows the entropy of stretching of PDMS rubber thus obtained, plotted against normalized elongation= L/L0 along with a theoretical curve.17) The entropy values are given for one mole of the monomer (Si(CH3)2O). The theoretical curve has one free parameter to be determined by the comparison with experiment. It is the number of monomer units between adjacent interlinking points. This number is not controlled in the preparation of the material and hence is a random variable. We may assume that an average will represent the whole sample well since there are an enormous number of chains in a macroscopic sample of rubber. By comparison with the experiment, the number of monomer units between the bridging points has been given as 202.6. The calculation reproduces the experimental values satisfactorily as Fig.9 shows. It may also be remarked that the entropy of elongation is a small quantity, e.g., 0.15 J K-1
mol-1 for = 3.0 in comparison with the molar gas constant R = 8.3145 J K-1 mol-1.
Fig.9 Entropy of elongation of PDMS rubber and the best-fit calculation, ref.17. Nu = 202.6 is the number of monomers between adjacent crosslinking points. Mechanical energy and thermal energy In this experiment, the tensile force on the rubber is measured at the same time as the length and temperature change. We can calculate the mechanical energy given to the sample and compare it with the thermal energy evolved from the sample. This is equivalent to calculating the change of internal energy of the rubber due to elongation, within the assumption of deformation at a constant volume. The mechanical energy is given by the integration of the tensile force with respect to elongation. The thermal energy is given by (the reversible part of) the temperature increase multiplied by the heat capacity as explained above. These two parts of the internal energy is plotted in Fig.10 as energy
densities vs. relative elongation. When a piece of rubber is stretched, the amount of mechanical energy described by curve A in Fig.10 is supplied to it. The part of the energy represented by curve B changes into heat as a result of the reversible mechanocaloric coupling. If this process is carried out isothermally, the heat is taken away from the rubber to the surrounding heat bath, and the difference A-B is kept in the rubber as its internal energy.
Fig.10 Energy Density of PDMS Rubber vs. Elongation. A: Mechanical Energy Density B: Thermal Energy Density Both are relative to the free state.
During contraction, the rubber does an amount of work corresponding to curve A of Fig.10 to the external agent. A part of the energy needed for the work (the part equal to curve B) is supplied from the thermal part of the internal energy and the remaining part from the mechanical internal energy. Curves A and B may coincide in some types of rubber. In these, the internal energy does not depend on their length. They may be called ideal rubbers just as an ideal gas is one whose internal energy is independent of its volume.
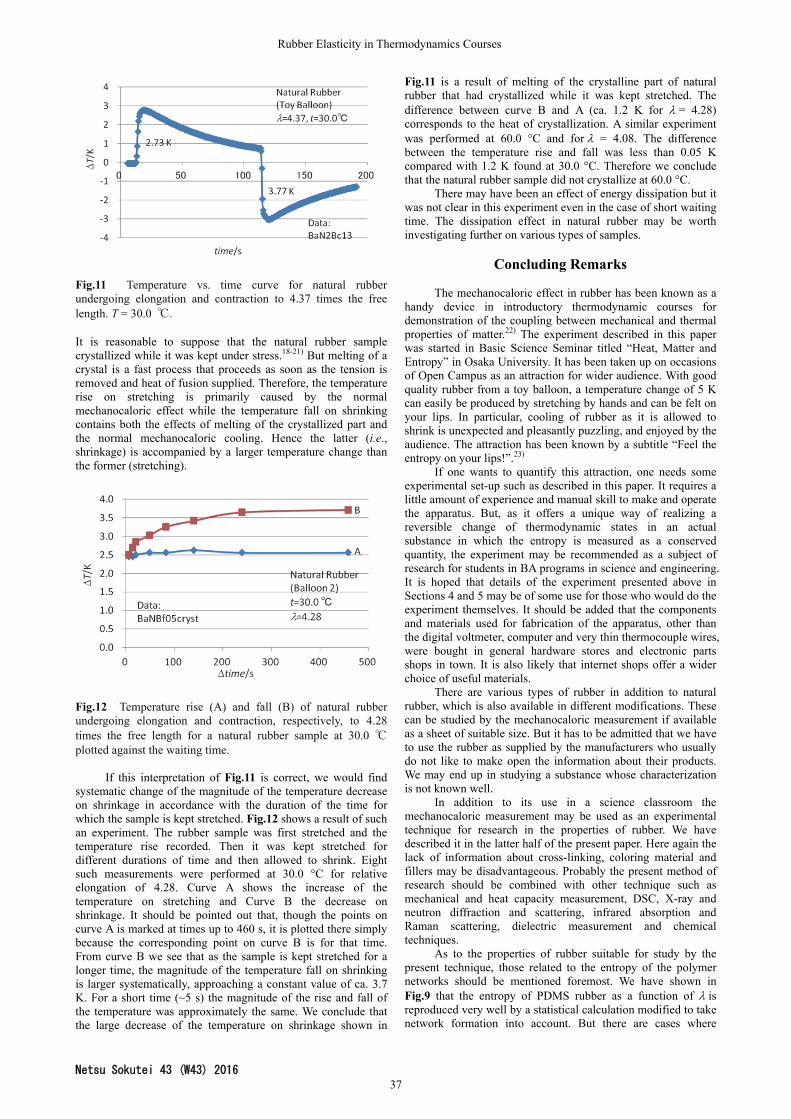
This discussion is based on three assumptions. 1. The volume of the rubber is constant in deformation. 2. The heat capacity of rubber is independent of the length. 3. The temperature change during deformation is small compared with the absolute temperature, as stated already. A fourth assumption may be added that the deformation is a uniform elongation/contraction. These appear to be reasonable assumptions. The second was questioned in ref.10 but is unlikely to be unacceptably wrong except at a special temperature such as crystallization temperature where the condition of constant length is difficult to impose. Effects of crystallization Natural rubber crystallizes around 0 °C.18) The crystalline phase becomes stable relative to rubber when stretched. What will its behavior be like when a piece of rubber is stretched? In Fig. 11, an experimental result on natural rubber cut from a toy balloon is plotted. An unusual point of this result is that the fall of temperature by 3.77 K during shrinking is significantly larger than the rise 2.73 K during the initial stretching. Previously we saw in Fig.5 and Fig.6 that heating on stretching is larger than cooling on shrinkage and explained it as a consequence of energy dissipation taking place in the deformation. In Fig.11, we have thus apparently obtained something opposite to energy dissipation. This is puzzling. However, we should not congratulate ourselves that we have found a counterexample to the second law of thermodynamics. We should look for a less problematic explanation for this observation. In fact, it is readily found in the crystallization of the sample under stress. Crystallization usually proceeds by nucleation and growth and takes some time. In the experiment shown in Fig. 11 it took about 100 s to measure the length of the sample and the force on it as indicated by the intterval of time (15 s to 115 s). During this time the sample was kept stretched.
Rubber Elasticity in Thermodynamics Courses
Netsu Sokutei 43 (W43) 2016 37
Fig.11 Temperature vs. time curve for natural rubber undergoing elongation and contraction to 4.37 times the free length. T = 30.0 ℃. It is reasonable to suppose that the natural rubber sample crystallized while it was kept under stress.18-21) But melting of a crystal is a fast process that proceeds as soon as the tension is removed and heat of fusion supplied. Therefore, the temperature rise on stretching is primarily caused by the normal mechanocaloric effect while the temperature fall on shrinking contains both the effects of melting of the crystallized part and the normal mechanocaloric cooling. Hence the latter (i.e., shrinkage) is accompanied by a larger temperature change than the former (stretching).
Fig.12 Temperature rise (A) and fall (B) of natural rubber undergoing elongation and contraction, respectively, to 4.28 times the free length for a natural rubber sample at 30.0 ℃ plotted against the waiting time.
If this interpretation of Fig.11 is correct, we would find systematic change of the magnitude of the temperature decrease on shrinkage in accordance with the duration of the time for which the sample is kept stretched. Fig.12 shows a result of such an experiment. The rubber sample was first stretched and the temperature rise recorded. Then it was kept stretched for different durations of time and then allowed to shrink. Eight such measurements were performed at 30.0 °C for relative elongation of 4.28. Curve A shows the increase of the temperature on stretching and Curve B the decrease on shrinkage. It should be pointed out that, though the points on curve A is marked at times up to 460 s, it is plotted there simply because the corresponding point on curve B is for that time. From curve B we see that as the sample is kept stretched for a longer time, the magnitude of the temperature fall on shrinking is larger systematically, approaching a constant value of ca. 3.7 K. For a short time (~5 s) the magnitude of the rise and fall of the temperature was approximately the same. We conclude that the large decrease of the temperature on shrinkage shown in
Fig.11 is a result of melting of the crystalline part of natural rubber that had crystallized while it was kept stretched. The difference between curve B and A (ca. 1.2 K for = 4.28) corresponds to the heat of crystallization. A similar experiment was performed at 60.0 °C and for = 4.08. The difference between the temperature rise and fall was less than 0.05 K compared with 1.2 K found at 30.0 °C. Therefore we conclude that the natural rubber sample did not crystallize at 60.0 °C.
There may have been an effect of energy dissipation but it was not clear in this experiment even in the case of short waiting time. The dissipation effect in natural rubber may be worth investigating further on various types of samples.
Concluding Remarks
The mechanocaloric effect in rubber has been known as a handy device in introductory thermodynamic courses for demonstration of the coupling between mechanical and thermal properties of matter.22) The experiment described in this paper was started in Basic Science Seminar titled “Heat, Matter and Entropy” in Osaka University. It has been taken up on occasions of Open Campus as an attraction for wider audience. With good quality rubber from a toy balloon, a temperature change of 5 K can easily be produced by stretching by hands and can be felt on your lips. In particular, cooling of rubber as it is allowed to shrink is unexpected and pleasantly puzzling, and enjoyed by the audience. The attraction has been known by a subtitle “Feel the entropy on your lips!”.23)
If one wants to quantify this attraction, one needs some experimental set-up such as described in this paper. It requires a little amount of experience and manual skill to make and operate the apparatus. But, as it offers a unique way of realizing a reversible change of thermodynamic states in an actual substance in which the entropy is measured as a conserved quantity, the experiment may be recommended as a subject of research for students in BA programs in science and engineering. It is hoped that details of the experiment presented above in Sections 4 and 5 may be of some use for those who would do the experiment themselves. It should be added that the components and materials used for fabrication of the apparatus, other than the digital voltmeter, computer and very thin thermocouple wires, were bought in general hardware stores and electronic parts shops in town. It is also likely that internet shops offer a wider choice of useful materials.
There are various types of rubber in addition to natural rubber, which is also available in different modifications. These can be studied by the mechanocaloric measurement if available as a sheet of suitable size. But it has to be admitted that we have to use the rubber as supplied by the manufacturers who usually do not like to make open the information about their products. We may end up in studying a substance whose characterization is not known well.
In addition to its use in a science classroom the mechanocaloric measurement may be used as an experimental technique for research in the properties of rubber. We have described it in the latter half of the present paper. Here again the lack of information about cross-linking, coloring material and fillers may be disadvantageous. Probably the present method of research should be combined with other technique such as mechanical and heat capacity measurement, DSC, X-ray and neutron diffraction and scattering, infrared absorption and Raman scattering, dielectric measurement and chemical techniques.
As to the properties of rubber suitable for study by the present technique, those related to the entropy of the polymer networks should be mentioned foremost. We have shown in Fig.9 that the entropy of PDMS rubber as a function of is reproduced very well by a statistical calculation modified to take network formation into account. But there are cases where

Netsu Sokutei - Special Issue of “Education and Practice on Calorimetry and Thermal Analysis”
Netsu Sokutei 43 (W43) 2016 38
crystallization is important or where interchain interactions are likely to change the mechanocaloric property measurably.16) In other cases, energy dissipation is considerable. For these the present method may provide knowledge that is hard to obtain by other techniques. It is also interesting to extend the measurement to larger regions. From a theoretical point of view, the energy and entropy data obtained from mechanocaloric measurement may be useful for comparison with molecular dynamics simulations which are now increasingly applied to problems involving elastomers.24)
Finally we are developing an experimental technique for handling polymeric systems which are slightly viscoelastic by the present apparatus. This may allow the mechanocaloric method to explorer a wider group of substances.25)
Acknowledgments
We thank the students of the Clark Memorial International High School, Tennoji Campus, who participated in the present study in its early phases.
References 1) M. W. Zemansky, Heat and Thermodynamics, 5th ed. p.134,
McGraw-Hill, 1968. 2) C. Truesdell, The Tragicomical History of Thermodynamics
1822-1854, p.31, Studies in the History of Mathematics and Physical Science 4, Springer-Verlag, 1980; See also J. W. S. Rayleigh, The Theory of Sound, Vol.II, 2nd ed. P.18-30, The Macmillan Company, 1896, Dover Publications (1945).
3) J. W. Benepe and W. Reese, Electrocaloric Studies of KH2PO4, Phys. Rev. B2 (1971) 3032-3039.
4) 久保亮五,ゴム弾性, 裳華房,1946,初版復刻版 1996.Ryogo Kubo, Rubber Elasticity, Shokabo Publishers, 1946, reprint 1996. In Japanese.
5) R. G. Treloar, The Physics of Rubber Elasticity, 3rd ed., Oxford: Clarendon Press, 1975.
6) 土井正男,ソフトマタ―物理学入門,岩波書店, 2010. Masao Doi, Introduction to the Physics of Soft Matter, Iwanami Shoten, 2010. In Japanese.
7) J. P. Joule, On Some Thermo-dynamic Properties of Solids, Philosophical Transactions of the Royal Society of London, 149 (1859) 91-131.
8) D. S. L. Cardwell, James Joule, A Biography, Manchester University Press, 1989, p171-174.
9) I. Williams, Transformation of Energy by Rubber, Industrial and Engineering Chemistry 22 (1929) 872-876.
10) L. S. Ornstein, J. Wouda and J. G. Eymers, Proc. Acad. Sci. Amsterdam 33 (1930) 273-279.
11) S. L. Dart, R. L. Anthony, and Eugene Guth, Rise of Temperature on Fast Stretching of Synthetics and Natural Rubbers, Industrial and Engineering Chemistry 34 (1942) 1340-1342.
12) Z. R. Glazer and F. R. Eirich, Thermal Behavior of Elastomers at High Rates of Tensile Straining, J. Polymer Sci. : Part C 31 (1970) 275-290.
13) Yu. K. Godovsky, Calorimetric Study of Rubber Elasticity, Polymer 22 (1981)75-86.
14) T. Matsuo, A. Inaba, O. Yamamuro, M. Hashimoto, and N. Sotani, Rubber Elasticity in the Introductory Thermodynamics Courses, J. Therm. Anal. 69 (2003) 1015-1020.
15) A. Sakata, N. Suzuki, Y. Higashiura, T. Matsuo, and T. Sato, Measurement of the Mechanocaloric Effect in Rubber, J. Therm. Anall. Calorim. 113 (2013) 1555-1563.
16) T. Matsuo, N. Azuma, Y. Toriyama and T. Yoshioka, Mechanocaloric Properties of Poly(dimethylsiloxane) and Ethylene-Propylene Rubbers, J. Therm. Anall. Calorim., DOI 10.1007/s10973-015-4675-0.
17) M. C. Wang and E. Guth, Statistical Theory of Networks of Non-Gaussian Flexible Chains, J. Chem. Phys. 20 (1952) 1144-1157.
18) B. C. Edwards, The Nature of Multiple Melting Transitions in Cis-polyisoprene, J. Polymer Science, Polymer Science Edition 13 (1975) 1387-1405.
19) S. Tosi, T. Fujimaki, and M. Okuyama, Polymer 41 (2000) 5423-5229.
20) S. Toki, I. Sics, S. Ran, L. Liu, and B. S. Hsiao, Polymer 44 (2003) 6003-6011.
21) Y. Miyamoto, H. Yamao, and K. Sekimoto, Macromolecules 36 (2003) 6462-6471.
22) 松尾隆祐,熱力学の授業:定年後の省察と一つの教卓
実験,熱測定 32 ( 2005 ) 20-25; T. Matsuo, On Thermodynamcs Courses, a Reflection of a Retired Teacher, Netsu 32(2005) 20-25, in Japanese.
23) 稲葉 章,22)に引用.A. Inaba, quoted in 22). 24) D. E. Hanson, J. L. Barber, and G. Subramanian, The
Entropy of the rotational conformations of (poly)isoprene molecules and its relationship to rubber elasticity and temperature increase for moderate tensile or compressive strains, J. Chem. Phys. 139 (2013) 224906.
25) N. Azuma, M. Corea, and T. Matsuo, to be published.