Embed Size (px)
Citation preview
8/6/2019 Rubber Very Important
http://slidepdf.com/reader/full/rubber-very-important 1/22
NATIONAL MULTI‐COMMODITY
EXCHANGE OF INDIA LIMITED
Report on Natural Rubber
4th Floor H. K. House,
B/h Jivabhai Chambers, Ashram Road,
Ahmedabad, Gujarat 380 009 INDIA
Phone: 91‐79‐4008 6039 Fax: 91‐79‐4008‐6040
Email: [email protected] URL: www.nmce.com
8/6/2019 Rubber Very Important
http://slidepdf.com/reader/full/rubber-very-important 2/22
Rubber
2
Table of Contents
Introduction .................................................................................................................................. 3
International Scenario.................................................................................................................. 3
World Production ........................................................................................................................ 4
World Area under Rubber and Yield........................................................................................ 4
World Consumption.................................................................................................................... 5
Domestic Scenario........................................................................................................................ 6
Production and Consumption Trend of NR ............................................................................ 7
Growth Rate of Production and Consumption ....................................................................... 7
State‐wise Production of Natural Rubber ................................................................................ 8
State‐wise Area under Rubber ................................................................................................. 10
Type‐wise Production & Consumption of Natural Rubber ................................................ 10
Production................................................................................................................................... 10
Consumption .............................................................................................................................. 11
Category‐Wise / Year‐Wise Production Of Tyres And Tubes............................................. 11
Tyres............................................................................................................................................. 11
Tubes............................................................................................................................................ 12
Trade Scenario............................................................................................................................ 12
Import of Natural Rubber......................................................................................................... 13
Export of Natural Rubber ......................................................................................................... 15
Natural Rubber Prices ............................................................................................................... 17 Rubber Futures in India ............................................................................................................ 18
Convergence of Prices on Settlement...................................................................................... 19
Spot price trend of Rubber........................................................................................................ 20
Correlation of Rubber and Crude Oil Prices.......................................................................... 21
8/6/2019 Rubber Very Important
http://slidepdf.com/reader/full/rubber-very-important 3/22
Rubber
3
Introduction
Rubber is found in the fluid of some specific plants but it can also be produced
synthetically. Synthetic rubber is produced through the process of
polymerization of various monomers.
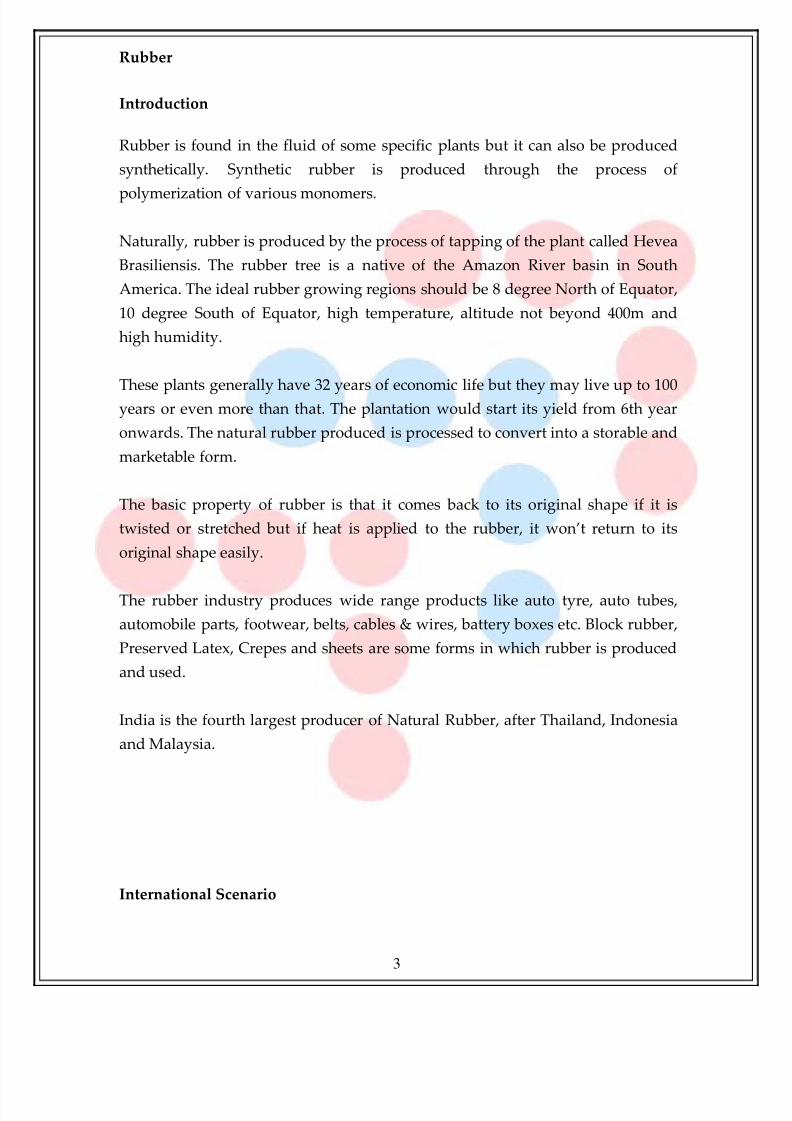
Naturally, rubber is produced by the process of tapping of the plant called Hevea
Brasiliensis. The rubber tree is a native of the Amazon River basin in South
America. The ideal rubber growing regions should be 8 degree North of Equator,
10 degree South of Equator, high temperature, altitude not beyond 400m and
high humidity.
These
plants
generally
have
32
years
of
economic
life
but
they
may
live
up
to
100
years or even more than that. The plantation would start its yield from 6th year
onwards. The natural rubber produced is processed to convert into a storable and
marketable form.
The basic property of rubber is that it comes back to its original shape if it is
twisted or stretched but if heat is applied to the rubber, it won’t return to its
original shape easily.
The rubber industry produces wide range products like auto tyre, auto tubes,
automobile parts, footwear, belts, cables & wires, battery boxes etc. Block rubber,
Preserved Latex, Crepes and sheets are some forms in which rubber is produced
and used.
India is the fourth largest producer of Natural Rubber, after Thailand, Indonesia
and Malaysia.
International Scenario
8/6/2019 Rubber Very Important
http://slidepdf.com/reader/full/rubber-very-important 4/22
Rubber
4
World Production
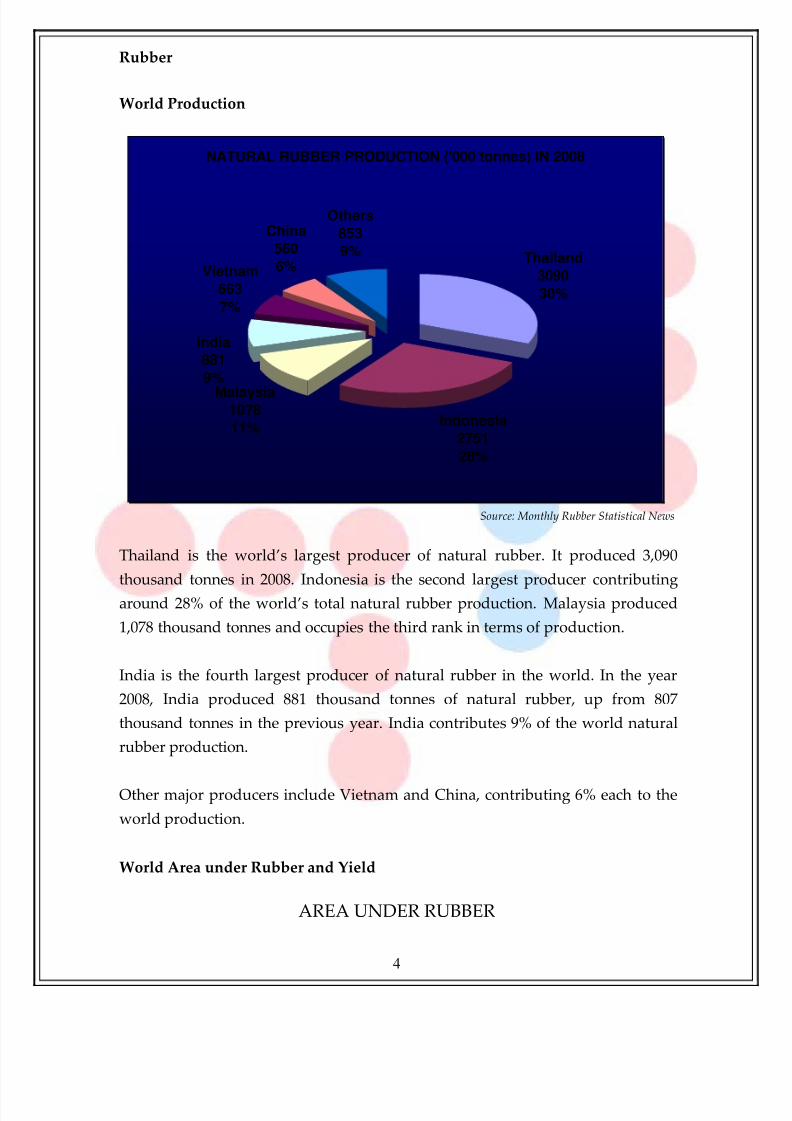
NATURAL RUBBER PRODUCTION ('000 tonnes) IN 2008
Thailand
3090
30%
Indonesia
2751
28%
Malaysia1078
11%
Vietnam
663
7%
China
560
6%
Others
853
9%
India
881
9%
Source: Monthly Rubber Statistical News
Thailand is the world’s largest producer of natural rubber. It produced 3,090
thousand tonnes in 2008. Indonesia is the second largest producer contributing
around 28% of the world’s total natural rubber production. Malaysia produced
1,078 thousand tonnes and occupies the third rank in terms of production.
India is the fourth largest producer of natural rubber in the world. In the year
2008, India produced 881 thousand tonnes of natural rubber, up from 807
thousand tonnes in the previous year. India contributes 9% of the world natural
rubber production.
Other major producers include Vietnam and China, contributing 6% each to the
world production.
World Area under Rubber and Yield
AREA UNDER RUBBER
8/6/2019 Rubber Very Important
http://slidepdf.com/reader/full/rubber-very-important 5/22
Rubber
5
IN MAIN PRODUCING COUNTRIES
(In Thousand Hectares)
Territory End of Total Area
Indonesia 2005 3,279.0
Thailand
2005
2,133.0
Malaysia 2005 1,250.0
China 2004 600.0
India 2006 615.0
Vietnam 2005 465.0
Brazil 2005 118.0
Sri Lanka 2003 128.9
Nigeria 1999 150.0
Liberia 1999 108.9
Myanmar 1995 104.8
Cote dʹIvoire 2005 118.0
Philippines 1999 92.0
Cameroon 2005 40.4
Source: Rubber Board
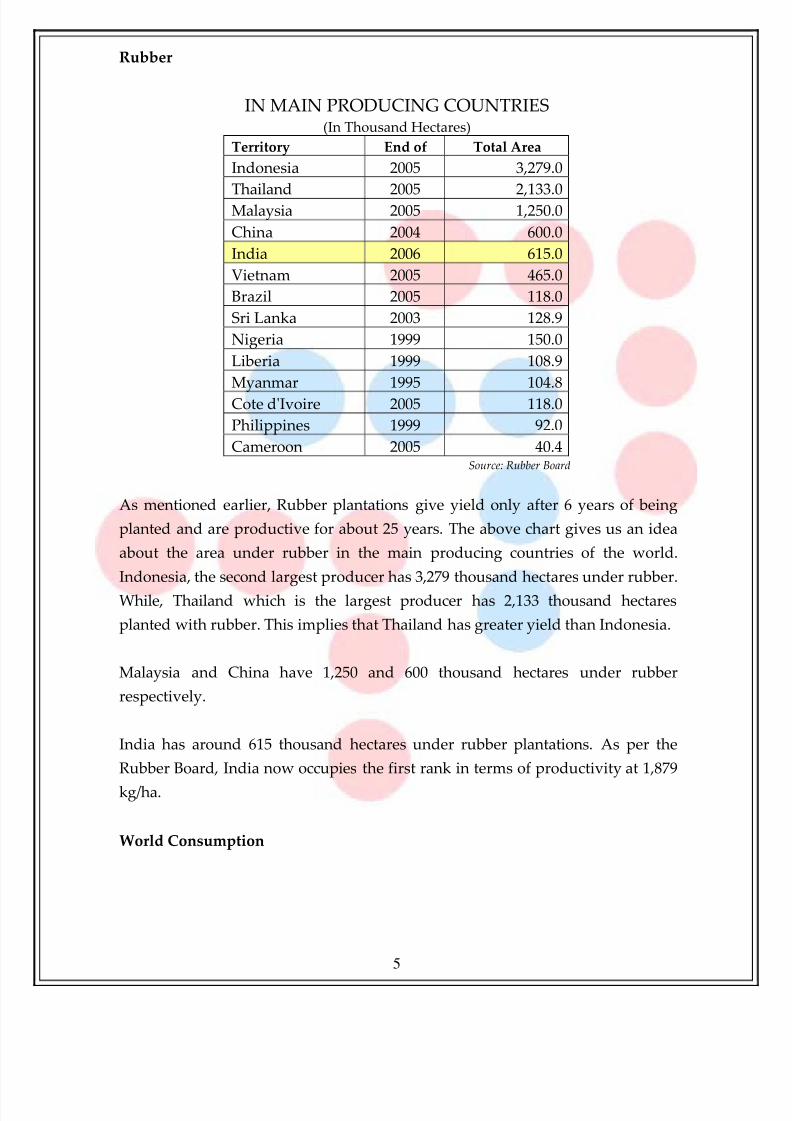
As mentioned earlier, Rubber plantations give yield only after 6 years of being
planted and are productive for about 25 years. The above chart gives us an idea
about the area under rubber in the main producing countries of the world.
Indonesia, the second largest producer has 3,279 thousand hectares under rubber.
While, Thailand which is the largest producer has 2,133 thousand hectares
planted with rubber. This implies that Thailand has greater yield than Indonesia.
Malaysia and China have 1,250 and 600 thousand hectares under rubber
respectively.
India has around 615 thousand hectares under rubber plantations. As per the
Rubber Board, India now occupies the first rank in terms of productivity at 1,879
kg/ha.
World Consumption
8/6/2019 Rubber Very Important
http://slidepdf.com/reader/full/rubber-very-important 6/22
Rubber
6
CONSUMPTION OF NATURAL RUBBER ('000 TONNES) IN
2008
China
2560
26%
U.S.A.
1041
11%Japan
8789%
India
881
9%
Thailand
398
4%
Malaysia
469
5%
Rep.of Korea358
4%
Others
314132%
Source: Monthly Rubber Statistical News
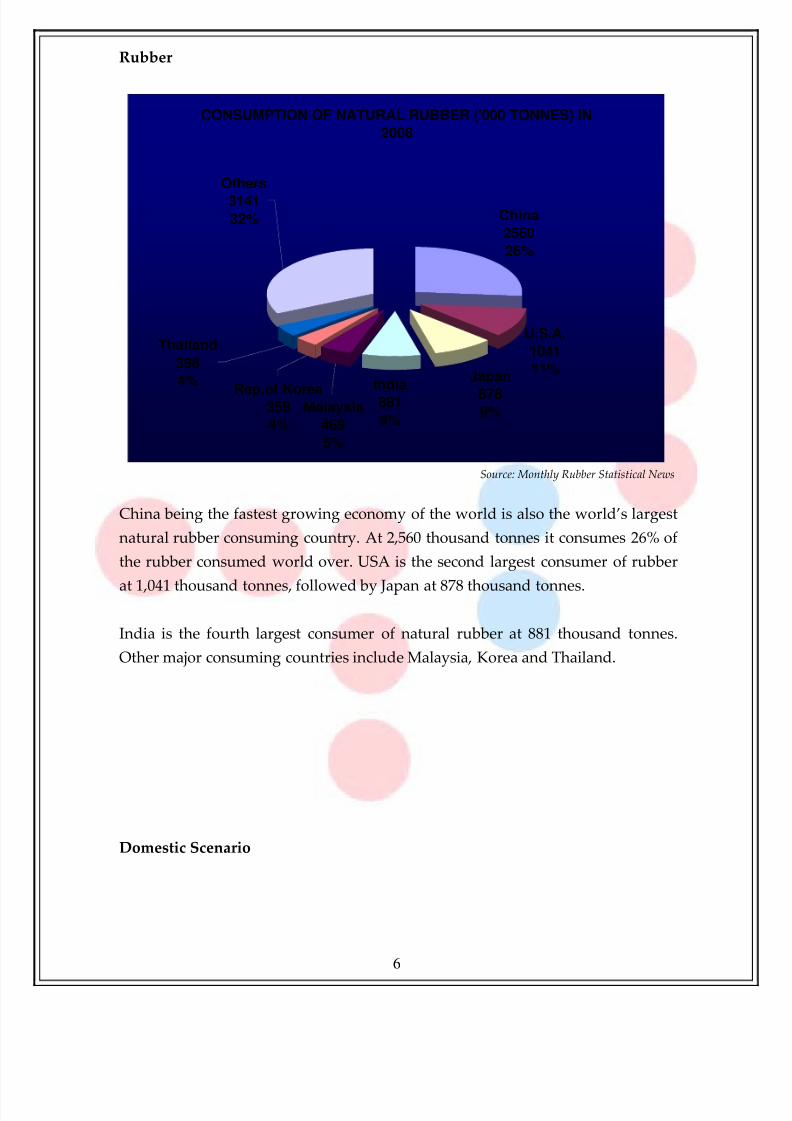
China being the fastest growing economy of the world is also the world’s largest
natural rubber consuming country. At 2,560 thousand tonnes it consumes 26% of
the rubber consumed world over. USA is the second largest consumer of rubber
at 1,041 thousand tonnes, followed by Japan at 878 thousand tonnes.
India is the fourth largest consumer of natural rubber at 881 thousand tonnes.
Other major consuming countries include Malaysia, Korea and Thailand.
Domestic Scenario
8/6/2019 Rubber Very Important
http://slidepdf.com/reader/full/rubber-very-important 7/22
Rubber
7
Production and Consumption Trend of NR
RUBBER PRODUCTION AND CONSUMPTION TREND IN INDIA
0
100
200
300
400
500
600
700
800
900
1000
1995 1996 1997 1998 1999 2000 2001 2002 2003 2004 2005 2006 2007 2008
' 0 0 0 T O N N E S
Production ('000 tonnes) Consumption ('000 tonnes)So
urce: Rubber Board
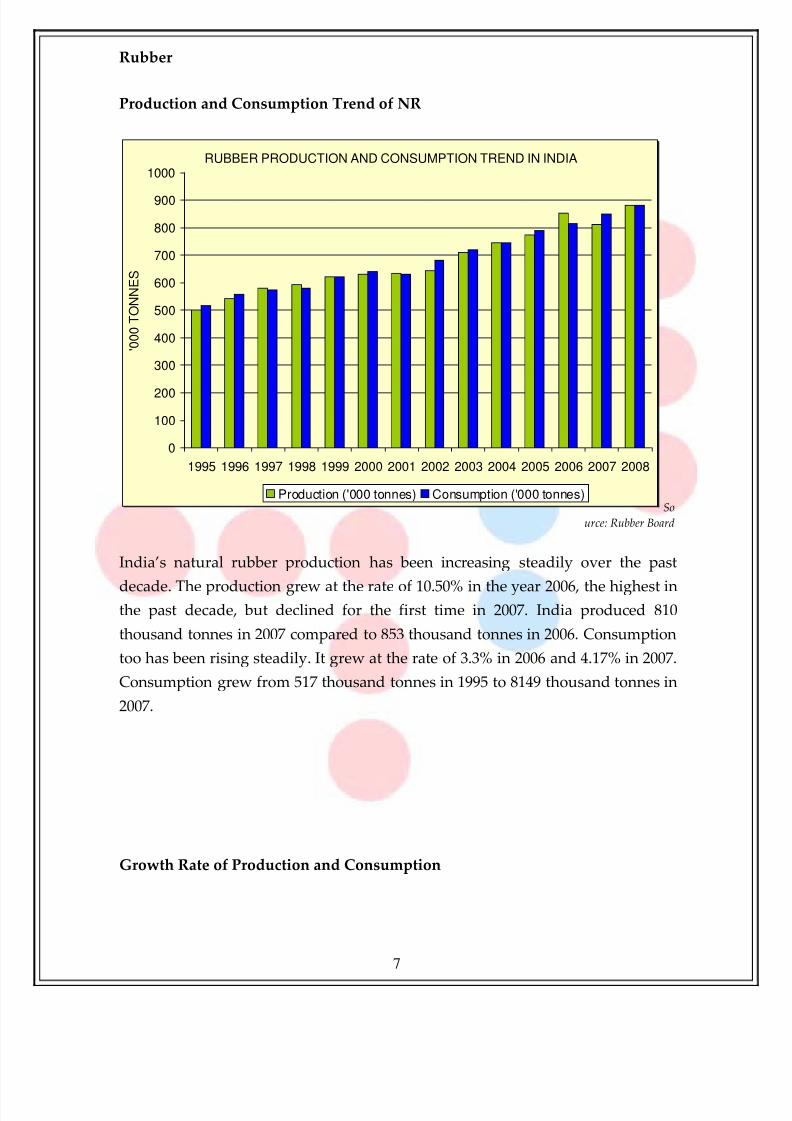
India’s natural rubber production has been increasing steadily over the past
decade. The production grew at the rate of 10.50% in the year 2006, the highest in
the past decade, but declined for the first time in 2007. India produced 810
thousand tonnes in 2007 compared to 853 thousand tonnes in 2006. Consumption
too has been rising steadily. It grew at the rate of 3.3% in 2006 and 4.17% in 2007.
Consumption grew from 517 thousand tonnes in 1995 to 8149 thousand tonnes in
2007.
Growth Rate of Production and Consumption
8/6/2019 Rubber Very Important
http://slidepdf.com/reader/full/rubber-very-important 8/22
Rubber
8
Year Production
(ʹ000 tonnes)
Consumption
(ʹ000 tonnes)
Supply
Gap
Production
Growth Rate
Consumption
Growth Rate
1995 500 517 ‐17 7.76% 9.30%
1996 540 558 ‐18 8.00% 7.93%
1997 580 572 8 7.41% 2.51%
1998 591 580 11 1.90% 1.40%
1999 620 619 1 4.91% 6.72%
2000 629 638 ‐9 1.45% 3.07%
2001 632 631 1 0.48% ‐1.10%
2002 641 680 ‐39 1.42% 7.77%
2003 708 717 ‐9 10.45% 5.44%
2004 743 745 ‐2 4.94% 3.91%
2005 772 789 ‐17 3.90% 5.91%
2006 853 815 38 10.49% 3.30%
2007
810
849‐
39‐
5.04% 4.17%2008 881 881 0 8.77% 3.77%Source: Rubber Board
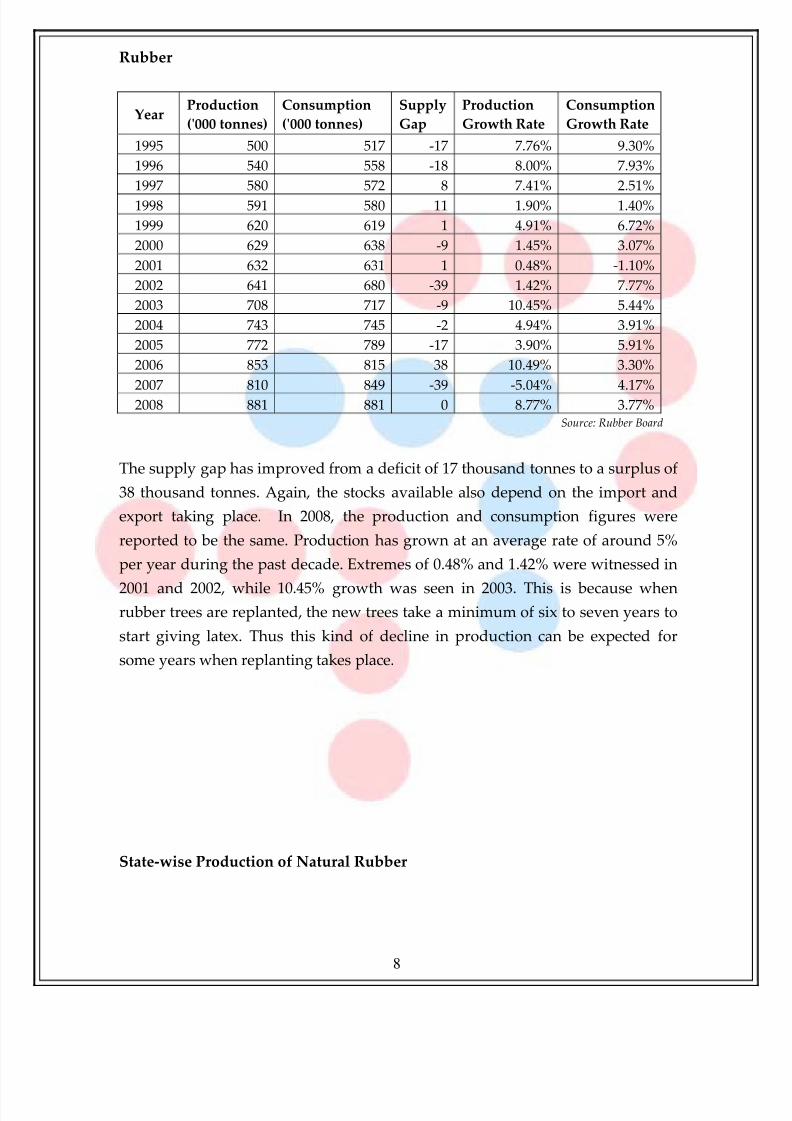
The supply gap has improved from a deficit of 17 thousand tonnes to a surplus of
38 thousand tonnes. Again, the stocks available also depend on the import and
export taking place. In 2008, the production and consumption figures were
reported to be the same. Production has grown at an average rate of around 5%
per year during the past decade. Extremes of 0.48% and 1.42% were witnessed in
2001 and 2002, while 10.45% growth was seen in 2003. This is because when
rubber trees are replanted, the new trees take a minimum of six to seven years to
start giving latex. Thus this kind of decline in production can be expected for
some years when replanting takes place.
State‐wise Production of Natural Rubber
8/6/2019 Rubber Very Important
http://slidepdf.com/reader/full/rubber-very-important 9/22
Rubber
9
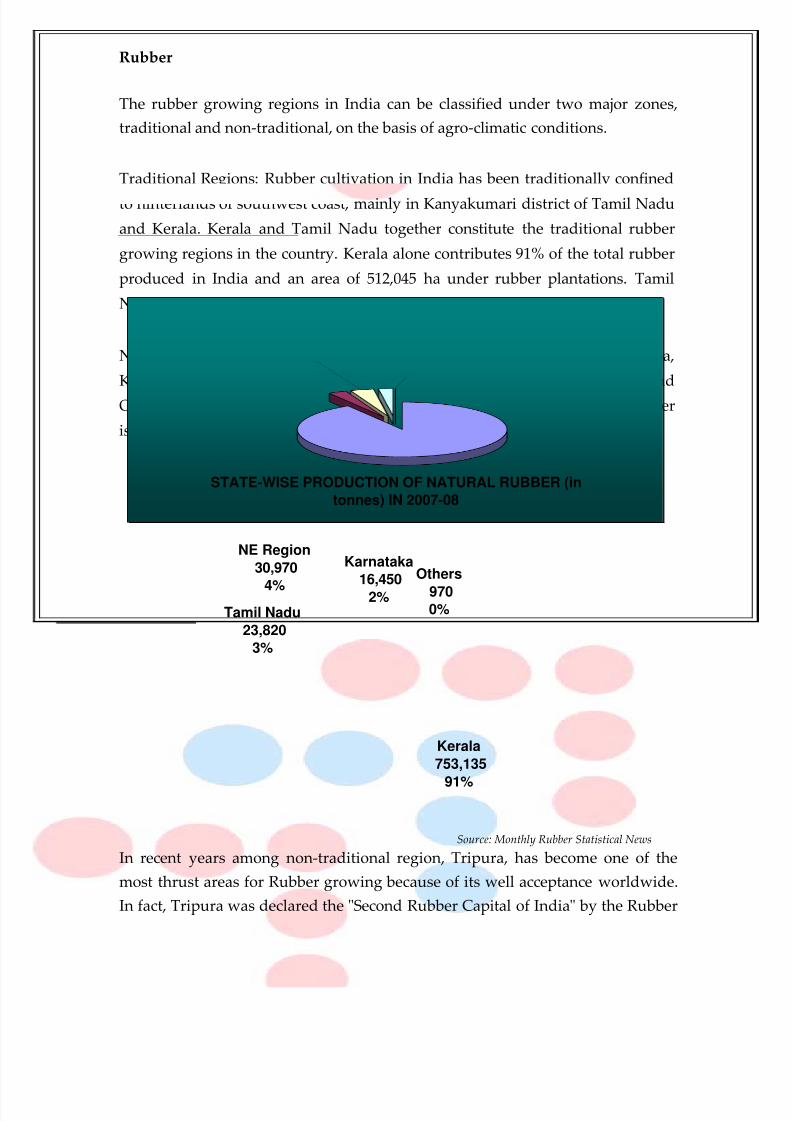
The rubber growing regions in India can be classified under two major zones,
traditional and non‐traditional, on the basis of agro‐climatic conditions.
Traditional Regions: Rubber cultivation in India has been traditionally confined
to hinterlands of southwest coast, mainly in Kanyakumari district of Tamil Nadu
and Kerala. Kerala and Tamil Nadu together constitute the traditional rubber
growing regions in the country. Kerala alone contributes 91% of the total rubber
produced in India and an area of 512,045 ha under rubber plantations. Tamil
Nadu contributes another 3% of the total natural rubber production.
Non‐Traditional Regions: These are hinterlands of coastal Karnataka, Goa,
Konkan Region of Maharashtra, hinterlands of coastal Andhra Pradesh and
Orissa, the northeastern states, Andaman and Nicobar Islands etc, where rubber
is now being grown.
STATE-WISE PRODUCTION OF NATURAL RUBBER (in
tonnes) IN 2007-08
Kerala
753,135
91%
Karnataka
16,450
2%
NE Region
30,970
4%
Tamil Nadu
23,820
3%
Others
9700%
Source: Monthly Rubber Statistical News
In recent years among non‐traditional region, Tripura, has become one of the
most thrust areas for Rubber growing because of its well acceptance worldwide.
In fact, Tripura was declared the ʺSecond Rubber Capital of Indiaʺ by the Rubber
8/6/2019 Rubber Very Important
http://slidepdf.com/reader/full/rubber-very-important 10/22
Rubber
10
Board. India has succeeded in Rubber cultivation due to research and extension
work undertaken by the Rubber Board. The worldwide demand for natural
rubber from Tripura is mainly because of its elasticity.
The North‐Eastern region contributes up to 4% of the total production, while
Karnataka contributes 2%. An area of 71,840 ha is covered by rubber plantations
in the north‐eastern region.
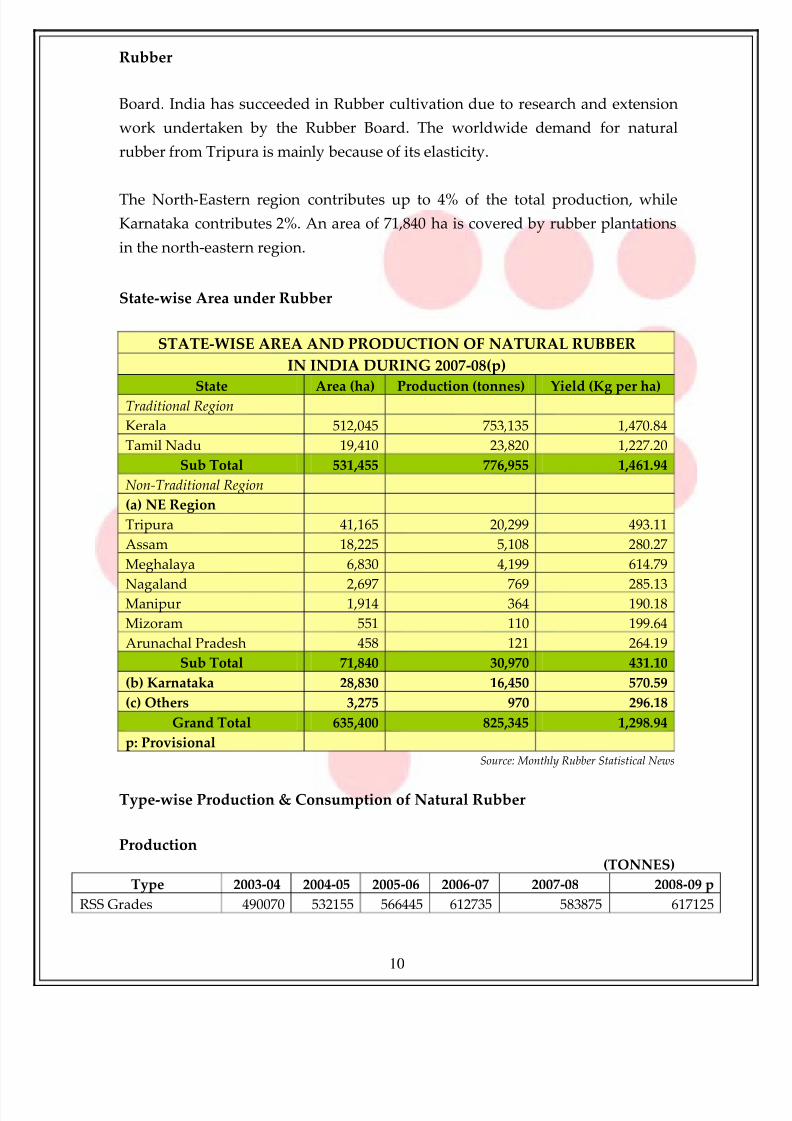
State‐wise Area under Rubber
STATE‐WISE AREA AND PRODUCTION OF NATURAL RUBBER
IN INDIA DURING 2007‐08(p)
State
Area (ha)
Production
(tonnes)
Yield
(Kg
per
ha)
Traditional Region
Kerala 512,045 753,135 1,470.84
Tamil Nadu 19,410 23,820 1,227.20
Sub Total 531,455 776,955 1,461.94
Non‐Traditional Region
(a) NE Region
Tripura 41,165 20,299 493.11
Assam 18,225 5,108 280.27
Meghalaya 6,830 4,199 614.79
Nagaland
2,697 769 285.13Manipur 1,914 364 190.18
Mizoram 551 110 199.64
Arunachal Pradesh 458 121 264.19
Sub Total 71,840 30,970 431.10
(b) Karnataka 28,830 16,450 570.59
(c) Others 3,275 970 296.18
Grand Total 635,400 825,345 1,298.94
p: Provisional Source: Monthly Rubber Statistical News
Type‐wise Production & Consumption of Natural Rubber
Production
(TONNES)
Type 2003‐04 2004‐05 2005‐06 2006‐07 2007‐08 2008‐09 p
RSS Grades 490070 532155 566445 612735 583875 617125
8/6/2019 Rubber Very Important
http://slidepdf.com/reader/full/rubber-very-important 11/22
Rubber
11
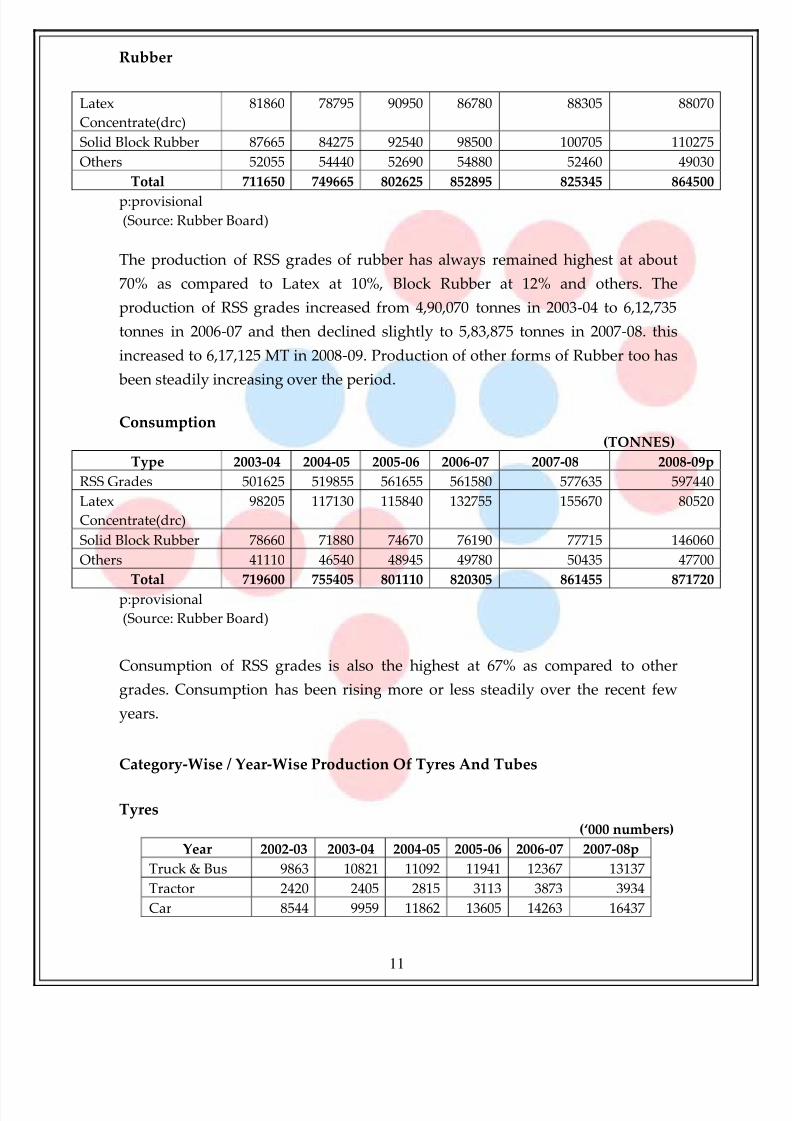
Latex
Concentrate(drc)
81860 78795 90950 86780 88305 88070
Solid Block Rubber 87665 84275 92540 98500 100705 110275
Others 52055 54440 52690 54880 52460 49030
Total 711650 749665 802625 852895 825345 864500
p:provisional
(Source: Rubber Board)
The production of RSS grades of rubber has always remained highest at about
70% as compared to Latex at 10%, Block Rubber at 12% and others. The
production of RSS grades increased from 4,90,070 tonnes in 2003‐04 to 6,12,735
tonnes in 2006‐07 and then declined slightly to 5,83,875 tonnes in 2007‐08. this
increased to 6,17,125 MT in 2008‐09. Production of other forms of Rubber too has
been steadily increasing over the period.
Consumption
(TONNES)
Type 2003‐04 2004‐05 2005‐06 2006‐07 2007‐08 2008‐09p
RSS Grades 501625 519855 561655 561580 577635 597440
Latex
Concentrate(drc)
98205 117130 115840 132755 155670 80520
Solid Block Rubber 78660 71880 74670 76190 77715 146060
Others 41110 46540 48945 49780 50435 47700
Total 719600 755405 801110 820305 861455 871720
p:provisional
(Source: Rubber Board)
Consumption of RSS grades is also the highest at 67% as compared to other
grades. Consumption has been rising more or less steadily over the recent few
years.
Category‐Wise / Year‐Wise Production Of Tyres And Tubes
Tyres
(‘000 numbers)
Year 2002‐03 2003‐04 2004‐05 2005‐06 2006‐07 2007‐08p
Truck & Bus 9863 10821 11092 11941 12367 13137
Tractor 2420 2405 2815 3113 3873 3934
Car 8544 9959 11862 13605 14263 16437
8/6/2019 Rubber Very Important
http://slidepdf.com/reader/full/rubber-very-important 12/22
Rubber
12
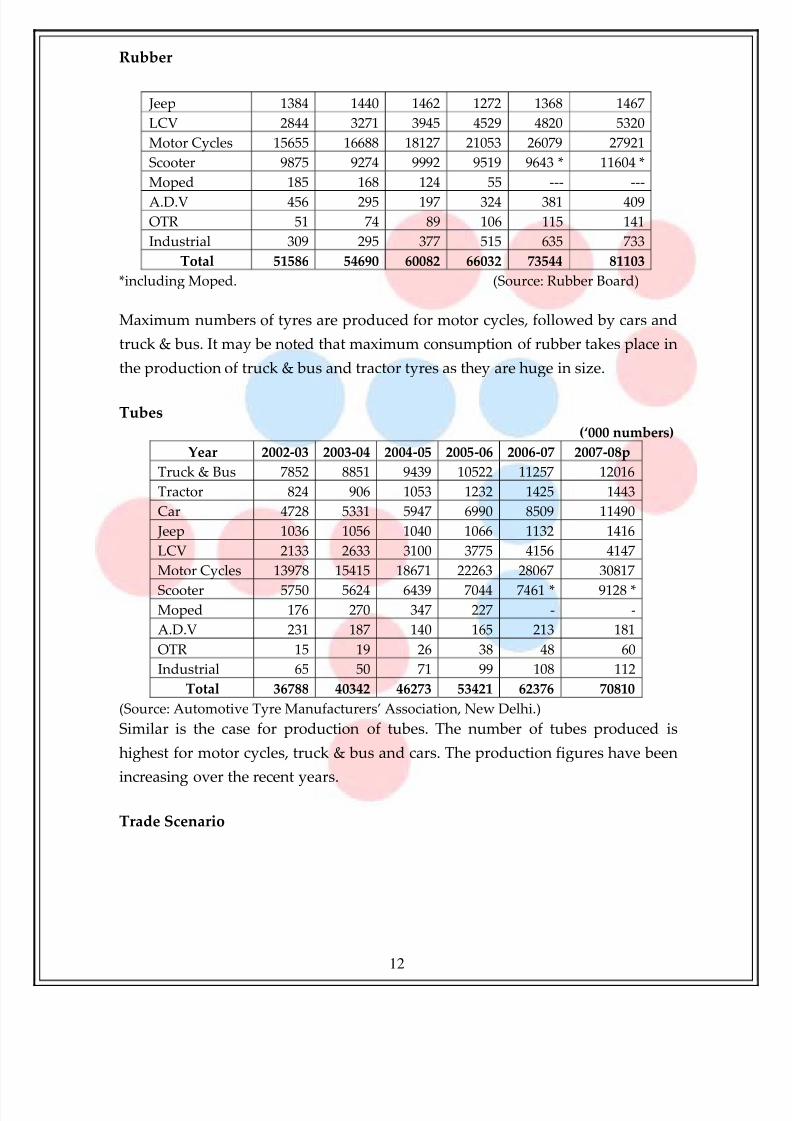
Jeep 1384 1440 1462 1272 1368 1467
LCV 2844 3271 3945 4529 4820 5320
Motor Cycles 15655 16688 18127 21053 26079 27921
Scooter 9875 9274 9992 9519 9643 * 11604 *
Moped 185 168 124 55 ‐‐‐ ‐‐‐
A.D.V 456 295 197 324 381 409
OTR 51 74 89 106 115 141
Industrial 309 295 377 515 635 733
Total 51586 54690 60082 66032 73544 81103
*including Moped. (Source: Rubber Board)
Maximum numbers of tyres are produced for motor cycles, followed by cars and
truck & bus. It may be noted that maximum consumption of rubber takes place in
the production of truck & bus and tractor tyres as they are huge in size.
Tubes
(‘000 numbers)
Year 2002‐03 2003‐04 2004‐05 2005‐06 2006‐07 2007‐08p
Truck & Bus 7852 8851 9439 10522 11257 12016
Tractor 824 906 1053 1232 1425 1443
Car 4728 5331 5947 6990 8509 11490
Jeep 1036 1056 1040 1066 1132 1416
LCV 2133 2633 3100 3775 4156 4147
Motor Cycles 13978 15415 18671 22263 28067 30817
Scooter 5750 5624 6439 7044 7461 * 9128 *Moped 176 270 347 227 ‐ ‐
A.D.V 231 187 140 165 213 181
OTR 15 19 26 38 48 60
Industrial 65 50 71 99 108 112
Total 36788 40342 46273 53421 62376 70810
(Source: Automotive Tyre Manufacturers’ Association, New Delhi.)
Similar is the case for production of tubes. The number of tubes produced is
highest for motor cycles, truck & bus and cars. The production figures have been
increasing
over
the
recent
years.
Trade Scenario
8/6/2019 Rubber Very Important
http://slidepdf.com/reader/full/rubber-very-important 13/22
Rubber
13
NATURAL RUBBER IMPORT & EXPORT - INDIA
1 , 1 3 0
1 , 5 9 8
1 , 4 1 5
1 , 8 4 0
5 , 9 8 9 1
3 , 3 5 6
6 , 9 9 5
5 5 , 3 1 1
7 5 , 9 0 5
4 6 , 1 6 9
7 3 , 8 3 0
5 6 , 5 4 5
6 0 , 2 8 0
5 1 , 6 3 5
1 9 , 7 7 0 3
2 , 0 7 0
2 9 , 5 3 4
2 0 , 2 1 3
8 , 9 7 0
4 9 , 7 6 9
2 6 , 2 1 7
4 4 , 1 9 9
6 8 , 7 1 8
4 5 , 2 8 5
8 9 , 6 9 9
8 6 , 3 9 4
0
10000
20000
30000
40000
50000
60000
70000
80000
90000
100000
1995-
96
1996-
97
1997-
98
1998-
99
1999-
00
2000-
01
2001-
02
2002-
03
2003-
04
2004-
05
2005-
06
2006-
07
2007-
08
I M P O R T & E X P O R T I N T O N N E S
Export Import
Source: Monthly Rubber Statistical News
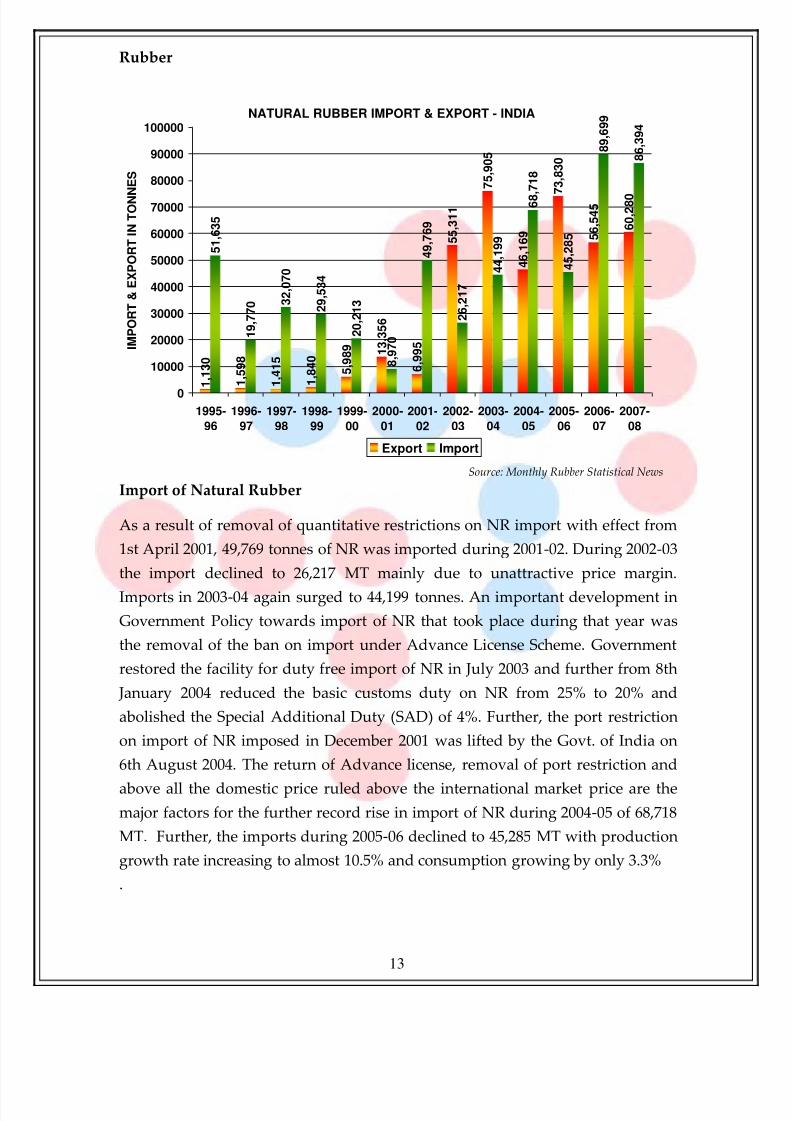
Import of Natural Rubber
As a result of removal of quantitative restrictions on NR import with effect from
1st April 2001, 49,769 tonnes of NR was imported during 2001‐02. During 2002‐03
the import declined to 26,217 MT mainly due to unattractive price margin.
Imports in 2003‐04 again surged to 44,199 tonnes. An important development in
Government Policy towards import of NR that took place during that year was
the removal of the ban on import under Advance License Scheme. Government
restored the facility for duty free import of NR in July 2003 and further from 8th
January 2004 reduced the basic customs duty on NR from 25% to 20% and
abolished the Special Additional Duty (SAD) of 4%. Further, the port restriction
on import of NR imposed in December 2001 was lifted by the Govt. of India on
6th August 2004. The return of Advance license, removal of port restriction and
above all the domestic price ruled above the international market price are the
major factors for the further record rise in import of NR during 2004‐05 of 68,718
MT. Further, the imports during 2005‐06 declined to 45,285 MT with production
growth rate increasing to almost 10.5% and consumption growing by only 3.3%
.
8/6/2019 Rubber Very Important
http://slidepdf.com/reader/full/rubber-very-important 14/22
Rubber
14
During 2006‐07 a large quantity of Rubber was imported. 89,699 MT of natural
rubber were imported by the user industry as the domestic prices had risen
above the international prices. The auto tyre manufacturing industry is the main
consumer of natural rubber.
In 2007‐08 the import figure remained almost steady at 86,394 MT, with the
demand from the automotive industry remaining strong. Moreover rise in
domestic spot prices made the international prices comparatively more attractive
during some phases of the year.
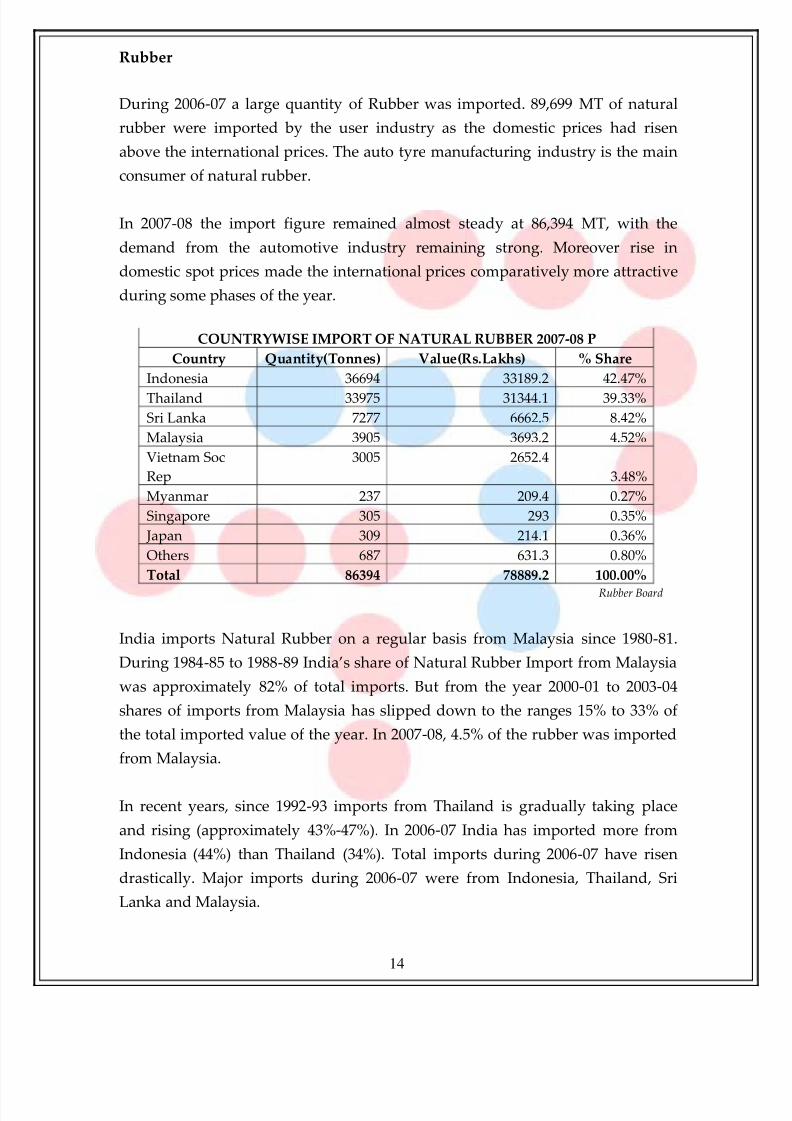
COUNTRYWISE IMPORT OF NATURAL RUBBER 2007‐08 P
Country Quantity(Tonnes) Value(Rs.Lakhs) % Share
Indonesia 36694 33189.2 42.47%
Thailand 33975 31344.1 39.33%
Sri Lanka 7277 6662.5 8.42%
Malaysia 3905 3693.2 4.52%
Vietnam Soc
Rep
3005 2652.4
3.48%
Myanmar 237 209.4 0.27%
Singapore 305 293 0.35%
Japan 309 214.1 0.36%
Others 687 631.3 0.80%
Total 86394 78889.2 100.00%
Rubber Board
India imports Natural Rubber on a regular basis from Malaysia since 1980‐81.
During 1984‐85 to 1988‐89 India’s share of Natural Rubber Import from Malaysia
was approximately 82% of total imports. But from the year 2000‐01 to 2003‐04
shares of imports from Malaysia has slipped down to the ranges 15% to 33% of
the total imported value of the year. In 2007‐08, 4.5% of the rubber was imported
from Malaysia.
In recent years, since 1992‐93 imports from Thailand is gradually taking place
and rising (approximately 43%‐47%). In 2006‐07 India has imported more from
Indonesia (44%) than Thailand (34%). Total imports during 2006‐07 have risen
drastically. Major imports during 2006‐07 were from Indonesia, Thailand, Sri
Lanka and Malaysia.
8/6/2019 Rubber Very Important
http://slidepdf.com/reader/full/rubber-very-important 15/22
Rubber
15
This trend continued in 2007‐08, but the absolute import figures have fallen.
Besides these countries, India imports Natural Rubber from Sri Lanka and
Vietnam.
Export of Natural Rubber
Export of Indian NR, which was little known in the overseas market until 2001‐
02, managed to get a break in the highly competitive global NR market. Export of
natural rubber from India rose from the low level of 6,995 tonnes in 2001‐02 to
55,311 tonnes during 2002‐03 and 75,905 tonnes during 2003‐04. But in 2004‐05
export partially slide to 46,169 MT and the decrease in the quantity of export of
NR was due to the reduced rate of incentive and lesser price difference in the
domestic and international market. In 2005‐06 exports regained their lost ground
rising to 73,830 MT.
56,545 MT of natural rubber were exported during 2006‐07, down from the
previous year as the Indian prices were high compared to the prices in
international market. Moreover, the appreciation of rupee during the year added
hindrance in the exports.
A major change in the NR trade during 2005 has been the introduction of VAT in
most of the rubber centers particularly Kerala, the state which accounts for 92 per
cent of the production. VAT has had an impact in both exports as well as
domestic trade.
Though India’s relative share in the total world merchandise exports remains at
0.8 percent, the country’s share in NR exports during 2003‐04 was 1.3 per cent.
Against a
target
of
102,000
tonnes
during
the
tenth
plan,
the
total
export
during
the first three years of the plan was 177,385 tonnes.
According to Mr.Sajen Peter, I.A.S., Chairman, Rubber Board, export promotion
measures such as identifying and encouraging potential exporters and overseas
buyers, promoting buyers‐sellers interaction through website and participation in
international trade fairs are continuing.
8/6/2019 Rubber Very Important
http://slidepdf.com/reader/full/rubber-very-important 16/22
Rubber
16
Export of NR during the crucial period has not only helped to reduce the excess
stock of NR in the country, but also has been instrumental in maintaining the
demand‐supply balance in spite of surge in imports.
The main factors contributing to the buoyancy in export were the export
promotional measures adopted by the Government of India and the prevalence
of relatively higher NR prices in the international market since June 2003.
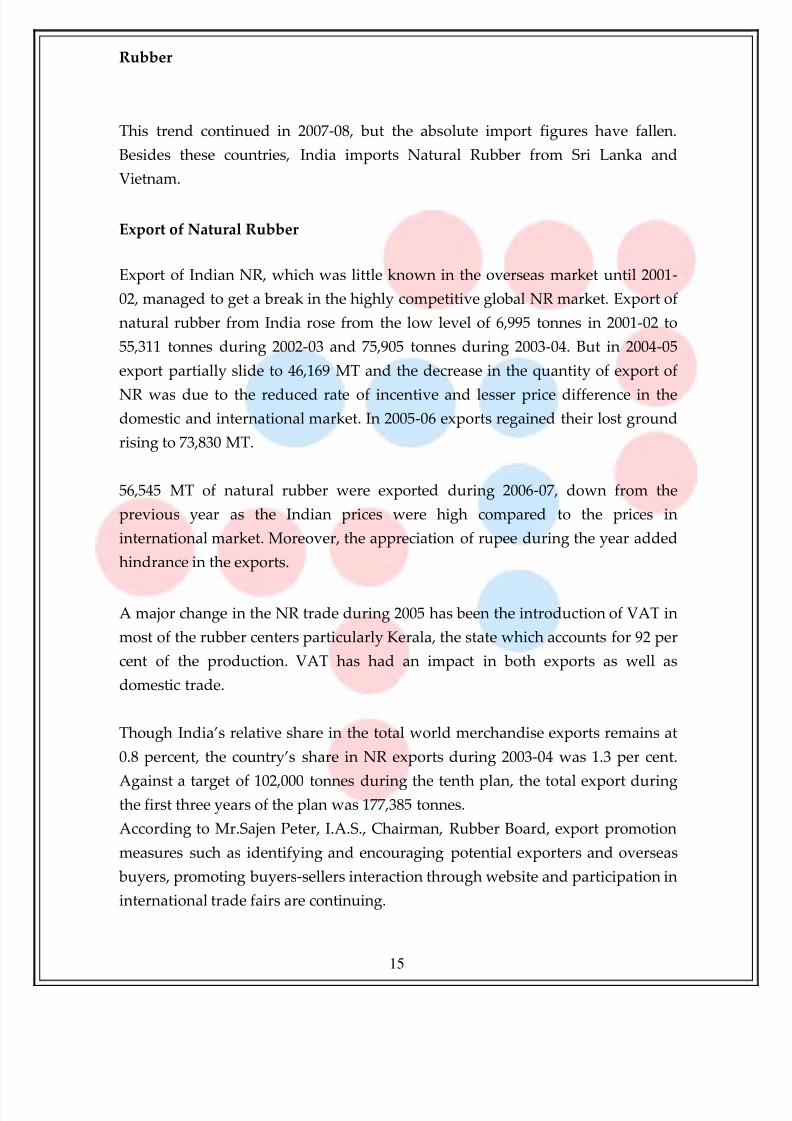
COUNTRYWISE EXPORT OF NATURAL RUBBER
2006‐07 2007‐08P
Quantity in
tonnes
% share Quantity in tonnes % share
China 16592 29.3 20222 33.5
Malaysia 10412 18.4 12092 20.1
USA 1567 2.8 4888 8.1
Belgium 2324 4.1 2873 4.8
SriLanka 4760 8.4 2789 4.6
Italy 1503 2.7 2589 4.3
Germany 2658 4.7 2480 4.1
Turkey 1751 3.1 1178 2
Brazil 639 1.1 1177 2
UK 1238 2.2 1112 1.8
Spain 1204 2.1 1052 1.7
Pakistan 288 0.5 1036 1.7
Korea 608 1.1 776 1.3
Nepal 656 1.2 677 1.1
Netherland 501 0.9 642 1.1
Egypt 740 1.3 618 1
South Africa 625 1.1 501 0.8
Australia 382 0.7 420 0.7
Poland 819 1.4 374 0.6
Bulgaria 669 1.2 341 0.6
Singapore 304 0.5 306 0.5
Austria ‐ 0 279 0.5
UAE 668 1.2 218 0.4
Denmark 21 0 211 0.3
Syria 221 0.4 210 0.3
Vietnam 2641 4.7 208 0.3
Others 2755 4.9 1009 1.7
8/6/2019 Rubber Very Important
http://slidepdf.com/reader/full/rubber-very-important 17/22
Rubber
17
Total 56545 100 60280 100
p:provisional
As per the country‐wise export information of Natural Rubber during 2004‐05,
the
leading
export
market
of
Indian
Natural
rubber
are
China,
Malaysia,
Indonesia, Malaysia, Turkey, Sri Lanka, Spain, Pakistan, Singapore and Nepal.
Historical data shows that Natural Rubber export from India maintains a regular
trend to Nepal, i.e. its share was 93% in 1995‐96 and gradually slides to 81% in
the year 1998‐99; around 10% in 2001‐02 and presently Nepal’s share in natural
rubber export remains 2.5% to 3%. After 1998‐99 Singapore entered as a targeted
export market zone for India with 64% export share in the year 1999‐00, and in
the next year (2000‐01) its share in India’s natural rubber export was 17%, because
that year India’s export spurted with additional two potential export zone of
natural rubber as Indonesia with 30% and Pakistan with 21%. Indonesia was the
third leading export market up to 2002‐03 with 16.5% share. Malaysia and China
both entered in India’s natural rubber export market with a very silent note
(having only 162 MT export demand) in 1999‐00 and 2000‐01 respectively.
The fastest growing economy in the world, China, remained the leading export
market for India. Though the total exports declined in 2004‐05, China’s share
remained the highest at 35% of total exports in 2004‐05, Sri Lanka next at around
22%. Malaysia, Singapore, Nepal, Spain are the other potential markets were
further exports may be encouraged.
Exports in 2006‐07 shot up and included exports to countries like Vietnam,
Belgium, and Germany apart from Sri Lanka and Turkey. China’s share dropped
to 29%, while 18% of the total exports were made to Malaysia.
In 2007‐08, export of NR increased to 60,280 MT as compared to 56,545 MT in
2006‐07. China’s share in the total export increased to 33.5% with 20,222 MT as
compared to 16,592 last year. Malaysia continued to remain the second largest
export destination for India at 12,092 MT and 20% share as compared to 10,412
MT and 18.4% share.
Natural Rubber Prices
8/6/2019 Rubber Very Important
http://slidepdf.com/reader/full/rubber-very-important 18/22
Rubber
18
After the opening up of the Indian economy in 1990s, India’s domestic rubber
market started showing links to the international market. Probable determinants
of volatility in natural rubber prices in domestic market are state administered
procurement programs, inconsistent import and export policies and global
market trend.
The period from 1994 to 1998 was the most turbulent in domestic price trend of
natural rubber. In June 1995 RSS‐4 price shot up sharply to Rs.6,171 per quintal
from Rs.2,599 a quintal in March 1995. The probable reason of this sudden price
hike was decline in world production of natural rubber in main producing
countries. Immediately after May 1995 India’s import of Natural rubber also
increased. The maximum natural rubber import during 1991‐92 to 2003‐04 took
place that year i.e. 51,635 MT. Simultaneously in global market natural rubber
price rose in anticipation of future supply tightness and shortage of some grades,
because Australia forecasted to decline NR production due to serious drought.
After that in February 1999, Indian Government banned rubber imports through
ALS (Advance License scheme), as a result of this rubber prices moved sideways.
The removal of the quantitative restrictions from 1st April 2001 aggravated the
declining price trends. The probable reason behind this firming up of Natural
Rubber prices
are
up
trend
in
global
market,
global
natural
rubber
supply
fails
to
catch up with growing demand‐particularly from China. The prices have reached
to Rs.13,340 per quintal as on 31, August 2008.
Demand for Rubber is most evenly distributed over the years but due to absence
of production in monsoon, supply shrinkage occurs.
By June / July the production becomes normal, but lingering rains last for a
couple of months. During rains tapping of rubber trees disrupted and production
falls. Resultantly prices would rise at that time, unless there is an acute economic
depression or similar negative factors.
Rubber Futures in India
8/6/2019 Rubber Very Important
http://slidepdf.com/reader/full/rubber-very-important 19/22
Rubber
19
Futures trading in Rubber flagged off on 15 March 2003 for the very first time in
India via National Multi Commodity Exchange of India Ltd. Ahmedabad, and
the product soon became a role model as a truly efficient and liquid market. If
futures are meant for the price discovery and price risk management for real
hedgers, rubber futures should be considered as a great success. NMCE has
provided an unbiased credible online platform to all the participants giving equal
opportunities of the fair and transparent trade. Rubber futures have been used by
the rubber industry whose offices are largely located in the south. It includes the
traders, exporters, user industry, manufacturers, etc.
NMCE has CWC warehouses at Kottayam, Aluva, Ernakulam, Kakkanad,
Kakkanchery, Kozhikode, Trichur, Palakkadu, etc in south were Rubber is stored.
NMCE has facilitated a delivery of 49,753 tons of rubber up to April 2008 since its
inception.
After a detailed cost study by the Costing Branch of Finance Ministry, in 1998 GoI
announced Rs 35 a Kg, to a large extent, as the benchmark price.
But rubber historical prices show that 1998‐99 to May 2002 price of RSS 4
remained lower
than
Rs.3,500
per
quintal.
Since
rubber
futures
trading
started
in
India, it has never gone below this scale, and also absurd volatility in its prices
has now become unusual. This gives a very relevant example of market
participation by the actual rubber growers who are now benefited by the futures
trading mechanism and have consistently managed to gain a price that is
approximately 94% higher than the cost price of rubber. The rubber growers of
Kerala have heaved a sigh of relief, by getting consistently good prices due to the
efficient price discovery and price dissemination contributed by futures trading
on the NMCE.
Convergence of Prices on Settlement
The futures price perfectly converges with the spot price every month on the date
of settlement as it ideally should. A recent example of the same can be viewed in
8/6/2019 Rubber Very Important
http://slidepdf.com/reader/full/rubber-very-important 20/22
Rubber
20
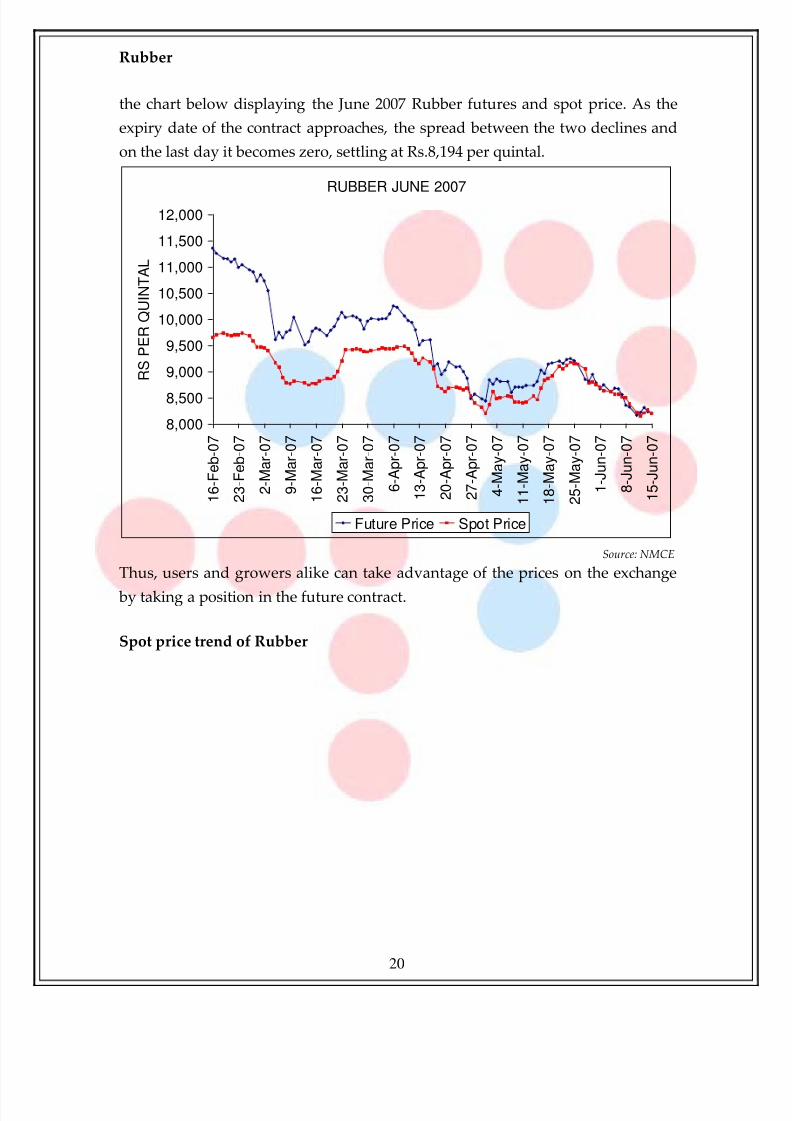
the chart below displaying the June 2007 Rubber futures and spot price. As the
expiry date of the contract approaches, the spread between the two declines and
on the last day it becomes zero, settling at Rs.8,194 per quintal.
RUBBER JUNE 2007
8,000
8,500
9,000
9,500
10,000
10,500
11,000
11,500
12,000
1 6 - F e b - 0 7
2 3 - F e b - 0 7
2 - M a r - 0 7
9 - M a r - 0 7
1 6 - M a r - 0 7
2 3 - M a r - 0 7
3 0 - M a r - 0 7
6 - A p r - 0 7
1 3 - A p r - 0 7
2 0 - A p r - 0 7
2 7 - A p r - 0 7
4 - M a y - 0 7
1 1 - M a y - 0 7
1 8 - M a y - 0 7
2 5 - M a y - 0 7
1 - J u n - 0 7
8 - J u n - 0 7
1 5 - J u n - 0 7
R S P E R
Q U I N T A L
Future Price Spot Price
Source: NMCE
Thus, users and growers alike can take advantage of the prices on the exchange
by taking a position in the future contract.
Spot price trend of Rubber
8/6/2019 Rubber Very Important
http://slidepdf.com/reader/full/rubber-very-important 21/22
Rubber
21
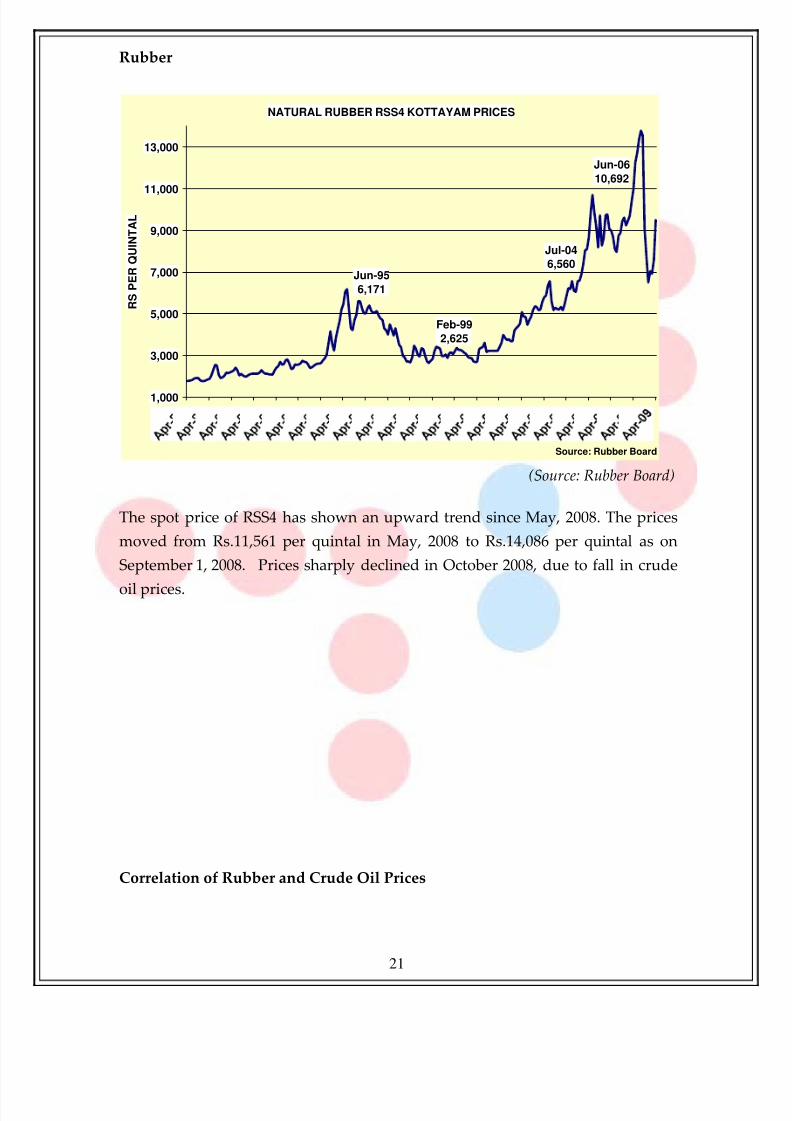
NATURAL RUBBER RSS4 KOTTAYAM PRICES
Jun-95
6,171
Jul-04
6,560
Jun-06
10,692
Feb-99
2,625
1,000
3,000
5,000
7,000
9,000
11,000
13,000
R S P E R Q U I N T A L
Source: Rubber Board
(Source: Rubber Board)
The spot price of RSS4 has shown an upward trend since May, 2008. The prices
moved from Rs.11,561 per quintal in May, 2008 to Rs.14,086 per quintal as on
September 1, 2008. Prices sharply declined in October 2008, due to fall in crude
oil prices.
Correlation of Rubber and Crude Oil Prices
8/6/2019 Rubber Very Important
http://slidepdf.com/reader/full/rubber-very-important 22/22
Rubber
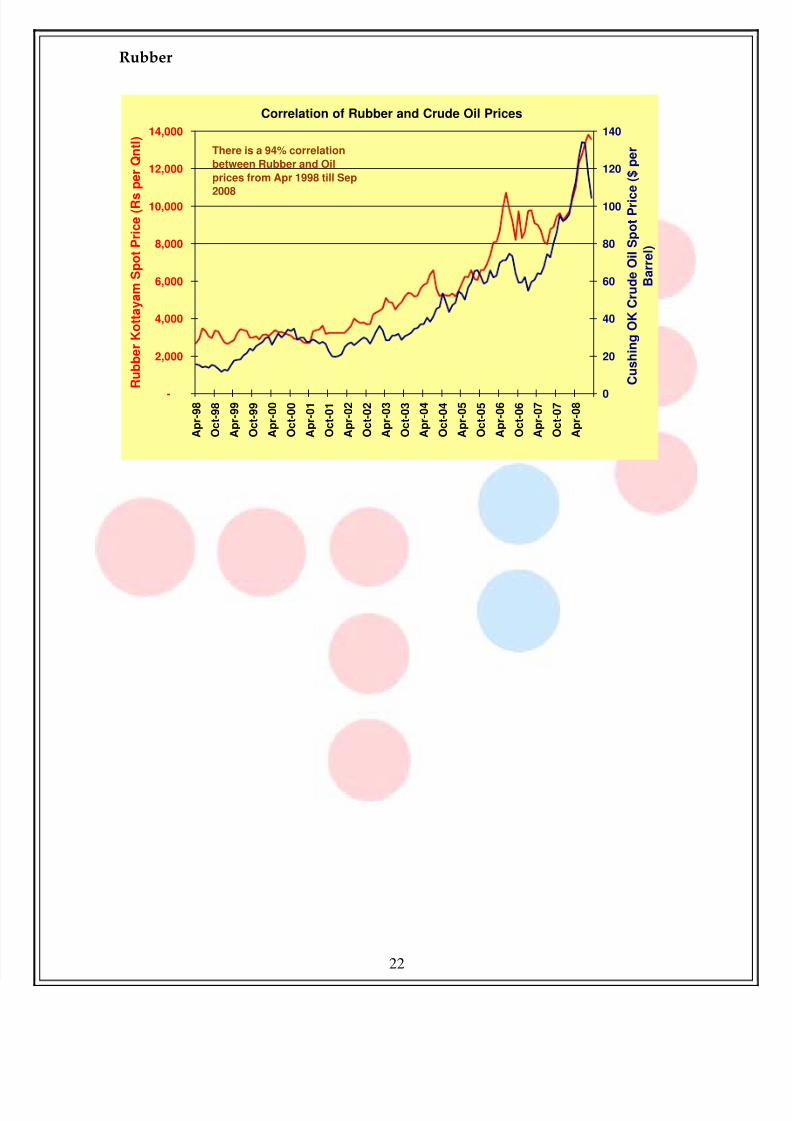
Correlation of Rubber and Crude Oil Prices
-
2,000
4,000
6,000
8,000
10,000
12,000
14,000
R u b b e r K o t t a y a m S p o t P r i c e ( R s
p e r Q n t l )
A p r - 9 8
O c t - 9 8
A p r - 9 9
O c t - 9 9
A p r - 0 0
O c t - 0 0
A p r - 0 1
O c t - 0 1
A p r - 0 2
O c t - 0 2
A p r - 0 3
O c t - 0 3
A p r - 0 4
O c t - 0 4
A p r - 0 5
O c t - 0 5
A p r - 0 6
O c t - 0 6
A p r - 0 7
O c t - 0 7
A p r - 0 8
0
20
40
60
80
100
120
140
C u s h i n g O K C r u d e O i l S p o t P r i c
e ( $ p e r
B a r r e l )
There is a 94% correlation
between Rubber and Oil
prices from Apr 1998 till Sep
2008