Embed Size (px)
Citation preview
proofReading &Understanding
Financial Statements
A Guide toFinancial Reporting
Reading &Understanding
Financial Statements
proof
proof

◆© 1989-2003, 2005-2010 McGladrey & Pullen, LLP
1
proofproof
proofproof
Introduction
Financial statements are an important manage-ment tool. When correctly prepared and properlyinterpreted, they contribute to an understandingof the current financial condition, problems, and possibilities of a company.
This explanation has been prepared to help financial and nonfinancial managers and ownersmake better use of the information in financial statements.
Specifically, this brochure describes five financial statements:
The Balance Sheet, which is sometimesreferred to as the Statement of FinancialCondition or Statement of FinancialPosition.
The Income Statement, which is sometimes referred to as theStatement of Income, Statementof Operations or the Profit andLoss Statement.
The Statement of Cash Flows.
The Statement of Comprehensive Income.
The Statement of Stockholders’ Equity, alsocalled the Statement of Changes in Stockholders’Equity. If the only change in the equity accountsis in retained earnings, this statement may becalled a Statement of Retained Earnings or simplyincluded on the face of the Income Statement.
These statements are prepared and presentedusing technical terms and rules that are becomingincreasingly complex. Interpretation of thesestatements may be a formidable challenge tomany managers and owners.
We firmly believe that — no matter howtechnically correct they are — financial
statements are not useful unless theyare actually used in making business
decisions. When the statements“gather dust” because managersand owners do not understand what
they are saying, we feel an obligationto help. We hope this guide to Reading
and Understanding Financial Statements willhelp you to use financial statements in makingdecisions, monitoring your business, and plan-ning for future growth.
Income StatementSummary of activity
for a period of time
Balance SheetFinancial condition
at a point in time
Balance SheetFinancial condition
at a point in time
proofproof
proofproof
◆2
Reporting ofBusiness Activity
Beginning of YearJanuary 1, 2009
End of YearDecember 31, 2009
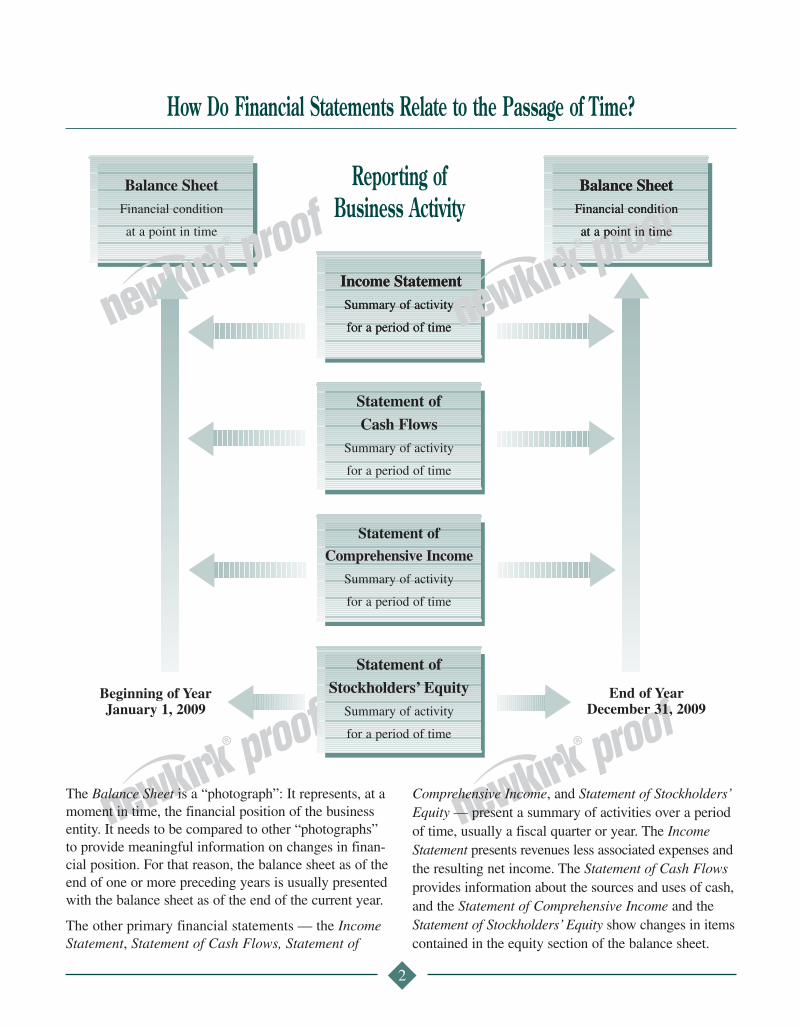
The Balance Sheet is a “photograph”: It represents, at amoment in time, the financial position of the businessentity. It needs to be compared to other “photographs”to provide meaningful information on changes in finan-cial position. For that reason, the balance sheet as of the end of one or more preceding years is usually presentedwith the balance sheet as of the end of the current year.
The other primary financial statements — the IncomeStatement, Statement of Cash Flows, Statement of
Comprehensive Income, and Statement of Stockholders’Equity — present a summary of activities over a periodof time, usually a fiscal quarter or year. The IncomeStatement presents revenues less associated expenses andthe resulting net income. The Statement of Cash Flowsprovides information about the sources and uses of cash,and the Statement of Comprehensive Income and theStatement of Stockholders’ Equity show changes in itemscontained in the equity section of the balance sheet.
How Do Financial Statements Relate to the Passage of Time?
Statement of
Cash FlowsSummary of activity
for a period of time
Statement of
Stockholders’ EquitySummary of activity
for a period of time
Statement of
Comprehensive Income
Summary of activity
for a period of time
Balance SheetFinancial condition
at a point in time
Income StatementSummary of activity
for a period of time

proofproof
proofproof
◆3
The Balance Sheet (or Statement of Financial Position/Condition) is so named because it represents the following equation:
At any point in time this basic equation holds,although the amounts assigned to the individual elements will fluctuate.
Assets increase or decrease as resources are obtained,disposed of, become more or less valuable, or are usedup (expensed) in the course of operations.
Liabilities increase or decrease as obligations to suppliers, lenders, and other creditors are incurred orrepaid. In some cases, the amounts of liabilities needto be estimated (referred to as “accruals”) and are subject to adjustment (upward or downward) in laterperiods. In limited circumstances, recorded liabilitiesare contingent upon the occurrence of future events,and may not be paid in part or full.
Equity increases or decreases as a result of income orloss from operations of the business. It also increaseswhen the owners contribute capital to the business, anddecreases when the capital is withdrawn or dividendsare paid.
The Income Statement (or Statement of Operations) isa summary of revenues and expenses, the latter usuallybroken down (or summarized) by major categories.
Income from operations is an important measure of the entity’s performance, since it represents the pretaxincome earned (or loss incurred) from the core operationsof the business, before considering certain financialcosts, other nonoperating items, and extraordinarygains or losses.
Other income and expense include financial costs (interest expense) and other items that are not directlyrelated to the primary purposes of the business.
Revenue (or sales)– Cost of sales
= Gross profit (or gross margin)– Selling expenses – Administrative expenses
= Income from operations+/– Other income and expense
– Income taxes
= Income before extraordinary items
+/– Extraordinary items
= Net income
OVERVIEW: The Balance Sheet
OVERVIEW: The Income Statement
Assets Liabilities(Resources of = (Amounts owed tothe business) outside creditors)
+
Equity(Capital providedby owners)

proofproof
proofproof
◆4
The Statement of Cash Flows reports the sources anduses of cash for the period, as separated into threemajor classifications:
Operations include the cash effects of essentially all items identified in the Income Statement, such as sales, costs of sales, operating expenses, and extraordinary items.
Investing activities include the purchase of propertyand equipment or the proceeds from their disposition,and also certain transactions involving investments insecurities or other nonoperating assets.
Financing activities include debt borrowings and repayments, as well as the contribution and withdrawalof equity capital, and the payment of dividends toowners.
Cash provided by or used for operations
+/– Cash provided by or used for investing activities
+/– Cash provided by or used for financing activities
= Net increase or decrease in cash
Extraordinary items are defined as those which areunusual and occur infrequently, and include such losses as those from natural disasters and expropria-tion of foreign properties. While not extraordinary per se, certain other items, including the results of discontinued operations and the cumulative effects ofchanges in accounting principles, are also presentedseparately at the bottom of the Income Statement,
where the reader can distinguish them from ongoingresults of operations.
Net income or loss is the all-inclusive “bottom line”that reflects all economic activity by the enterprise forthe period being reported on (year, quarter, month,etc.), except for transactions with owners.
OVERVIEW: The Statement of Cash Flows
The Statement of Comprehensive Income applies tocompanies whose balance sheet equity includes certain items such as foreign currency adjustments,pension liability adjustments, and gains and losses oncertain types of investments. Companies that do not
have these items on their balance sheets will not need to present this statement. Companies that do have these items on their balance sheets may presentthis statement separately or combine it with theStatement of Income.
OVERVIEW: The Statement of Comprehensive Income
The Statement of Stockholders’ Equity details changesin the interests of the company’s owners, includingstock issuances, stock repurchases, stock conversions,dividends paid, other comprehensive income or loss,and net income or loss. A company is required to
disclose all changes in equity accounts and in thenumber of shares outstanding. This can be accom-plished through disclosure in the footnotes, or as isoften the case, in a separate Statement ofStockholders’ Equity.
OVERVIEW: The Statement of Stockholders’ Equity

proofproof
proofproof
◆
In addition to the basic financial statements, mostfinancial statements which have been prepared fordelivery to third parties (i.e., those outside the report-ing entity) will have a section of Notes to FinancialStatements.
The Notes to Financial Statements set forth the majoraccounting principles used in developing the amountsreported in the statements (where a choice was madefrom among alternative generally accepted accountingprinciples or “GAAP”), and also provide additionaldetails about major balances and transactions. Examplesof the latter include details aboutlong-term leases, long- andshort-term debt (includinginterest rates and maturities),transactions with relatedparties, contingentliabilities, andcommitments.
Financial reportsmay also includesupplementaryschedules, which provide more detailed infor-mation about major expense captions (such as administrative expenses)or other items appearing in the basic financialstatements. Except in rare instances, the presentation of supplementary schedules is not required undergenerally accepted accounting principles, but repre-sents a choice made by the preparer of the financialstatements to provide the reader with additional information.
If independent accountants have been associated withthe financial statements, their report will be includedwith the statements. The report will identify what pro-fessional service was provided — an audit, a review,
or a compilation — and indicate what conclusions, ifany, were reached regarding the financial statements.In the case of an audit, the independent accountant will provide positive assurances that the financial state-ments materially “present fairly” the financial position,results of operations, and cash flows of the company inaccordance with generally accepted accounting princi-ples, if it can be concluded that this is the case. If thestatements contain a departure from generally acceptedaccounting principles, or if the audit was subject to ascope limitation, or if there is doubt about the entity’sability to continue as a going concern — these mattersmust also be described in the auditor’s report. In areview engagement, at best the accountant will expressnegative assurance — i.e., that based on performinglimited procedures, nothing came to the accountant’s
attention that would indicate that the financial statements were not fairly presented. An
accountant performing a compilationmerely assists the company in
assembling the financialstatements, and offers
neither positive nor negative assurances
about whether they arepresented fairly. The level
of assurance offered by theindependent accountant on
supplementary schedules may be lower than that offered on the
basic financial statements. Thus,the basic statements may have been
reviewed, and the accountant may have also reviewedthe supplementary information, or alternatively theaccountant may only have compiled the supplementarydata. If the basic financial statements have been audited,the supplementary information may have also beensubjected to audit procedures, or, if not, the accoun-tant’s report will note that the supplementary data have not been audited.
Other Elements of Financial Reports
5
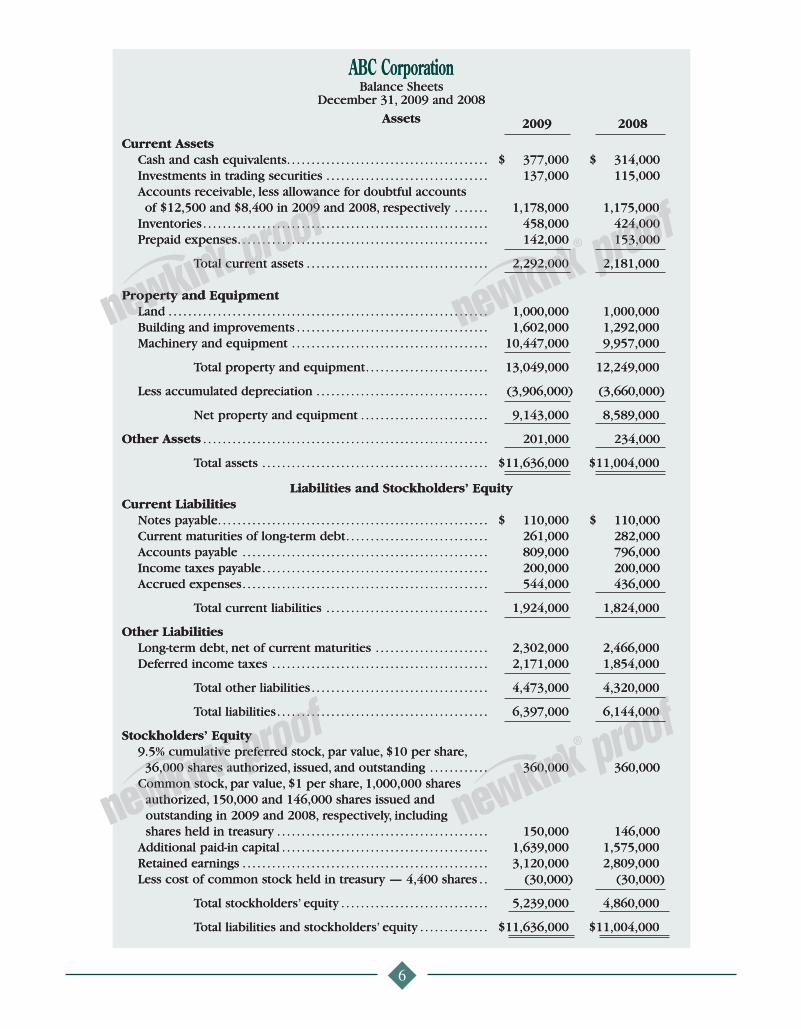
ABC CorporationBalance Sheets
December 31, 2009 and 2008
Assets 2009 2008
Current AssetsCash and cash equivalents. . . . . . . . . . . . . . . . . . . . . . . . . . . . . . . . . . . . . . . . . $ 377,000 $ 314,000Investments in trading securities . . . . . . . . . . . . . . . . . . . . . . . . . . . . . . . . . 137,000 115,000Accounts receivable, less allowance for doubtful accountsof $12,500 and $8,400 in 2009 and 2008, respectively . . . . . . . 1,178,000 1,175,000
Inventories. . . . . . . . . . . . . . . . . . . . . . . . . . . . . . . . . . . . . . . . . . . . . . . . . . . . . . . . . . 458,000 424,000Prepaid expenses. . . . . . . . . . . . . . . . . . . . . . . . . . . . . . . . . . . . . . . . . . . . . . . . . . . 142,000 153,000
Total current assets . . . . . . . . . . . . . . . . . . . . . . . . . . . . . . . . . . . . . 2,292,000 2,181,000
Property and EquipmentLand . . . . . . . . . . . . . . . . . . . . . . . . . . . . . . . . . . . . . . . . . . . . . . . . . . . . . . . . . . . . . . . . . 1,000,000 1,000,000Building and improvements . . . . . . . . . . . . . . . . . . . . . . . . . . . . . . . . . . . . . . . 1,602,000 1,292,000Machinery and equipment . . . . . . . . . . . . . . . . . . . . . . . . . . . . . . . . . . . . . . . . 10,447,000 9,957,000
Total property and equipment. . . . . . . . . . . . . . . . . . . . . . . . . 13,049,000 12,249,000
Less accumulated depreciation . . . . . . . . . . . . . . . . . . . . . . . . . . . . . . . . . . . (3,906,000) (3,660,000)
Net property and equipment . . . . . . . . . . . . . . . . . . . . . . . . . . 9,143,000 8,589,000
Other Assets . . . . . . . . . . . . . . . . . . . . . . . . . . . . . . . . . . . . . . . . . . . . . . . . . . . . . . . . . . 201,000 234,000
Total assets . . . . . . . . . . . . . . . . . . . . . . . . . . . . . . . . . . . . . . . . . . . . . . $11,636,000 $11,004,000
Liabilities and Stockholders’ EquityCurrent Liabilities
Notes payable. . . . . . . . . . . . . . . . . . . . . . . . . . . . . . . . . . . . . . . . . . . . . . . . . . . . . . . $ 110,000 $ 110,000Current maturities of long-term debt. . . . . . . . . . . . . . . . . . . . . . . . . . . . . 261,000 282,000Accounts payable . . . . . . . . . . . . . . . . . . . . . . . . . . . . . . . . . . . . . . . . . . . . . . . . . . 809,000 796,000Income taxes payable. . . . . . . . . . . . . . . . . . . . . . . . . . . . . . . . . . . . . . . . . . . . . . 200,000 200,000Accrued expenses. . . . . . . . . . . . . . . . . . . . . . . . . . . . . . . . . . . . . . . . . . . . . . . . . . 544,000 436,000
Total current liabilities . . . . . . . . . . . . . . . . . . . . . . . . . . . . . . . . . 1,924,000 1,824,000
Other LiabilitiesLong-term debt, net of current maturities . . . . . . . . . . . . . . . . . . . . . . . 2,302,000 2,466,000Deferred income taxes . . . . . . . . . . . . . . . . . . . . . . . . . . . . . . . . . . . . . . . . . . . . 2,171,000 1,854,000
Total other liabilities . . . . . . . . . . . . . . . . . . . . . . . . . . . . . . . . . . . . 4,473,000 4,320,000
Total liabilities. . . . . . . . . . . . . . . . . . . . . . . . . . . . . . . . . . . . . . . . . . . 6,397,000 6,144,000
Stockholders’ Equity9.5% cumulative preferred stock, par value, $10 per share,36,000 shares authorized, issued, and outstanding . . . . . . . . . . . . 360,000 360,000
Common stock, par value, $1 per share, 1,000,000 shares authorized, 150,000 and 146,000 shares issued and outstanding in 2009 and 2008, respectively, including shares held in treasury . . . . . . . . . . . . . . . . . . . . . . . . . . . . . . . . . . . . . . . . . . . 150,000 146,000
Additional paid-in capital . . . . . . . . . . . . . . . . . . . . . . . . . . . . . . . . . . . . . . . . . . 1,639,000 1,575,000Retained earnings . . . . . . . . . . . . . . . . . . . . . . . . . . . . . . . . . . . . . . . . . . . . . . . . . . 3,120,000 2,809,000Less cost of common stock held in treasury — 4,400 shares . . (30,000) (30,000)
Total stockholders’ equity . . . . . . . . . . . . . . . . . . . . . . . . . . . . . . 5,239,000 4,860,000
Total liabilities and stockholders’ equity . . . . . . . . . . . . . . $11,636,000 $11,004,000
proofproof
proofproof
◆6
ABC CorporationBalance Sheets
December 31, 2009 and 2008
Assets 2009 2008
Current AssetsCash and cash equivalents. . . . . . . . . . . . . . . . . . . . . . . . . . . . . . . . . . . . . . . . . $ 377,000 $ 314,000Investments in trading securities . . . . . . . . . . . . . . . . . . . . . . . . . . . . . . . . . 137,000 115,000Accounts receivable, less allowance for doubtful accountsof $12,500 and $8,400 in 2009 and 2008, respectively . . . . . . . 1,178,000 1,175,000
Inventories. . . . . . . . . . . . . . . . . . . . . . . . . . . . . . . . . . . . . . . . . . . . . . . . . . . . . . . . . . 458,000 424,000Prepaid expenses. . . . . . . . . . . . . . . . . . . . . . . . . . . . . . . . . . . . . . . . . . . . . . . . . . . 142,000 153,000
Total current assets . . . . . . . . . . . . . . . . . . . . . . . . . . . . . . . . . . . . . 2,292,000 2,181,000
Property and EquipmentLand . . . . . . . . . . . . . . . . . . . . . . . . . . . . . . . . . . . . . . . . . . . . . . . . . . . . . . . . . . . . . . . . . 1,000,000 1,000,000Building and improvements . . . . . . . . . . . . . . . . . . . . . . . . . . . . . . . . . . . . . . . 1,602,000 1,292,000Machinery and equipment . . . . . . . . . . . . . . . . . . . . . . . . . . . . . . . . . . . . . . . . 10,447,000 9,957,000
Total property and equipment. . . . . . . . . . . . . . . . . . . . . . . . . 13,049,000 12,249,000
Less accumulated depreciation . . . . . . . . . . . . . . . . . . . . . . . . . . . . . . . . . . . (3,906,000) (3,660,000)
Net property and equipment . . . . . . . . . . . . . . . . . . . . . . . . . . 9,143,000 8,589,000
Other Assets . . . . . . . . . . . . . . . . . . . . . . . . . . . . . . . . . . . . . . . . . . . . . . . . . . . . . . . . . . 201,000 234,000
Total assets . . . . . . . . . . . . . . . . . . . . . . . . . . . . . . . . . . . . . . . . . . . . . . $11,636,000 $11,004,000
Liabilities and Stockholders’ EquityCurrent Liabilities
Notes payable. . . . . . . . . . . . . . . . . . . . . . . . . . . . . . . . . . . . . . . . . . . . . . . . . . . . . . . $ 110,000 $ 110,000Current maturities of long-term debt. . . . . . . . . . . . . . . . . . . . . . . . . . . . . 261,000 282,000Accounts payable . . . . . . . . . . . . . . . . . . . . . . . . . . . . . . . . . . . . . . . . . . . . . . . . . . 809,000 796,000Income taxes payable. . . . . . . . . . . . . . . . . . . . . . . . . . . . . . . . . . . . . . . . . . . . . . 200,000 200,000Accrued expenses. . . . . . . . . . . . . . . . . . . . . . . . . . . . . . . . . . . . . . . . . . . . . . . . . . 544,000 436,000
Total current liabilities . . . . . . . . . . . . . . . . . . . . . . . . . . . . . . . . . 1,924,000 1,824,000
Other LiabilitiesLong-term debt, net of current maturities . . . . . . . . . . . . . . . . . . . . . . . 2,302,000 2,466,000Deferred income taxes . . . . . . . . . . . . . . . . . . . . . . . . . . . . . . . . . . . . . . . . . . . . 2,171,000 1,854,000
Total other liabilities . . . . . . . . . . . . . . . . . . . . . . . . . . . . . . . . . . . . 4,473,000 4,320,000
Total liabilities. . . . . . . . . . . . . . . . . . . . . . . . . . . . . . . . . . . . . . . . . . . 6,397,000 6,144,000
Stockholders’ Equity9.5% cumulative preferred stock, par value, $10 per share,36,000 shares authorized, issued, and outstanding . . . . . . . . . . . . 360,000 360,000
Common stock, par value, $1 per share, 1,000,000 shares authorized, 150,000 and 146,000 shares issued and outstanding in 2009 and 2008, respectively, including shares held in treasury . . . . . . . . . . . . . . . . . . . . . . . . . . . . . . . . . . . . . . . . . . . 150,000 146,000
Additional paid-in capital . . . . . . . . . . . . . . . . . . . . . . . . . . . . . . . . . . . . . . . . . . 1,639,000 1,575,000Retained earnings . . . . . . . . . . . . . . . . . . . . . . . . . . . . . . . . . . . . . . . . . . . . . . . . . . 3,120,000 2,809,000Less cost of common stock held in treasury — 4,400 shares . . (30,000) (30,000)
Total stockholders’ equity . . . . . . . . . . . . . . . . . . . . . . . . . . . . . . 5,239,000 4,860,000
Total liabilities and stockholders’ equity . . . . . . . . . . . . . . $11,636,000 $11,004,000
proofproof
proofproof
◆
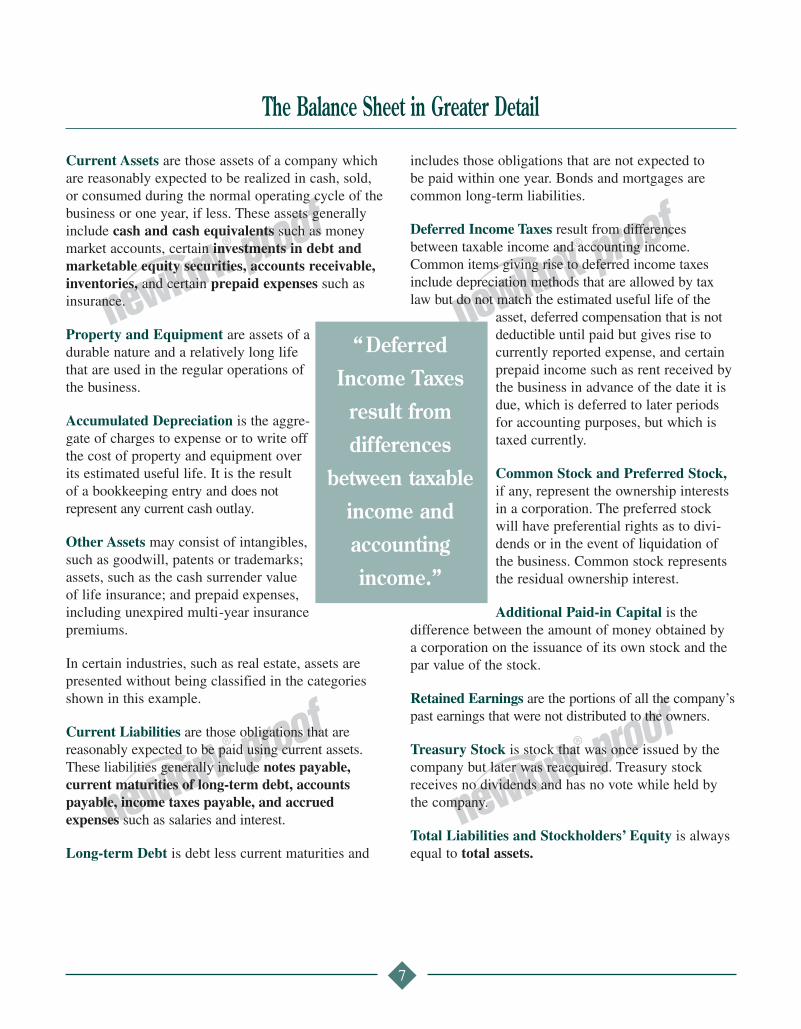
Current Assets are those assets of a company whichare reasonably expected to be realized in cash, sold,or consumed during the normal operating cycle of thebusiness or one year, if less. These assets generallyinclude cash and cash equivalents such as moneymarket accounts, certain investments in debt andmarketable equity securities, accounts receivable,inventories, and certain prepaid expenses such asinsurance.
Property and Equipment are assets of adurable nature and a relatively long lifethat are used in the regular operations ofthe business.
Accumulated Depreciation is the aggre-gate of charges to expense or to write offthe cost of property and equipment overits estimated useful life. It is the result of a bookkeeping entry and does not represent any current cash outlay.
Other Assets may consist of intangibles,such as goodwill, patents or trademarks;assets, such as the cash surrender valueof life insurance; and prepaid expenses,including unexpired multi-year insurancepremiums.
In certain industries, such as real estate, assets are presented without being classified in the categoriesshown in this example.
Current Liabilities are those obligations that are reasonably expected to be paid using current assets.These liabilities generally include notes payable,current maturities of long-term debt, accountspayable, income taxes payable, and accrued expenses such as salaries and interest.
Long-term Debt is debt less current maturities and
includes those obligations that are not expected to be paid within one year. Bonds and mortgages arecommon long-term liabilities.
Deferred Income Taxes result from differencesbetween taxable income and accounting income.Common items giving rise to deferred income taxesinclude depreciation methods that are allowed by taxlaw but do not match the estimated useful life of the
asset, deferred compensation that is notdeductible until paid but gives rise tocurrently reported expense, and certainprepaid income such as rent received bythe business in advance of the date it isdue, which is deferred to later periodsfor accounting purposes, but which istaxed currently.
Common Stock and Preferred Stock,if any, represent the ownership interestsin a corporation. The preferred stockwill have preferential rights as to divi-dends or in the event of liquidation ofthe business. Common stock representsthe residual ownership interest.
Additional Paid-in Capital is the difference between the amount of money obtained by a corporation on the issuance of its own stock and thepar value of the stock.
Retained Earnings are the portions of all the company’spast earnings that were not distributed to the owners.
Treasury Stock is stock that was once issued by thecompany but later was reacquired. Treasury stockreceives no dividends and has no vote while held bythe company.
Total Liabilities and Stockholders’ Equity is alwaysequal to total assets.
“DeferredIncome Taxesresult from differences
between taxableincome andaccountingincome.”
The Balance Sheet in Greater Detail
7
proofproof
proofproof
◆8
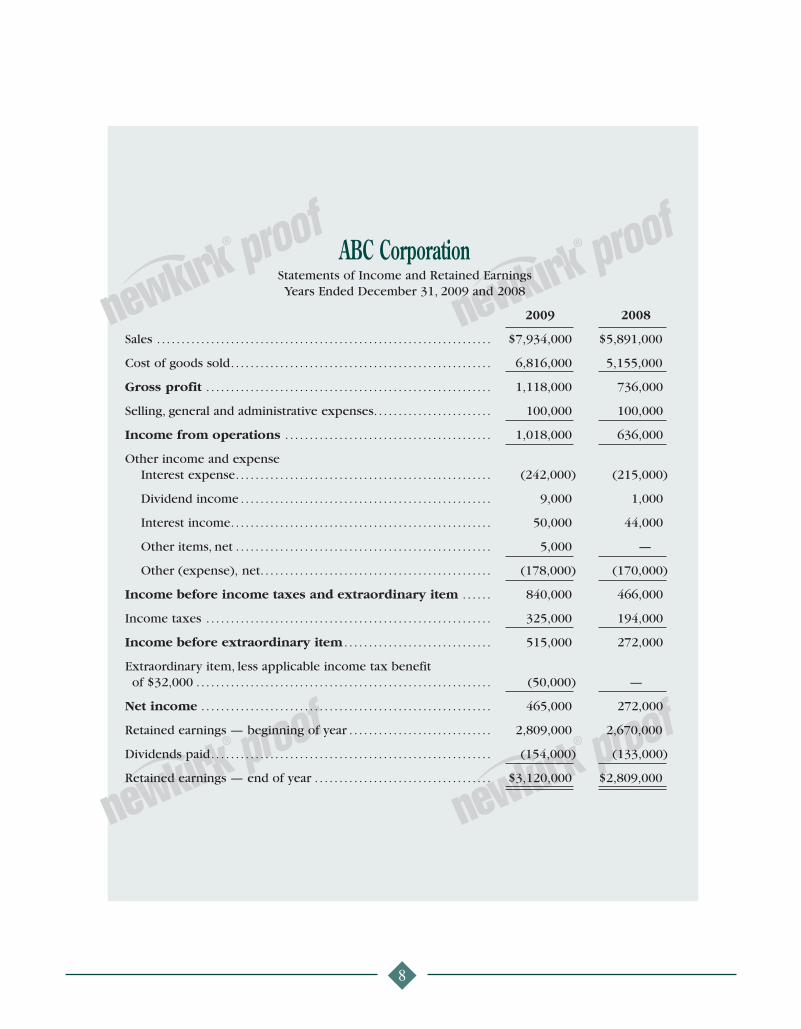
ABC CorporationStatements of Income and Retained EarningsYears Ended December 31, 2009 and 2008
2009 2008
Sales . . . . . . . . . . . . . . . . . . . . . . . . . . . . . . . . . . . . . . . . . . . . . . . . . . . . . . . . . . . . . . . . . . . . $7,934,000 $5,891,000
Cost of goods sold. . . . . . . . . . . . . . . . . . . . . . . . . . . . . . . . . . . . . . . . . . . . . . . . . . . . . 6,816,000 5,155,000
Gross profit . . . . . . . . . . . . . . . . . . . . . . . . . . . . . . . . . . . . . . . . . . . . . . . . . . . . . . . . . . 1,118,000 736,000
Selling, general and administrative expenses. . . . . . . . . . . . . . . . . . . . . . . . 100,000 100,000
Income from operations . . . . . . . . . . . . . . . . . . . . . . . . . . . . . . . . . . . . . . . . . . 1,018,000 636,000
Other income and expenseInterest expense. . . . . . . . . . . . . . . . . . . . . . . . . . . . . . . . . . . . . . . . . . . . . . . . . . . . (242,000) (215,000)
Dividend income . . . . . . . . . . . . . . . . . . . . . . . . . . . . . . . . . . . . . . . . . . . . . . . . . . . 9,000 1,000
Interest income. . . . . . . . . . . . . . . . . . . . . . . . . . . . . . . . . . . . . . . . . . . . . . . . . . . . . 50,000 44,000
Other items, net . . . . . . . . . . . . . . . . . . . . . . . . . . . . . . . . . . . . . . . . . . . . . . . . . . . . 5,000 —
Other (expense), net. . . . . . . . . . . . . . . . . . . . . . . . . . . . . . . . . . . . . . . . . . . . . . . (178,000) (170,000)
Income before income taxes and extraordinary item . . . . . . 840,000 466,000
Income taxes . . . . . . . . . . . . . . . . . . . . . . . . . . . . . . . . . . . . . . . . . . . . . . . . . . . . . . . . . . 325,000 194,000
Income before extraordinary item . . . . . . . . . . . . . . . . . . . . . . . . . . . . . . 515,000 272,000
Extraordinary item, less applicable income tax benefitof $32,000 . . . . . . . . . . . . . . . . . . . . . . . . . . . . . . . . . . . . . . . . . . . . . . . . . . . . . . . . . . . . (50,000) —
Net income . . . . . . . . . . . . . . . . . . . . . . . . . . . . . . . . . . . . . . . . . . . . . . . . . . . . . . . . . . . 465,000 272,000
Retained earnings — beginning of year . . . . . . . . . . . . . . . . . . . . . . . . . . . . . 2,809,000 2,670,000
Dividends paid. . . . . . . . . . . . . . . . . . . . . . . . . . . . . . . . . . . . . . . . . . . . . . . . . . . . . . . . . (154,000) (133,000)
Retained earnings — end of year . . . . . . . . . . . . . . . . . . . . . . . . . . . . . . . . . . . . $3,120,000 $2,809,000

proofproof
proofproof
◆9
Sales result when a company provides customers thoseproducts or services that it is in business to sell.
Cost of Goods Sold represents the cost of producinggoods for sale. For example, cost of goods sold in amanufacturing company is comprised of direct labor,direct materials, and overhead.
Gross Profit is a measure of the profitcontribution from the sales of productsand/or services, before consideringadministrative overhead.
Selling, General and AdministrativeExpenses are costs associated with the saleand delivery of products and the general costs associated with the operation and management of a business, other than thosecharged to cost of goods sold.
Income from Operations is another measure of profitability, equal to gross profit less selling, general and administrativecosts.
Other Income and Expense arise from transactions notrelated directly to the primary operations of the business.Items frequently reported in this nonoperating categoryare dividend income, interest income, and certain gains or losses.
Interest Expense refers to interest paid periodically during the term of a loan by a borrower to the lender for the use of
money. Interest expense must be separatelystated, usually as a subcategory of other
income and expense.
Income Taxes is an estimate of the amount ofincome tax that will eventually be paid, or hasbeen paid, on the reported earnings.
Extraordinary Items are income or losses of an unusual and infrequent nature.
Net Income is the “bottom line” measure of the earnings performance of the companyfor the period reported on, after consideringall elements of income and expense.
The Income Statement in Greater Detail

ABC CorporationStatements of Cash Flows
Years Ended December 31, 2009 and 2008
2009 2008
Cash Provided by (Used for) Operating ActivitiesNet income . . . . . . . . . . . . . . . . . . . . . . . . . . . . . . . . . . . . . . . . . . . . . . . . . . . . . . . . . $ 465,000 $ 272,000Adjustments to reconcile net income to net cash providedby operating activitiesDepreciation and amortization. . . . . . . . . . . . . . . . . . . . . . . . . . . . . . . . . 479,000 300,000Deferred income taxes. . . . . . . . . . . . . . . . . . . . . . . . . . . . . . . . . . . . . . . . . . 317,000 69,000Gain on sale of property and equipment . . . . . . . . . . . . . . . . . . . . . (28,000) (59,000)Changes in operating assets and liabilitiesAccounts receivable . . . . . . . . . . . . . . . . . . . . . . . . . . . . . . . . . . . . . . . . . . . (3,000) (64,000)Inventories . . . . . . . . . . . . . . . . . . . . . . . . . . . . . . . . . . . . . . . . . . . . . . . . . . . . . (34,000) 129,000Prepaid expenses . . . . . . . . . . . . . . . . . . . . . . . . . . . . . . . . . . . . . . . . . . . . . . 11,000 32,000Accounts payable . . . . . . . . . . . . . . . . . . . . . . . . . . . . . . . . . . . . . . . . . . . . . . 13,000 22,000Accrued expenses . . . . . . . . . . . . . . . . . . . . . . . . . . . . . . . . . . . . . . . . . . . . . 108,000 (110,000)
Net cash provided by operating activities . . . . . . . . . . . . 1,328,000 591,000
Cash Provided by (Used for) Investing ActivitiesPurchase of property and equipment . . . . . . . . . . . . . . . . . . . . . . . . . . . . (1,010,000) (1,430,000)Proceeds from disposal of property and equipment. . . . . . . . . . . . 38,000 7,000Purchase of investments . . . . . . . . . . . . . . . . . . . . . . . . . . . . . . . . . . . . . . . . . . . (22,000) —
Net cash used for investing activities . . . . . . . . . . . . . . . . . (994,000) (1,423,000)
Cash Provided by (Used for) Financing ActivitiesAdditional long-term debt . . . . . . . . . . . . . . . . . . . . . . . . . . . . . . . . . . . . . . . . . 137,000 863,000Retirement of long-term debt . . . . . . . . . . . . . . . . . . . . . . . . . . . . . . . . . . . . . (322,000) (560,000)Issuance of common stock . . . . . . . . . . . . . . . . . . . . . . . . . . . . . . . . . . . . . . . . 68,000 466,000Purchase of treasury stock . . . . . . . . . . . . . . . . . . . . . . . . . . . . . . . . . . . . . . . . — (18,000)Dividends paid . . . . . . . . . . . . . . . . . . . . . . . . . . . . . . . . . . . . . . . . . . . . . . . . . . . . . (154,000) (133,000)
Net cash provided by (used for) financing activities . . . . . . . . . . . . . . . . . . . . . . . . . . . . . . . . . . . . (271,000) 618,000
Increase (decrease) in cash and cash equivalents . . . . . . . . . . . . . . . . . . 63,000 (214,000)
Cash and cash equivalents, beginning of year . . . . . . . . . . . . . . . . 314,000 528,000
Cash and cash equivalents, end of year . . . . . . . . . . . . . . . . . . . . . . . . $ 377,000 $ 314,000
proofproof
proofproof
◆10
ABC CorporationStatements of Cash Flows
Years Ended December 31, 2009 and 2008
2009 2008
Cash Provided by (Used for) Operating ActivitiesNet income . . . . . . . . . . . . . . . . . . . . . . . . . . . . . . . . . . . . . . . . . . . . . . . . . . . . . . . . . $ 465,000 $ 272,000Adjustments to reconcile net income to net cash providedby operating activitiesDepreciation and amortization. . . . . . . . . . . . . . . . . . . . . . . . . . . . . . . . . 479,000 300,000Deferred income taxes. . . . . . . . . . . . . . . . . . . . . . . . . . . . . . . . . . . . . . . . . . 317,000 69,000Gain on sale of property and equipment . . . . . . . . . . . . . . . . . . . . . (28,000) (59,000)Changes in operating assets and liabilitiesAccounts receivable . . . . . . . . . . . . . . . . . . . . . . . . . . . . . . . . . . . . . . . . . . . (3,000) (64,000)Inventories . . . . . . . . . . . . . . . . . . . . . . . . . . . . . . . . . . . . . . . . . . . . . . . . . . . . . (34,000) 129,000Prepaid expenses . . . . . . . . . . . . . . . . . . . . . . . . . . . . . . . . . . . . . . . . . . . . . . 11,000 32,000Accounts payable . . . . . . . . . . . . . . . . . . . . . . . . . . . . . . . . . . . . . . . . . . . . . . 13,000 22,000Accrued expenses . . . . . . . . . . . . . . . . . . . . . . . . . . . . . . . . . . . . . . . . . . . . . 108,000 (110,000)
Net cash provided by operating activities . . . . . . . . . . . . 1,328,000 591,000
Cash Provided by (Used for) Investing ActivitiesPurchase of property and equipment . . . . . . . . . . . . . . . . . . . . . . . . . . . . (1,010,000) (1,430,000)Proceeds from disposal of property and equipment. . . . . . . . . . . . 38,000 7,000Purchase of investments . . . . . . . . . . . . . . . . . . . . . . . . . . . . . . . . . . . . . . . . . . . (22,000) —
Net cash used for investing activities . . . . . . . . . . . . . . . . . (994,000) (1,423,000)
Cash Provided by (Used for) Financing ActivitiesAdditional long-term debt . . . . . . . . . . . . . . . . . . . . . . . . . . . . . . . . . . . . . . . . . 137,000 863,000Retirement of long-term debt . . . . . . . . . . . . . . . . . . . . . . . . . . . . . . . . . . . . . (322,000) (560,000)Issuance of common stock . . . . . . . . . . . . . . . . . . . . . . . . . . . . . . . . . . . . . . . . 68,000 466,000Purchase of treasury stock . . . . . . . . . . . . . . . . . . . . . . . . . . . . . . . . . . . . . . . . — (18,000)Dividends paid . . . . . . . . . . . . . . . . . . . . . . . . . . . . . . . . . . . . . . . . . . . . . . . . . . . . . (154,000) (133,000)
Net cash provided by (used for) financing activities . . . . . . . . . . . . . . . . . . . . . . . . . . . . . . . . . . . . (271,000) 618,000
Increase (decrease) in cash and cash equivalents . . . . . . . . . . . . . . . . . . 63,000 (214,000)
Cash and cash equivalents, beginning of year . . . . . . . . . . . . . . . . 314,000 528,000
Cash and cash equivalents, end of year . . . . . . . . . . . . . . . . . . . . . . . . $ 377,000 $ 314,000

proofproof
proofproof
◆11
Operating Activities include all transactions and otherevents that are the result of delivering or producinggoods for sale and providing services.
Cash inflows from operating activities include cashreceipts from the sale of goods or services and frominterest and dividend income. Cash outflows for oper-ating activities include cash payments for the purchaseof inventory, wages and benefits to employees, to government taxing bodies, as interest tolending institutions, and to various othersuppliers.
Investing Activities include lendingmoney and collecting on those loans,acquiring and selling investment securi-ties, and acquiring and selling produc-tive assets such as land and equipment.
Cash inflows from investing activitiesinclude principal repayments from bor-rowers, proceeds from sales of loansand receipts from sales of assets such as investment securities or property andequipment. Cash outflows for investingactivities include loans made, loans purchased, and payments to acquire assets such asinvestment securities or property and equipment.
Financing Activities include obtaining resources fromowners, providing owners with a return on (of) their
investment, obtaining resources from lenders, andrepaying amounts borrowed. Interest on borrowings,however, is an operating activity.
Cash inflows from financing activities include pro-ceeds from the issuance of the company’s stock andfrom long- and short-term borrowings. Cash outflowsfor financing activities include payment of dividends,cash paid to reacquire the company’s stock, and repay-
ment of amounts borrowed.
The form of the cash flow statementillustrated on page 10 is the so-called“indirect method” favored by mostcompanies. However, an alternative format, the “direct method” is alsoacceptable. Under that approach, theCash Provided by (Used for) OperatingActivities section will list each majorsource or use of cash which correspondsto major captions in the income statement.For example, corresponding to sales willbe the cash flow statement caption “CashCollected from Customers”; correspond-ing to cost of sales will be “Cash Paidto Suppliers”; etc. If the direct method
is used, the cash flow statement (or a supplementaryschedule) will present the reconciliation between netincome and cash from operations — which will closelyresemble the cash from operations section of the state-ment illustrated on page 10.
“Cash outflowsfor investing
activities includeloans made,
loans purchased . . . .”
The Statement of Cash Flows in Greater Detail
The Statement of Comprehensive IncomeCertain companies present the Statement of Compre-hensive Income. This statement is only presented whenthe equity section of the company’s balance sheet contains adjustments relating to pensions, foreign currencies, or certain types of investments. The changesin these items from period to period, instead of beingreflected on the income statement as part of net income,are reflected directly on the balance sheet. TheStatement of Comprehensive Income simply reconcilesthe change in these items for the periods presented.
There are a variety of ways that this information canbe presented. It can be simply added to the bottom of the income statement (which would be retitled theStatement of Income and Comprehensive Income),shown as a separate statement, or shown in a statementreconciling all changes in the equity section of the balance sheet which would be titled the Statement ofStockholders’ Equity.

proofproof
proofproof
◆12
Although the basic financial statements — discussed in the preceding sections — do present the company’sfinancial position, results of operations, and cash flows,there are other important disclosures, both mandatoryand voluntary, that cannot be incorporated on the faceof the statements. For this reason, most complete setsof financial statements will include a section of notesafter the basic statements. (These are sometimes stillcalled “footnotes,” a term that is a holdover from asimpler era when these disclosures were actuallypresented at the bottom of the financial statements.)
Certain notes are always found in GAAP financialstatements. For example, the “summary of significantaccounting policies,” usually the first note, identifieswhich among equally acceptable GAAP the companyhas elected to use (e.g., straight line versus accelerateddepreciation; LIFO versus FIFO inventory costing, etc.).Other notes will only be presented when conditionswarrant (e.g., details of debt maturities, capital leaseobligations, related party transactions, major customers,etc.). Finally, some disclosures will appear becausemanagement believes they give useful insight into thecompany’s economic prospects (e.g., details of long-term contracts with customers, summary of key ratios,financial highlights).
Notes are considered to be an integral part of the basicfinancial statements. Thus, standards for accuracy andclarity apply equally to the notes, and the independentaccountant must apply the same level of service (audit,review, or compilation) to the notes as to the basicfinancial statements themselves. If well-written andorganized, notes should help the user to better under-stand the financial statements and the reporting entity’sfinancial and operating prospects. However, because of the substantial amount of detail they often contain,the notes do require a careful study by the reader.
Many financial statements also contain a section ofsupplementary information. Usually this information is in the nature of additional detail (e.g., the elementscomprising “selling expenses”), although sometimes it is a recasting of the basic financial statements on analternative basis of accounting (such as FIFO inven-tory costing when the basic statements were preparedusing the LIFO basis). Supplementary informationmay have received the same level of attention from theindependent accountant as the basic statements andnotes, or it might have a lesser degree of assuranceassociated with it. In either case, the accountants’report letter(s) will indicate the responsibility theyassume, if any.
Notes to Financial Statements and Supplementary Schedules
The Statement of Stockholders’ Equity
When both a balance sheet and income statement arepresented, disclosure of all changes in equity accountsand in the number of shares outstanding during at least the most recent annual fiscal period presented isrequired. There are a number of ways this informationcan be presented. Disclosure of these changes may be made in a separate statement, called the Statementof Stockholders’ Equity, or may be made in the basicfinancial statements or notes thereto. Companies fre-quently choose to provide a Statement of Stockholders’Equity with their other financial statements.
The purpose of the Statement of Stockholders’ Equity isto report the events that caused individual stockholders’
equity accounts to change during the accounting period.Accordingly, the Statement of Stockholders’ Equity isdated like the income statement. It covers a period oftime. The Statement of Stockholders’ Equity summa-rizes the changes in the various components of thestockholders’ equity section of the balance sheet. Inmany cases the specific events that caused the changein one or more stockholders’ equity accounts are ofinterest to the financial statement user. The Statementof Stockholders’ Equity includes stock issuances, stockrepurchases, stock conversions, dividends paid, andother comprehensive income or loss components whichmay be important and useful information to manyreaders of the financial statements.
◆13
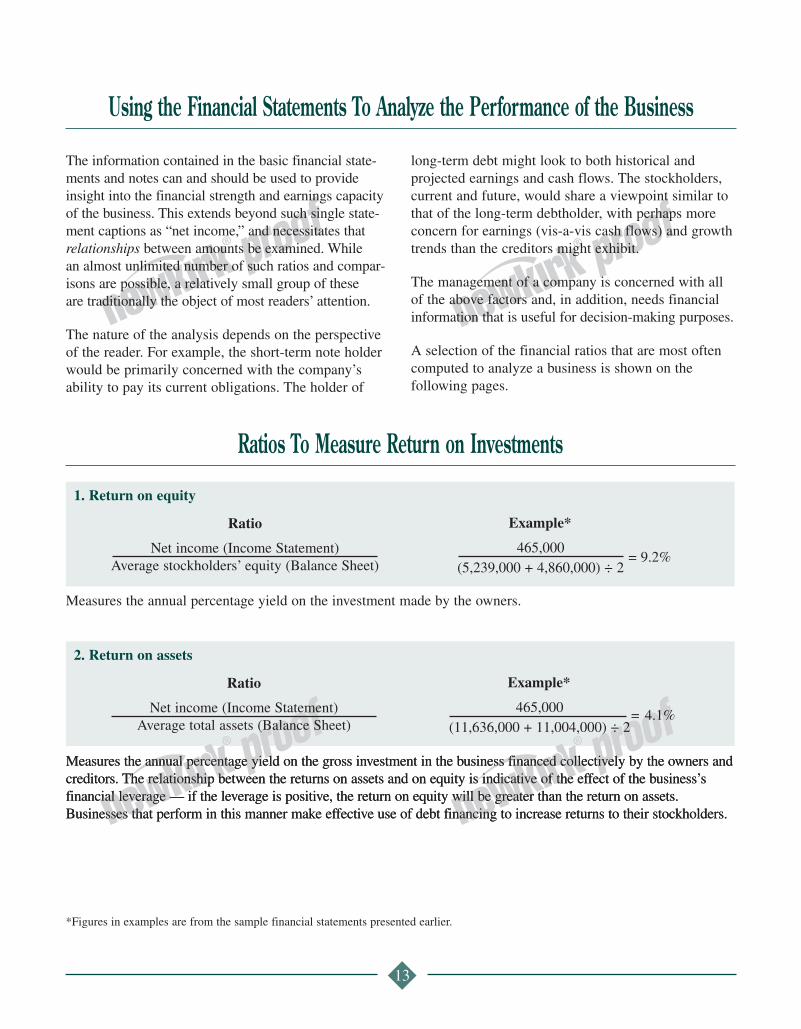
Ratios To Measure Return on Investments
Measures the annual percentage yield on the investment made by the owners.
Measures the annual percentage yield on the gross investment in the business financed collectively by the owners andcreditors. The relationship between the returns on assets and on equity is indicative of the effect of the business’sfinancial leverage — if the leverage is positive, the return on equity will be greater than the return on assets.Businesses that perform in this manner make effective use of debt financing to increase returns to their stockholders.
1. Return on equity
Net income (Income Statement)Average stockholders’ equity (Balance Sheet)
465,000(5,239,000 + 4,860,000) ÷ 2
Ratio Example*
= 9.2%
2. Return on assets
Ratio Example*
Using the Financial Statements To Analyze the Performance of the Business
*Figures in examples are from the sample financial statements presented earlier.
proofproof
proofproof
The information contained in the basic financial state-ments and notes can and should be used to provideinsight into the financial strength and earnings capacityof the business. This extends beyond such single state-ment captions as “net income,” and necessitates thatrelationships between amounts be examined. While an almost unlimited number of such ratios and compar-isons are possible, a relatively small group of these are traditionally the object of most readers’ attention.
The nature of the analysis depends on the perspectiveof the reader. For example, the short-term note holderwould be primarily concerned with the company’sability to pay its current obligations. The holder of
long-term debt might look to both historical and projected earnings and cash flows. The stockholders,current and future, would share a viewpoint similar tothat of the long-term debtholder, with perhaps moreconcern for earnings (vis-a-vis cash flows) and growthtrends than the creditors might exhibit.
The management of a company is concerned with allof the above factors and, in addition, needs financialinformation that is useful for decision-making purposes.
A selection of the financial ratios that are most oftencomputed to analyze a business is shown on the following pages.
Measures the annual percentage yield on the gross investment in the business financed collectively by the owners andcreditors. The relationship between the returns on assets and on equity is indicative of the effect of the business’sfinancial leverage — if the leverage is positive, the return on equity will be greater than the return on assets.Businesses that perform in this manner make effective use of debt financing to increase returns to their stockholders.
Net income (Income Statement)Average total assets (Balance Sheet)
= 4.1%465,000(11,636,000 + 11,004,000) ÷ 2

◆14
Ratios To Measure Safety and Liquidity
1. Net working capital
–
Example*
Current assets (Balance Sheet)Current liabilities (Balance Sheet)
$2,292,000$1,924,000
Ratio Example*
= 1.19:1
3. Liabilities to equity ratio**
Total liabilities (Balance Sheet)Stockholders’ equity (Balance Sheet)
$6,397,000$5,239,000
Ratio Example*
= 1.22:1
4. Times interest earned
Income before interest and taxes (Income Statement)Interest expense (Income Statement)
$840,000 + 242,000$242,000
Ratio
= 4.5 times
Example*
= 1.9 times
*Figures in examples are from the sample financial statements presented earlier.**Many analysts refer to this ratio as the “debt to equity ratio” even though, technically, the term “debt” normally refers to loans made tothe company and excludes other liabilities.
Another measure of the ability to pay current liabilities as they mature. A ratio of 1:1 or greater corresponds topositive net working capital.
Indicates the mix of funding provided by owners (common and preferred stockholders) and creditors. The greaterthe number, the “more leveraged” is the company.
Measures the company’s ability to pay both the interest and the current principal installments on its outstandingdebt and suggests the degree of safety for creditors concerning currently due debt service obligations.
proofproof
proofproof
A measure of the shorter-term, more liquid assets available to meet short-term obligations and serve as a cushionagainst unforeseen needs for resources.
$2,292,000–1,924,000$ 368,000
2. Current ratio
5. Debt service ratio
Income before interest and taxes (Income Statement)Interest expense plus amounts of scheduled debt repay-ments (Income Statement and Statement of Cash Flows)
$840,000 + 242,000$242,000 + 322,000
Ratio Example*
Measures the ability of a company to cover the payment of interest to creditors.
Current assets (Balance Sheet)Current liabilities (Balance Sheet)

proofproof
proofproof
◆15
1. Average collection period
Average accounts receivable (Balance Sheet)Average daily sales (Income Statement)
(1,178,000 + 1,175,000) ÷ 27,934,000 ÷ 365
Ratio Example*
Ratios To Measure Operating Efficiency
1,176,50021,737
= = 54.1 days
Measures the average number of days’ sales that are uncollected in accounts receivable, providing an idea of howsuccessful the firm is in collecting amounts due from its customers.
2. Receivables turnover
Total sales (Income Statement)Average accounts receivable (Balance Sheet)
7,934,000(1,178,000 + 1,175,000) ÷ 2
Ratio Example*
= 6.7 times
An alternative, but equivalent, measure of the efficiency of the company’s receivable collection efforts. If thecompany also makes sales for cash, “total credit sales” should be substituted for “total sales.”
3. Number of days’ sales in inventory
Average inventory (Balance Sheet)Average daily cost of sales (Income Statement)
(458,000 + 424,000) ÷ 26,816,000 ÷ 365
Ratio Example*
= 23.6 days441,00018,674
=
4. Inventory turnover
Cost of goods sold (Income Statement)Average inventory (Balance Sheet)
6,816,000(458,000 + 424,000) ÷ 2
Ratio Example*
= 15.5 times
An indicator of the amount of inventory maintained relative to the average number of days’ shipments that wouldbe filled. This measure can be used to assess the efficiency of the company’s distribution system.
An alternative measure of how quickly inventory is sold and how efficiently it is managed.
*Figures in examples are from the sample financial statements presented earlier.
◆ RUF 1/1016
proof
proof
SUMMARY
Financial analysis involves many different
approaches; the ratio analysis presented on the
preceding pages is only one of several means of
gaining an understanding about a company from
its financial data. Other approaches, such as the
careful study of the financial statement notes,
examination of the company’s accounting policies,
and an analysis of operations by division or product-
line should also be considered. We can assist in
developing other procedures that will be useful on
a day-to-day operating basis.
We want your financial statements to be used and
useful. If you would like further information,
please call.