Embed Size (px)
Citation preview
Running head: ADAPTATION AND ADJUSTMENT
THE TRANSITION TO UNIVERSITY: ADAPTATION AND ADJUSTMENT
A Thesis Submitted to the College of
Graduate Studies and Research
in Partial Fulfillment of the Requirements
for the Degree of Master of Arts
in the Department of Psychology
University of Saskatchewan
Saskatoon
By
Melanie L. Smith
© Copyright Melanie L. Smith, April 2008. All rights reserved.
Adaptation and Adjustment
i
PERMISSION TO USE
In presenting this thesis in partial fulfillment of the requirements for a
Postgraduate degree from the University of Saskatchewan, I agree that the Libraries of
this University may make it freely available for inspection. I further agree that permission
for copying of this thesis in any manner, in whole or in part, for scholarly purposes may
be granted by the professor or professors who supervised my thesis work or, in their
absence, by the Head of the Department or the Dean of the College in which my thesis
work was done. It is understood that any copying or publication or use of this thesis or
parts thereof for financial gain shall not be allowed without my written permission. It is
also understood that due recognition shall be given to me and to the University of
Saskatchewan in any scholarly use which may be made of any material in my thesis.
Requests for permission to copy or to make other use of material in this thesis in
whole or part should be addressed to:
Head of the Department of Psychology
University of Saskatchewan
Saskatoon, Saskatchewan (S7N 5A5)
Adaptation and Adjustment
ii
Abstract
Beginning university can be conceptualized as a stressful life event as both positive
aspects and several new challenges are associated with the transition (Hudd, Dumlao,
Erdmann-Sager, Murry, Phan et al., 2000; Kerr, Johnson, Gans, Krumrine, 2004;
Lamothe, Currie, Alisat, Sullivan, Pratt et al., 1995). Sometimes a poor transition may
result in a student’s inability to complete their degree. It is important to develop a more
thorough understanding of the transition to university in order to improve student
retention. The present investigation considered a range of demographic, psychosocial,
and health behaviours that may be related to a student’s ability to adapt to university.
These variables were investigated using a short-term longitudinal design over the first
year of university. Participants (Time 1 N = 229, Time 2 N = 73) consisted of first year
University of Saskatchewan students (age, M = 18.46, SD =1). Results suggested that
approximately 1/3 of the students found the transition to university to be difficult and that
in general women had a more difficult time than men in terms of social and
personal/emotional adjustment. There was no significant difference in academic
adjustment or achievement between men and women. Psychosocial variables and
health behaviours were related to one another such that greater physical activity levels
went hand in hand with more adaptive coping and higher levels of social support and
self-esteem. During the first semester, easier transitions and better adjustment were
largely predicted by more adaptive coping, good social support, better grades and fewer
daily hassles. For women, second semester transition experiences and adjustment
measures were strongly predicted by the same measures as observed in the first
semester.
Adaptation and Adjustment
iii
Acknowledgements
I would like to thank my thesis advisor Patti McDougall for the research direction
she has given me and the effort she has put into meeting all of the deadlines, (even the
really tight ones) throughout the thesis writing process. I also am thankful for the
support and guidance I have received from my committee members Michael MacGregor
and Karen Lawson during my graduate work. Finally, I would also like to thank Jody
Shynkaruk for all of her help with the online data collection program during the data
collection (and downloading) process.
Adaptation and Adjustment
iv
TABLE OF CONTENTS PERMISSION TO USE ....................................................................................................... i
ABSTRACT ........................................................................................................................ ii
ACKNOWLEDGEMENTS .................................................................................................. iii
TABLE OF CONTENTS ..................................................................................................... iv
LIST OF TABLES .............................................................................................................. vii
LIST OF FIGURES .......................................................................................................... viii
1. THE TRANSITION TO UNIVERSITY: ADAPTATION AND ADJUSTMENT ................ 1 1.1 Individual Factors That Affect the Transition to University ..................................... 3 1.2 Risk and Protective Factors ..................................................................................... 4 1.2.1 Adaptive Coping .............................................................................................. 6 1.2.2 Social Support ............................................................................................... 10 1.2.3 Self Esteem ................................................................................................... 11 1.2.4Health Behaviours .......................................................................................... 12 1.3 The Present Study ................................................................................................. 14 2. METHODS ................................................................................................................... 18 2.1 Participants ............................................................................................................ 18 2.2 Measures ............................................................................................................... 18 2.2.1 Background/Demographic Variables ............................................................ 18 2.2.2 Coping ........................................................................................................... 18 2.2.3 Daily Hassles ................................................................................................. 19 2.2.4 Social Support ............................................................................................... 19 2.2.5 Self Esteem ................................................................................................... 20 2.2.6 Problematic Alcohol Consumption ................................................................ 21 2.2.7 Physical Activity ............................................................................................. 21 2.2.8 Beliefs About the Transition Experience ....................................................... 22 2.2.9 University Adaptation .................................................................................... 22 2.3 Procedure .............................................................................................................. 23 3. RESULTS .................................................................................................................... 25 3.1 Data Screening ...................................................................................................... 25 3.1.1 Missing Data .................................................................................................. 25 3.1.2 Univariate Outliers ......................................................................................... 25 3.1.3 Multivariate Outliers and Assumptions .......................................................... 25 3.2 Preliminary Analysis .............................................................................................. 26 3.2.1 Reliablities ..................................................................................................... 26 3.2.2 Completers Versus Non-completers ............................................................. 26 3.3 Descriptives at Time 1 ........................................................................................... 29 3.3.1 Underage Alcohol Consumption ................................................................... 29 3.3.2 Positive and Negative Perceptions of the Transition Experience ................. 29 3.4 Differences as a Function of Gender and Living Arrangement ............................. 32
Adaptation and Adjustment
v
3.4.1 Gender and Living Arrangement at Time 1 ................................................... 34 3.4.2 Adjustment by Living Arrangement Across Time 1 and Time 2 ................... 34 3.5 Primary Analysis .................................................................................................... 35 3.5.1 Intercorrelations of Adjustment and Predictor Variables .............................. 35 3.5.2 Concurrent Prediction of Early Adjustment to University .............................. 37
3.5.2.1 Overview ........................................................................................... 37 3.5.2.2 Transition Experience at Time 1 ....................................................... 37 3.5.2.3 Academic Adjustment at Time 1 ....................................................... 39 3.5.2.4 Social Adjustment at Time 1 ............................................................. 39 3.5.2.5 Personal/Emotional Adjustment at Time 1 ........................................ 39
3.5.3 Longitudinal Prediction of Adjustment at Time 1 .......................................... 40 3.5.3.1 Overview ........................................................................................... 40 3.5.3.2 Stablility/Consitency of the Outcome Measures ............................... 40 3.5.3.3 Longitudinal Prediction of the Transition Experience ........................ 41 3.5.3.4 Longitudinal Prediction of Academic Adjustment ............................. 41 3.5.3.5 Longitudinal Prediction of Social Adjustment .................................... 43 3.5.3.6 Longitudinal Prediction of Personal/Emotional Adjustment .............. 43 3.5.4 Mediating Relations at Time 1 ...................................................................... 43 3.5.4.1 Do Daily Hassles Mediate the Relation Between Adaptive Coping and Adjustment at Time 1? ................................................... 44 3.5.4.2 Do Daily Hassles Mediate the Relation Between Social Support and Adjustment at Time 1? .................................................. 46 3.5.4.3 Do Daily Hassles Mediate the Relation Between Health Behaviour and Adjustment at Time 1? .............................................. 48 3.5.5 Changes in Risk and Protective Factors Across the Year for Women ......... 48 3.5.5.1 Moderate Physical Activity ................................................................ 48 3.5.5.2 Vigorous and Strength Building Activity ............................................ 48 3.5.5.3 Sports Team Participation ................................................................. 50 3.5.5.4 Problem Drinking Behaviour ............................................................. 50 3.5.5.5 Change in risk and Protective Health Variables as a Predictor Adjustment at Time 2 ......................................................... 50 3.5.5.6 Change in Social Support from Time 1 to Time 2 ............................. 50 3.5.5.7 Change in Daily Hassles from Time 1 to Time 2 .............................. 50 4. DISCUSSION ................................................................................................................ 51 4.1 Does the Transition in to University Present a Stressful Life Event? .................... 51 4.2 Were there Individual Differences in Adjustment During the First Term? ............. 55 4.3 Relations Between Psychosocial and Physical Health-Related Variables and University Transition ....................................................................................... 57 4.3.1 Adaptive Coping ............................................................................................ 57 4.3.2 Daily Hassles ................................................................................................. 58 4.3.3 Social Support ............................................................................................... 59 4.3.4 Self Esteem ................................................................................................... 60 4.3.5. Health Behaviour and University Adjustment .............................................. 61 4.3.6 Summary ....................................................................................................... 64 4.4 Predicting the Adjustment of Women Over the Course of the First Year .............. 66 4.5 Changes in Risk and Protective Factors: Health Behaviours ............................... 69
Adaptation and Adjustment
vi
4.6 Understanding the Interconnections Between Psychosocial Factors and Health Behaviours and University Adjustment ............................................... 70 4.7 Do Daily Hassles Act as a Mediator? .................................................................... 71 4.8 Limitations .............................................................................................................. 72 4.8.1 Attrition .......................................................................................................... 72 4.8.2 Online Data Collection .................................................................................. 73 4.9 Implications for Intervention ................................................................................... 74 4.10 Conclusions ......................................................................................................... 75 5. REFERENCES .............................................................................................................. 76
6. APPEDECIES .............................................................................................................. 85
Adaptation and Adjustment
vii
List of Tables Table 1. Bivariate zero-order correlations between demographic, psychosocial, and health variables at Time 1 ……………………………………27 Table 2. Bivariate zero-order correlations between demographic, psychosocial, and health variables at Time 2 ……………………………………28 Table 3. The frequency and proportion of students who consume alcohol by legal drinking age ………………………………………………………30 Table 4. The frequency and proportion of students who were classified as problem drinkers by legal drinking age ………………………………………..31 Table 5. Means and standard deviations for men and women at Time 1 and for women at Time 1 and Time 2, living at home and away from home …33 Table 6. Bivariate zero-order correlations between Time 1 and Time 2 demographic, psychosocial, and health variables ……………………………….36 Table 7. Summary of regression analysis for variables predicting transition experience, academic, social and personal adjustment at Time 1 …………….38 Table 8. Longitudinal prediction of women’s adjustment to university at Time 2 ……….42 Table 9. Standardized beta coefficient, standard error and t value for paths connecting coping to hassles (a) and hassles to adjustment (b) ………………47 Table10. Standardized Beta coefficient, standard error and t value for paths between social support and hassles (a) and between hassles and adjustment (b) ………………………………………………………………………..49
Adaptation and Adjustment
viii
List of Figures
Figure 1. Conceptual map of hypothesized relationships of risk and protective factors and outcomes …………………………………………………5 Figure 2. Hypothesized mediational relations involved in the prediction of adjustment to university ………………………………………………………..17 Figure 3. Conceptual map of scales used to measure risk and protective factors and outcomes ……………………………………………………………...24 Figure 4. Diagram of hypothesized mediating role of hassle-based stress between coping and overall adjustment to university ………………………….45
Adaptation and Adjustment
1
1. The Transition to University: Adaptation and Adjustment
The transition to university has been characterized as a stressful life event. Even
though there are many positive aspects associated with this time, there are also several
new challenges (Lamothe, Currie, Alisat, Sullivan, Pratt et al., 1995). Sometimes a poor
transition results in a student’s inability to complete their degree. According to a study
conducted at the University of Saskatchewan, 28.4% of the students who began their
university education in the College of Arts and Science in 1998 did not continue from
their first to second year (Student and Enrolment Services, 2003). These students may
not have re-registered for a number of reasons. Some may have not done well enough
in their studies to meet promotion standards whereas others may have chosen not to
continue. It is possible that some students decide to take time off with plans of returning
later or chose to attend a different school. Wintre, Bowers, Gordner and Lange (2006)
found that ‘university leavers’ were a heterogeneous group where reasons to leave
included transfers to other universities or to colleges, temporary leaves, decisions to
drop out, and failures to meet required academic standards. Besides being a difficult
situation for students, university attrition is financially costly. If a student does not finish
their degree, the financial resources the university has used to educate them can not be
refunded. For the student, tuition and other university related costs also can not be
recouped. As cited in the University of Saskatchewan 1999-2000 Annual report, Pezer
(1998) showed that during the 1997-98 academic year, student attrition was expensive
costing students approximately $2 million and the university $6 million. A more thorough
understanding of the transition situation may lead to increased student retention and
therefore prevent this loss of financial resources for universities and also for their
students. As a naturally occurring potentially stressful event, the transition to university
also provides an excellent context within which to explore behavioral and psychosocial
factors that serve to either exacerbate or ameliorate the experience of stress.
Accordingly, the purpose of the present research project was to investigate the impact of
protective and risk factors for late adolescents and young adults during their first year of
university. Using a short-term longitudinal design, the current investigation considered a
range of adjustment outcomes including social, academic, and personal/emotional
Adaptation and Adjustment
2
adjustment to university as well as students’ perceptions of the nature of their transition
experiences at two time points during the first year of university (fall and spring).
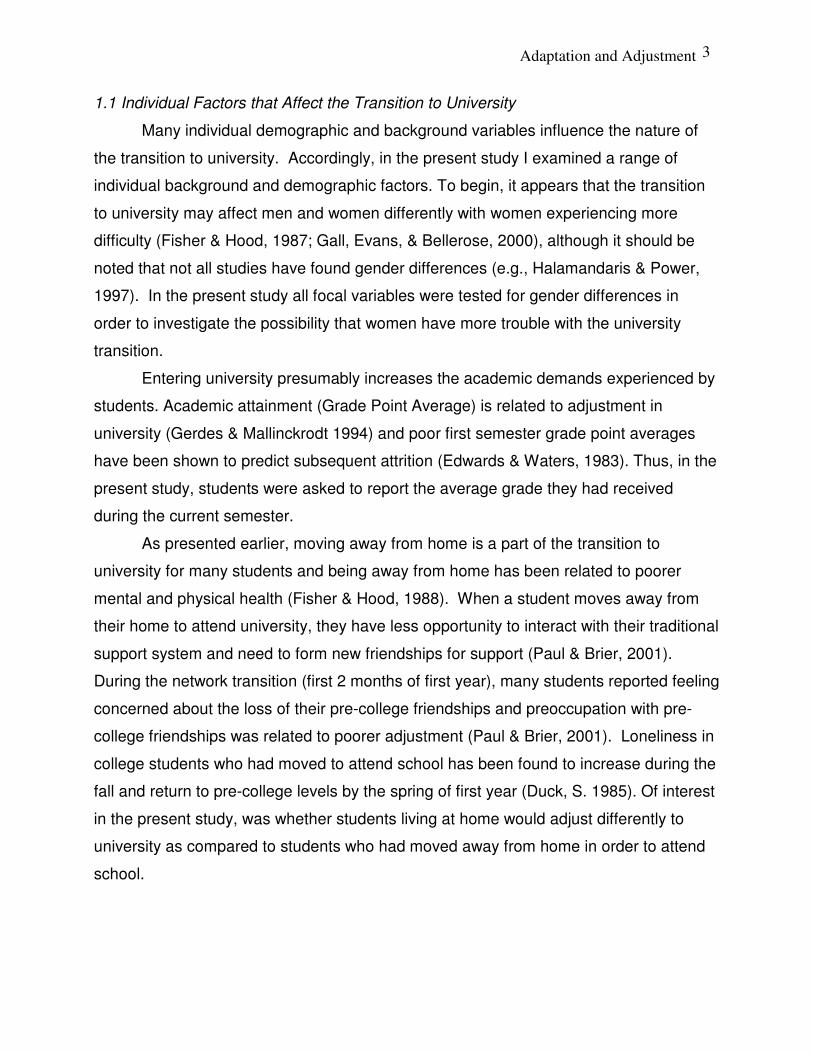
The university transition, although not inherently positive or negative in and of
itself, involves many new challenges. In one study of students living on a university
campus, over half reported feeling stressed “all,… most”, or “a good bit” of the time
(Hudd, Dumlao, Erdmann-Sager, Murry, Phan et al., 2000). Some of the challenges that
new students face include dealing with new and more difficult academic demands, living
away from home for the first time, and establishing new friendships. Alongside the
stress associated with the new demands of the academic realm of university, a student’s
new living situation may also require some adjustment. For example, moving away from
home to attend university can produce feelings of homesickness that are related to
elevated levels of psychological disturbance (Fisher & Hood, 1988). According to
Chickery (1969), there is a substantial amount of stress associated with facing new
challenges without the security of home. The move away from home undermines the
individual’s traditional support system of family and friends.
Although entering university is a normative life event, the many life changes
involved in the transition to university may be stressful. Experiencing elevated levels of
stress has been linked to physical and psychological symptoms (Straub, 2002).
However, in general, major life events only weakly correlate with stress-related
outcomes (Kohn, 1996). In contrast, what seems to demonstrate a greater association
with stress-related outcomes are the daily hassles, (i.e., the relatively minor, ordinary
stressors and irritants) we experience from day to day (Kohn, Lafreniere & Gurevich,
1990). When the impact of major life events on well-being was compared to the impact
of daily hassles on well-being, the more important determinant of well-being was the
daily hassles (Eckenrode, 1984). That is, life events and chronic stress had indirect
effects on the daily psychological well-being that was mediated by hassles and physical
symptoms (Eckenrode, 1984). Thus, life events do not predict subsequent distress to as
large of an extent as do daily hassles (Kanner, Coyne, Schaefer, & Lazarus, 1981). In
the present study, hassle-based stress was measured by assessing the level of daily
hassles students were experiencing using a measure that was designed specifically to
assess college related daily hassle based stress.
Adaptation and Adjustment
3
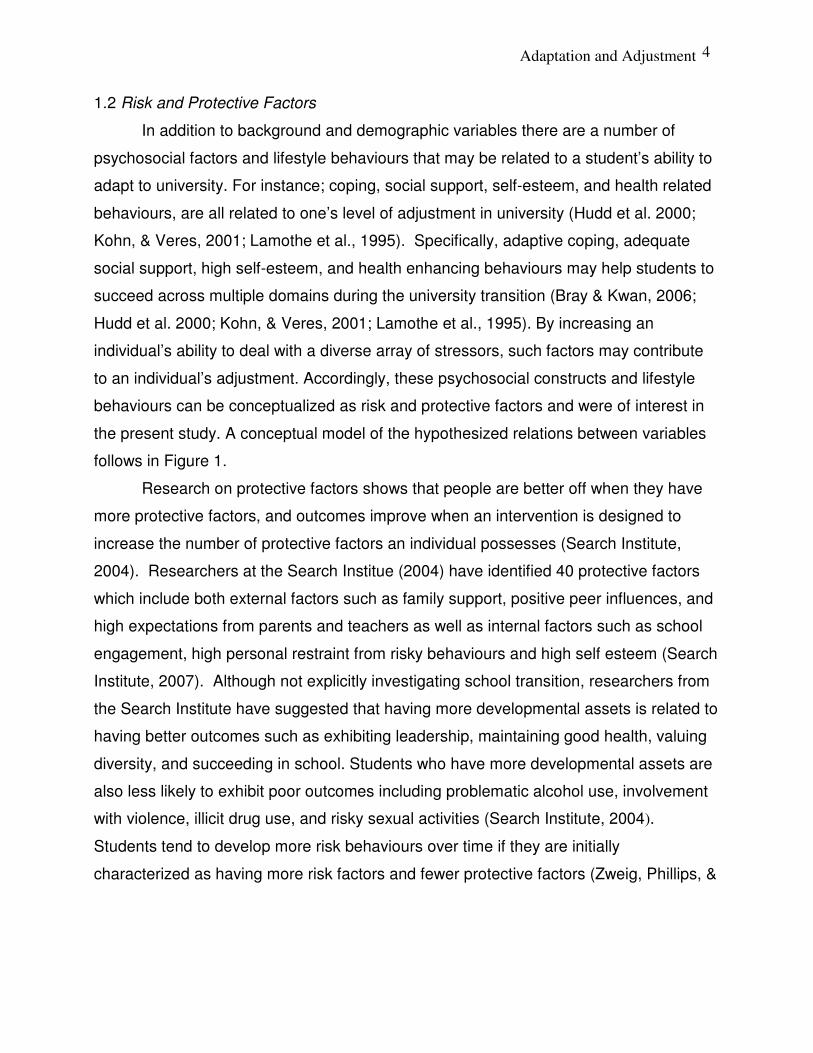
1.1 Individual Factors that Affect the Transition to University
Many individual demographic and background variables influence the nature of
the transition to university. Accordingly, in the present study I examined a range of
individual background and demographic factors. To begin, it appears that the transition
to university may affect men and women differently with women experiencing more
difficulty (Fisher & Hood, 1987; Gall, Evans, & Bellerose, 2000), although it should be
noted that not all studies have found gender differences (e.g., Halamandaris & Power,
1997). In the present study all focal variables were tested for gender differences in
order to investigate the possibility that women have more trouble with the university
transition.
Entering university presumably increases the academic demands experienced by
students. Academic attainment (Grade Point Average) is related to adjustment in
university (Gerdes & Mallinckrodt 1994) and poor first semester grade point averages
have been shown to predict subsequent attrition (Edwards & Waters, 1983). Thus, in the
present study, students were asked to report the average grade they had received
during the current semester.
As presented earlier, moving away from home is a part of the transition to
university for many students and being away from home has been related to poorer
mental and physical health (Fisher & Hood, 1988). When a student moves away from
their home to attend university, they have less opportunity to interact with their traditional
support system and need to form new friendships for support (Paul & Brier, 2001).
During the network transition (first 2 months of first year), many students reported feeling
concerned about the loss of their pre-college friendships and preoccupation with pre-
college friendships was related to poorer adjustment (Paul & Brier, 2001). Loneliness in
college students who had moved to attend school has been found to increase during the
fall and return to pre-college levels by the spring of first year (Duck, S. 1985). Of interest
in the present study, was whether students living at home would adjust differently to
university as compared to students who had moved away from home in order to attend
school.
Adaptation and Adjustment
4
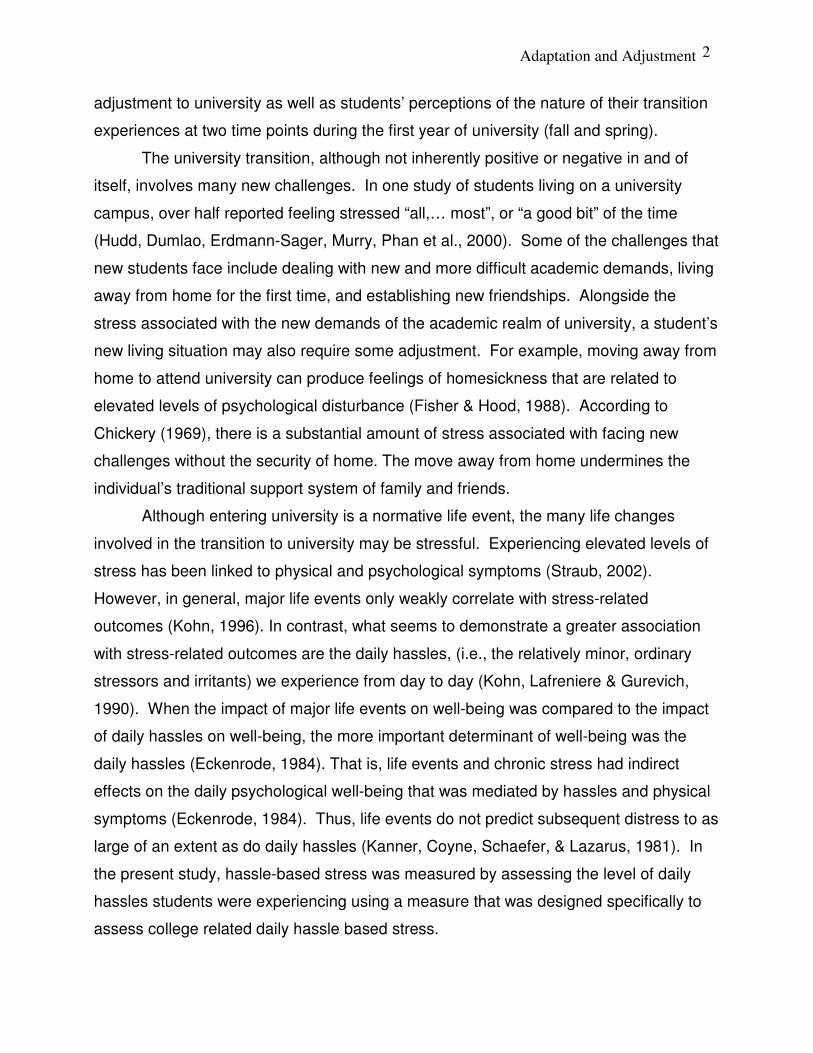
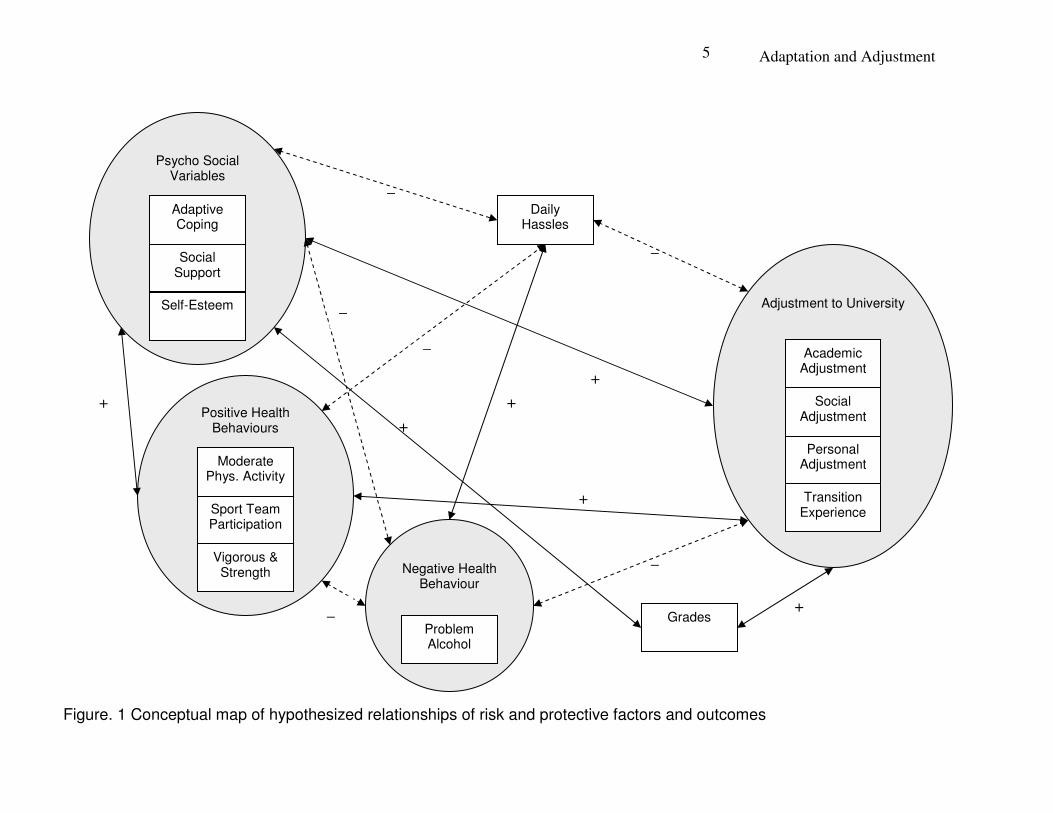
1.2 Risk and Protective Factors
In addition to background and demographic variables there are a number of
psychosocial factors and lifestyle behaviours that may be related to a student’s ability to
adapt to university. For instance; coping, social support, self-esteem, and health related
behaviours, are all related to one’s level of adjustment in university (Hudd et al. 2000;
Kohn, & Veres, 2001; Lamothe et al., 1995). Specifically, adaptive coping, adequate
social support, high self-esteem, and health enhancing behaviours may help students to
succeed across multiple domains during the university transition (Bray & Kwan, 2006;
Hudd et al. 2000; Kohn, & Veres, 2001; Lamothe et al., 1995). By increasing an
individual’s ability to deal with a diverse array of stressors, such factors may contribute
to an individual’s adjustment. Accordingly, these psychosocial constructs and lifestyle
behaviours can be conceptualized as risk and protective factors and were of interest in
the present study. A conceptual model of the hypothesized relations between variables
follows in Figure 1.
Research on protective factors shows that people are better off when they have
more protective factors, and outcomes improve when an intervention is designed to
increase the number of protective factors an individual possesses (Search Institute,
2004). Researchers at the Search Institue (2004) have identified 40 protective factors
which include both external factors such as family support, positive peer influences, and
high expectations from parents and teachers as well as internal factors such as school
engagement, high personal restraint from risky behaviours and high self esteem (Search
Institute, 2007). Although not explicitly investigating school transition, researchers from
the Search Institute have suggested that having more developmental assets is related to
having better outcomes such as exhibiting leadership, maintaining good health, valuing
diversity, and succeeding in school. Students who have more developmental assets are
also less likely to exhibit poor outcomes including problematic alcohol use, involvement
with violence, illicit drug use, and risky sexual activities (Search Institute, 2004).
Students tend to develop more risk behaviours over time if they are initially
characterized as having more risk factors and fewer protective factors (Zweig, Phillips, &
Adaptation and Adjustment
5
_
+
+
+
+
_
_
_
Psycho Social Variables
Daily Hassles
Self-Esteem
Social Support
Adaptive Coping
Grades
Adjustment to University
Transition Experience Sport Team
Participation
Vigorous & Strength
Positive Health Behaviours
Academic Adjustment
Personal Adjustment
Social Adjustment
Moderate Phys. Activity
Problem Alcohol
Negative Health Behaviour
_
+
_
+
Figure. 1 Conceptual map of hypothesized relationships of risk and protective factors and outcomes
Adaptation and Adjustment 6
Duberstein Lindberg, 2002). The opposite is also true; individuals who start with more
protective factors tend to develop more assets over time (Zweig et al. 2002). Although it is
not always the case, risk and protective factors commonly exist on a continuum such that
while the presence of the variable acts as a protective factor, the absence of that same
variable constitutes a risk or vice versa (Masten, et al. 1999). The protective and risk
factors under investigation in the present study exhibit this type of continuum property.
Psycho-social factors in the present study included adaptive coping, social support, and
self-esteem. The lifestyle or health-related behaviours under study were physical activity
and problematic alcohol consumption.
Smith, Orleans, and Jenkins (2004) call for research that integrates behavioural and
psychosocial risk and resilience concepts. They state that an understanding of the relation
between behavioural risks (for example; smoking, poor diet, lack of exercise, risky
drinking) and psychosocial risks (for example; social isolation, interpersonal stress/conflict,
certain personality traits, depression) from a developmental perspective is important. Both
groups of risks are related to future morbidity and early mortality, and both develop during
adolescence and early adulthood. Furthermore, there seems to be some shared
underlying factors in the development of both types of risk (Smith, Orleans & Jenkins
2004). Risk and protective variables are related to future mortality and morbidity of
university students, and these same variables may have implications for current
adjustment to university. Currently there is very little literature that looks at how health
behaviours (physical activity and alcohol consumption) are related to psychosocial
behaviours (adaptive coping, social support and self-esteem) during transition to
university, and I am not aware of any published studies that investigate these relations
longitudinally during first year. Consequently, the relations among the psychosocial and
health related variables were of interest in the present study.
1.2.1 Adaptive Coping. Coping is a process that an individual initiates in order to
deal with challenging situations (Boekaerts, 1996). The process is multistage and begins
with the presence of a stressor. The stressor is identified and appraised by the individual
who initiates a response in an attempt to meet some goal (Zeidner & Saklofske, 1996).
Individuals differ with respect to their coping abilities, and achieve varied results. An
individual may achieve a variety of outcomes ranging from maladjustment to being well
adjusted (Hewitt & Flett, 1996). Strategies for dealing with stressors are most effective
Adaptation and Adjustment 7
when an individual is comfortable with the strategy, and it is in line with their personal
objectives (Zeidner & Saklofske, 1996).
Traditionally coping has been measured in terms of different styles. A coping style
is a pattern of coping behaviour regularly utilized by an individual. Coping is generally
studied as a response to stress that occurs in the form of a permanent style (Endler &
Parker, 1990). Despite criticisms to the contrary (Lazarus & Folkman, 1987), there is
evidence in support of stable styles of coping (Endler & Parker, 1990). There are three
general styles of coping including problem-focused, emotion-focused, and avoidant coping
(Boekaerts, 1996). Problem-focused coping deals directly with the stressor, for example
studying for an upcoming test to reduce the stress of writing the test is a problem-focused
coping behaviour. Emotion-focused coping is used to regulate ones’ emotions associated
with a stressor. Talking about the anxiety one may be feeling about an upcoming test with
friends is an example of an emotion focused coping behaviour. Problem-focused coping,
also commonly referred to as active coping, has generally been linked to positive
outcomes. A positive outcome is attained particularly when the stressor is under the
control of the individual. An emotion-focused coping style is often related to less positive
outcomes, although this finding is not universal (Baum, Fleming & Singer, 1983). An
emotion-focused or passive coping strategy is generally used in situations where the
individual has identified the stressor as being of an uncontrollable type (Zeidener &
Saklofske, 1996). The third category is composed of avoidant coping behaviors which
typically involve disengaging from a situation. Avoidance coping mechanisms are utilized
when the individual creates either cognitive or physical distance from their stressor. For
example, avoidant coping behaviour is displayed when a student chooses to go out with
friends to play their favorite sport to avoid thinking about a stressful upcoming test.
Avoidant coping is not in and of itself maladaptive. Gall et al. (2000) found that new
university students tended to increase their use of avoidant coping techniques temporarily
at the beginning of the year and that these behaviours did not appear to be detrimental for
the students. However, depression in university students has been shown to relate to both
avoidance and emotion-focused coping styles (Zeidner, 1994; as cited in Zeidner &
Saklofske, 1996).
Adaptation to stressful situations is achieved through the process of coping. It has
been suggested that the transition to university is a stressful time that requires individuals
Adaptation and Adjustment 8
to initiate coping responses (Fisher, & Hood, 1987; Matheny, Curlette, Aysan, Herrington,
Gfroerer, et al., 2002). Students attempt to adjust to their new situation, but they vary in
their ability to deal with the stress associated with this transition (Matheny et al., 2002).
Although the transition to university is a situation that may be associated with a
number of stressors that require adaptation through coping, it is very likely that some
students will identify the transition situation as challenging whereas others will perceive it
to be threatening (Straub, 2002). How an individual perceives a stressor affects the type
of coping mechanisms they will enact (Zeidner & Saklofske, 1996). Although most people
experience stress, some people appear to be better at dealing with and reducing stress
through effective coping. Matheny et al. (2002) found that having more coping resources
was related to lower levels of stress and also more life satisfaction. They found that
coping promoted life satisfaction in part through indirect effects; more coping resources
reduced perceived stress. In turn, a reduction in perceived stress was related to greater life
satisfaction in university students. In addition to simply having more coping resources,
being able to cope adaptively (using coping strategies that are well suited to the situation)
has been related to better adjustment in university both through direct and indirect effects.
Adaptive coping is positively related to personal and academic adjustment to university. In
addition, coping affects adjustment indirectly by lowering daily hassles. Given that high
levels of hassles are related to poor academic and personal adjustment it follows that at
least some of the connection between adaptive coping and adjustment to university is
achieved through a reduction of hassle-based stress (Kohn & Veres, 2001).
Although complete agreement does not exist as to what constitutes an effective
coping response, Zeidner and Saklofske (1996) have outlined a number of criteria that are
accepted by many researchers and describe adaptive outcomes that result from coping.
Coping can be identified as effective when: (1) it provides a solution to the stressor, (2) it
reduces physical arousal, (3) it reduces emotional distress, (4) it is normal within the social
context, (5) it allows an individual to return to routine activities, (6) it aids the well-being of
self and others, (7) it produces good self esteem, and (8) it is perceived by the individual to
have helped. To be effective, coping does not need to satisfy all of the above criteria. A
particular behaviour is best evaluated in terms of its outcome within a specific context. For
example, problem-focused coping is generally related to more positive outcomes,
however, if a child was witnessing a violent disagreement between his/her parents,
Adaptation and Adjustment 9
problem-focused coping might entail becoming involved and resolving the disagreement
(realistically, the child can not resolve this problem). In this situation for this child, problem-
focused coping is not going to be as effective a coping strategy as emotion-focused coping
(i.e., dealing with their feelings about his/her parents fight), or avoidance coping which
would entail removing themselves from the situation and focusing their attention on
something else. Though coping with stressors should explain much of the variance
observed in the outcome of stressful events, for the most part this has not been empirically
demonstrated (Kohn, 1996). The reason that coping has not explained much of the
variance in outcomes in past studies is likely due to the way it has been conceptualized
and measured in the past. Researchers have tended to conceptualize and measure coping
according to style (e.g., problem-focused, emotion-focused, or avoidant) rather than by its
adaptiveness (Kohn, 1996).
Adaptive coping entails responding to a stressful situation in an appropriate manner.
Kohn (1996) explains that the controllability of the stressor is the central determinant of
which behaviour may constitute an appropriate response. Effective coping is not
necessarily achieved by relying on only one coping style (i.e., problem-focused or emotion-
focused), but on the context in which a particular coping technique is used. Even though
problem-focused coping is usually an effective style of coping, if the situation is actually
uncontrollable, enacting problem focused coping behaviours may become frustrating
rather than beneficial. Being able to adaptively cope, means being able to use whatever
type of coping will actually work best within a given situation. The factors that constitute
adaptive coping can be conceptualized as self-control, determination, and judgment (Kohn,
1996). Self-control refers to one’s ability to control one’s behaviour despite impulse to the
contrary. It is the ability to respond passively to a stressor if the situation is best dealt with
by doing so. Determination is one’s ability to actively respond to a stressor and execute the
necessary behaviour. Judgment refers to an individual’s ability to decide on the best
response for a given situation. Every situation is characterized by many alternate reactions
ranging from maladaptive to very adaptive. The adaptive quality of most coping responses
is dependent on the circumstance (Kohn, 1996).
Coping with daily hassles concerns everyday situations, and generally involves
dealing with the cumulative impact of daily stress (Kohn, 1996). Like major life events,
how we appraise hassles affects our response. When coping is only measured in terms of
Adaptation and Adjustment 10
style, rather than by its adaptiveness, coping explains very little of the variance (with
regard to affects on mental health, subjective distress, and minor physical ailments) not
explained by exposure to hassles alone (Kohn, Hay & Legere, 1994; Lu, 1991).
Coping adaptiveness works to decrease reported hassles as well as increase the
student’s academic, social, and personal/emotional adjustment. Increased daily hassles
are inversely related to both academic and personal adjustment (Kohn & Veres, 2001).
Generally, coping assumes effectiveness: to adaptively cope means to be effective in
achieving positive adjustment in the long term (Zeidner & Saklofske, 1996). In this way
one’s adaptive coping ability is related to an individual’s adjustment level during a stressful
transition. The role of adaptive coping was of central interest in the present investigation. It
was hypothesized that coping adaptiveness would be positively related to measures of
university adjustment (academic, social and personal/emotional adjustment) as well as
perceived transition experience and psychosocial and health related variables.
1.2.2 Social Support. In addition to adaptive coping, an individual’s level of social
support also plays a role in their adjustment during the transition to university. In particular,
the absence of social support is a risk factor for poor adjustment (Lamothe et al., 1995),
whereas the presence of adequate social support appears to buffer people from the effects
of stress (Cutrona, & Russell, 1987).
During the transition to university, some students have moved away from their
traditional support system. Many students have to create new social support networks
(Shaver, Furman, & Buhrmester, 1985). Forming a stable social support network can be
both difficult and stressful. Students enter a new environment and must quickly form a
new social network away from their family. For students who are unable to build their
social network, loneliness may result (Paul & Brier, 2001). University is both an unfamiliar
social setting and an evaluative social setting. As students are evaluated intellectually by
educators, they are also being socially evaluated by their peers. This situation can elicit
feelings of shyness and can be problematic for socially inhibited individuals (Asendorph,
2000). Fisher and Hood (1988) found that almost one third of the first year university
students they surveyed reported feeling homesick. In addition to changing relationships
with family, some students suffer from friend-sickness during the transition to university.
According to Paul and Brier (2001) friend-sickness is a preoccupation and concern with a
loss of friends or changes in pre-college friendships. Paul and Brier found that friend-sick
Adaptation and Adjustment 11
college students were lonelier and had lower self-esteem regarding their ability to make
friends and to secure close accepting friendships than students who did not report feeling
friend-sick. Clearly students experience distress when they are unable to make new
contacts that they can utilize for needed support. Paul and Brier (2001) reported that
approximately half of their student sample experienced moderate to high levels of friend-
sickness, and high levels of friend-sickness were related to poor adjustment.
In their social support intervention study, Lamothe et al. (1995) found that university
students who participated in an intervention that was designed to increase new social ties
and help students to balance academics and social demands showed more gains in social
support. Higher levels of social support were related to better university adjustment.
University adjustment in their study was measured utilizing all four subscales of the
Student Adaptation to College Questionnaire including academic, social, and
personal/emotional adjustment, as well as school attachment (Baker & Siryk, 1984). A
replication study again demonstrated the importance of social support in terms of better
adjustment, and also revealed that students with better social support and higher
adjustment levels did not skip class or engage in smoking tobacco as much as those in the
control group who had not received help increasing their social support (Pratt et al., 2000).
Taken together, the evidence suggests that whereas a lack of social support constitutes a
risk factor for poor adjustment in university, adequate social support serves to protect
students and is related to better adjustment. Following from previous research I sought to
examine whether low levels of social support were related to poor adjustment in the first
year of university, or conversely, whether high levels of social support would go hand in
hand with better adjustment. Previous work suggests that social support may buffer people
from the negative effects of stress (Cutrona & Russel, 1987), In the present study, I was
interested in investigating whether daily hassles would mediate the relation between social
support and adjustment to university; such that while social support and university
adjustment would share a positive relation, some of the positive influence that social
support has on adjustment would be attained through a reduction in hassle-based stress.
1.2.3 Self-Esteem. One’s sense of self is related to individual adjustment such
that having high self-esteem has been shown to be positively related to adjustment in a
variety of contexts (Robins, Hendin, & Trzesniewski, 2001). Global self-esteem is related
to both psychological well being and academic competence (Gray-Little, Williams &
Adaptation and Adjustment 12
Hancock, 1997). Individuals with high self-esteem are less likely to be depressed
(Rosenberg, Schooler, Schoenbach, & Rosenberg, 1995). In addition, in university
students, high self esteem is related to academic achievement (Aspinwall & Taylor, 1992)
and is predictive of better adjustment to university during first year (Mooney, Sherman, & lo
Presto, 1991). Accordingly, the relations between self-esteem and the university
adjustment indices were examined in the present study.
1.2.4 Health behaviours. During adolescence and young adulthood many lifestyle
behaviours that are related to an individual’s adjustment emerge and are solidified (Jessor,
Turbin & Costa, 1998). The development of health risk and protective behaviours is
extremely important to study because in industrialized nations lifestyle factors have
become the leading determinants of morbidity and mortality later on in adulthood (Jessor,
Turbin & Costa, 1998; Smith et al., 2004). The behaviours that are developed during
adolescence and young adulthood have costs or benefits both for individuals and society
(Smith et al., 2004; Williams, Holmbeck, & Greenley, 2002). For example, a person who
smokes and rarely exercises is much more likely to develop heart disease than is
someone who leads a heart healthy life style. In 1997, 26.6 % of all deaths in Canada
were attributed to heart disease (Statistics Canada, 1997). It can be argued that much
future individual suffering could be avoided by developing health enhancing lifestyles. In
addition, society could benefit through a reduction of the financial costs associated with the
treatment of lifestyle related diseases (Straub, 2002).
The transition to university appears to bring with it a number of changes in students’
health behaviours. For example, it has been reported that students drink more alcohol, eat
more poorly, and exercise less upon entering college (Lau, Quadrel, & Harman, 1990).
Despite the fact that stress is related to physical illness (Evans & Edgerton, 1990),
exercise has been shown to protect individuals from succumbing to stress related illnesses
(Straub, 2002). Also, individuals who lead a physically active lifestyle are less likely to
suffer from depression and anxiety as compared to those who do not exercise regularly
(Callaghan, 2004; Statistics Canada, 1999). Indeed, depressive symptoms in college
students have been reduced through programs of aerobic exercise (McCann & Holmes,
1984). Aerobic exercise can also help depressed persons to maintain their improvement in
symptomology. In one study, participants who were treated with aerobic exercise
remained less depressed after 3 months while participants treated with psychotherapy had
Adaptation and Adjustment 13
began to become more depressed again (Hinkle, 1992). Hudd et al. (2000) conducted a
study of students living on a university campus and showed that exercise was related to
reported stress. They found that the majority of students who did not participate in sports
regularly reported high levels of stress, whereas over one third of the group who reported
low levels of stress were engaged in frequent physical activity. In addition physical activity
shares connections with university adjustment and achievement. Strength training has
been shown to be positively related to academic average (Trockel, Barnes, & Egget, 2000)
while life satisfaction in university was positively related to satisfaction with relationships,
and physical health (Chow, 2005).
Alcohol misuse in college populations is related to a wide variety of negative
consequences including academic impairment, injuries, and illness (Perkins, 2002). A
number of explanations for patterns of high frequency and quantities of alcohol
consumption have been investigated, including social reasons and coping reasons
(Labouvie & Bates, 2002; Perkins, 1999). Labouvie and Bates (2002) demonstrated that
while some young adults were motivated to drink for social reasons (e.g., to fit in with
friends), some drank for stress suppression effects (e.g., to escape school pressures).
When young adults demonstrated drinking to cope with situations that they appraised as
stressful and drinking in anticipation of stress, their alcohol use intensity was elevated, as
were their alcohol related problems (Labouvie & Bates, 2002). In college, higher levels of
alcohol consumption are related to school problems (Wechsler, Dowdall, Maenner,
Gledhill-Hoyt, & Hang, 1998) and lower academic achievement (Engs, Diebold, & Hanson,
1996). In one longitudinal study of freshman drinking, frequent binge drinking was related
to more alcohol-related problems in college, academic attrition, less favorable labor market
outcomes and was a risk factor for alcohol dependence 10 years later (Jennison, 2004).
Of interest in the present examination was whether positive (physical activity) and
negative (problematic alcohol consumption) health behaviours would serve as protective
and risk factors (respectively) across the transition to university. Consistent with previous
research, it was hypothesized that health behaviours would be related to adjustment to
university. In addition, it was hypothesized that health behaviours would be related to
hassle based stress such that more physical activity and less alcohol consumption would
be related to lower levels of stress.
Adaptation and Adjustment 14
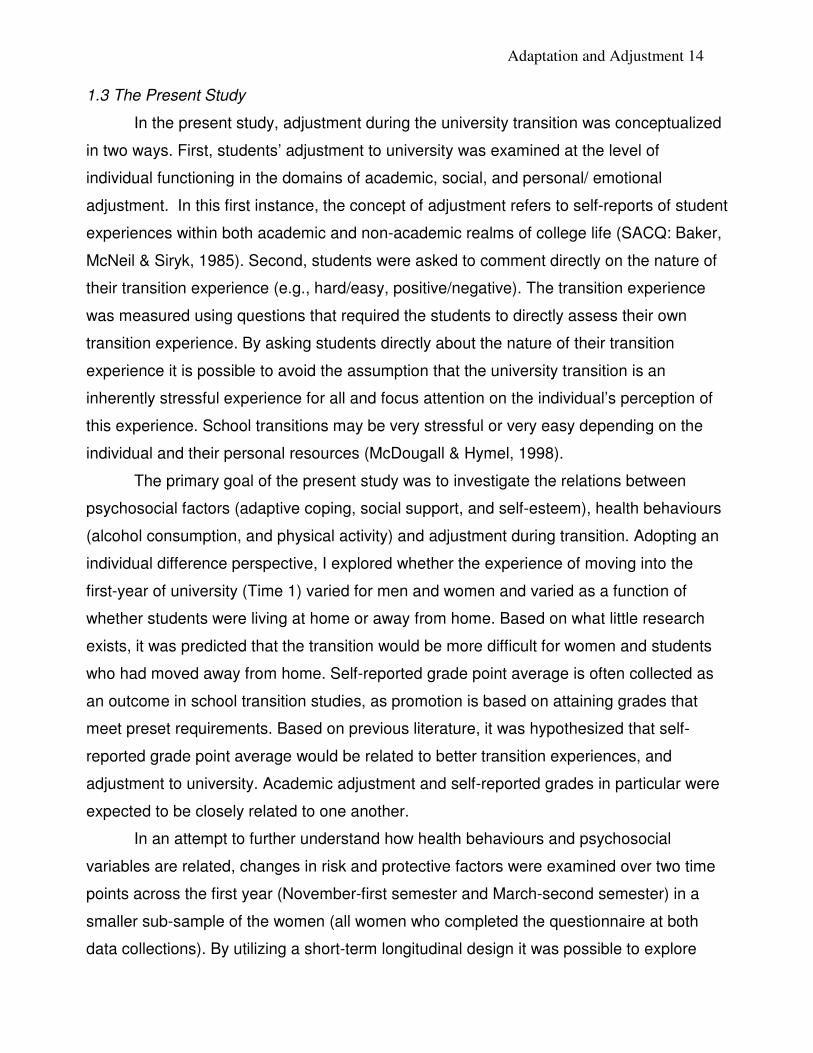
1.3 The Present Study
In the present study, adjustment during the university transition was conceptualized
in two ways. First, students’ adjustment to university was examined at the level of
individual functioning in the domains of academic, social, and personal/ emotional
adjustment. In this first instance, the concept of adjustment refers to self-reports of student
experiences within both academic and non-academic realms of college life (SACQ: Baker,
McNeil & Siryk, 1985). Second, students were asked to comment directly on the nature of
their transition experience (e.g., hard/easy, positive/negative). The transition experience
was measured using questions that required the students to directly assess their own
transition experience. By asking students directly about the nature of their transition
experience it is possible to avoid the assumption that the university transition is an
inherently stressful experience for all and focus attention on the individual’s perception of
this experience. School transitions may be very stressful or very easy depending on the
individual and their personal resources (McDougall & Hymel, 1998).
The primary goal of the present study was to investigate the relations between
psychosocial factors (adaptive coping, social support, and self-esteem), health behaviours
(alcohol consumption, and physical activity) and adjustment during transition. Adopting an
individual difference perspective, I explored whether the experience of moving into the
first-year of university (Time 1) varied for men and women and varied as a function of
whether students were living at home or away from home. Based on what little research
exists, it was predicted that the transition would be more difficult for women and students
who had moved away from home. Self-reported grade point average is often collected as
an outcome in school transition studies, as promotion is based on attaining grades that
meet preset requirements. Based on previous literature, it was hypothesized that self-
reported grade point average would be related to better transition experiences, and
adjustment to university. Academic adjustment and self-reported grades in particular were
expected to be closely related to one another.
In an attempt to further understand how health behaviours and psychosocial
variables are related, changes in risk and protective factors were examined over two time
points across the first year (November-first semester and March-second semester) in a
smaller sub-sample of the women (all women who completed the questionnaire at both
data collections). By utilizing a short-term longitudinal design it was possible to explore
Adaptation and Adjustment 15
changes in these risk and protective factors during a potentially stressful period while at
the same time examining individual variation in transition experience and university
adjustment in first year.
The primary focus of the present study was the examination of relations (both
concurrent and longitudinal) between hassles, coping adaptiveness, social support, self-
esteem, physical activity, problem alcohol consumption, and adjustment to university
(perceived transition experience along with academic, social, and personal/emotional
adjustment to university). Consistent with existing literature, I expected that coping
adaptiveness would be related to a decrease in reported hassles and more positive
transition experiences as well as being associated with positive adjustment in academic,
social, and personal/emotional realms. In addition, adaptive copers were expected to have
higher levels of social support and engage in more physical activity, and less problem
drinking.
Consistent with previous research, better social support was predicted to be
associated with more positive perceptions of the transition experience as well as better
academic, social and personal/emotional adjustment. In contrast, higher levels of daily
hassles were expected to be tied to lower academic, social, and personal/emotional
adjustment and predictive of a more challenging transition experience as well as less
physical activity and more problem drinking. More positive health behaviours (more
physical activity and less problem drinking) were expected to be related to more positive
transition experiences and higher levels of university adjustment (academic, social, and
personal/emotional). Finally, high self-esteem was expected to be positively related to
higher grades and each of the three indices of university adjustment.
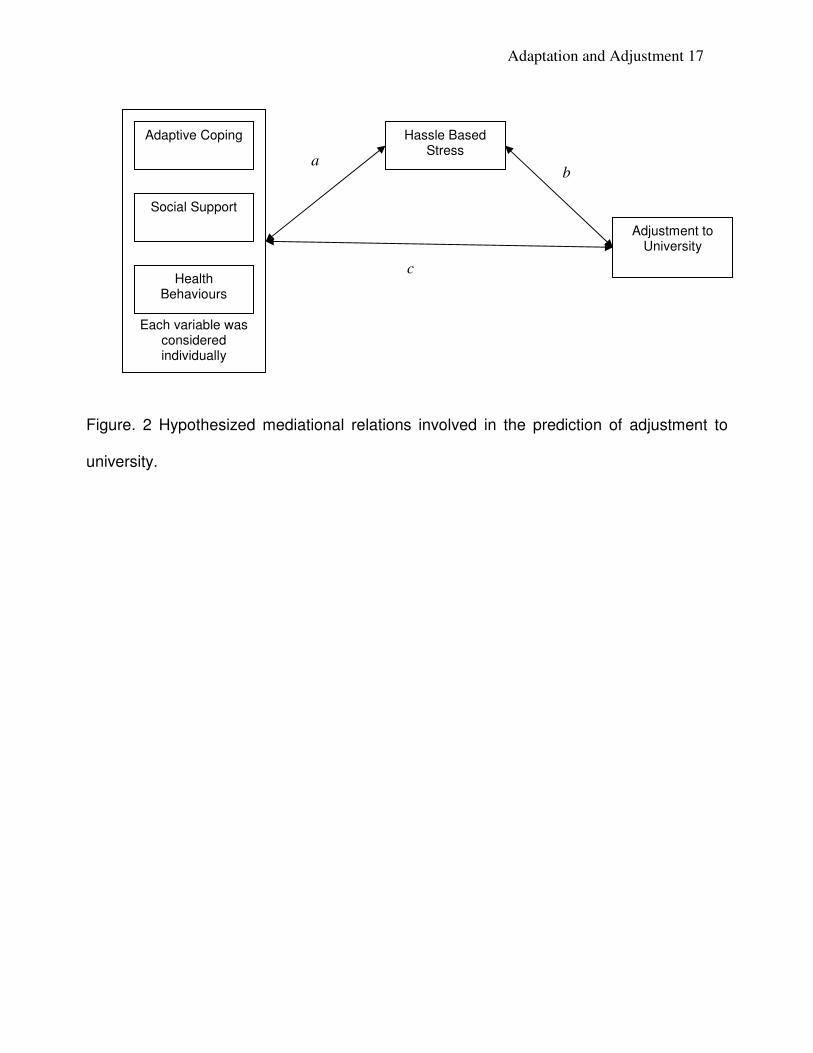
In the present study I hypothesized that while some variables (coping, social
support, health behaviours) would share a direct relation with adjustment to university, part
of this relation would be indirect, mediated through daily hassles. Specifically, three
mediational hypotheses were explored. First, based on previous research (Kohn 1996;
Kohn & Veres, 2001) I examined whether the relation between adaptive coping and
adjustment to university would be partially mediated by daily hassles exposure. Second,
based on relations identified in the literature (Cutrona & Russel 1982) I expected the
relation between social support and adjustment to university to be partially mediated by
daily hassles. Third, I considered whether the relation between physical activity and
Adaptation and Adjustment 16
adjustment to university would be mediated by daily hassles. See Figure 2 for a conceptual
map of the proposed mediational relations.
As a final consideration, I investigated the question of whether changes in risk and
protective factors across the first year of university would be related to adjustment at the
end of the school year. For example, it has been reported that health related behaviours
such as healthy exercise and eating habits decline during the first year of university (Hudd
et al., 2000). In another study of physical activity during the transition to university, it was
found that decreased vigorous physical activity was related to fatigue and lower levels of
vigor (Bray & Born, 2004). Of interest was whether a decline in protective factors (e.g.,
moderate physical activity) or an increase in risk behaviours (e.g., greater alcohol
consumption) over the course of first year would be associated with greater difficulty or
poorer adjustment to university.
Adaptation and Adjustment 17
Figure. 2 Hypothesized mediational relations involved in the prediction of adjustment to
university.
b
Each variable was
considered individually
Adjustment to University
Hassle Based Stress
Health Behaviours
Social Support
Adaptive Coping
a
c
Adaptation and Adjustment 18
2. Methods
2.1 Participants
The participants (Time 1 N = 229, Time 2 N = 73) consisted of University of
Saskatchewan undergraduate students (age, M =18.46, SD =1). The students were
recruited to participate in this study through the undergraduate psychology participant pool
and via recruitment posters placed in the residence buildings and on message boards on
campus. Students who were recruited through the undergraduate participant pool received
bonus points toward their first year psychology course. For first year student not enrolled in
psychology, the incentive to participate in the study was a chance to win one of three $100
gift certificates to the campus book store or to Future Shop. At Time 1 (November of first
semester) there were 50 men and 179 women and at Time 2 (March of second semester)
there were 7 men and 66 women.
2.2 Measures
Each questionnaire contained demographic and background questions along with
measures of risk and protective factors (i.e., coping, daily hassles, social support, self-
esteem, physical activity and problematic alcohol consumption) along with indices of
adaptation to the university setting (i.e., beliefs about the transition experience and
adjustment to university). Students filled out the questionnaire online. Each of the
measures is described below.
2.2.1 Background/Demographic Variables. The demographic questions (See
Appendix A) consisted of items regarding age, gender, self-reported grade history, the
student’s living arrangement at the time, and how far (driving time) their home town is from
the university.
2.2.2 Coping. The Personal Functioning Inventory (PFI) is a 30-item scale used to
measure coping adaptiveness. This scale consists of 15 pro-trait and 15 anti-trait
questions that are responded to on a 5-point Likert scale ranging from “1” Strongly
Disagree to “5” Strongly Agree (see Appendix B). A pro-trait item is one that explains an
adaptive quality whereas an anti-trait item describes a response that is not adaptive. The
PFI is not time referenced as it reflects an individual’s habitual reaction to various
stressors. High scores are indicative of higher levels of coping adaptiveness. The mean for
the full scale was used where scores could range from 1 to 5. Kohn et al. (2003) have
Adaptation and Adjustment 19
investigated the psychometric properties of the PFI and found the measure to be reliable
and valid. The stability of the PFI was established by administering the measure twice
over a three week period, the test-retest reliability was reported as 0.90 (Kohn et al. 2003).
The construct validity was established by correlating the PFI with the Summed Self-Rating
for Adaptiveness designed to measure adaptiveness, judgment, determination and self-
control. The PFI shows a strong positive correlation with this measure. The PFI also has
a strong positive relation with an individual’s confidence in their ability to cope with
stressful situations. In addition, the PFI correlates moderately with an individual’s need for
social approval, and shares a strong negative relation with perceived stress and prolonged
state anxiety. As evidence of discriminant validity, the PFI shows no correlation with
abstract curiosity, a construct seen as unrelated to adaptiveness (Kohn et al. 2003). The
internal consistency is high, alpha reliabilities have been found to range from 0.86 to 0.92
in university student and adult populations (Kohn et al. 2003).
2.2.3 Daily Hassles. The Inventory of College Students’ Recent Life Experiences
(ICSRLE) has 49 items and is used to measure daily hassles exposure (Appendix C). The
ICSRLE is a self-report measure where responses are recorded on a 4-point scale
indicating how much each item has been a part of the participants’ life (“1”= not at all a part
of my life to “4” = very much a part of my life). Respondents are asked to consider the
events over the past month when completing each item. The mean score for the full scale
was used where scores could range from 1 to 4. Higher scores on the ICSRLE indicate
more daily hassles. Kohn et al. (1990) have tested this scale and found it to be reliable
and valid. The alpha reliability was reported as 0.89. The ICSRLE correlates positively
with the Perceived Stress Scale (PSS) developed by Cohen et al. (1983) showing that the
construct being measured is related to stress. The reliability and validity of the ICSRLE
holds across gender (Kohn et al. 1990). Osman et al. (1994) have also tested the ICSRLE
and found the alpha reliability to be satisfactory. In addition, the concurrent validity was
established by correlating the ICSRLE with another commonly used hassles measure, the
Daily Hassles Scale (Revised) by Holm and Holroyd (1992). Strong positive correlations
were reported (Osman et al. 1994).
2.2.4 Social Support. The Social Provisions Scale (SPS) is a 24-item self-report
measure designed to assess social support. Responses are recorded on a 4-point scale
describing the degree to which the respondent agrees with each item (“1” = Strongly
Adaptation and Adjustment 20
Disagree to “4” = Strongly Agree). The SPS is time referenced to the present such that
participants are asked to think about their current relationships while answering each
question. The scale is divided into six subscales, each representing one of six social
provisions. These provisions include: Guidance (e.g., the extent to which the respondent
receives advice ), Reassurance of Worth (e.g., whether a person feels valued by others
and recognized for their contributions ), Social Integration (e.g., one’s feelings of belonging
to a social group.), Attachment (e.g., the presence of emotional closeness with someone),
Nurturance (e.g., whether the individual is able to provide support to someone else), and
Reliable Alliance (e.g., has others that they can count on for assistance). There are four
items, two positively and two negatively worded questions on each subscale. High scores
indicate that the individual receives that particular provision (Cutrona & Russell, 1987).
The total scale score was employed in the present investigation to reflect overall
level of social support (summing across all provisions; 24 items). The mean score for the
full scale was used where scores could range from 1 to 4. The total scale score has
previously been observed to yield a reliability of .915 (Cutrona & Russell, 1987). The
construct validity of the SPS has been demonstrated through its relation with measures of
loneliness and interpersonal relationships (Cutrona & Russell, 1987).
Please note: Access to the SPS is restricted by Cutrona and Russell. Scale items
do not appear in an appendix as per my understanding of my agreement with them. A copy
of the Social Provisions Scale along with a paper presenting psychometric data for the
measure can be obtained by sending an e-mail message to [email protected].
2.2.5 Self-Esteem. The Rosenberg measure of self-esteem (Rosenberg 1979) is a
10-item scale that has been constructed to measure global self esteem (Appendix D). This
scale was designed to assess general feelings of self-acceptance. Achieving a high level
of face validity was regarded as important during the development of the scale. As a result
the questions ask directly about how one feels about themselves. The items are
presented in an alternating pattern between positively worded questions and negatively
worded questions. Responses are recorded on a 4-point scale describing the degree to
which the respondent agrees with each item (“1” = Strongly Disagree to “4” = Strongly
Agree). The mean score for the full scale was used where scores could range from 1 to 4.
The validity and reliability of this scale have been tested many times and have been found
Adaptation and Adjustment 21
to be satisfactory (Gray-Little, Williams, & Hancock, 1997). In one such study, reliability
coefficients were found to range from .88 to .90 (Robins et al., 2001).
2.2.6 Problematic Alcohol Consumption. The Alcohol Use Disorders Identification
Test (AUDIT) is a measure designed to detect early indicators of harmful alcohol
consumption (Appendix E). Specifically, the behaviours measured by the AUDIT
characterize individuals who are not serious problem drinkers but who are engaging in
drinking behaviours that may lead to physical problems and injuries in the future. The
AUDIT is the product of a collaborative project developed by the World Health
Organization (WHO). The instrument was tested in a pool of approximately 1,800 people.
Among the individuals in this pool who have been diagnosed as hazardous or harmful
alcohol users, 92% scored an 8 or higher on the AUDIT. In addition, 94% of the individuals
who were assessed as having non-hazardous alcohol consumption patterns scored 8 or
less (Saunders, Aasland, Babor, De-la-Fuente et.al, 1993). The AUDIT questionnaire
consists of 10 questions. Questions 1 to 8 receive scores from 0 to 4 where the verbal
descriptors attached to each numeral vary across questions. Questions 9 and 10 receive
scores of 0, 2 or 4 depending on the answer selected. The score of each question is then
totaled for the full scale score. Full scale scores range from 0 to 40 with a suggested cut
off score of 8 as the marker for hazardous or harmful drinking. Higher scores reflect more
problematic alcohol consumption.
2.2.7 Physical Activity. The National College Health Risk Behavior Survey
(NCHRBS-phsycial activity questions) is a self-report questionnaire designed to measure
the type and frequency of physical activity (Appendix E). The types of activity that are
assessed include vigorous physical activity, strength building physical activity, moderately
intense physical activity, sedentary behaviors, and sports team participation (Centers for
Disease Control and Prevention, 2004). The four questions used each ask about the
frequency of the physical activity or behavior. Each type of physical activity or behaviour is
related to a person’s general activity level. Scores can range between 0 and 7 bouts of
exercise (1 per day) per week. Higher scores on the first three questions (moderate
physical activity, strength building activity, and vigorous physical activity) reflect more
frequent bouts of activity. Higher scores on the last question indicate that an individual is a
member of more sports teams. In the present investigation a distinction was made
between moderate physical activity (activities that are usually worked into daily life) and
Adaptation and Adjustment 22
exercise (purposeful physical activity done with the intent to exercise). To this end, a
composite variable was created to reflect ‘exercise’ by combining vigorous physical activity
and strength building activity. Theoretically, a participant’s score could range from 0 to 14
bouts of exercise in per week. Responses to the moderate physical activity and sports
team participation questions were considered as two additional variables.
2.2.8 Beliefs about the transition experience. A direct assessment of the university
transition experience was obtained using five questions designed to measure the quality of
the transition (see Appendix F). This questionnaire consists of a four item measure of
school transition experience taken from McDougall and Hymel (1998) with the addition of
one extra question that was added for the purpose of the current study. Specifically, the
five questions measured student perceptions of the transition experience in the following
areas: (1) extent of stress (2) feelings of success, (3) level of difficulty, and (4) extent of
happiness as well as the added question regarding (5) degree of challenge. Each item is
measured on a five-point scale. A mean score is obtained by averaging items together with
higher scores reflecting a better transition experience (i.e., less difficulty). Scores could
range from 1 to 5. Internal consistency was observed to be .60, and was viewed to be
acceptable for research purposes (McDougall & Hymel, 1998).
2.2.9 University adaptation. The Student Adjustment to College Questionnaire
(SACQ) was used to measure each participant’s relative adjustment to University
(Appendix G). Baker and Siryk (1984) contend that the SACQ is a reliable and valid
indicator of an individual’s actual adjustment to college. Respondents were asked to
consider the “past couple of days” as they completed 67 items that reflect various facets of
adjustment. Responses are provided on a 9-point scale indicating the degree to which an
item applies to the respondent (“1” = Applies very closely to me to “9” = Doesn’t apply to
me at all). The full-scale score represents overall adjustment to college with higher scores
reflecting better adjustment. The alpha reliability estimates for the full-scale score range
between 0.91 and 0.95 (Baker, Siryk, & McNeil, 1985; Baker & Siryk, 1986).
Baker and Siryk (1986) have reported that the SACQ contains four subscales
measuring domains of academic, social, personal/emotional, and attachment/commitment
adjustment. The academic (SACQ-A) scale has 24 items thought to address educational
demands. The alpha reliability for the SACQ-A has been reported as 0.82 and 0.88. The
social scale (SACQ-S) consists of 20 items and measures adjustment to interpersonal and
Adaptation and Adjustment 23
societal demands. The alpha reliability of the SACQ-S has been observed to range from
0.88 and 0.91. The personal/emotional (SACQ-P) scale consists of 15 items and is an
indicator of how the student feels both psychologically and physically. The alpha reliability
for the SACQ-P has been observed to range from 0.79 to 0.85. The Academic, Social and
Personal/Emotional subscales of the SACQ each contain an independent set of items with
no overlap across subscales. The final scale concerning goal attachment and commitment
consists of 16 items where 9 items overlap with other scales (Baker et al., 1985; Baker &
Siryk, 1986). The goal attachment and commitment subscale was not considered in the
present investigation.
Although the three subscales (social, academic, personal/emotional) were of
primary consideration in the analyses, the full scale score on the SACQ (reflecting overall
adjustment) was used to test mediational hypotheses in the current study. The full scale
score was computed by averaging of all 67 items. The score for each scale could
theoretically range from 1 to 9 where higher scores are indicative of better adjustment.
Baker and Siryk (1986) demonstrated the validity of the SACQ through its relation
with other indicators of adjustment to college. The SACQ was negatively correlated with
dropout rates in college. Students who reported low scores on the SACQ had higher
dropout rates than did students with higher scores, indicating that better adjustment was
related to completing school. In addition, adjustment scores on the SACQ were related
positively with grade point average, election to academic honour societies, involvement in
social activities, and holding dormitory assistant positions, and negatively related to
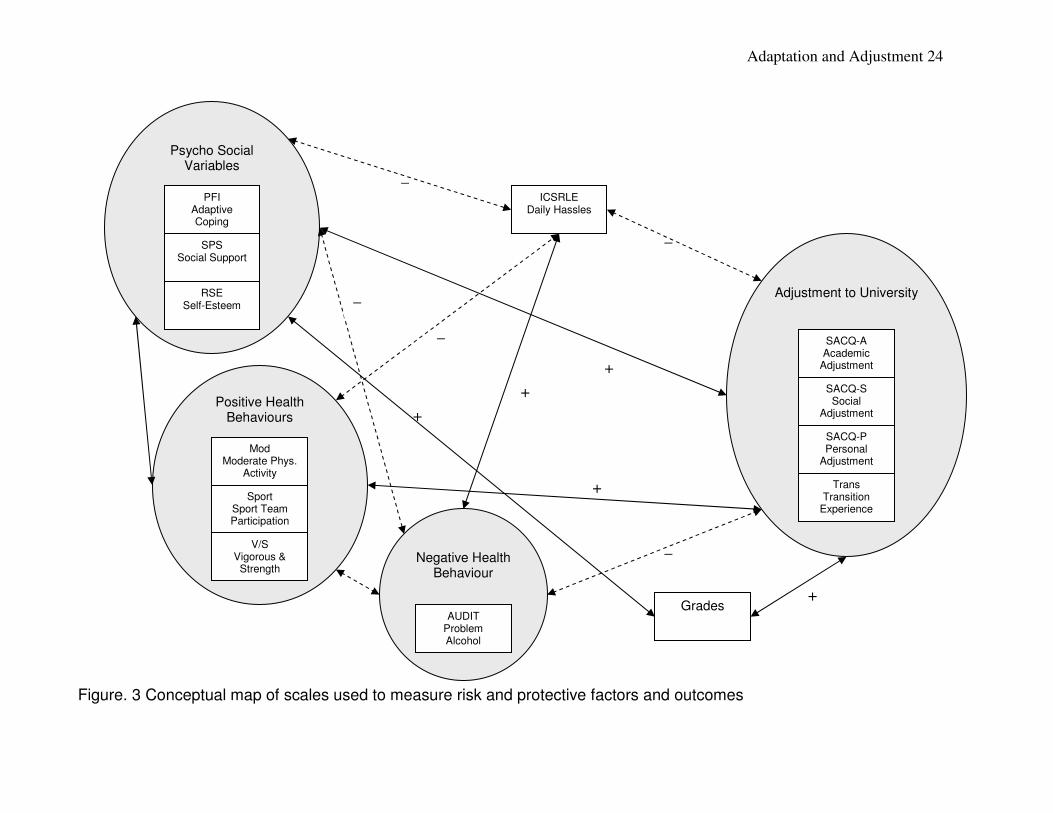
psychological clinic use (Baker et al., 1985; Baker & Siryk, 1986). See Figure 3 for a
conceptual map that shows the scales used to measure the constructs.
2.3 Procedure
Students gave consent and filled out the questionnaire on-line. Leading up to the
second wave of data collection students were contacted via email and asked to take part in
second part of the study. Students were assigned ID numbers by the SONA system (online
data collection service provider) at both data collection time points. Each participant’s
student number (NSID) and system numbers were used to link their data across time. See
Appendix H for consent and debriefing forms.
Adaptation and Adjustment 24
_
+
+
+
+
_
_
_
Psycho Social Variables
ICSRLE Daily Hassles
RSE Self-Esteem
SPS Social Support
PFI Adaptive Coping
Grades
Adjustment to University
Trans Transition
Experience Sport
Sport Team Participation
V/S Vigorous &
Strength
Positive Health Behaviours
SACQ-A Academic
Adjustment
SACQ-P Personal
Adjustment
SACQ-S Social
Adjustment
Figure. 3 Conceptual map of scales used to measure risk and protective factors and outcomes
Mod Moderate Phys.
Activity
AUDIT Problem Alcohol
Negative Health Behaviour
_
+
Adaptation and Adjustment 25
3. Results
3.1 Data Screening
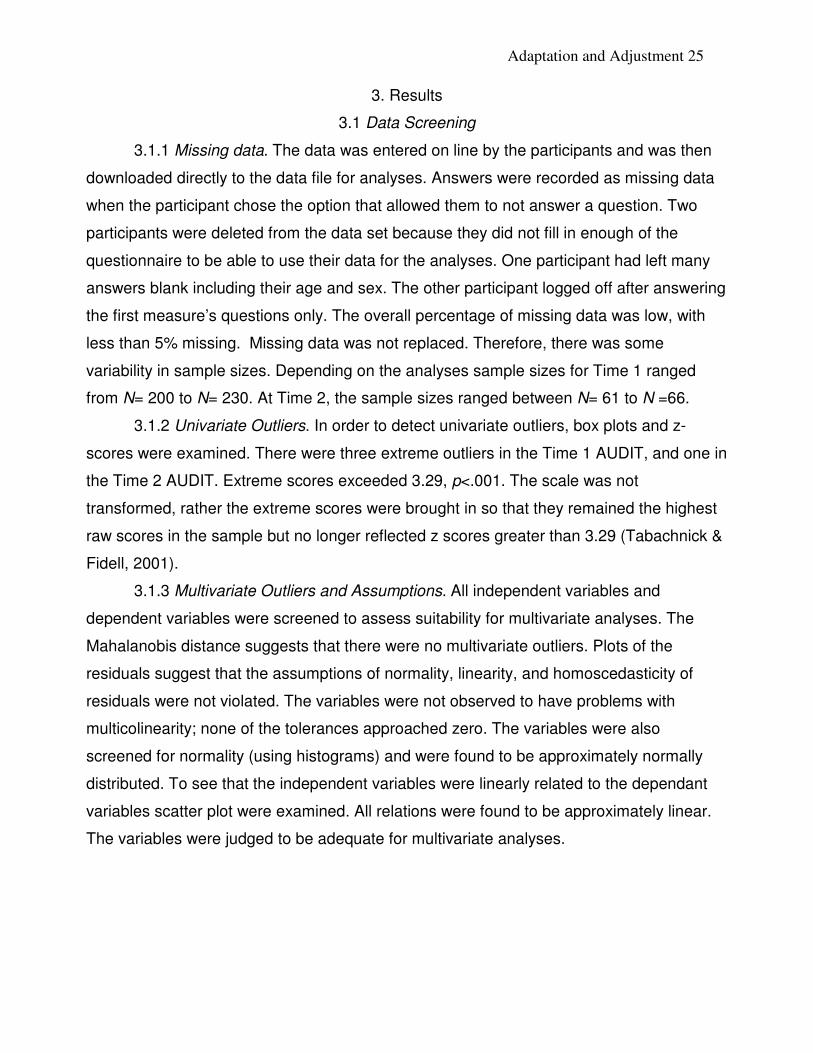
3.1.1 Missing data. The data was entered on line by the participants and was then
downloaded directly to the data file for analyses. Answers were recorded as missing data
when the participant chose the option that allowed them to not answer a question. Two
participants were deleted from the data set because they did not fill in enough of the
questionnaire to be able to use their data for the analyses. One participant had left many
answers blank including their age and sex. The other participant logged off after answering
the first measure’s questions only. The overall percentage of missing data was low, with
less than 5% missing. Missing data was not replaced. Therefore, there was some
variability in sample sizes. Depending on the analyses sample sizes for Time 1 ranged
from N= 200 to N= 230. At Time 2, the sample sizes ranged between N= 61 to N =66.
3.1.2 Univariate Outliers. In order to detect univariate outliers, box plots and z-
scores were examined. There were three extreme outliers in the Time 1 AUDIT, and one in
the Time 2 AUDIT. Extreme scores exceeded 3.29, p<.001. The scale was not
transformed, rather the extreme scores were brought in so that they remained the highest
raw scores in the sample but no longer reflected z scores greater than 3.29 (Tabachnick &
Fidell, 2001).
3.1.3 Multivariate Outliers and Assumptions. All independent variables and
dependent variables were screened to assess suitability for multivariate analyses. The
Mahalanobis distance suggests that there were no multivariate outliers. Plots of the
residuals suggest that the assumptions of normality, linearity, and homoscedasticity of
residuals were not violated. The variables were not observed to have problems with
multicolinearity; none of the tolerances approached zero. The variables were also
screened for normality (using histograms) and were found to be approximately normally
distributed. To see that the independent variables were linearly related to the dependant
variables scatter plot were examined. All relations were found to be approximately linear.
The variables were judged to be adequate for multivariate analyses.
Adaptation and Adjustment 26
3.2 Preliminary Analyses
3.2.1 Reliabilities
A reliability analysis was conducted on each of the scales employed in the present
study. All scales demonstrated an acceptable level of reliability with most alpha values at
.80 or greater. In cases where values fell below .80, internal consistencies were
nevertheless considered adequate. Alpha values that did fall below .80 remained above
.70. Although acceptable alpha levels are largely determined by the amount of error in
measurement that a researcher is willing to accept, an alpha of .70 or higher is commonly
used in social science (Garson, 2007). The alpha obtained for the full scale score on the
SACQ was observed to be .94 at Time 1. All other alpha reliabilities are presented on the
diagonal in the correlation Table 1 and Table 2.
3.2.2 Completers versus non-completers
Chi-square tests were conducted for gender and living situation in order to look for a
difference in group composition between the group of participants who completed the
questionnaire at Time 1 and Time 2 (completers) and those who provided information at
Time 1 only (non-completers). There was a significant association between gender and
completion status, x2(1, N=230) = 9.82, p =.002. Fewer men than were expected on the
basis of chance completed the survey at Time 2. Specifically, only 7 men completed the
survey at Time 2 despite an expected count of 16. At Time 1, 21.9 % of the sample’s
participants were men. At Time 2, only 9.5 % of the sample consisted of men. Given this
low number, men were excluded from all analyses involving Time 2 data. There was no
statistically significant association between completion status and living situation (at home
or away from home).
Additional analyses in the form of t-tests were conducted to compare completers
and non-completers across age and academic achievement (self-reported grades) as well
as key outcome variables including perceived transition experience and adjustment to
university. Analyses revealed that completers and non-completers did not differ
significantly from one another at Time 1 in terms of age, grades achieved in the first
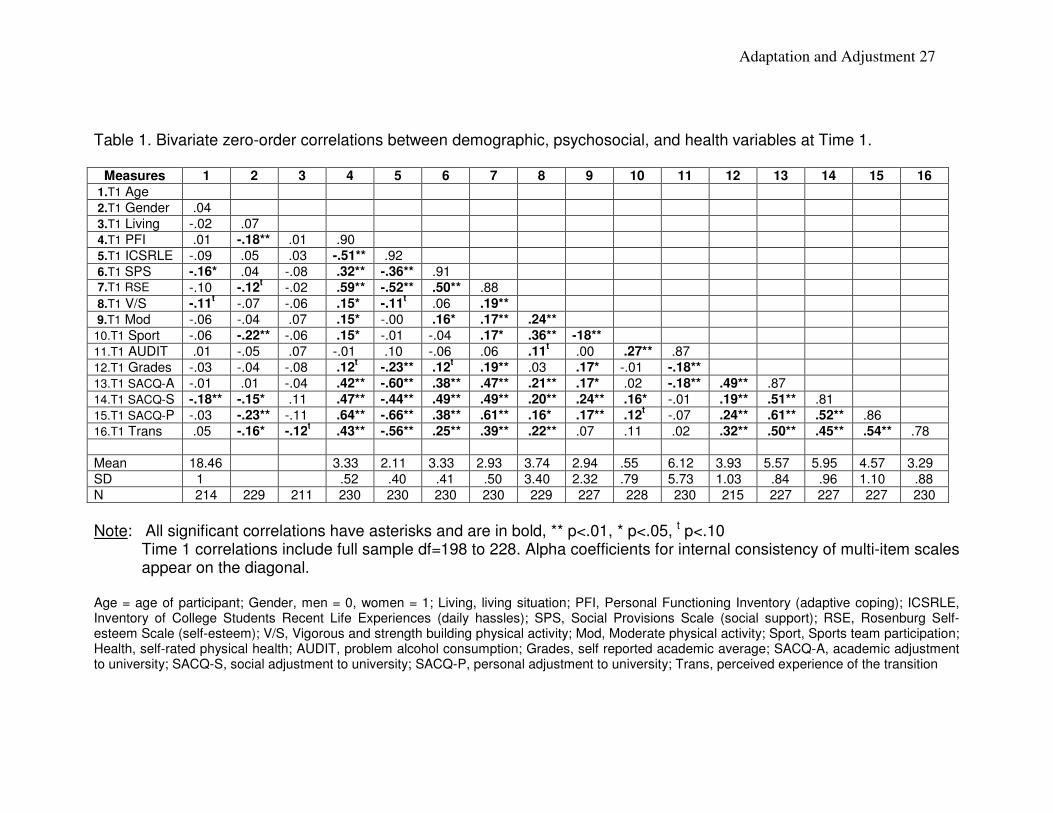
Adaptation and Adjustment 27
Table 1. Bivariate zero-order correlations between demographic, psychosocial, and health variables at Time 1.
Measures 1 2 3 4 5 6 7 8 9 10 11 12 13 14 15 16
1.T1 Age 2.T1 Gender .04 3.T1 Living -.02 .07 4.T1 PFI .01 -.18** .01 .90 5.T1 ICSRLE -.09 .05 .03 -.51** .92 6.T1 SPS -.16* .04 -.08 .32** -.36** .91 7.T1 RSE -.10 -.12
t -.02 .59** -.52** .50** .88
8.T1 V/S -.11t -.07 -.06 .15* -.11
t .06 .19**
9.T1 Mod -.06 -.04 .07 .15* -.00 .16* .17** .24** 10.T1 Sport -.06 -.22** -.06 .15* -.01 -.04 .17* .36** -18** 11.T1 AUDIT .01 -.05 .07 -.01 .10 -.06 .06 .11
t .00 .27** .87
12.T1 Grades -.03 -.04 -.08 .12t -.23** .12
t .19** .03 .17* -.01 -.18**
13.T1 SACQ-A -.01 .01 -.04 .42** -.60** .38** .47** .21** .17* .02 -.18** .49** .87 14.T1 SACQ-S -.18** -.15* .11 .47** -.44** .49** .49** .20** .24** .16* -.01 .19** .51** .81 15.T1 SACQ-P -.03 -.23** -.11 .64** -.66** .38** .61** .16* .17** .12
t -.07 .24** .61** .52** .86
16.T1 Trans .05 -.16* -.12t .43** -.56** .25** .39** .22** .07 .11 .02 .32** .50** .45** .54** .78
Mean 18.46 3.33 2.11 3.33 2.93 3.74 2.94 .55 6.12 3.93 5.57 5.95 4.57 3.29 SD 1 .52 .40 .41 .50 3.40 2.32 .79 5.73 1.03 .84 .96 1.10 .88 N 214 229 211 230 230 230 230 229 227 228 230 215 227 227 227 230
Note: All significant correlations have asterisks and are in bold, ** p<.01, * p<.05, t p<.10 Time 1 correlations include full sample df=198 to 228. Alpha coefficients for internal consistency of multi-item scales appear on the diagonal.
Age = age of participant; Gender, men = 0, women = 1; Living, living situation; PFI, Personal Functioning Inventory (adaptive coping); ICSRLE, Inventory of College Students Recent Life Experiences (daily hassles); SPS, Social Provisions Scale (social support); RSE, Rosenburg Self-esteem Scale (self-esteem); V/S, Vigorous and strength building physical activity; Mod, Moderate physical activity; Sport, Sports team participation; Health, self-rated physical health; AUDIT, problem alcohol consumption; Grades, self reported academic average; SACQ-A, academic adjustment to university; SACQ-S, social adjustment to university; SACQ-P, personal adjustment to university; Trans, perceived experience of the transition
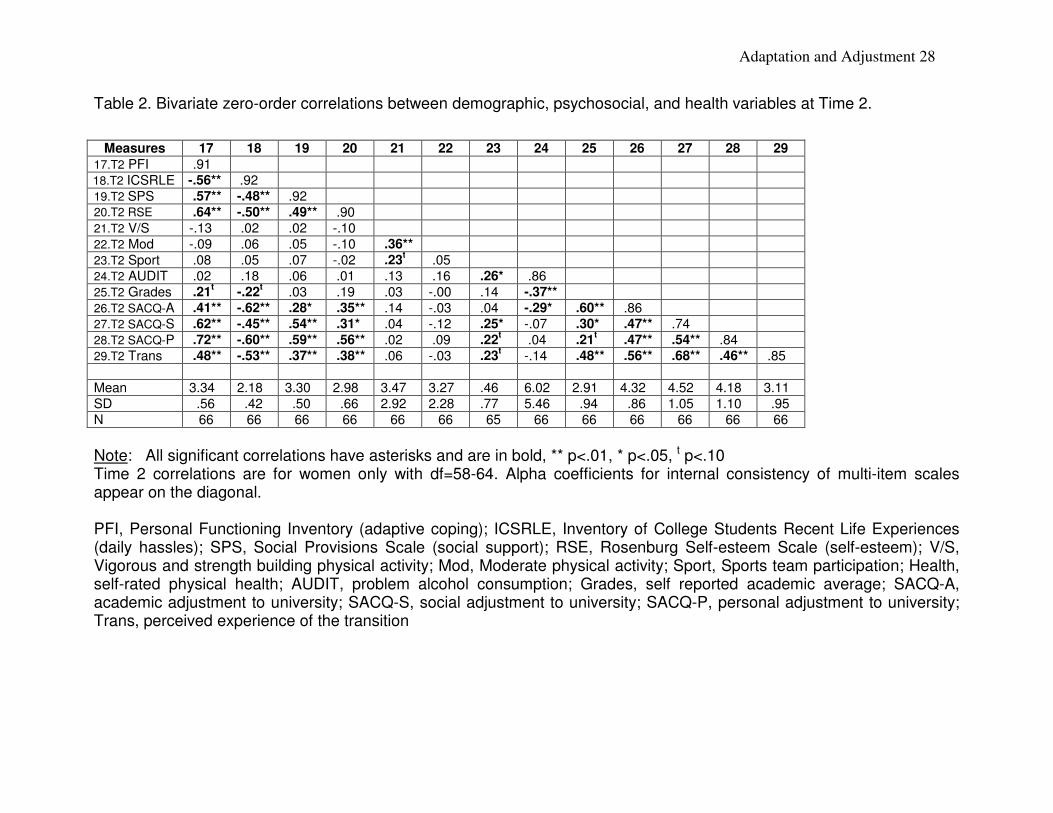
Adaptation and Adjustment 28
Table 2. Bivariate zero-order correlations between demographic, psychosocial, and health variables at Time 2.
Measures 17 18 19 20 21 22 23 24 25 26 27 28 29
17.T2 PFI .91 18.T2 ICSRLE -.56** .92 19.T2 SPS .57** -.48** .92 20.T2 RSE .64** -.50** .49** .90 21.T2 V/S -.13 .02 .02 -.10 22.T2 Mod -.09 .06 .05 -.10 .36** 23.T2 Sport .08 .05 .07 -.02 .23
t .05
24.T2 AUDIT .02 .18 .06 .01 .13 .16 .26* .86 25.T2 Grades .21
t -.22
t .03 .19 .03 -.00 .14 -.37**
26.T2 SACQ-A .41** -.62** .28* .35** .14 -.03 .04 -.29* .60** .86 27.T2 SACQ-S .62** -.45** .54** .31* .04 -.12 .25* -.07 .30* .47** .74 28.T2 SACQ-P .72** -.60** .59** .56** .02 .09 .22
t .04 .21
t .47** .54** .84
29.T2 Trans .48** -.53** .37** .38** .06 -.03 .23t -.14 .48** .56** .68** .46** .85
Mean 3.34 2.18 3.30 2.98 3.47 3.27 .46 6.02 2.91 4.32 4.52 4.18 3.11 SD .56 .42 .50 .66 2.92 2.28 .77 5.46 .94 .86 1.05 1.10 .95 N 66 66 66 66 66 66 65 66 66 66 66 66 66
Note: All significant correlations have asterisks and are in bold, ** p<.01, * p<.05, t p<.10 Time 2 correlations are for women only with df=58-64. Alpha coefficients for internal consistency of multi-item scales appear on the diagonal.
PFI, Personal Functioning Inventory (adaptive coping); ICSRLE, Inventory of College Students Recent Life Experiences (daily hassles); SPS, Social Provisions Scale (social support); RSE, Rosenburg Self-esteem Scale (self-esteem); V/S, Vigorous and strength building physical activity; Mod, Moderate physical activity; Sport, Sports team participation; Health, self-rated physical health; AUDIT, problem alcohol consumption; Grades, self reported academic average; SACQ-A, academic adjustment to university; SACQ-S, social adjustment to university; SACQ-P, personal adjustment to university; Trans, perceived experience of the transition
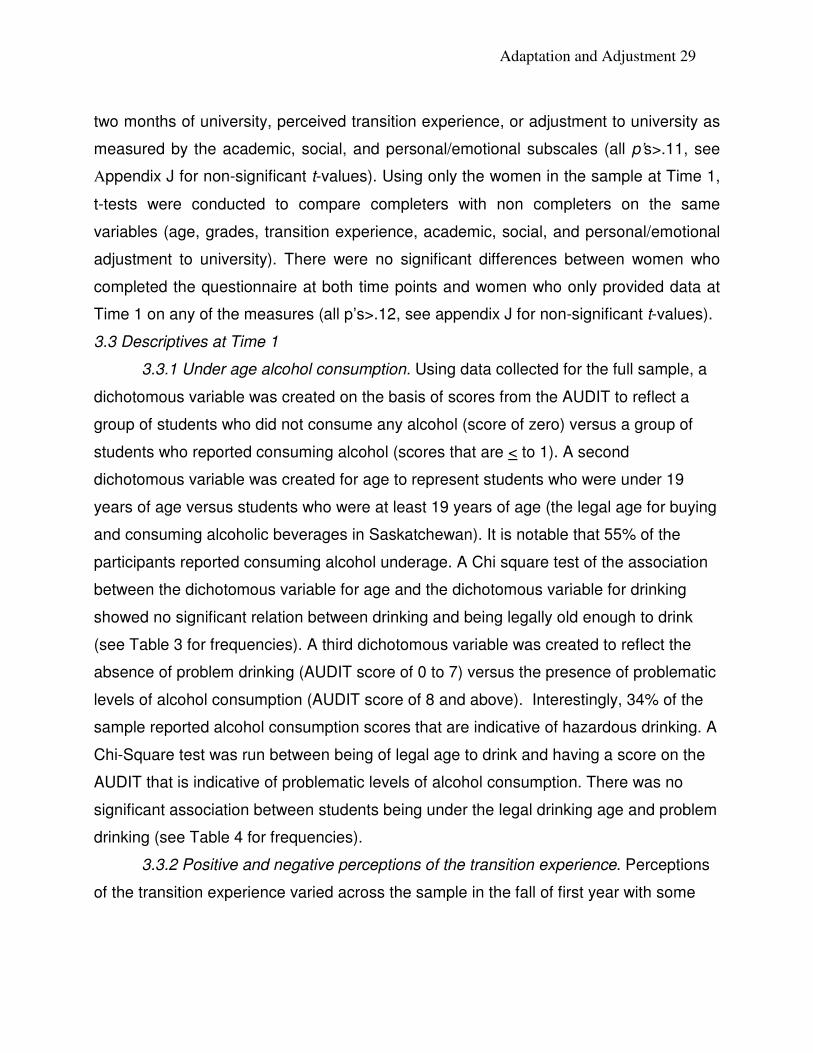
Adaptation and Adjustment 29
two months of university, perceived transition experience, or adjustment to university as
measured by the academic, social, and personal/emotional subscales (all p’s>.11, see
Appendix J for non-significant t-values). Using only the women in the sample at Time 1,
t-tests were conducted to compare completers with non completers on the same
variables (age, grades, transition experience, academic, social, and personal/emotional
adjustment to university). There were no significant differences between women who
completed the questionnaire at both time points and women who only provided data at
Time 1 on any of the measures (all p’s>.12, see appendix J for non-significant t-values).
3.3 Descriptives at Time 1
3.3.1 Under age alcohol consumption. Using data collected for the full sample, a
dichotomous variable was created on the basis of scores from the AUDIT to reflect a
group of students who did not consume any alcohol (score of zero) versus a group of
students who reported consuming alcohol (scores that are < to 1). A second
dichotomous variable was created for age to represent students who were under 19
years of age versus students who were at least 19 years of age (the legal age for buying
and consuming alcoholic beverages in Saskatchewan). It is notable that 55% of the
participants reported consuming alcohol underage. A Chi square test of the association
between the dichotomous variable for age and the dichotomous variable for drinking
showed no significant relation between drinking and being legally old enough to drink
(see Table 3 for frequencies). A third dichotomous variable was created to reflect the
absence of problem drinking (AUDIT score of 0 to 7) versus the presence of problematic
levels of alcohol consumption (AUDIT score of 8 and above). Interestingly, 34% of the
sample reported alcohol consumption scores that are indicative of hazardous drinking. A
Chi-Square test was run between being of legal age to drink and having a score on the
AUDIT that is indicative of problematic levels of alcohol consumption. There was no
significant association between students being under the legal drinking age and problem
drinking (see Table 4 for frequencies).
3.3.2 Positive and negative perceptions of the transition experience. Perceptions
of the transition experience varied across the sample in the fall of first year with some
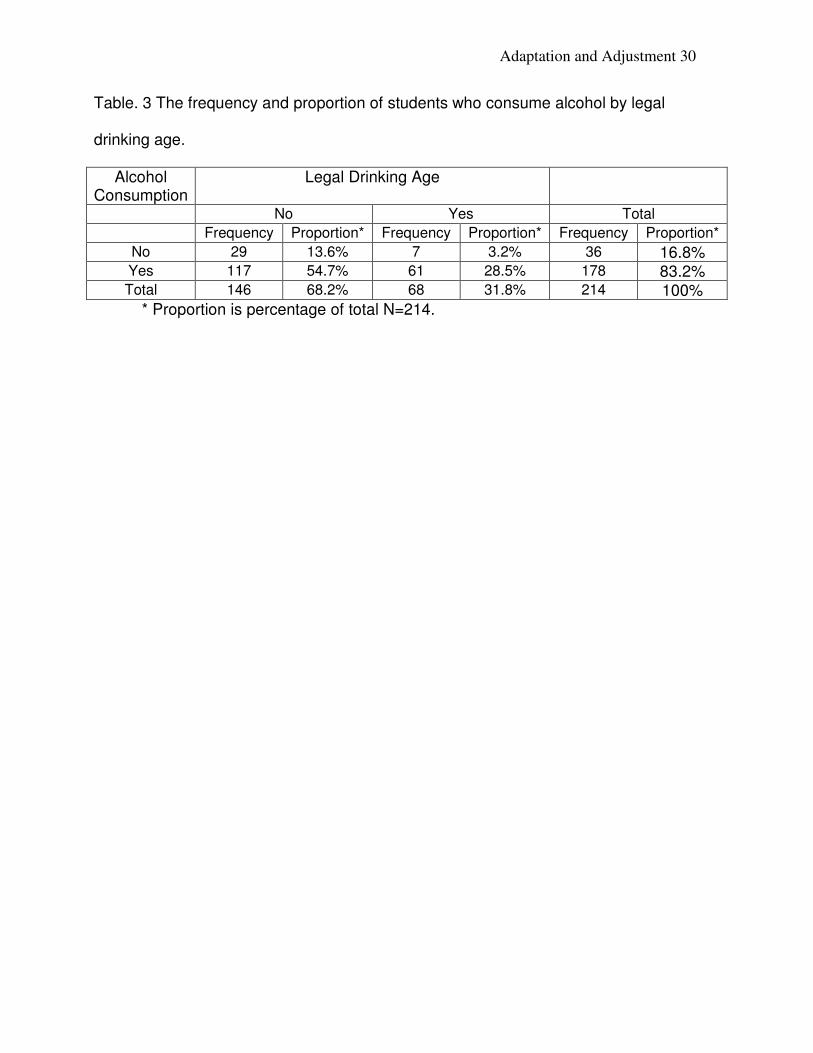
Adaptation and Adjustment 30
Table. 3 The frequency and proportion of students who consume alcohol by legal
drinking age.
Alcohol Consumption
Legal Drinking Age
No Yes Total
Frequency Proportion* Frequency Proportion* Frequency Proportion* No 29 13.6% 7 3.2% 36 16.8% Yes 117 54.7% 61 28.5% 178 83.2% Total 146 68.2% 68 31.8% 214 100%
* Proportion is percentage of total N=214.
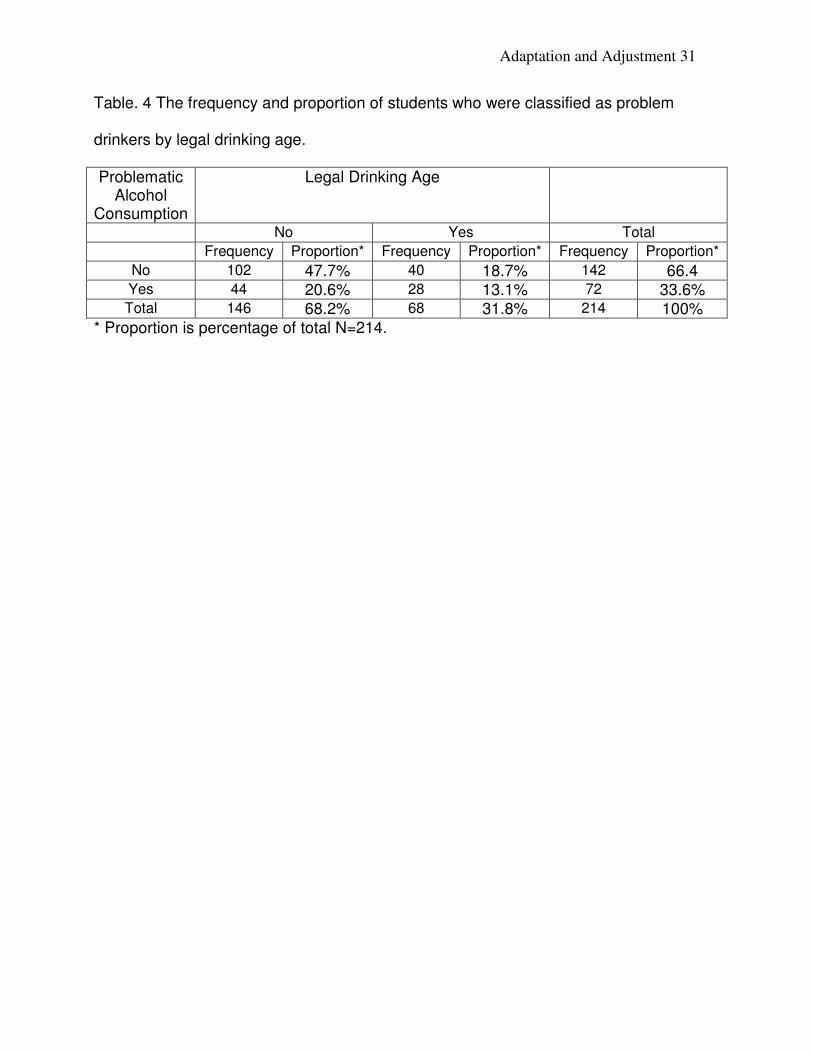
Adaptation and Adjustment 31
Table. 4 The frequency and proportion of students who were classified as problem
drinkers by legal drinking age.
Problematic Alcohol
Consumption
Legal Drinking Age
No Yes Total
Frequency Proportion* Frequency Proportion* Frequency Proportion* No 102 47.7% 40 18.7% 142 66.4 Yes 44 20.6% 28 13.1% 72 33.6% Total 146 68.2% 68 31.8% 214 100%
* Proportion is percentage of total N=214.
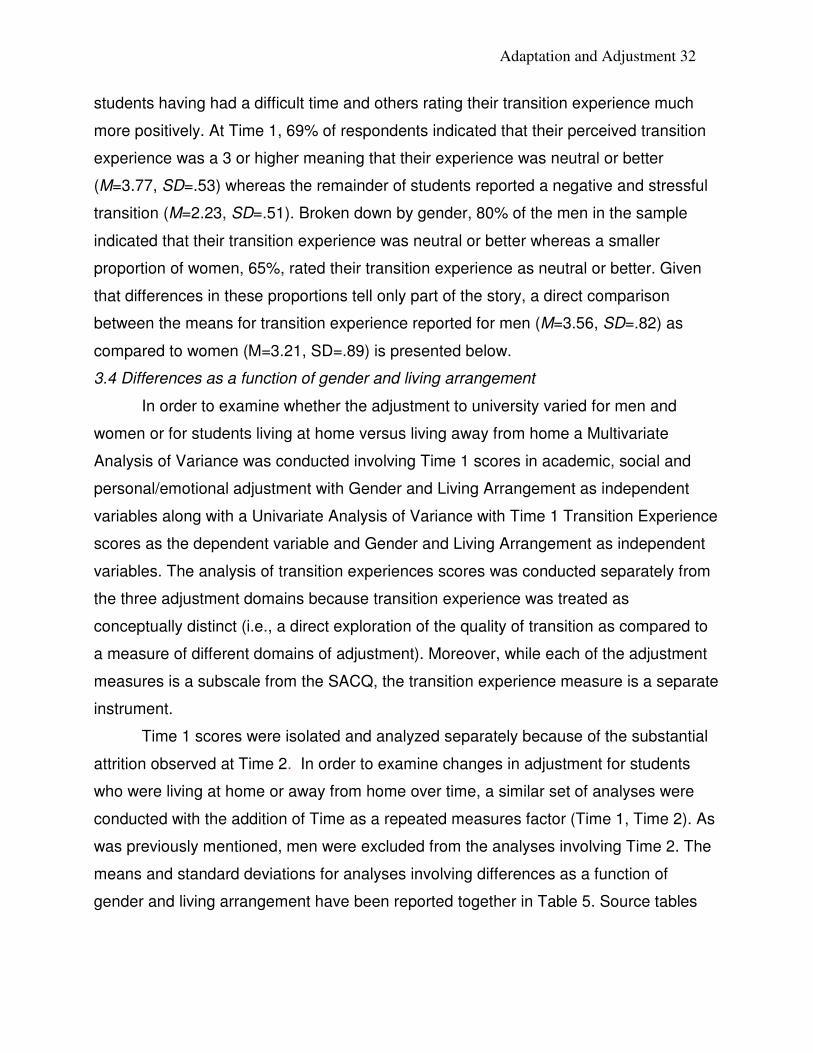
Adaptation and Adjustment 32
students having had a difficult time and others rating their transition experience much
more positively. At Time 1, 69% of respondents indicated that their perceived transition
experience was a 3 or higher meaning that their experience was neutral or better
(M=3.77, SD=.53) whereas the remainder of students reported a negative and stressful
transition (M=2.23, SD=.51). Broken down by gender, 80% of the men in the sample
indicated that their transition experience was neutral or better whereas a smaller
proportion of women, 65%, rated their transition experience as neutral or better. Given
that differences in these proportions tell only part of the story, a direct comparison
between the means for transition experience reported for men (M=3.56, SD=.82) as
compared to women (M=3.21, SD=.89) is presented below.
3.4 Differences as a function of gender and living arrangement
In order to examine whether the adjustment to university varied for men and
women or for students living at home versus living away from home a Multivariate
Analysis of Variance was conducted involving Time 1 scores in academic, social and
personal/emotional adjustment with Gender and Living Arrangement as independent
variables along with a Univariate Analysis of Variance with Time 1 Transition Experience
scores as the dependent variable and Gender and Living Arrangement as independent
variables. The analysis of transition experiences scores was conducted separately from
the three adjustment domains because transition experience was treated as
conceptually distinct (i.e., a direct exploration of the quality of transition as compared to
a measure of different domains of adjustment). Moreover, while each of the adjustment
measures is a subscale from the SACQ, the transition experience measure is a separate
instrument.
Time 1 scores were isolated and analyzed separately because of the substantial
attrition observed at Time 2. In order to examine changes in adjustment for students
who were living at home or away from home over time, a similar set of analyses were
conducted with the addition of Time as a repeated measures factor (Time 1, Time 2). As
was previously mentioned, men were excluded from the analyses involving Time 2. The
means and standard deviations for analyses involving differences as a function of
gender and living arrangement have been reported together in Table 5. Source tables
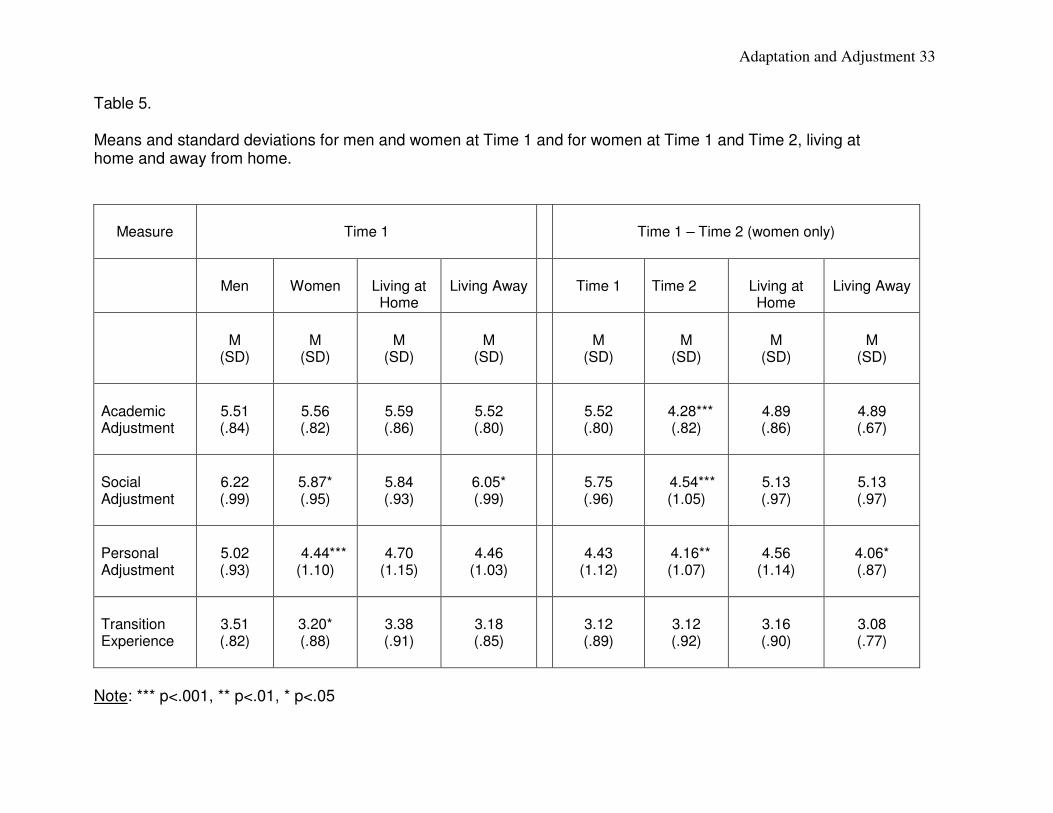
Adaptation and Adjustment 33
Table 5. Means and standard deviations for men and women at Time 1 and for women at Time 1 and Time 2, living at home and away from home.
Measure
Time 1
Time 1 – Time 2 (women only)
Men
Women
Living at Home
Living Away
Time 1
Time 2
Living at Home
Living Away
M
(SD)
M
(SD)
M
(SD)
M
(SD)
M
(SD)
M
(SD)
M
(SD)
M
(SD)
Academic Adjustment
5.51 (.84)
5.56 (.82)
5.59 (.86)
5.52 (.80)
5.52 (.80)
4.28***
(.82)
4.89 (.86)
4.89 (.67)
Social Adjustment
6.22 (.99)
5.87* (.95)
5.84 (.93)
6.05* (.99)
5.75 (.96)
4.54***
(1.05)
5.13 (.97)
5.13 (.97)
Personal Adjustment
5.02 (.93)
4.44***
(1.10)
4.70
(1.15)
4.46
(1.03)
4.43
(1.12)
4.16** (1.07)
4.56
(1.14)
4.06* (.87)
Transition Experience
3.51 (.82)
3.20* (.88)
3.38 (.91)
3.18 (.85)
3.12 (.89)
3.12 (.92)
3.16 (.90)
3.08 (.77)
Note: *** p<.001, ** p<.01, * p<.05
Adaptation and Adjustment 34
showing all significant and non-significant results for the following analyses appear in
Appendix K for the interested reader.
3.4.1 Gender and living arrangement at Time 1. Results of the MANOVA revealed
a significant main effect for gender on the best linear combination of the dependent
variables; social, academic, and personal/emotional adjustment to university,
F(3,203)=7.35, p<.001, partial eta2= .10. There was also a significant main effect for
living situation (living at home versus away from home), F(3,203)=2.81,p=.041, partial
eta2=.04. At the multivariate level, the interaction between gender and living situation
was not significant.
The tests of between-subject effects at the univariate level showed a significant
difference between men and women on social adjustment scores, F(1,205)=5.22,
p=.023, partial eta2=.03, with men scoring significantly higher than women (see Table
4).There was also a significant difference between men and women on
personal/emotional adjustment scores, F(1,205)=10.52, p=.001, partial eta2=.05 where
on average, men reported higher personal adjustment as compared to women. There
was no significant difference between men and women on academic adjustment.
Univariate tests involving living situation as the independent variable showed a
significant difference in social adjustment scores favouring students who were living
away from home in the fall of their first year as compared to, students who were living at
home, F(1,205)=5.04,p=.026, partial eta2=.02. There was no significant difference
between students living at home or away from home on academic or personal/emotional
adjustment.
The univariate ANOVA conducted to investigate the effects of gender and living
situation on perceived transition experience revealed that men rated the transition more
positively as compared to women at Time 1, F(1,207)=4.37,p=.038, partial eta2= .02.
Transition experience scores were not observed to vary significantly across living
arrangement (home versus away) nor were gender and living arrangement observed to
interact in this case.
3.4.2 Adjustment by Living arrangement across Time 1 and Time 2. Results of the
Multivariate Repeated Measures Analysis of Variance conducted to examine whether
each of the three sub-scales of adjustment (social, academic, personal/emotional)
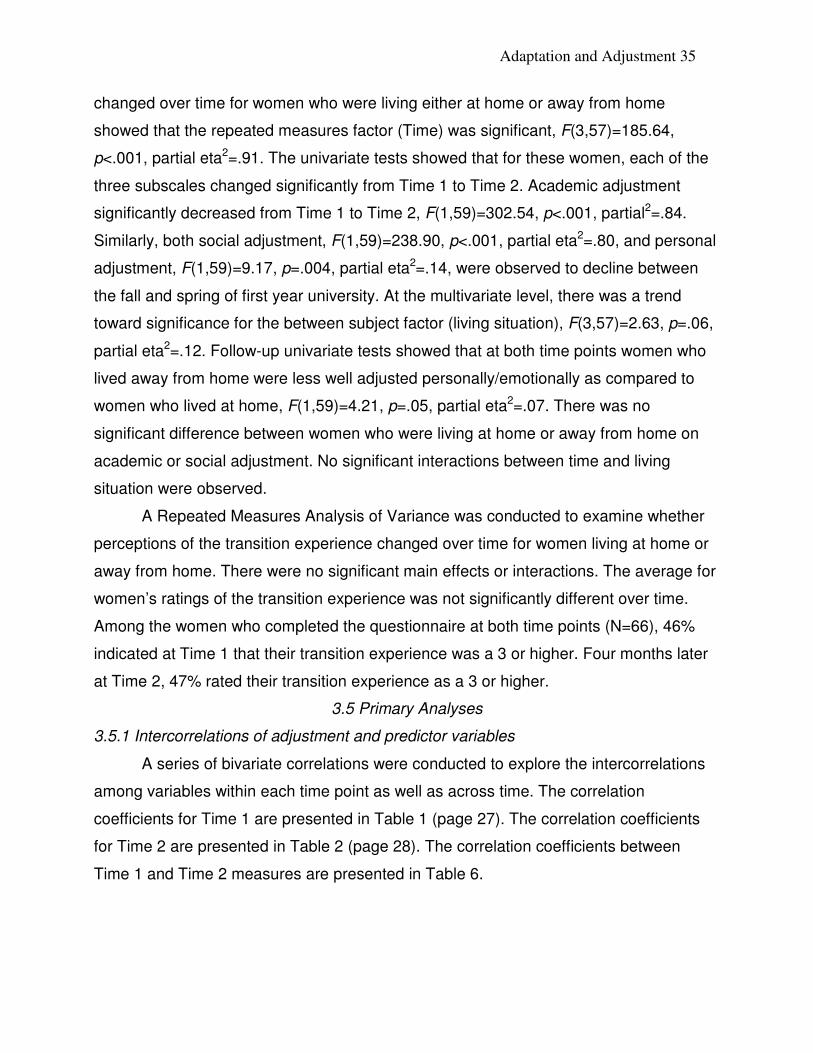
Adaptation and Adjustment 35
changed over time for women who were living either at home or away from home
showed that the repeated measures factor (Time) was significant, F(3,57)=185.64,
p<.001, partial eta2=.91. The univariate tests showed that for these women, each of the
three subscales changed significantly from Time 1 to Time 2. Academic adjustment
significantly decreased from Time 1 to Time 2, F(1,59)=302.54, p<.001, partial2=.84.
Similarly, both social adjustment, F(1,59)=238.90, p<.001, partial eta2=.80, and personal
adjustment, F(1,59)=9.17, p=.004, partial eta2=.14, were observed to decline between
the fall and spring of first year university. At the multivariate level, there was a trend
toward significance for the between subject factor (living situation), F(3,57)=2.63, p=.06,
partial eta2=.12. Follow-up univariate tests showed that at both time points women who
lived away from home were less well adjusted personally/emotionally as compared to
women who lived at home, F(1,59)=4.21, p=.05, partial eta2=.07. There was no
significant difference between women who were living at home or away from home on
academic or social adjustment. No significant interactions between time and living
situation were observed.
A Repeated Measures Analysis of Variance was conducted to examine whether
perceptions of the transition experience changed over time for women living at home or
away from home. There were no significant main effects or interactions. The average for
women’s ratings of the transition experience was not significantly different over time.
Among the women who completed the questionnaire at both time points (N=66), 46%
indicated at Time 1 that their transition experience was a 3 or higher. Four months later
at Time 2, 47% rated their transition experience as a 3 or higher.
3.5 Primary Analyses
3.5.1 Intercorrelations of adjustment and predictor variables
A series of bivariate correlations were conducted to explore the intercorrelations
among variables within each time point as well as across time. The correlation
coefficients for Time 1 are presented in Table 1 (page 27). The correlation coefficients
for Time 2 are presented in Table 2 (page 28). The correlation coefficients between
Time 1 and Time 2 measures are presented in Table 6.
Adaptation and Adjustment 36
Table 6. Bivariate zero-order correlations between Time 1 and Time 2 demographic, psychosocial, and health variables.
Measures T1
Age(W) T1
Livng(W) T1 PFI
T1 ICSRLE
T1 SPS
T1 RSE
T1 V/S
T1 Mod
T1 Sport
T1 AUDIT
T1 Grades
T1 SACQ-A
T1 SACQ-S
T1 SACQ-P
T1 Trans
T2 PFI .19 -.03 .81** -.45** .48** .62** .09 .08 .15 .15 -.04 .37** .54** .56** .31* T2 ICSRLE -.14 .09 -.55** .74** -.32** -.49** -.12 -.16 -.14 .09 -.09 -.57** -.27* -.56** -.49** T2 SPS .02 -.05 .54** -.43** .82** .63** .06 -.00 .27* .14 -.21
t .35** .48** .60** .28*
T2 RSE .26* .12 .50** -.45** .39** .64** .11 .12 .03 .10 .05 .31* .26* .44** .25* T2 V/S -.10 .14 -.07 -.11 .10 .04 .54** .12 .06 .11 -.01 .11 .14 . 08 .07 T2 Mod -.17 -.11 .00 .04 .05 .10 .30* .33** .17 .20 .06 .04 .02 .15 .-.02 T2 Sport -.08 .05 -.03 -.09 .07 .20 .21
t -.10 .49** .16 -.01 .01 .34** .25* .26*
T2 AUDIT .10 -.00 -.06 .09 .11 -.00 .03 -.02 .08 .86** -.23t -.28* .10 -.06 -.01
T2 Grades .07 -.09 .13 -.17 .12 .18 .17 .17 .08 -.43** .71** .53** .22t .25* .31*
T2 SACQ-A .17 .06 .40** -.52** .24t .36** .36** .18 .05 -.34** .35** .80** .34** .48** .39**
T2 SACQ-S -.06 -.04 .53** -.45** .41** .41** .16 -.02 .15 -.12 -.02 .52** .83** .54** .42** T2 SACQ-P .08 -.25* .61** -.46** .50** .69** .20 .19 .21
t .11 .07 .50** .44** .81** .42**
T2 Trans .04 -.00 .47** -.52** .28* .44** .28* .18 .12 -.18 .33** .61** .59** .51** .68**
Note: All significant correlations have asterisks and are in bold, ** p<.01, * p<.05, t p<.10 Correlations are for women only with df=58 to 64.
Adaptation and Adjustment 37
3.5.2 Concurrent Prediction of Early (Time1) Adjustment to University
3.5.2.1 Overview. In order to examine individual differences in markers of early
adjustment to the transition (Time 1), a series of standard regression analyses were
conducted using academic adjustment, social adjustment, personal adjustment, and
transition experience as criterion variables. For each regression, the criterion was
predicted using a standard set of demographic and self-report indices of functioning.
This standard set was created for use in all four regressions in order to increase the
comparability across the regression analysis. The standard set was chosen based on
zero-order correlations with the criterion variables. Each predictor variable was included
in the standard set if it shared a zero order correlation with at least two of the four
criterion variables. The standard set of predictor variables consisted of gender, adaptive
coping, daily hassles, social support, self esteem, vigorous and strength building
physical activity, moderate physical activity, and academic average. All predictor
variables were entered simultaneously on one step.
3.5.2.2 Transition Experience at Time 1. Results revealed that the combined
variables accounted for 42.5% of the variability in early transition experience measured
in the fall of first year. An inspection of the individual standardized beta weights (See
Table 7) indicated that adaptive coping, daily hassles, level of vigorous and strength
building physical activity, and academic average were uniquely predictive of the fall
transition experience when other variables were controlled. Specifically, more positive
perceptions of the transition to university were associated with higher levels of adaptive
coping, lower levels of daily hassles, higher levels of vigorous and strength building
physical activity, and better academic achievement (academic average). In addition, a
better transition experience was marginally predicted by the gender of the respondent
with men perceiving the transition more positively. The squared semi-partial correlations
demonstrated that 10% of the unique variance in transition experience at Time 1 can be
accounted for by daily hassles. Academic grades accounted for approximately 4% of the
unique variance in transition experience while 2% of the unique variance in transition
experience was accounted for by vigorous and strength building activities. Adaptive
coping accounted for 1.5 % of the unique variance in early transition experience.
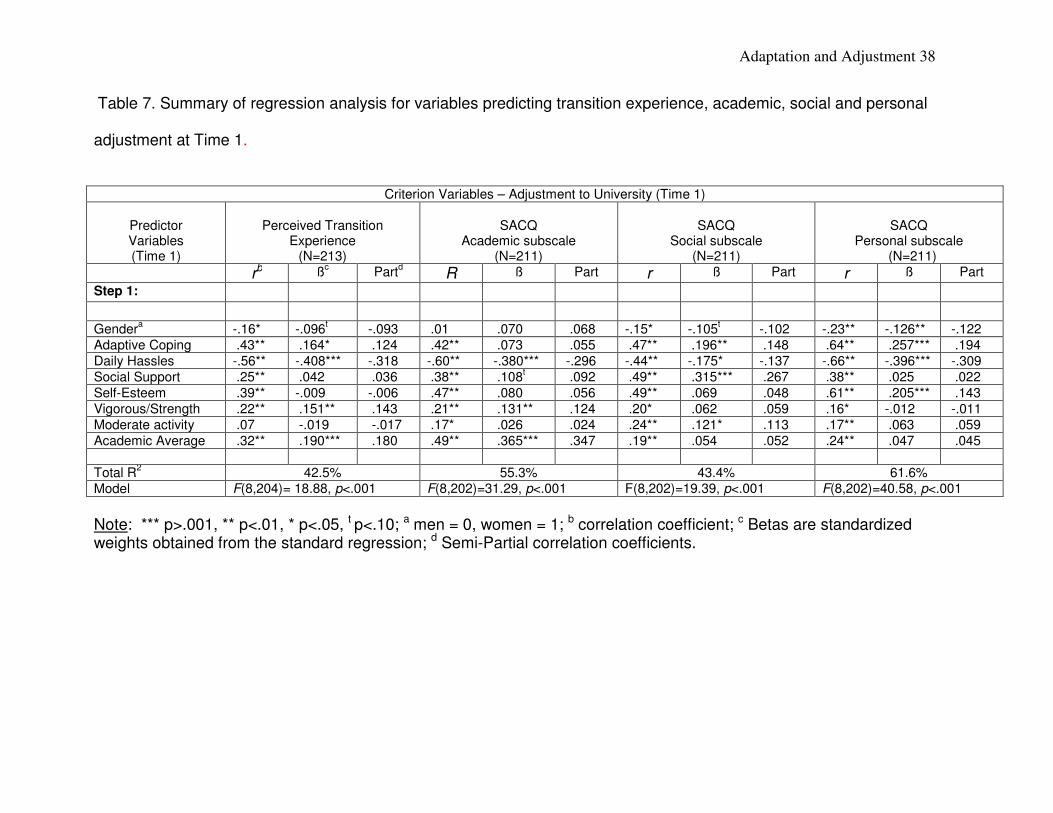
Adaptation and Adjustment 38
Table 7. Summary of regression analysis for variables predicting transition experience, academic, social and personal
adjustment at Time 1.
Criterion Variables – Adjustment to University (Time 1)
Predictor Variables (Time 1)
Perceived Transition
Experience (N=213)
SACQ
Academic subscale (N=211)
SACQ
Social subscale (N=211)
SACQ
Personal subscale (N=211)
rb ßc Part
d R ß Part r ß Part r ß Part
Step 1: Gender
a -.16* -.096
t -.093 .01 .070 .068 -.15* -.105
t -.102 -.23** -.126** -.122
Adaptive Coping .43** .164* .124 .42** .073 .055 .47** .196** .148 .64** .257*** .194 Daily Hassles -.56** -.408*** -.318 -.60** -.380*** -.296 -.44** -.175* -.137 -.66** -.396*** -.309 Social Support .25** .042 .036 .38** .108
t .092 .49** .315*** .267 .38** .025 .022
Self-Esteem .39** -.009 -.006 .47** .080 .056 .49** .069 .048 .61** .205*** .143 Vigorous/Strength .22** .151** .143 .21** .131** .124 .20* .062 .059 .16* -.012 -.011 Moderate activity .07 -.019 -.017 .17* .026 .024 .24** .121* .113 .17** .063 .059 Academic Average .32** .190*** .180 .49** .365*** .347 .19** .054 .052 .24** .047 .045 Total R
2 42.5% 55.3% 43.4% 61.6%
Model F(8,204)= 18.88, p<.001 F(8,202)=31.29, p<.001 F(8,202)=19.39, p<.001 F(8,202)=40.58, p<.001
Note: *** p>.001, ** p<.01, * p<.05, t p<.10; a men = 0, women = 1; b correlation coefficient; c Betas are standardized weights obtained from the standard regression; d Semi-Partial correlation coefficients.
Adaptation and Adjustment 39
3.5.2.3 Academic Adjustment at Time 1. Findings showed that approximately
55% of the variance in academic adjustment was accounted for by the set of variables.
An inspection of the individual standardized beta weights (See Table 6) indicated that
lower daily hassles, more vigorous and strength building activities and higher academic
averages were uniquely predictive of better academic adjustment in the fall when other
variables were controlled. The squared semi-partial correlations showed that academic
average accounted for 12% of the variability in academic adjustment. Daily hassles
accounted for almost 9% of the unique variance in academic adjustment, and 1.5% of
the unique variance was accounted for by vigorous and strength building activities.
3.5.2.4 Social Adjustment at Time 1. Results involving social adjustment in the
fall of first year indicated that the variables accounted for 43% of the variance. The
individual standardized beta weights (See Table 6) show that adaptive coping, daily
hassles, social support and moderate physical activity were all significantly predictive of
social adjustment when other variables were controlled. Students who perceived
themselves to be better adjusted socially at the start of the year, were more adaptive in
their coping, reported fewer daily hassles, had greater social support and reported a
higher level of moderate physical activity. Better social adjustment was marginally
predicted by gender, with men demonstrating better social adjustment. The squared
semi-partial correlations show that 7% of the unique variance in social adjustment was
attributable to social support with adaptive coping adding 2% of the unique variance.
Daily hassles accounted for 2% and moderate physical activity accounted for just over
1% of the unique variance in social adjustment.
3.5.2.5 Personal/Emotional Adjustment at Time 1. The predictors accounted for
62% of the variability in personal adjustment measured in the fall of first year. The
respondent’s gender, level of adaptive coping, daily hassles and self-esteem were all
uniquely predictive of personal/emotional adjustment in the fall at Time 1 (Table 6). On
average men reported better personal/emotional adjustment. Higher scores on the
personal/emotional adjustment scale were also associated with higher adaptive coping
scores, fewer reported hassles and higher self-esteem. An examination of the squared
semi-partial correlations shows that daily hassles accounted for 16% of the unique
variance in personal/emotional adjustment while adaptive coping accounted for 7% of
Adaptation and Adjustment 40
the unique variance. Self-esteem accounted for 4% of the unique variance in
personal/emotional adjustment and the gender of the respondent accounted for almost
2% of the unique variance in personal/emotional adjustment.
3.5.3 Longitudinal Prediction of Adjustment to University at Time
3.5.3.1 Overview. To examine the individual differences in adjustment that
occurred over the first year of university, a series of hierarchical regression analyses
were conducted. As noted earlier, men were excluded from these analyses because
only 7 men participated at Time 2. Of interest, then, was whether women’s adjustment to
university at Time 2 could be predicted from measures of psychosocial and physical
health that were collected at Time 1. For example, in an effort to predict academic
adjustment during the second semester from early psychosocial and health variables
(over and above knowing a student’s academic adjustment during first term), academic
adjustment (Time 1) was entered on the first step to control for adjustment level at Time
1. The first step was followed by entering the standard set of psychosocial and physical
health variables (Step 2) that had also been collected at Time 1 to predict variance in
academic adjustment at Time 2 (dependent variable) over and above knowing the level
of academic adjustment at Time 1.
The sample size available for this series of regressions (n=66) was notably
reduced from the original sample size at Time 1, necessitating a reduction in the number
of predictors employed. Accordingly, a subset of psychosocial and physical health
predictors was developed by examining the zero-order correlations between Time 1
predictor variables and Time 2 outcome variables. Only variables that had significant
zero order correlations with at least two of the four outcome variables were included in
the reduced set of predictor variables. Specifically, adaptive coping, daily hassles, social
support, self-esteem, vigorous and strength building activity, and academic average
were included as predictors on Step 2 in these regressions.
3.5.3.2 Stability/Consistency of the outcome measures. In the current regression
strategy adding the Time 1 measure on the first step serves to hold the Time 1
adjustment levels constant in order to predict variability in the measure of adjustment
that changes over time. One way to index the consistency of scores administered at two
time points is by looking at the intercorrelation between scores participants obtain on the
Adaptation and Adjustment 41
measure at both time points (Cramer & Howitt, 2004; Pearson Assessments, 2007).
From a psychometric perspective this is referred to as test-retest reliability. The
associated correlation coefficient is not a measure of whether an individual’s score
remains the same from one time point to the next (as would be measured by a
difference score), but rather whether scores remain stable relative to the scores of other
participants over time (Cramer & Howitt, 2004). The correlation coefficient obtained for
the same measure at two time points can be referred to as a stability coefficient (Bruning
& Kintz, 1997; Pearson Assessments, 2007). Thus, in the prediction of Time 2
adjustment, by first entering the same measure of adjustment at Time 1, we obtain an
estimate of the stability in variance for that adjustment index between Time 1 and Time
2. The remaining or residual variance represents variability in the adjustment index that
changes over time. Of interest in these longitudinal analyses, was whether individual
differences in this “change” could be predicted by psychosocial and physical health
factors.
3.5.3.3 Longitudinal prediction of the transition experience. Results of the
hierarchical regression showed that the transition experience at Time 1 accounted for
46% of the variance in transition experience at Time 2, F(1,63)=54.23, p<.001. The
correlation between the transition experience at Time 1 and the transition experience at
Time 2 was r(64)=.68, p<.01 indicating at least moderate stability in individual reports of
experience over time. The inclusion of psychosocial and health variables on Step 2
increased the proportion of variance explained marginally, F-change (6,57)= 2.15,
p=.06, accounting for an additional 9.9% of the variance. An inspection of the individual
standardized beta weights (See Table 8) indicated that only transition experience at
Time 1 was significantly predictive of the transition experience at the end of the first year
when other variables were controlled. Specifically, better perceived transitions at Time 1
were associated with better perceived transitions at Time 2. On their own, none of the
Time 1 predictor variables were uniquely predictive of perceptions of the transition
experience after perceptions of the transition experience at Time 1 had been controlled.
3.5.3.4 Longitudinal prediction of academic adjustment. Results of the
hierarchical regression showed that 63% of the variance in academic adjustment at
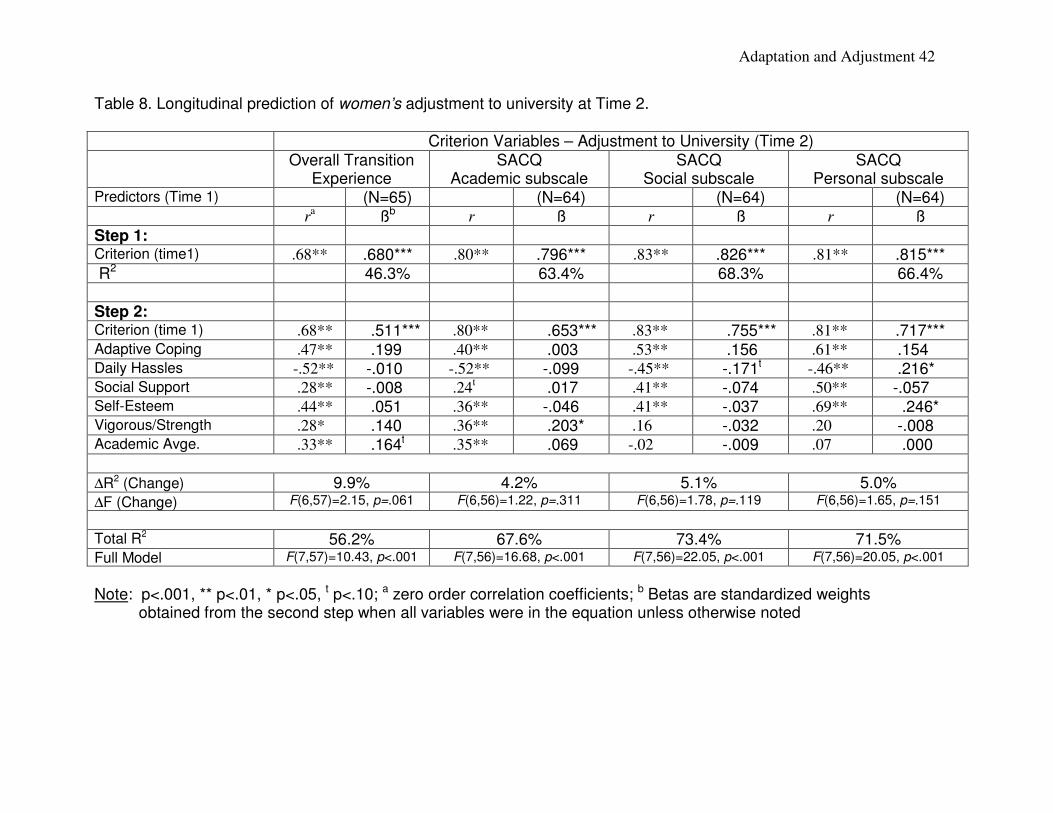
Adaptation and Adjustment 42
Table 8. Longitudinal prediction of women’s adjustment to university at Time 2.
Criterion Variables – Adjustment to University (Time 2) Overall Transition
Experience SACQ
Academic subscale SACQ
Social subscale SACQ
Personal subscale Predictors (Time 1) (N=65) (N=64) (N=64) (N=64) r
a ßb r ß r ß r ß
Step 1:
Criterion (time1) .68** .680*** .80** .796*** .83** .826*** .81** .815*** R2 46.3% 63.4% 68.3% 66.4%
Step 2:
Criterion (time 1) .68** .511*** .80** .653*** .83** .755*** .81** .717*** Adaptive Coping .47** .199 .40** .003 .53** .156 .61** .154 Daily Hassles -.52** -.010 -.52** -.099 -.45** -.171t -.46** .216* Social Support .28** -.008 .24
t .017 .41** -.074 .50** -.057
Self-Esteem .44** .051 .36** -.046 .41** -.037 .69** .246* Vigorous/Strength .28* .140 .36** .203* .16 -.032 .20 -.008 Academic Avge. .33** .164t .35** .069 -.02 -.009 .07 .000
∆R2 (Change) 9.9% 4.2% 5.1% 5.0% ∆F (Change) F(6,57)=2.15, p=.061 F(6,56)=1.22, p=.311 F(6,56)=1.78, p=.119 F(6,56)=1.65, p=.151
Total R2 56.2% 67.6% 73.4% 71.5% Full Model F(7,57)=10.43, p<.001 F(7,56)=16.68, p<.001 F(7,56)=22.05, p<.001 F(7,56)=20.05, p<.001
Note: p<.001, ** p<.01, * p<.05, t p<.10; a zero order correlation coefficients; b Betas are standardized weights obtained from the second step when all variables were in the equation unless otherwise noted
Adaptation and Adjustment 43
Time 2 is attributable to academic adjustment reported at Time 1, F(1,62)=107.20,
p<.001. Variance in academic adjustment was observed to be quite stable over first year
with the average of the student scores at Time 1 correlating strongly with their scores at
Time 2, r(64)=.80, p<.01. Higher scores on the academic adjustment subscale at Time 1
were associated with higher scores on the academic adjustment subscale at Time 2.
The variance accounted for did not significantly increase with the addition of
psychosocial and physical health predictors on step 2. Although not interpretable given
that the set of psychosocial and physical health variables did not add significantly to the
prediction of Time 2 academic adjustment, individual standardized beta weights are
presented in Table 8 for the interested reader.
3.5.3.5 Longitudinal prediction of social adjustment. Social adjustment at Time 1
accounted for just over 68% of the variance in social adjustment at Time 2,
F(1,62)=133.51, p<.001. Variability in social adjustment showed a high degree of
stability over time with scores at Time 1 strongly tied to scores at Time 2, r(64)=.83,
p<.01. Psychosocial and physical health variables added on Step 2 did not significantly
change the amount of variance accounted for. Individual standardized beta weights are
depicted in Table 8.
3.5.3.6 Longitudinal prediction of personal/emotional adjustment. Results of the
hierarchical regression showed that personal/emotional adjustment at Time 1 accounted
for just over 66% of the variance in personal/emotional adjustment at Time 2,
F(1,62)=122.78, p<.001. Variability in personal/emotional adjustment was also stable
over time, Time 1 and Time 2 scores were strongly correlated, r(64)=.81, p<01. With the
inclusion of the psychosocial and physical health variables on Step 2, the proportion of
variance explained did not increase significantly. Individual standardized beta weights
are depicted in Table 8.
3.5.4 Mediating Relations at Time 1
Several mediational hypotheses were generated in the present investigation.
Baron and Kenny (1986) have specified requirements that must be met in order to test a
mediating relation. First, significant relations demonstrated through zero order
correlations must be established between the independent variable and the mediator (a),
the mediator and the dependent variable (b), and the independent variable and the
Adaptation and Adjustment 44
dependent variable (c) (See Figure 4 for a diagram of the first hypothesized mediational
relation) Second, we test to see if the relation between the independent variable and the
dependent variable is mediated by running a regression analyses. On the first step, only
the independent variable is entered in the prediction of the dependent variable, on the
second step, both the independent variable and the mediator are entered in the
prediction of the dependent variable. If the mediating relation is present, the relation
between the independent variable and the dependent variable should be reduced in the
presence of the mediator. In the case of pure mediation, the relation between the
independent and dependent variable would no longer be significant.
In the case where the direct path between the independent variable and dependent
variable is reduced, but remains significant, Sobel (1982), referred to by Baron and
Kenny (1986) suggests that we test the complete mediating path from independent
variable to mediator to dependent variable, (paths a and b) for significance. To run this
test the regression coefficients and their standard errors for a and b (the paths in the
mediating chain) are used to find the path coefficient and the standard error for the two
part path. The path coefficient and standard error are then used to form a
t ratio;
where βaβb = βa x βb and sβaβb = √ β
2a s
2b + β
2b s
2a - s
2a s
2b. With large samples, the null
hypothesis is rejected at α = .05 when the t value exceeds + 1.96. There are N - 3
degrees of freedom.
3.5.4.1 Do daily hassles mediate the relation between adaptive coping and
adjustment to university at Time 1? For the purpose of mediational analyses, the full
scale score of the SACQ was used as an index of university adjustment as compared to
considering the individual domains of social, academic and personal/emotional
adjustment. At Time 1, adaptive coping was significantly associated with both daily
hassles, r(225) = -.52, p<.001, and overall university adjustment, r(225)=.59, p<.001. In
addition, daily hassles were negatively associated with overall adjustment, r(225)=-.67,
p<.001. Results of the regression analysis conducted to evaluate the final condition for
mediation revealed that the standardized beta weight linking adaptive coping and
t = βaβb
sβaβb
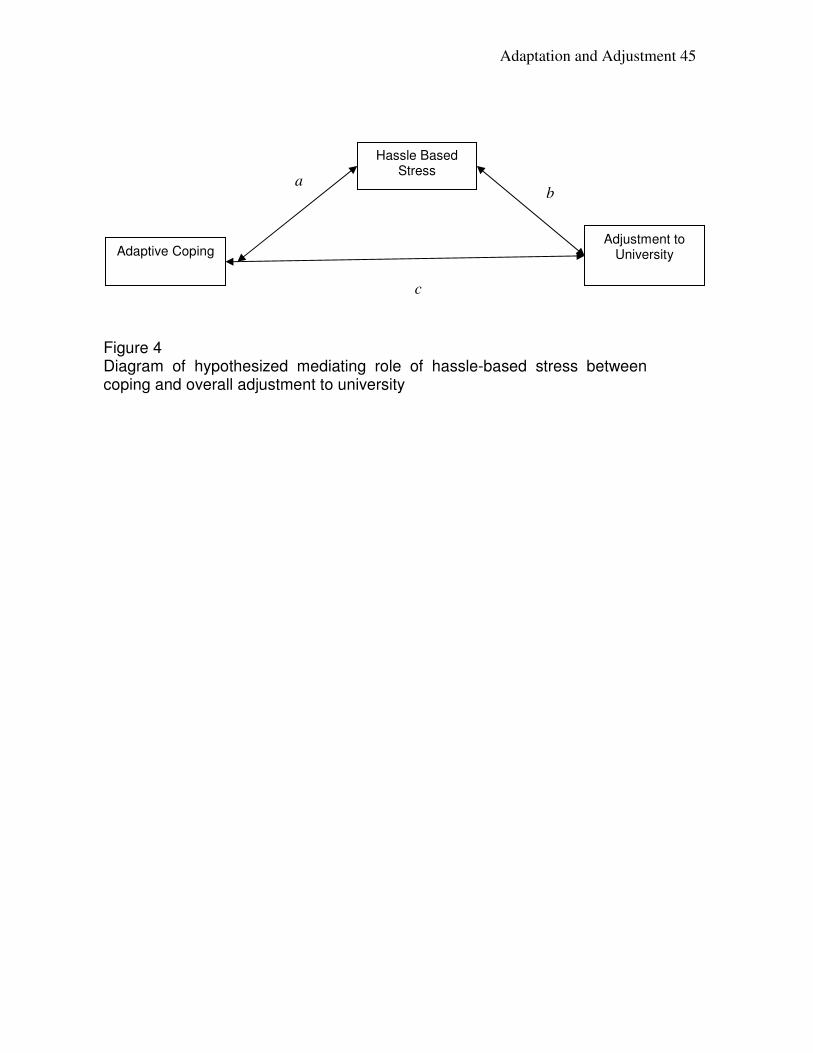
Adaptation and Adjustment 45
a
Adjustment to University
Hassle Based Stress
Adaptive Coping
b
c
Figure 4 Diagram of hypothesized mediating role of hassle-based stress between coping and overall adjustment to university
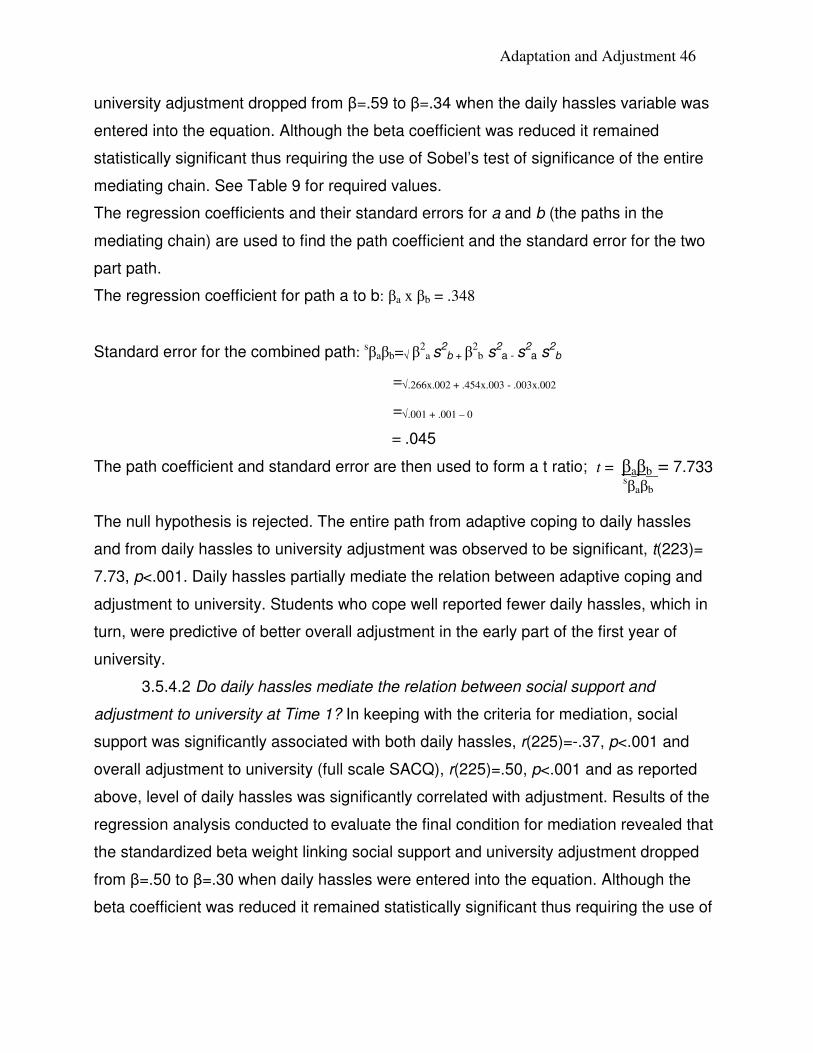
Adaptation and Adjustment 46
university adjustment dropped from β=.59 to β=.34 when the daily hassles variable was
entered into the equation. Although the beta coefficient was reduced it remained
statistically significant thus requiring the use of Sobel’s test of significance of the entire
mediating chain. See Table 9 for required values.
The regression coefficients and their standard errors for a and b (the paths in the
mediating chain) are used to find the path coefficient and the standard error for the two
part path.
The regression coefficient for path a to b: βa x βb = .348
Standard error for the combined path: sβaβb=√ β
2a s
2b + β
2b s
2a - s
2a s
2b
=√.266x.002 + .454x.003 - .003x.002
=√.001 + .001 – 0
= .045
The path coefficient and standard error are then used to form a t ratio;
The null hypothesis is rejected. The entire path from adaptive coping to daily hassles
and from daily hassles to university adjustment was observed to be significant, t(223)=
7.73, p<.001. Daily hassles partially mediate the relation between adaptive coping and
adjustment to university. Students who cope well reported fewer daily hassles, which in
turn, were predictive of better overall adjustment in the early part of the first year of
university.
3.5.4.2 Do daily hassles mediate the relation between social support and
adjustment to university at Time 1? In keeping with the criteria for mediation, social
support was significantly associated with both daily hassles, r(225)=-.37, p<.001 and
overall adjustment to university (full scale SACQ), r(225)=.50, p<.001 and as reported
above, level of daily hassles was significantly correlated with adjustment. Results of the
regression analysis conducted to evaluate the final condition for mediation revealed that
the standardized beta weight linking social support and university adjustment dropped
from β=.50 to β=.30 when daily hassles were entered into the equation. Although the
beta coefficient was reduced it remained statistically significant thus requiring the use of
t = βaβb = 7.733
sβaβb
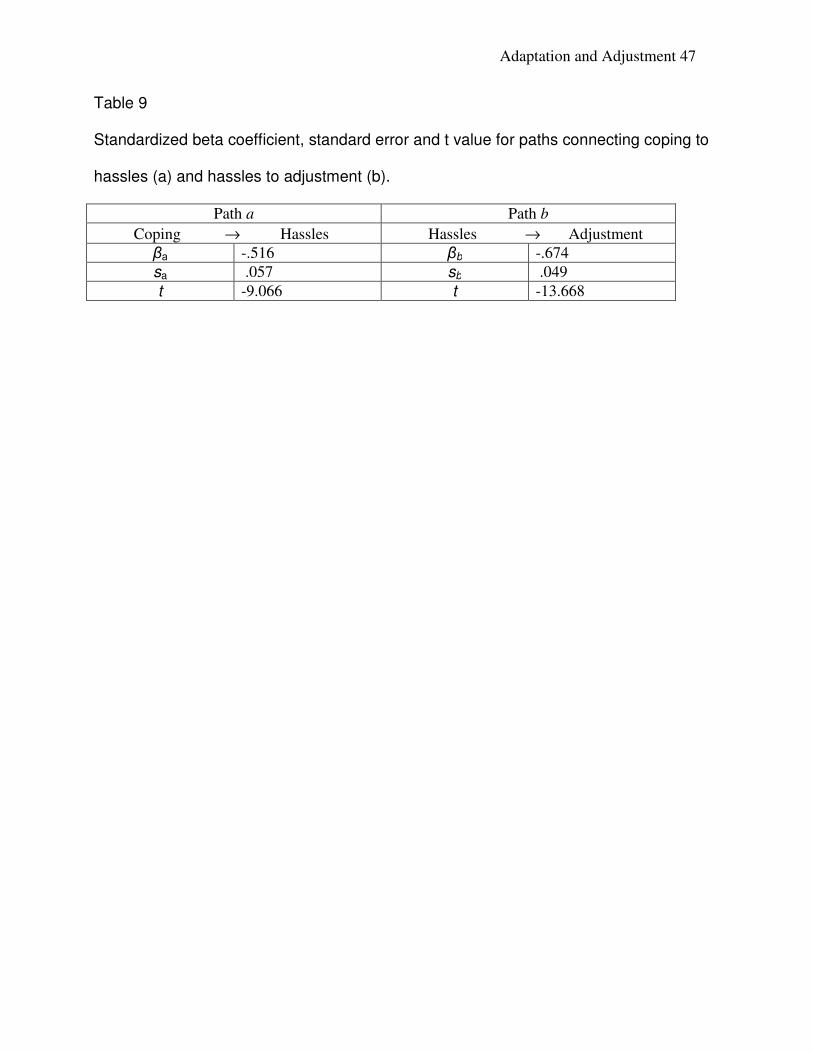
Adaptation and Adjustment 47
Table 9
Standardized beta coefficient, standard error and t value for paths connecting coping to
hassles (a) and hassles to adjustment (b).
Path a Path b
Coping → Hassles Hassles → Adjustment
βa -.516 βb -.674
sa .057 sb .049
t -9.066 t -13.668
Adaptation and Adjustment 48
Sobel’s test of significance of the entire mediating chain. See Table 10 for required
values. Analyses revealed that the entire path from social support to daily hassles and
from daily hassles to university adjustment was not significant suggesting that daily
hassles do not mediate the relation between social support and university adjustment.
3.5.4.3 Do daily hassles mediate the relation between health behaviour and
adjustment to university at Time 1? None of the health behaviour indicators (moderately
physical intense activity, vigorous and strength building activity, sports team
participation, or problem drinking) correlated significantly with daily hassles (see Table
1), which meant that one of the required assumptions for mediation (i.e., independent
variable significantly correlated with the mediator) was not met. Accordingly, no further
consideration of daily hassles as a mediator between health behaviours and adjustment
was pursued.
3.5.5 Changes in risk and protective factors across the year for women
It was predicted that changes in health behaviours would be associated with
adjustment outcomes such that an increase in problem drinking would be related to
poorer adjustment at the end of first year, or that an increase in physical activity would
be positively related to better adjustment at the end of first year. In order to test these
hypotheses, repeated measures Analyses of Variance (women only) for moderate
physical activity, vigorous and strength building activity, team sports participation, and
problematic alcohol consumption were conducted to explore whether there were any
significant changes in these health behaviours over the course of first year. Living
situation was included as an additional independent variable in these analyses.
3.5.5.1 Moderate physical activity. In the case of moderate physical activity, the
repeated measures ANOVA revealed a significant main effect for time, F(1,59) 6.19,
p=.016. Moderate physical activity increased slightly from fall (M=2.66, SD=1.94) to
spring (M=3.43, SD=2.25) for women. There was no main effect of living situation and
no significant interaction between time point and living situation.
3.5.5.2 Vigorous and strength building physical activity. The repeated measures
ANOVA for vigorous and strength building physical activity showed no significant main
effects for time or living situation and no significant interaction (See Appendix L for F-
values).
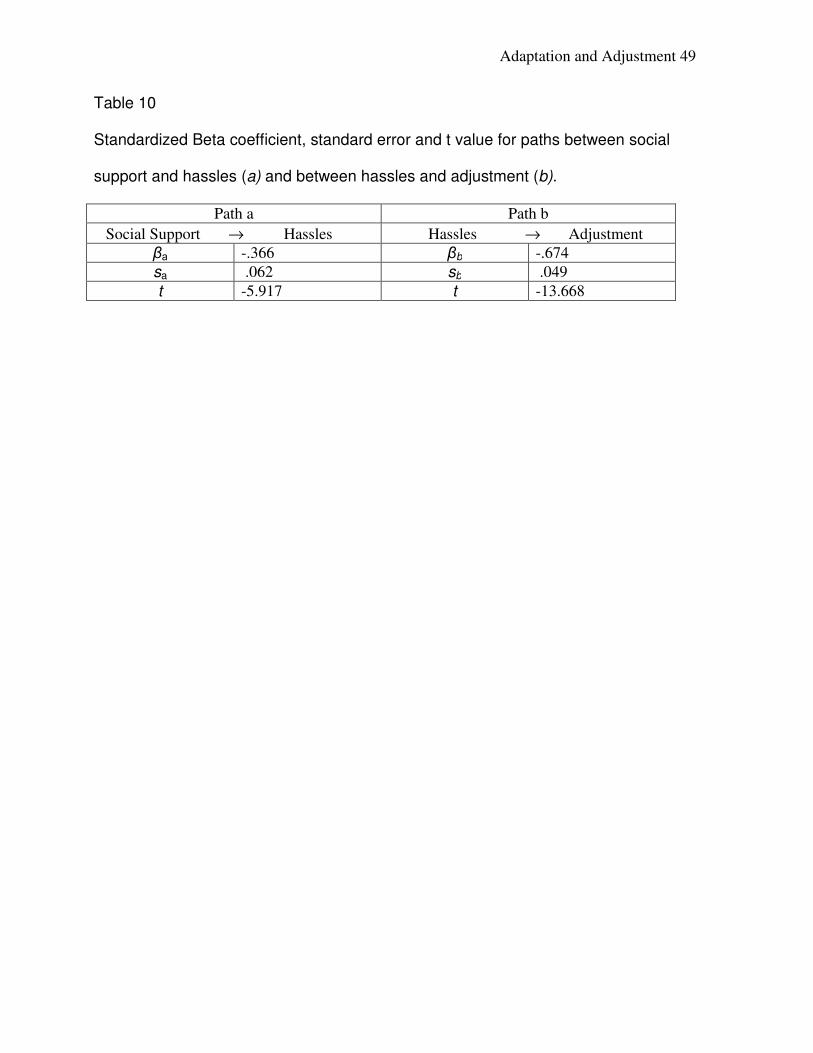
Adaptation and Adjustment 49
Table 10
Standardized Beta coefficient, standard error and t value for paths between social
support and hassles (a) and between hassles and adjustment (b).
Path a Path b
Social Support → Hassles Hassles → Adjustment
βa -.366 βb -.674
sa .062 sb .049
t -5.917 t -13.668
Adaptation and Adjustment 50
3.5.5.3 Sports team participation. The repeated measures ANOVA showed no
significant main effects for time or living situation and no significant interaction with
regard to sports team participation.
3.5.5.4 Problem drinking behaviour. The repeated measures Analysis of Variance
showed no significant main effects for time or living situation and no interaction with
respect to problem drinking behaviour.
3.5.5.5 Change in risk and protective health variables as a predictor of adjustment
at Time 2. Although only one of the health variables (i.e., moderate physical activity)
showed a significant change over the first year, of interest was whether change for the
risk and protective health variables would be associated with adjustment indices at Time
2. To this end, change scores were computed (T2 minus T1) for moderate physical
activity (change in M=.68, SD=2.44), vigorous and strength building activity (change in
M=.11, SD=2.82), sports team participation (change in M=.08, SD=.74), and alcohol
consumption (change in M=.29, SD=2.92). Zero-order correlations showed that none of
these change scores were significantly related to social, academic, personal/emotional
adjustment or to the transition experience in the spring of first year. There was a non-
significant trend toward an increase in vigorous and strength building type physical
activity being related to lower levels of academic adjustment to university, r(64)= -.23,
p=.06, and to lower transition scores r(64)= -23, p=.059. There was also a non-
significant trend toward an increase in alcohol consumption being related to an increase
in sports team participation, r(58)=.24, p=.06.
3.5.5.6 Change in social support from Time 1 to Time 2. Although no specific
hypothesis was made, a t-test was used in order to test for a difference between the
level of social support women reported at Time 1 versus Time 2. The amount of social
support women reported did not change significantly from Time 1 to Time 2, t(65)= -.55,
p=.58.
3.5.5.7 Change in daily hassles from Time 1 to Time 2. A t-test was used in order
to test for a difference between the level of daily hassles women reported at Time 1 and
the level reported at Time 2. There was a trend toward a change in the amount of daily
hassles women reported from Time 1 (M=2.11, SD=.39) to Time 2 (M=2.18, SD=.42),
t(65)=-1.79, p=.08.
Adaptation and Adjustment 51
4. Discussion
The purpose of the present research project was to investigate the impact of
protective and risk factors for late adolescents and young adults during their first year of
university. Using a short-term longitudinal design, the current investigation considered a
range of adjustment outcomes including social, academic, and personal/emotional
adjustment to university as well as asking students directly about their perceptions of
their transition experience at two time points during the first year of university (fall and
spring). Of particular interest within this context of a naturally occurring stressful life
event were the relations between psychosocial variables, health behaviours and
adaptation to university. A series of hypothesized relations were explored in an effort to
predict university adjustment and the nature of transition experiences during the first
term (for men and women) as well as longitudinally over the first year (for women only).
Of additional interest was the test of several hypotheses designed to explore whether
reported daily hassle based stress served to mediate relations between coping, social
support, or physical activity and adjustment to university. Finally, the possibility that
changes in health behaviours across the first year of university contributed to adjustment
outcomes was examined.
4.1 Does the transition into university present a stressful life event?
In general the majority of students perceived their transition experience to be
neutral or better during the fall, but almost 1/3 found the transition to be difficult.
Although the small number of males available for the second wave of data collection
precluded consideration of changes in their transition experience, changes in university
adjustment and perceptions of the transition experience were investigated for women.
About half of the women who completed the questionnaire at both time points reported a
neutral or better transition experience during both the Fall and Spring, with the other half
reporting difficulty. Even though a large group of students seemed to be experiencing a
positive transition during first semester, the point of the present study was to understand
individual differences in who does well and who struggles.
Among women, on average, adjustment to university was observed to decrease
significantly over the year. Specifically, women appeared to be less well adjusted
academically, socially and personally/emotionally during their second semester.
Adaptation and Adjustment 52
Estimates of effect size indicate that in the realms of academic and social adjustment,
the effect of time was in fact quite large (84% and 80%, respectively) whereas the role of
change over time for personal/emotional adjustment should likely be viewed as small,
accounting for only 14% of the variance (Cohen, 1988;1992).
The finding that adjustment declined from Time 1 to Time 2, although concerning,
is actually consistent with the literature (Tao, Dong, Pratt, Hunsberger, Pancer, 2000;
Gall et al., 2000). Interestingly, in the present sample there appears to be some
inconsistencies between perceptions of the transition experience and actual adjustment
to university. Although their adjustment scores declined, it was interesting to see that
women’s perceptions of the transition experience did not change significantly. It is
possible that women were not aware of the declining adjustment they were
experiencing. Indeed, Kerr, Johnson, Gans and Krumrine (2004) found that students
who are unable to perceive and discuss their emotions regarding the transition to
university experienced poorer adjustment to university as measured by the SACQ. It is
certainly possible that some of the women in the present sample did not perceive their
adjustment problems and would not, if given the opportunity, have reported them. It is
perhaps more plausible, however, that this difference in the pattern of findings reflects
the fact that domain-specific adjustment to university and perceptions of the transition
experience, although related, are in fact different constructs. In the case of adjustment
indices, students are asked to report on their experiences within specific domains of
functioning (e.g., keeping up with academic work, making friends, feeling anxious)
whereas in measuring perceptions of the transition experience, students are asked to
reflect directly on the nature of their transition (e.g., difficult, challenging). Thus, even
though measures of adjustment might decline across the first year of university,
perceptions of experience remain similar.
Despite the observation that perceptions of the transition experience and facets of
adjustment to university were fairly highly correlated (r’s ranging from.37 to.68), the two
constructs behaved in different ways. Average adjustment to university (across all three
domains) declined significantly over time and yet the variability in scores across the two
time points was highly stable suggesting that women continued to function roughly the
same relative to others in the group. In contrast, variability in students’ perceptions of the
Adaptation and Adjustment 53
transition experience was found to be less stable between time points (e.g., evidence of
women shifting their relative position in the group from one time point to the next) and on
the whole did not significantly change from Time 1 to Time 2. Taken together, these
findings support the contention that, like earlier academic transitions (McDougall &
Hymel, 1998), if we are to fully assess the transition to university with respect to
individual differences in functioning, it becomes important to include a direct measure of
experience along with the more traditional indices of domain-specific adjustment.
Considering the times at which data were collected and the all female sample, a
decline in adjustment is actually to be expected. Data were collected during the first
semester and then again in the second semester of first year. Statistics show that up to
30% of first year students do not continue from first to second year (Student and
Enrolment Services, 2003; Wintre et al. 2006). Therefore, students who will eventually
drop out are likely to still be present in the sample if the study ends before the beginning
of second year (as the present study does). Students who drop out as a result of their
poor adjustment or achievement would be expected to score more poorly over the first
year, rather than better. In one study concerning the transition to university (Tao et al,
2000), data were collected one month after school began, and then again at the end of
the first semester. Tao et al. (2000) found that depression and anxiety increased over
time such that students showed significantly worse adjustment over the first semester of
university.
Given the time frame of the present study (fall and winter of first year) it is not
possible to evaluate whether these declines in adjustment are longstanding or whether,
in fact, students (in particular women) would recover as they enter second year. In an
examination of this issue, Jackson et al. (2000) used the SACQ to measure adjustment
to university and found that adjustment scores improved when measured from the end of
year 1 to the end of year 2. In their study, they conducted an extensive comparative
analysis after losing approximately 16% of their sample between the end of year 1 and
end of year 2 and found that students who remained in the study until its completion did
not differ on pre-university levels of depression, stress, self esteem or dispositional
optimism from students who did not complete. Attrition (from the study) was related to
university adjustment scores at the end of first year. Specifically, students who dropped
Adaptation and Adjustment 54
out of the study before the second year measurement had significantly lower SACQ
scores at the end of the first year then did the students who continued. In addition the
same pattern of attrition was found between the second and fourth year SACQ
adjustment levels. Therefore, attrition from the study (and perhaps from university) was
related to adjustment to university, but not to pre-university levels of psychological
adjustment. In the present study, if data had been collected for women during their
second year of university, it seems likely that improvements would have been noted in
their adjustment scores over time. Following from the work of Jackson et al., however, it
also seems likely that improvements noted after first year would occur primarily because
many of the poorly adjusted women would drop out of university (and consequently the
study) leaving more positively adjusted students (on average) in second year university.
Initially it appears as though the declines in adjustment from the start of university
to the end of first year observed in the present study are consistent with the idea of the
‘freshman myth’ (proposed by Stern in 1966). This myth is characterized by the fact that
students have an overly positive idea of what university will be like, and/or an inflated
idea of what they will be able to accomplish at university. As reality sets in, and they are
unable to do as well as they imagined they would, adjustment declines (Baker et al,
1985). The freshman myth is theoretically seen to play out from the point of pre-
university (or early in the first semester) to the end of the first semester and as such may
be less applicable in the present study in which students were followed from mid first
semester into the end of their second semester. It can be argued that students in the
present sample would have already seen some of the reality of university by the middle
of first semester. It remains possible however, that the students in the present sample
still felt dissatisfied by the gap between how they originally thought they would do, and
how they were actually doing over the course of the year (Baker et al. 1985).
Finally, declines in adjustment might well be accounted for by the fact that Time 2
measurement coincided with a particularly difficult time during the semester. Although
the two time points were measured at similar junctures during each semester (e.g.,
approximately 12 weeks into each semester) it is possible that the two semesters are
simply not very similar. In first year, many courses are year-long offerings and as such
students are not faced with exams in December of first year but rather must contend
Adaptation and Adjustment 55
with most of their exams towards the end of first year (close to Time 2). In an academic
sense, whereas hope for improvement may still be viable in the fall of first year, there is
little time to recover by the time March (Time 2) emerges. Accordingly, the workload and
stress level that students experience may be very different between first and second
semesters. In addition, for many students the end of the second term brings with it the
stress of having to find a summer job. In the current study, no specific questions were
asked that would support the veracity of a “time of year” explanation for declining
adjustment. Future research could investigate adjustment levels in relation to specific
university related stressors such as an examination period by trying to directly measure
these stressors at relevant time points. Alternatively, it might be of value for future
researchers to compare university systems in which first year is characterized by
primarily half-year (i.e., 4 month) courses as compared to university systems in which
the structure of first year is based entirely on full-year (i.e., 8 month) course offerings.
This type of comparison would make a worthwhile contribution to understanding the links
between the structure of programming and university adjustment in first year.
4.2 Were there individual differences in adjustment during the first term? Concurrent
correlates of adjustment to university
Consistent with predictions and the literature (Gall et al, 2000; Fisher & Hood,
1988), women in the present sample had a more difficult transition and reported greater
difficulty adjusting to university as compared to men. Using Cohen’s (1992) standards
for effect size, gender was observed to have a medium to large effect size in terms of
the amount of variance that was accounted for in university adjustment. The effect size
for gender was smaller for self-reports of the transition experience, with only 2% of the
variance being explained. On the whole, in the fall of first year men reported fewer
difficulties with social and personal/emotional adjustment as compared to women and
were more positive in their perceptions of the transition experience. Interestingly, these
gender differences did not extend to the realm of academics. Indeed, gender was not
related to either reports of academic adjustment or academic achievement (i.e., overall
grades). The fact that men and women were similarly adjusted academically during first
semester is consistent with previous research (Gall et al. 2000). Specifically, Gall et al.
(2000) have argued that although women are not more poorly academically adjusted at
Adaptation and Adjustment 56
the beginning of the year then men, they are more negatively affected by the transition
(Gall et al, 2000). Winter (2006) suggests that there is evidence that women are
somewhat more likely to be identified as gifted scholars, and to graduate from university
then are men, but they are more likely to withdraw from school for non-academic
reasons. The pattern of results in the present study fits with past research, as the
women were not more poorly academically adjusted then men in the first term, but were
observed to have more difficulty in social and personal/emotional areas. Unfortunately,
the low number of men that contributed data at the second time point precluded
comparisons of the patterns of adjustment between men and women over time although
this should most certainly be an important focus of future research in this area given the
strong possibility that women are more vulnerable during the move into university.
In addition to gender differences, the question of whether living at home or
moving away from home to attend university would be associated with individual
differences in the transition and adjustment to university was investigated. For the most
part, living at home versus moving to attend university was not related to different
outcomes. Contrary to what was expected, students living away from home were not
more poorly adjusted then students living at home and did not report a more difficult or
challenging transition experience. In fact, students living away from home demonstrated
significantly better social adjustment then students who were living at home, although
the size of this effect was small. Effect size notwithstanding, this is a particularly
interesting finding because students who move to attend university are typically required
to form new social networks for support versus students who live at home who are
presumably able to rely on the support network that they are used to (Paul & Brier, 2001;
Hays & Oxley, 1986). One study of social support during the transition to university
found that students generally reported stable levels of social support during the
transition to university, but when the sources of social support were investigated,
students relied more heavily on school peers then parents over time (Tao et al, 2000).
Although it is likely that the students who moved away from home have had to create
new social networks, in the present sample, students appear to have adjusted well in
making these new connections. While some studies have reported friendship problems
and loneliness in college student samples (Paul & Brier, 2001), in the present study,
Adaptation and Adjustment 57
social support did not change significantly from Time 1 to Time 2, lending support to the
idea that students did not have trouble finding the social support they needed. Hays and
Oxley (1986) showed that students are better adjusted when they have good support
networks. Moreover, they suggest that good support networks during university include
university friends. When students have networks that consist of many non-similar
supporters (such as friends who are not attending university) conflict is increased. In the
current study, students were not specifically asked about where they were receiving
support from. However, the measure of social adjustment asked specifically about
university life, and questions about social adjustment at university focus on issues like
fitting in, and making as many new friends as one would like. It is quite likely that in a
group of students who do not seem to have issues finding the support they need in
general, making new university friends was not too difficult and when living away from
home (and traditional supports), students may have had an easier time making new like-
minded university friendships without trying to balance old and new support networks.
4.3 Relations Between Psychosocial and Physical Health-Related Variables and
University Transition
4.3.1 Adaptive coping. Being able to adaptively cope means being able to use
whatever type of coping behaviour is best suited to the specific situation. Adaptive
coping requires self-control (e.g., controlling one’s behaviour), determination (e.g.,
actively responding to a stressor), and judgment (e.g., deciding on the best response;
Kohn, 1996). As predicted, and in accordance with previous research (Kohn & Veres,
2001), in the fall of first year adaptive coping was related to a more positive transition
experience and more adaptive copers had higher scores on academic, social, and
personal/emotional adjustment. In fact, even after controlling for the effects of other
psychosocial and physical health factors, coping adaptively was uniquely linked to
positive functioning in all domains with the exception of academic adjustment. Although
adaptive coping and academic adjustment were observed to share a bivariate relation, it
may well be that in the presence of other predictors, coping is not as critical a predictor
of academic adjustment as other variables are, and as such does not account for a
significant proportion of the unique variance in academic adjustment. Generally, people
who would be identified as more adaptive copers tend to have more self-control and
Adaptation and Adjustment 58
exhibit good decision making skills. In contrast, poorer copers would tend to be more
volatile and more easily shaken across a variety of situations. The measure of adaptive
coping is heavily weighted toward interpersonal relations and for that reason may not be
as strong a predictor for academic adjustment which measures things like school-related
abilities, getting to class, completing assignments. While a high degree of self-control
and good decision making skills are possibly essential skills for high achievement in
university, the interpersonal focus of the adaptive coping measure most likely attenuates
the link between adaptive coping and academic adjustment in the presence of many
other related variables. Adaptive coping was uniquely predictive of the less solitary
domains of university adjustment namely social and personal/emotional adjustment.
4.3.2 Daily Hassles. Not surprisingly, more daily hassles were connected to
perceiving the transition as more difficult and were also inversely related to the three
adjustment indices. Specifically, students who reported suffering greater hassles were
not doing as well in terms of their academic, social, or personal/emotional adjustment to
university during the fall of first year. When predicting individual differences in the
transition experience, and in adjustment to university (academic, social,
personal/emotional), daily hassles emerged as uniquely predictive across all four
measures.
As in the case of adaptive coping, the strong relation that was observed between
daily hassles and the outcome measures cannot be interpreted to have causal
implications. That is, it is not possible using the present data to say that increased daily
hassle based stress is causing poor adjustment or more troubling perceptions of the
transition experience. Indeed, it is possible that lower adjustment and trouble with the
transition actually leads to increasing hassles, or that some third variable is impacting
both variables. For example, it could be that some aspect of an individual’s personality
(e.g., neuroticism) leads to poorer outcomes during times of change and also increases
the experience and reporting of daily hassles. One way for future researchers to sort out
the role of daily hassles in the transition to university would be to conduct an intervention
study where incoming students were randomly assigned to one of two conditions. In the
first condition, students would be exposed to an intervention program that focuses on
identifying and reducing daily hassles in an effort to improve the group’s ability to handle
Adaptation and Adjustment 59
university related daily hassles. The second group would act as the control and would
not receive any training regarding hassles. If improvements in functioning were noted for
the group who receives training and/or instruction regarding daily hassles, we may in
fact be one step closer to pinpointing the directionality of the relation between daily
hassles and university transition and functioning.
Even without resolving issues of causality and directionality, there is ample
evidence in the present study that the measurement of daily hassles represents an
important marker of both perceptions of the transition experience and domains of
adjustment. This finding, taken from within the context of an academic transition, is in
keeping with previous research on the role of daily hassles. Daily hassles have been
previously shown to be positively related to anxiety, psychological symptoms, and
negative well being in university students (Kohn, Lafreniere, & Gurevich, 1990; 1991) as
well as negatively related to university adjustment (Kohn & Veres, 2001).
4.3.3 Social support. It was hypothesized that high levels of social support would
be positively related to better adjustment in the first year of university. Previous research
has shown that the absence of social support is a risk factor for poor adjustment
(Lamothe et al., 1995), whereas the presence of adequate social support appears to
buffer people from the effects of stress (Cutrona, & Russell, 1987). In their social
support intervention study, Lamothe et al. (1995) showed that higher levels of social
support were related to better university adjustment as measured using all four
subscales of the SACQ. An expansion and replication of the study showed that students
who were randomly assigned to a social support intervention group to increase their
social support networks were better adjusted then students who did not receive the
intervention, however, they did not assess the SACQ subscales separately (Pratt et al.
2000).
As expected, in the present study, social support was correlated with academic,
social, and personal/emotional adjustment to university. In addition social support was
also positively related to perceptions of the transition experience. However, when social
support was used as a predictor in the regression analyses, social support only emerged
as uniquely predictive of social adjustment when alongside psychosocial and physical
health factors in the model. Although social support was expected to play a more
Adaptation and Adjustment 60
prominent role in predicting university adjustment across different adjustment domains
during the transition to university, it is certainly plausible that most of the contribution
that social support makes in predicting adjustment is shared by other factors. The social
support measure used in the present study measures many facets of social support,
however it does not identify the source of the social support, and none of the questions
are context specific. As such, the social provisions scale represents a global measure of
social support. The social adjustment measure mainly assesses the degree to which a
student is satisfied with the level of social involvement they have achieved in the
university related context. While the two scales measure distinct constructs, there is
enough similarity that social support emerged as uniquely predictive for social
adjustment even in the presence of a number of other variables.
Among Chinese undergraduates Tao et al. (2000) utilized the same measure of
social support and similarly found that while social support was predictive of social
adjustment, it was not predictive of academic or personal/emotional adjustment. They
concluded that social support was not an equally important predictor of adjustment
across the domains. Before ruling out social support as having a more important role in
academic adjustment, personal/emotional adjustment, and the nature of the transition
experience, it would be interesting to investigate specific aspects of university-related
social support during the university transition more closely. In the present study, the
source of social support was not assessed. During the transition to university, there are
many changes occurring. It is possible that while global reports of social support are
positively related to adjustment and perceived transition experience, simply having
social support from any source does not actually improve adjustment. Perhaps during
the transition to university, having friends that share similar interests such as studying
leading up to midterm time would better predict academic adjustment then having
supporters for whom academics are not a priority.
4.3.4 Self esteem. As predicted, students who had high self-esteem were better
academically adjusted. Similarly, students who had higher self-esteem also reported
better transition experiences and demonstrated better social and personal/emotional
adjustment. Though self-esteem was significantly related to all of the outcome variables,
it was also fairly strongly related to all of the other predictors as well. Not surprisingly,
Adaptation and Adjustment 61
when all other predictors were controlled in the regressions, self-esteem was only
uniquely predictive of personal/emotional adjustment. It seems as though the global
measure of self-esteem that was used in this study has restricted utility for predicting
individual differences in adjustment during the transition to university. Indeed, while
generally speaking, high self-esteem shares positive relations with adjustment (Hertel,
2002; Hickman, Bartholomae, & Patrick, 2000) it is nevertheless a global measure, and
as such self-esteem was also related to most variables in the present study. It seems
plausible that the intercorrelations with other predictors meant that self-esteem did not
emerge as uniquely predictive in more than one domain. Efficiency may dictate that
future researchers examining the transition to university may deem self-esteem to be
less useful as a specific marker of individual differences in this academic event.
Rosenberg et al. (1996) suggest that global self esteem is related to psychological well
being while academic-specific self-esteem is a better predictor of school performance.
4.3.5 Health Behaviours and University Adjustment. I hypothesized that health
risks (low exercise and high levels of problematic alcohol consumption) would be related
to more difficult transition experiences and lower adjustment levels. Unlike the strong
support observed for connections between psychosocial factors, transition experience,
and adjustment, hypotheses involving health behaviours were only partly supported.
Greater physical activity was related to a more positively perceived transition and
better adjustment for the most part. An inspection of zero-order correlations showed that
moderately intense physical activity was positively related to all three measures of
adjustment to university, but was not related to transition experience. Similarly, vigorous
and strength building type physical activity was related to all four outcome measures. In
contrast, the bivariate relations involving sports team participation showed only one
statistically significant link to better social adjustment during the first semester, although
there was a trend toward a significant positive relation with personal/emotional
adjustment as well. This pattern of correlations meant that only moderate physical
activity and vigorous and strength building activities were included in regression
analyses. Even after controlling for the effects of psychosocial factors, vigorous and
strength building activities were uniquely predictive of more positive transition
experiences, and better academic adjustment. Moderate physical activity was uniquely
Adaptation and Adjustment 62
predictive of social adjustment. Neither of the physical activity variables utilized in the
present investigation was uniquely predictive of personal/emotional adjustment which is
surprising given the connections in previous literature that have been made between
increased aerobic activities and improved mood and psychological well being (Bray &
Kwan, 2006; Callaghan, 2004; Hinkle, 1992; McCann & Holmes, 1984; Statistics
Canada, 1999). Also, it was surprising that vigorous and strength building activities were
not significantly predictive of social adjustment given that moderate physical activity was.
In this study, moderate physical activity was measured by asking participants ‘on
how many of the past 7 days did you participate in physical activity for at least 30
minutes that did not make you sweat or breathe hard’ followed by examples such as fast
walking, slow bicycling, skating, pushing a lawn mower, or mopping floors. For the most
part, the question measures physical activities that are a bi-product of daily activities,
and many are not overly social in nature, in fact many such as mowing a lawn or walking
to school tend to be solitary activities. On the other hand, vigorous and strength building
activities consist of the kind of purposeful exercise that one achieves mainly from
participating on sports teams or going to the gym and are inherently more social in
nature and yet were not found to be uniquely predictive of social adjustment. Part of the
discrepancy may be due to the use of self-reported measures of physical activity in this
study. Self report measures may not characterize actual physical activities well enough
to relay accurate enough information to yield results in a study of this size. In fact, there
is evidence that at least in adolescence there is a tendency to under-report moderate
physical activity and over-report vigorous physical activity when compared to objective
measures which would bias results regardless of sample size (Troped et al. 2007).
Despite the fact that many of the physical activity variables are not coming out
exactly as was predicted, for the most part, relations that should probably be present are
lacking. In general, both adults and children are found to over-report their actual physical
activities on self-report measures (Sallis & Saelens, 2000). The measure used in this
study, the NCHRBS National College Health Risk Behavior Survey, was tested with
college students and was shown to have excellent test-rest reliability. The validity of the
questions however, is comparable to other self-report measures of physical activity
(Dinger, 2003). The intercorrelation between vigorous physical activity and the
Adaptation and Adjustment 63
accelerometer (an objective measure of physical activity) was only r=.60. For moderate
physical activity, the accelerometer and the self-report question had a similar correlation
r=.63. The questions used in the present study were a good choice in terms of a self-
report measure of physical activity. Nevertheless, this measure may not characterize
actual energy expenditure accurately enough to detect the relations that were
hypothesized.
In order to more accurately measure physical activity so that hypotheses
involving links to physical health can be effectively tested, future research should
attempt to make use of accelerometers. Although more costly for researchers and time
consuming for participants, accelerometers measure both vertical and horizontal
movement and give a much better estimate of actual energy expenditure then do self-
reports of physical activity (Freedson & Miller, 2000). Thus, before ruling out physical
activity as a marker of the transition experience and/or a more pervasive link to
adjustment in first year, it will be important to implement more exact measurement tools.
The hypothesized relation between problematic alcohol consumption and
adjustment received almost no support in the present investigation of the transition to
university. More problematic alcohol consumption was related to lower academic
adjustment but was not significantly tied to the social or personal/emotional adjustment
domains, or to reports of the transition experience. In addition to a bivariate tie to
academic adjustment, alcohol consumption was also clearly related to grade point
average, suggesting that higher levels of alcohol consumption go along with lower
grades. Clearly, the correlational design of the present study makes it impossible to
establish with any certainty that drinking more leads to lower grades. At the same time, if
in fact lower academic achievement was the cause of more drinking in the fall of first
year, one might also expect to see that other likely triggers such as more daily hassles
or poor coping would go hand in hand with more problem drinking. That is, one could
expect to see students using drinking as a coping strategy to deal with stress. In contrast
to this scenario, the present findings yielded no such connection between either daily
hassles or adaptive coping and self-reports of alcohol consumption. On the other hand,
alcohol consumption was positively related to the number of sports teams that a student
is a part of lending support to the idea that in the fall of first year students (at least those
Adaptation and Adjustment 64
on sports teams) are drinking within a social context. Past research has shown that
sports team participation is related to higher levels of social drinking in both high school
and university (Eccles and Barber, 1999; Nelson and Wechsler, 2001; Rockafellow &
Saules, 2006; Wechsler, Davenport, Dowdall, & Grossman, 1997). This is not to suggest
that problematic alcohol consumption has a beneficial influence on the social realm of
university. Rather, it seems plausible that students are drinking in social contexts for
social reasons. Alcohol consumption though common in social situations does not
appear to be an essential part of receiving social support and does not appear to have a
relation with overall satisfaction with the social ties one makes during the transition to
university. Drinking was not related to the amount of social support students reported or
to their reported social adjustment.
In accordance with the present results, Labouvie and Bates (2002) have found
fewer negative consequences when students drink for social reasons, than when
students drink to cope. Alcohol consumption in the present sample is very common with
83.2% of the sample reportedly drinking. In addition, the average score on the AUDIT
was 6.12, not far below the cut off score of 8 that would be considered hazardous or
problem drinking. According to Wechsler (1998) drinking alcohol is normative during
university, however, even among non-problem drinkers, drinking-related consequences
can easily affect grades through missed classes and late assignments due to
hangovers. In the present study, it is not surprising that alcohol consumption is
positively related to poorer academic adjustment and grades during first year, or that
students who are drinking at higher levels are not more poorly adjusted overall then
students who aren’t drinking as heavily.
4.3.6 Summary. In answering the question of whether there were individual
differences in perceptions of the transition experience and in adjustment in the first term
of university, it is important to note that certain predictors emerged for some indices but
not others. These findings provide evidence that different adjustment constructs were in
fact being measured. There is also evidence from the present study to suggest that
some of the risk and protective factors (operationalized as psychosocial and physical
health factors) considered herein were involved in all domains of university adjustment.
Specifically, being a more adaptive coper and having fewer daily hassles emerged
Adaptation and Adjustment 65
consistently across the adjustment domains and the perceived experience of the
university transition early on. Adaptive coping was implicated in three of four domains
showing that being a more adaptive coper; that is, knowing what to do and when to do it
in a given specific context (Kohn, 1996) was related to better adjustment. Daily hassles
emerged consistently across all four outcomes demonstrating that regardless of whether
the transition into university is in and of itself a stressful life event, the experience of
daily stressors that are part of the transition are negatively related to students’
perceptions of the transition and to their adjustment during this time. From a practical
standpoint, the design of transition intervention programs should take into account that
what might be related to adjustment in one area (e.g., academics) may not necessarily
be related to adjustment in all other areas.
Previous research has shown that academic adjustment is very important to
university adjustment, but it is not the full picture on its own. While some students drop
out of university because they did not meet promotion standards (Winter et al., 2006),
many students, even ones in good standing, drop out for other reasons (Winter et al.,
2006; Gerdes & Mallinckrodt, 1994). Academic achievement taken alone leaves much of
the variance in poor adjustment and subsequent attrition left unexplained (Gerdes &
Mallinckrodt, 1994). Social and personal/emotional adjustment predicts attrition as well
or better then academic adjustment among students with both low and high academic
averages (Gerdes & Mallinckrodt, 1994). In addition, among students with low academic
potential, higher levels of overall adjustment and better personal relations were related
to persistence in college (Gelso & Rowell, 1967). The present study also highlights the
need to consider a direct assessment of how students feel about the transition.
In the present study, the combination of the demographic, psychosocial and
health-related behaviours were able to account for a fairly large proportion of variance in
the outcomes of interest (ranging from 43% to 62%) obtained in the fall of first year.
Nevertheless, there is still quite a bit of variance left to be explained. Future studies may
be able to account for more of the variance by incorporating objective measures of
physical activity and grades, and also by investigating variables that were not looked at
in the present work. In particular, a closer investigation of social networks alongside
social support may be beneficial.
Adaptation and Adjustment 66
4.4 Predicting the Adjustment of Women over the Course of the First Year
Correlations observed between Time 1 psychosocial factors and health
behaviours and Time 2 adjustment indices for the smaller sample of female students in
large measure replicated the pattern of relations observed concurrently at Time 1. This
replication of findings provides support for a number of the present hypotheses.
As predicted, adaptive coping at Time 1 was positively related to all three
adjustment indices and perceived transition experiences at Time 2. Similarly, the level of
daily hassles in the fall was linked to subsequently lower social, academic and
personal/emotional adjustment as well as a more difficult or challenging transition
experience by the end of the school year. As was expected, better social support and
higher self-esteem for students early on were linked to more positive adjustment and
better transition experiences, although the connection between social support and
academic adjustment was only a trend. For the most part then, predicted relations
between healthier psychosocial functioning at the beginning of the year and better
adjustment at the end of first year were obtained for this sample of women.
Although more positive health behaviours (more physical activity and less
problem drinking) at Time 1 were expected to be related to more positive transition
experiences and higher levels of university adjustment (academic, social, and
personal/emotional) at Time 2, these connections were not consistently observed. As in
the case of concurrent connections, measures of drinking in the fall were again found to
be related to lower academic adjustment at the end of term 1 but were not, contrary to
expectations, significantly tied to other domains of adjustment or to reports of the
transition experience. Moderate physical activity did not demonstrate significant relations
across time with adjustment or transition experience despite the fact that connections to
social and personal/emotional adjustment were observed concurrently at Time 1. Unlike
the widespread connections observed between vigorous and strength building physical
activities and adjustment outcomes at one time point (fall of first year), over the full
academic year, level of vigorous and strength building activities was only related to
academic adjustment and the transition experience.
In order to fully test whether psychosocial and health related variables at Time 1
would be predictive of academic, social, and personal/emotional adjustment as well as
Adaptation and Adjustment 67
perceptions of the transition experience at Time 2, it was necessary to control for early
measures of each respective adjustment measure. Failing to do so, could lead to
inaccurate results and conclusions that do not take earlier adjustment into consideration.
Although longitudinal consideration was limited to a small sub-sample of first year
women, it was extremely interesting to note how much the of the variability in adjustment
and perceptions of the transition experience at the end of first year could be accounted
for simply by knowing about these same factors at the start of the school year. Indeed,
2/3 of the variability in adjustment domains (academic, social, personal/emotional) and
almost half of the variability in perceptions of transition experience reported at Time 2
could be accounted for by measures of these same indices at Time 1. That is, knowing
how women were doing in the fall of first year carried a great deal of weight with respect
to predicting how they would be functioning at the end of the year. The high degree of
stability in functioning (relative to others in the group) across time seems to suggest that
the indices of adjustment utilized in the present study may be tapping into more stable
traits that individuals possess as opposed to measuring the impact of the context (e.g.,
the transition to university). With only two points of measurement, it is not possible to
verify whether this is in fact the case. One way to examine the notion of trait stability
would be to collect adjustment measures in the fall and spring of grade 12 prior to
entering university. With this kind of information it would be possible to examine whether
certain individuals are simply better adjusted to begin with, and in that way, would seem
to begin university with a “head start”. It is interesting to note that perceptions of the
transition experience appeared to be more variable over time (reflected by lower stability
coefficients). If a “trait-like” explanation can account for the variance in adjustment
indices being moderately to highly stable, it should similarly be implicated in the more
global measure of how the nature of the transition is being perceived. At the same time,
given that the measure of transition experience was designed to ask explicitly about
what was going on in the move into university (i.e., asking questions about the impact of
the context on the individual), it would be reasonable to expect more variability in these
reports of transition experience and less of a role for stable traits.
The fact that adjustment at Time 2 could in large part be predicted by knowing
about the same measure of adjustment at Time 1 has implications for intervention.
Adaptation and Adjustment 68
Potentially, the SACQ could be administered to students during the first semester to
identify students who are at risk of having difficulty, and to identify their problem areas.
Interventions could then be tailored to each student. A similar intervention has been
conducted with success. Specifically, Baker and Siryk (1986) found that among students
who scored poorly on the SACQ during first semester, the implementation of one
intervention interview improved student adjustment and reduced drop out rates. The
interview included reviewing the students’ SACQ scores and discussing possible ways
of dealing with the difficulties the student was experiencing as well as providing
information about helpful resources.
The stability of variance in adjustment domains and perceptions of the transition
experience over time also had implications for the test of hypotheses involving
psychosocial factors and physical health behaviours used to predict transition
experience and adjustment longitudinally. After controlling for early adjustment and
transition experience, none of the psychosocial factors or health behaviour predictors
collected in the fall of first year was predictive of a significant increment in variance
accounted for at the end of the year. As outlined earlier, this would suggest that after
controlling for the stability of adjustment, no significant proportion of the fluctuation in
adjustment over time could be accounted for with the current set of predictors. As a
group, females were observed to decline in their reported adjustment (social, academic,
and personal/emotional), but there was a great deal of stability between individuals. The
declines in adjustment were surprisingly uniform with the vast majority of the group
declining systematically from Time 1 to Time 2 regardless of their starting point.
Therefore for the most part, women maintained their relative order within the group.
When much of the variability in adjustment at the end of first year can be accounted for
by knowing about adjustment at the start of the year, it makes the prediction of individual
differences in adjustment across first year more difficult; there is simply a smaller
proportion of variability left unaccounted for.
It is certainly conceivable that the set of psychosocial and health behaviours
included in the present investigation were not sufficiently central so as to maintain a
connection to adjustment over time (over and above fall adjustment). At the same time,
given that such a small sample was available for exploration of longitudinal relations, it
Adaptation and Adjustment 69
seems entirely premature to rule out the possible importance of the current set of
psychosocial and health behaviours before conducting a replication with a larger sample
that would yield more generalizable results. Although, the number of participants meets
the requirements of the rule of thumb laid out by Harris (1985) that N should exceed the
number of predictors by at least 50 (as cited in Howell, 2002), or a second rule of thumb
that is often followed stating that a sample should consist of the number of predictors
multiplied by 10 (Howell, 2002), there can be little doubt that the small sample available
for these analyses imposed power restrictions that made tests of the increase in
variance accounted for overly restrictive. Indeed, an inspection of the incremental
proportion of variance (ranging from 4% to 10%) across adjustment indices as well as
the perceived transition experience provides support for an attempted replication with
more participants and better power.
Future attempts to examine this same (or expanded) set of psychosocial and
health behaviours must also go beyond the present data by including males in the
sample. Indeed, at present, the current findings regarding the longitudinal prediction of
adjustment and experience over the first year of university are limited exclusively to
women.
4.5 Changes in risk and protective factors: Health behaviours.
One of the secondary goals in the present study was to investigate whether
changes in women’s health behaviours over the first year of university were related to
their adjustment to university. Of all the health behaviours under consideration, only
moderate physical activity changed significantly across the first year, increasing slightly
from Fall to Spring. Of interest was whether changes in risk and protective factors would
be predictive of difficulty during the first year of university. Though previous research
suggests that health behaviours change (Hudd et al., 2000), and on average physical
activity has a tendency to decline over the first year of university (Bray & Born, 2004), for
the most part participants in the present study showed little change in health behaviours.
It is possible that by measuring health behaviours 12 weeks into the first semester, I
missed the majority of the changes that occurred between high school and university,
but it is also possible that the measures used (as previously discussed) were not
sensitive enough to detect the actual changes occurring.
Adaptation and Adjustment 70
Although the changes in health behaviours were not significant over the year, I
looked at the relations among these changes and transition experience and adjustment
at Time 2. There was a non-significant trend between increased vigorous and strength
building physical activities and decreased academic adjustment and transition
experience. This trend was unexpected and counterintuitive although it is possible that
increasing the time spent in vigorous and strength building activities simply leaves less
time available for academic pursuits. Given the small sample size, the impact of
changes in physical activity on university adjustment must be re-examined in a larger
sample in order to clarify the association between this kind of change and university
adjustment in transition.
There was also a marginally significant association observed between increases
in sports team participation and increases in alcohol consumption. Existing literature
would support the idea that in university, sports team participation and alcohol
consumption are positively related (Rockafellow & Saules, 2006; Vickers et al. 2004) so
it should not be particularly surprising that increases in one domain tend to correspond
with increases in another.
4.5.1 Understanding interconnections between psychosocial factors, health
behaviours and university adjustment. As predicted, coping adaptiveness was
concurrently related to daily hassles such that better coping went hand in hand with
fewer hassles. Consistent with what was predicted, in the fall of first year adaptive
coping was positively related to both social support and physical activity (moderate,
vigorous and strength building, and sports team participation). Contrary to expectation,
adaptive coping was not significantly tied to problematic alcohol consumption. The lack
of relation does suggest that the students in the present sample are not drinking to cope
with stress for the most part.
Contrary to the hypothesized relations and to the literature (Hudd et al., 2000;
Salmon 2000), daily stress in the present study was not significantly related to health
behaviours. Specifically, daily hassles were not significantly related to problem drinking
or to any measure of physical activity. While it is possible that daily hassles are not
related to physical activity, it is also possible that daily hassles were not related to
physical activity in the present study because a self-report measure of physical activity
Adaptation and Adjustment 71
was utilized. As previously discussed, self report measures of physical activity may not
measure actual energy expenditure well enough to detect the relations that I had
hypothesized.
4.6 Do daily hassles act as a mediator?
In the present investigation, three mediational hypotheses were proposed for
daily hassles based on relations identified in the literature. Although the sample size
(and restriction to women only) did not allow for the test of these mediational hypotheses
with longitudinal data, these linkages were nevertheless explored in a concurrent
context. First, it was predicted that adaptive coping would be directly related with
adjustment to university as well as being indirectly related following a path through daily
hassles. Using the Baron and Kenny (1986) method for testing mediation, and Sobel’s
(1982) method to test the significance of the entire path, this hypothesis was supported.
During the first semester of university, adaptive copers report better adjustment in part
because adaptive coping reduced daily hassles, which in turn, was connected to better
adjustment to university.
Similarly, it was hypothesized that social support would share a direct relation
with adjustment to university and also an indirect relation mediated through daily
hassles. Although all of the required relations specified by Barron and Kenny (1986)
were met, the entire path was not significant and, thus, the hypothesis regarding daily
hassles as a mediator was not supported. It is possible that the variables are related in a
different way (i.e., moderating versus mediating) or that both hassles and social support
are each only directly related to adjustment.
The final mediational hypothesis, that health behaviours would be directly related
to adjustment and also indirectly related through daily hassle based stress was not
supported. Contrary to literature on stress and physical activity (Hudd et al, 2000; Skirka,
2000), in this study, physical activity and stress (daily hassle based stress) were not
significantly correlated. There are two main reasons that may explain the lack of the
expected relation. First, participants in this sample may not be exercising enough to
benefit from the stress reducing or protective benefit of exercise. Skirka (2000) found a
difference between students on perceived stress and daily hassles based on physical
activity. In that study, the non-exercising students worked out two times per week or
Adaptation and Adjustment 72
less, while members of the exercising group belonged to university sports teams, and
were involved in a regular training program (Skirka, 2000). Second, the measure used
may not be sensitive enough (as previously discussed) for use in smaller studies, even
though it is sensitive enough to detect a relation between stress and physical activity in
larger studies (where the actual effect size can be very small and still be detected).
4.7 Limitations
4.7.1 Attrition. There was a substantial attrition rate, especially among the men in
this study. Although the transition to university appears to be particularly difficult for
women, originally longitudinal hypotheses involving men were postulated. The reduced
numbers of men at Time 2 limited my ability to conduct comparisons of men and women
at Time 2, and also to comment on the longitudinal transition experience and adjustment
of men. Having lower participant numbers at Time 2 also places limitations on the
conclusions that can be drawn from the present study. Whether the high attrition rate
was in part a result of actual attrition from university between the first and second
semesters can not be determined, as I do not have permission to access student
records. Given that 68% of the students who completed the Time 1 questionnaire did not
contribute data at Time 2, most of the attrition is likely related to dropping out of the
study, and not from dropping out of school. It is highly probable that a high proportion of
the students who did not complete Time 2 had already earned all of their bonus marks
for their introductory psychology course, and therefore were no longer motivated to
complete the second questionnaire. Though I did not ask questions that specifically
pertained to motivation, data that was collected concerning adjustment and achievement
were tested for differences between students who contributed the full complement of
data and those that contributed data at Time 1 only. There were no significant
differences on Time 1 measures of grades, transition experience, or adjustment indices
(academic, social, personal/emotional) between the students who completed the study
(both men and women) and those who did not. This suggests that early achievement
was not related to attrition from the study. Similarly, the women who completed data at
both time points were compared to those who did not, and again no significant
differences were found. Therefore, better adjusted students or higher achievers are not
likely over or under represented at Time 2.
Adaptation and Adjustment 73
A higher proportion of men dropped out the study than was expected.
Specifically, although there was an expected count of 16 men for Time 2, only 7 actually
contributed data. To my knowledge there is no systematic reason as to why a greater
proportion of men would have dropped out then women. The low numbers of men who
completed data at Time 2 reduced the feasibility of an attrition analysis involving men
only. With such low numbers, even if there were differences between the men who
completed and the men who did not, they would be likely to go undetected. By excluding
men from all analyses involving Time 2, systematic undetected biases of the results are
avoided. In the current study, it is probable that the high attrition rate is an artifact of the
study structure (as described in the next section).
4.7.2 Online data collection. There are pros and cons to collecting data online.
Online data collection provides easy 24 hour access to students who wish to participate
in the study. The online questionnaire format was beneficial for students in that they did
not have to schedule and attend an appointment; they only had to log on at their
convenience. There is some evidence that students feel more at ease answering
questions about sensitive subjects, such as problematic alcohol consumption, online
rather than in person (Yi-Ching Wang, 2005). For the researcher, online data collection
works well in that the researcher also does not need to be present at scheduled
appointments. Online data collection is a time- and cost-effective data collection mode.
The main problem associated with collecting data online, however, is that it is up
to each student to read and retain the information given to them in writing. When a study
is conducted in person, normally the researcher would give instructions verbally and in
writing. It could be possible that students did not notice or remember that the study
consisted of two time points (Fall and Winter). Even though this study was longitudinal,
there was no additional benefit for the students to take part in both waves of data
collection. They were awarded their incentive bonus points for each part (Time 1 and
Time 2) separately as though it were two separate studies (students could not
participate at Time 2 if they had not participated at Time 1). Since I did not explain the
importance of completing both halves of the study to them in person, and the incentive
scheme did not draw attention to the longitudinal nature of the study, participants may
not have fully understood the importance of participating at both time points. It is also
Adaptation and Adjustment 74
possible that students did not plan to do the second half, but rather, completed their
bonus credits during first semester (by participating in unrelated studies). During second
semester, three reminder emails were sent to increase participation at Time 2, but for
those who had already achieved all eligible bonus marks and were not interested in the
chance to win a gift certificate, completing the study held no benefit.
In future, to offset low retention rates, I would attempt to recruit a larger number of
participants at the beginning. I would also look into the possibility of running the study
not as two separately credited halves but as a longitudinal study, where the credits are
awarded at the end of the study. Technically, participants may drop out of a study at any
time and receive full credit for participation. However, if the study credits were presented
in a format that matched the longitudinal nature of the study, it may increase retention by
drawing attention to the study length. If students were more aware of the importance of
both parts of the study, they may have planned to complete the second half.
4.8 Implications for Intervention
In the present sample, it was quite surprising to see such a high proportion of
under-age alcohol consumers. Moreover, one third of the present sample reported levels
of alcohol consumption that place them at risk. Of the students scoring an 8 or higher on
the AUDIT, 61% are under the legal drinking age. While drinking alcohol appears to be a
normative behaviour in university and is associated with social activities, drinking at a
hazardous level is associated with future alcohol related complications (Saunders et al.,
1993; Conigrave, Hall & Saunders, 1995). In the present study more problematic alcohol
consumption was associated with poorer grades and poorer academic adjustment at
both Time 1 and Time 2. There was no significant difference between students who
were of legal age to drink and students under the legal drinking age in terms of the
proportion of problem drinkers. There appears to be a need to address problematic
alcohol consumption and to promote harm reduction among first year students. The
AUDIT, although useful in research, is also a tool for identifying individuals for
interventions (Barbor, 2001). Students identified by the AUDIT as hazardous drinkers
could be targeted for intervention. According to Kurt et al. (2006), brief motivational
interview type interventions reduce both the number of drinks consumed per episode
and also the frequency of intoxication among college students. By reducing the amount
Adaptation and Adjustment 75
of frequency of alcohol consumption, the harms associated with over-consumption could
be avoided.
The results of the present study suggest that at least for women, some students
experience adjustment difficulties during first year of university, and that these
adjustment struggles become worse over the year. Student adjustment may be
improved through interventions that target the specific issues that first year student’s
face. Student’s who score more poorly on the SACQ may benefit greatly from individual
interventions where their specific issues are discussed, and advice is tailored to meet
individual needs (Baker and Siryk 1986).
4.9 Conclusions
The present study supports the idea that for at least some students the transition
to university is a stressful life event. Individual resources (psychosocial factors and
health behaviours) provide information about why some students are better able to deal
with the university transition than others. Past research has demonstrated that
interventions into the areas such as social support and adjustment have been beneficial.
In future research, psychosocial variables, health behaviours and adjustment to
university should be further investigated in a larger mixed-gender sample. Furthermore
the use of objective measures where possible may account for more variance in the
prediction of transition experience and adjustment in future studies. Consent to access
grade point averages and attrition statistics from student records for the participants in
future studies would enable researchers to look more closely at the link between
academic achievement and the study variables as well as to relate actual attrition to
adjustment. Measures of physical activity obtained through the use of accelerometers
may increase the ability to detect relations between stress and health and to test
mediating relations involving those constructs. Finally, collecting data about social
support networks in addition to social support would help to further explain the
relationship between students and their friends during a life transition and perhaps have
implications for improving social support based interventions for university students.
Adaptation and Adjustment 76
5. References
Aaron, D. J., & Kriska, A. M. (1997). Modifiable activity questionnaire for adolescents.
Medicine & Exercise in Sports & Exercise 29(6), 79-82.
Adlaf, E. M., Paglia, A., & Beitchman, J. H. (2001). The mental health and well-being of
Ontario students: Findings from the OSDUS 1991-2001. Toronto, Canada: Center
for Addition and Mental Health.
Asendorpf, J. B. (2000). Shyness and adaptation to the social world of university. In W.
R. Crozier (Ed.)., Shyness: Development, consolidation, and chance (pp. 103-
120). London: Routledge progress in Psychology.
Babor, T.F., Higgins-Biddle, J.C., Saunders, J.B., & Monteiro, M.G (2001). The Alcohol
Use Disorders Test: Guidelines for use in Primary Care. Retrieved January 2006
from WHO World Health Organization: ep
http://whqlibdoc.who.int/hq/2001/WHO_MSD_MSB_01.6a.pdf ,
lBaker, R. W., McNeil, O., & Siryk, B. (1985). Expectation and reality in freshman
adjustment to college. Journal of Counseling Psychology, 32, 94-103.
Baker, R. W., & Siryk, B. (1984). Measuring adjustment to college. Journal of
Counseling Psychology, 31, 179-189.
Baker, R. W., & Siryk, B. (1986). Exploratory intervention with a scale measuring
adjustment to college. Journal of Counselling Psychology, 33(1), 31-38.
Baum, A., Fleming, R., & Singer, J. E. (1983). Coping with victimization by technological
disaster. Journal of Social Issues, 39(2), 117-138.
Boekaerts, M. (1996). Coping with stress in childhood and adolescence. In M. Zeidner,
& N. S. Endler (Eds.). Handbook of coping: Theory, research, applications
(pp.452-483). USA: John Wiley & Sons, Inc.
Bray, S., & Kwan, M. (2006). Physical activity is associated with better health and
psychological well-being during transition to university life. Journal of American
College Health, 55(2), 77-81.
Bruning, J. L., & Kintz, B. L. (1997). Correlation and related topics: Reliability of
measurement. In P. McGeehon (Ed.). Computational Handbook of Statistics (4th
ed.) (pp. 77). USA: Addison-Wesley Educational Publishers Inc.
Adaptation and Adjustment 77
Callaghan, P. (2004). Exercise: A neglected intervention in mental health care? Journal
of Psychiatric and Mental Health Nursing, 11, 476-483.
Centers for Disease Control and Prevention. Methodology of the Youth Risk Behavior
Surveillance System. MMWR 2004; 53(No. RR-12):1-14.
Cohen, J. (1992). A power primer. Psychological Bulletin, 112(1), 155-159.
Conigrave, K., Hall, W., & Saunders, J. (1995). The AUDIT questionnaire: Choosing a
cut-off score. Addiction, 90(10),1349-1356.
Cramer, D. & Howitt, D. (2004). The sage dictionary of statistics: A practical resource for
students in the social sciences (pp. 168). London: Sage Publications Ltd.
Cutrona, C. E., & Russell, D. W. (1987). The provisions of social relationships and
adaptation to stress. Advances in Personal Relationships, 1, 37-67.
DeBerard, M. S., Spielmans, G. I., & Julka, D. C. (2004). Predictors of academic
achievement and retention among college freshmen: A longitudinal study.
College Student Journal, 38(1), 66-80,
Dill, P. L., & Henley, T. B. (1998). Stressors of college: A comparison of traditional and
nontraditional students. The Journal of Psychology, 132(1), 25-32.
Dinger, M. (2003). Reliability and convergent validity of the national college health risk
behavior survey physical activity items. American Journal of Health Education,
34(3), 162-166.
Eccles, J. S., & Barber, B. L. (1999). Student council, volunteering,
basketball, or marching band: What kind of extracurricular involvement matters?
Journal of Adolescent Research, 14, 10-43.
Eckenrode, J. (1984). Impact of chronic and acute stressors on daily reports of mood.
Journal of Personality and Social Psychology, 46(4), 907-918.
Edwards, J. E., & Waters, L. K. (1983). Predicting university attrition: A replication and
extension. Educational and Psychological Measurement, 43, 233-236.
Endler, N. S., & Parker, J. D. (1990). Multidimensional assessment of coping: A critical
evaluation. Journal o f Personality and Social Psychology, 58, 844-854.
Engs, R. C., Diebold, B. A., & Hanson, D.J. (1996). The drinking patterns and problems
of a national sample of college students. Journal of Alcohol and Drug Education,
41, 13-33.
Adaptation and Adjustment 78
Evans, P. D., & Edgerton, N. (1990). Life events as predictors of the common cold.
British Journal of Medical Psychology, 64, 35-44.
Fisher, S., & Hood, B. (1987). The stress of the transition to university: A longitudinal
study of psychological disturbance, absent-mindedness and vulnerability to
homesickness, The British Psychological Society, 78, 425-441.
Fisher, S., & Hood, B. (1988). Vulnerability factors in the transition to university: Self-
reported mobility history and sex differences as factors in psychological
disturbance. British Journal of Psychology, (79), 309-320.
Freedson, P., & Miller, K. (2000). Objective monitoring of physical activity using motion
sensors and heart rate. Research Quarterly for Exercise and Sport, 71(2), 21-29.
Gall, T. L., Evans, D. R., & Bellerose, S. (2000). Transitions to first-year university:
Patterns of change in adjustment across life domains and time. Journal of Social
and Clinical Psychology, 19(4), 544-567.
Garson, G. D. Scales and standard measures, Retrieved May 31, 2007, from North
Carolina State University, from
http://www2.chass.ncsu.edu/garson/pa765/standard.htm
Gelso, C. J., & Rowell, D. (1967). Academic adjustment and the persistence of students
with marginal academic potential. Journal of Counseling Psychology, 14(5), 478-
481.
Gerdes, H., & Mallinckrodt, B. (1994). Emotional, social, and academic adjustment of
college students: A longitudinal study of retention. Journal of Counseling and
Development, 72(3), 281-288.
Gray-Little, B., Williams, V. S. L., & Hancock, T. D. (1997). An item response theory
analysis of the Rosenberg self-esteem scale. Personality and Social Psychology
Bulletin, 23(5), 443-451.
Halamandaris, K. F., & Power, K. G. (1997). Individual differences, dysfunctional
attitudes, and social support: A study of the psychosocial adjustment to university
life of home students. Personality and Individual Differences, 22(1), 93-104.
Hays, R. B., & Oxley, D. (1986). Social network development and functioning during a
life transition, Journal of Personality and Social Psychology, 50(2), 305-313.
Hertel, J. B. (2002). College student generational status: Similarities, differences, and
Adaptation and Adjustment 79
factors in college adjustment. The Psychological Record, 52(1), 3-18.
Hewitt, P. L., & Flett, G. L. (1996). Personality traits and the coping process. In M.
Zeidner, & N. S. Endler (Eds.). Handbook of coping: Theory, research,
applications (pp.410-433). USA: John Wiley & Sons, Inc.
Hickman, G., Bartholomae, S., & McKenry, P. (2000). Influence of parenting style on the
adjustment and academic achievement of traditional college freshmen. Journal of
College Student Development, 41(1), 41-54.
Hinkle, J. S. (1992). Aerobic running behavior and psychotherapeutics: Implications for
sports counseling and psychology. Journal of Sport Behavior,15, 263-277.
Howell, D. C. (2002). Multiple regression. In C. Crokett (Ed.) Statistical Methods for
Psychology 5th Edition (pp.533-601). Pacific Grove CA: Duxbury.
Hudd, S. S., Dumlao, J., Erdmann-Sager, D., Murray, D., Phan, E., Soukas, N., et al.
(2000). Stress at college: Effects on health habits, health status, and self-esteem.
College Student Journal, (34)2, 217-227.
Jennison, K. M. (2004). The short-term effects and unintended long-term consequences
of binge drinking in college: A 10-year follow-up study. The American Journal of
Drug and Alcohol Abuse, 30(3), 659-684.
Jessor, R., Turbin, M., & Costa, F. (1998). Protective factors in adolescent health
behaviour. Journal of Personality and Social Psychology, 75(3), 788-800.
Kanner, A. D., Coyne, J. C., Schaefer, C., & Lazarus, R. S. (1981). Comparison of two
modes of stress measurement: Daily hassles and uplifts versus major life events.
Journal of Behavioral Medicine, 4(1), 1-37.
Kerr, S., Johnson, V., Gans, S., & Krumrine, J. (2004). Predicting adjustment during the
transition to college: Alexithymia, perceived stress, and psychological symptoms.
Journal of College Student Development, 45(6), 593-611.
Kohn, P. M. (1996). On coping adaptively with daily hassles. In M. Zeidner, & N. S.
Endler (Eds.). Handbook of coping: Theory, research, applications (pp.181-201).
USA: John Wiley & Sons, Inc.
Kohn, P. M., Hay, B. D., & Legere, J. J. (1994). Hassles, coping styles, and negative
well-being. Personality and Individual Differences, 17, 169-179.
Adaptation and Adjustment 80
Kohn, P. M., Lafreniere, K., & Gurevich, M. (1990). The inventory of college students’
recent life experiences: A decontaminated hassles scale for a special population.
Journal of Behavioral Medicine, 13(6), 619-630.
Kohn, P. M., O’Brien-Wood, C., Pickering, D. I., & Decicco, T. L. (2003). The personal
functioning inventory: A reliable and valid measure of adaptiveness in coping.
Canadian Journal of Behavioural Science, 35(2), 111-123.
Kohn, P. M., & Veres, E. (2001). Fewer hassles mediate the auspicious effects of
adaptive coping on student adjustment. Unpublished manuscript, York University.
Labouvie, E., & Bates, M. E. (2002). Reasons for alcohol use in young adulthood:
Validation of a three dimensional measure. Journal of Studies on Alcohol, 63, 45-
155.
Lamothe, D., Currie, F., Alisat, S., Sullivan, T., Pratt, M., Pancer, M., et al. (1995).
Impact of a social support intervention on the transition to university. Canadian
Journal of Community, (14)2, 167-180.
Lau, R. R., Jacobs Quadrel, M., & Hartman, K. A. (1990). Development and change of
young adults’ preventative health beliefs and behaviour: Influence from parents
and peers. Journal of Health and Social Behavior, 31(3), 240-259.
Lazarus, R. S., & Folkman, S. (1987). Transactional theory and research on emotions
and coping. European Journal of Personality, 1, 141-169.
Lu, L. (1991). Daily hassles and mental health: A longitudinal study. British Journal of
Psychology, 82, 441-447.
MacPherson, C. (2006). Why they stay, and why they go: A major study examines
retention & attrition at the UofS. University of Saskatchewan: On Campus News,
Nov. 3 retrieved May 31, 2007 from
http://www.usask.ca/communications/ocn/06- nov-03/5.php
Masten, A. S., Hubbard, J. J., Gest, S. D., Tellegen, A., Garmezy, N., & Ramirez, M.
(1999). Competence in the context of adversity: Pathways to resilience and
maladaptation from childhood to late adolescence. Development and
Psychopathology, 11, 143-169.
Matheny, K. B., Curlette, W. L., Aysan, F., Herrington, A., Gfroerer, C. A., Thompson, D.,
et al. (2002). Coping resources, perceived stress, and life satisfaction among
Adaptation and Adjustment 81
Turkish and American university students. International Journal of Stress
Management, 9(2), 81-97.
McCann, I. L., & Holmes, D. S. (1984). Influence of aerobic exercise on depression.
Journal of Personality and Social Psychology, 46, 1142-1147.
McDougall, P., & Hymel, S. (1998). Moving into middle school: Individual differences in
the transition experience. Canadian Journal of Behavioural Science, 30(2), 108-
120.
Michael, K. D., Curtin, L., Kirkley, D. E., Jones, D. L., & Harris, R. (2006). Group-based
motivational interviewing for alcohol use among college students: An exploratory
study. Professional Psychology Research and Practice, 37 (6), 629-634.
Mooney, S. P., Sherman, M. F., & lo Presto, C. T. (1991). Academic locus of control,
self-esteem, and perceived distance from home as predictors of college
adjustment. Journal of Counseling & Development. 69(5), 445-448.
Nelson, T., & Wechsler, H. (2001). Alcohol and college athletes. Medicine & Science in
Sports & Exercise, 33(1), 43-47.
Olsson, C. A., Bond, L., Burns, J. M., Vella-Brodrick, D. A., & Sawyer, S. M. (2003).
Adolescent resilience: A concept analysis. Journal of Adolescence, (26) 1-11.
Paul, E., & Brier, S. (2001). Friendsickness in the transition to college: Pre college
predictors and college adjustment correlates. Journal of Counseling and
Development. 79(1), 77-89
Pearson Assessments (n.d. from Development staff) Achievement Test-Retest
Reliability. Retrieved June 1, 2007, from
http://ags.pearsonassessments.com/assessments/retest.asp
Perkins, W. H. (2002). Surveying the damage: A review of research on consequences of
alcohol misuse in college populations. Journal of Studies on Alcohol, 14, 91-100.
Perkins, W. H. (1999). Stress-motivated drinking in collegiate and post college young
adulthood: Life course and gender patterns. Journal of Studies on Alcohol, 60,
219-227.
Pratt, M. W., Hunsberger, B., Pancer, S. M., Alisat, S., Bowers, C., Mackey, K., et al.
(2000). Facilitating the transition to university: Evaluation of a social support
Adaptation and Adjustment 82
discussion intervention program. Journal of College Student Development, (41)4,
427-441.
Prinstein, M. J., & La Greca, A. M. (2004). Childhood peer rejection and aggression as
predictors of adolescent girls’ externalizing and health risk behaviours: A 6-year
longitudinal study. Journal of Consulting and Clinical Psychology, 1(72), 103-112.
Robins, R. W., Hendin, H. M., & Trzesniewski, K. H. (2001). Measuring global self-
esteem: Construct validation of a single item measure and the Rosenberg self-
esteem scale. Personality and Social Psychology Bulletin, 27(2), 151-161.
Rockafellow, B. D., & Saules, K. K. (2006). Substance use by college students: The role
of Intrinsic versus extrinsic motivation for athletic involvement. Psychology of
Addictive Behaviors, 20(3), 279-287.
Rosenberg, M. (1989). Society and the adolescent self-image (Rev. ed.). Middletown,
Connecticut: Wesleyan University Press.
Rosenberg, M., Schooler, C., Schoenbach, C., & Rosenberg, F. (1995). Global self-
esteem and specific self-esteem: Different concepts, different outcomes.
American Sociological Review, 141-156.
Sallis, J. F., & Saelens, B. E. (2000). Assessment of physical activity by self-report:
Status, limitations, and future directions. Research Quarterly for Exercise and
Sport, 71(2), 1-14.
Saunders, J. B., Aasland, O. G., Babor, T. F., De La Fuente, J. R., & Grant, M. (1993)
Development of the alcohol use disorders identification test (AUDIT): WHO
collaborative project on early detection of persons with harmful alcohol
consumption-II. Addiction, 88, 791-804.
Search Institute (n.d.) 40 Developmental assets for adolescents (ages 12-18). Retrieved
May 30, 2007, from http://www.search-institute.org/assets/40Assetslist.pdf
Search Institute (n.d.) Why are the 40 developmental assets important? Retrieved July
10, 2004, from http://www.search-institute.org/assets/importance.html
Shaver, P. (1985). Transition to college: Network changes, social skills, and loneliness.
In S. Duck, & D Perlman (Eds.) Understanding Personal Relationship: An
interdisciplinary Approach (pp.193-219). Thousand Oaks, CA: Sage.
Adaptation and Adjustment 83
Skirka, N. (2000). The relationship of hardiness, sense of coherence, sports
participation, and gender to perceived stress and psychological symptoms among
college students. Journal of Sports Medicine and Physical Fitness, 40(1), 63-70.
Smith, T. W., Orleans, C. T., & Jenkins, C. D. (2004). Prevention and health promotion:
Decades of progress, new challenges, and an emerging agenda. Health
Psychology, (23)2, 126-131.
Statistics Canada (1997) Selected leading causes of death by sex. Retrieved
September, 5, 2004, from http://www.statcan.ca/english/Pgdb/health36.htm
Statistics Canada (1999). Statistical report on the health of Canadians. Prepared by the
Federal, Provincial and Territorial Advisory Committee on Population Health for
the Meeting of Ministers of Health, Charlottetown, PEI, September 16-17.
Straub, R. O. (2002). Health Psychology. New York, NY: Worth Publishers.
Tabachnick, B. G., & Fidell, L. S. (2001). Using multivariate statistics: Forth edition.
USA: Allyn & Bacon.
Tao, S., Dong, Q., Pratt, M., Hunsberger, B., & Pancer, M. (2000). Social support:
Relations to coping and adjustment during the transition to university in the
people’s republic of China. Journal of Adolescent Research, 15(1), 123-144.
Trockel, M. Barnes, M., & Egget, D. (2000). Health-related variables and academic
performance among first-year college students: Implications for sleep and other
behaviors. Journal of American College Health, 49, 125-131.
Troped, P., Wiecha, J., Fragala, M., Matthews, C., Finkelstein, D., Kim, J., et al. (2007).
Reliability and validity of YRBS physical activity items among middle school
students. Medicine & Science in Sports & Exercise, 416-425
The American Psychological Association. (2004). The road to resilience. Retrieved July
28, 2004, from
http://www.apahelpcenter.org/featuredtopics/feature.php?id=6&ch=1
University of Saskatchewan 1999-2000 annual report: Building on our strengths
Retrieved July 15, 2004, from http://www.usask.ca/uofs/annual-
report2000/welcoming.html
Unknown Author (Sept. 17, 1999). Student retention gets boost. University of
Saskatchewan: On Campus News, 7(2) retrieved May 31, 2007 from
Adaptation and Adjustment 84
http://www.usask.ca/communications/ocn/Sept17-99/news1b.html
Vickers, K., Patten, C., Bronars, C., Lane, K., Stevens, S., Croghan, I., et al. (2004).
Binge drinking in female college students: The association of physical activity,
weight concern, and depressive symptoms. Journal of American College Health,
53(3), 133-140.
Wechsler, H., Davenport, A., Dowdall, G., & Grossman, S. (1997). Binge drinking,
tobacco, and illicit drug use and involvement in college athletics: A survey of
students at 140 American colleges. Journal of American College Health, 45(5),
195-200.
Wechsler, J., Dowdall, G. W., Maenner, G., Gledhill-Hoyt, J., & Hang, L. (1998).
Changes in binge drinking and related problems among American college
students between 1993 and 1997. Journal of American College Health, 47(2), 57-
68.
Williams, P. G., Holmbeck, G. N., & Greenley, R. N. (2002). Adolescent health
psychology. Journal of Consulting and Clinical Psychology, 70(3), 828-842.
Wintre, M., Bowers, C., Gordner, N., Lange, L., & Lange, L. (2006). Re-evaluating the
university attrition statistic: A longitudinal follow-up study. Journal of Adolescent
Research, 21(2), 111-132.
Zeidner, M., & Saklofske, D. (1996). Adaptive and maladaptive coping. In M. Zeidner, &
N. S. Endler (Eds.). Handbook of coping: Theory, research, applications (pp.505-
531). USA: John Wiley & Sons, Inc.
Zweig, J. M., Phillips, S. D., & Duberstein Lindberg, L. (2002). Predicting adolescent
profiles of risk: Looking beyond demographics. Journal of Adolescent Health, 31,
343-353.
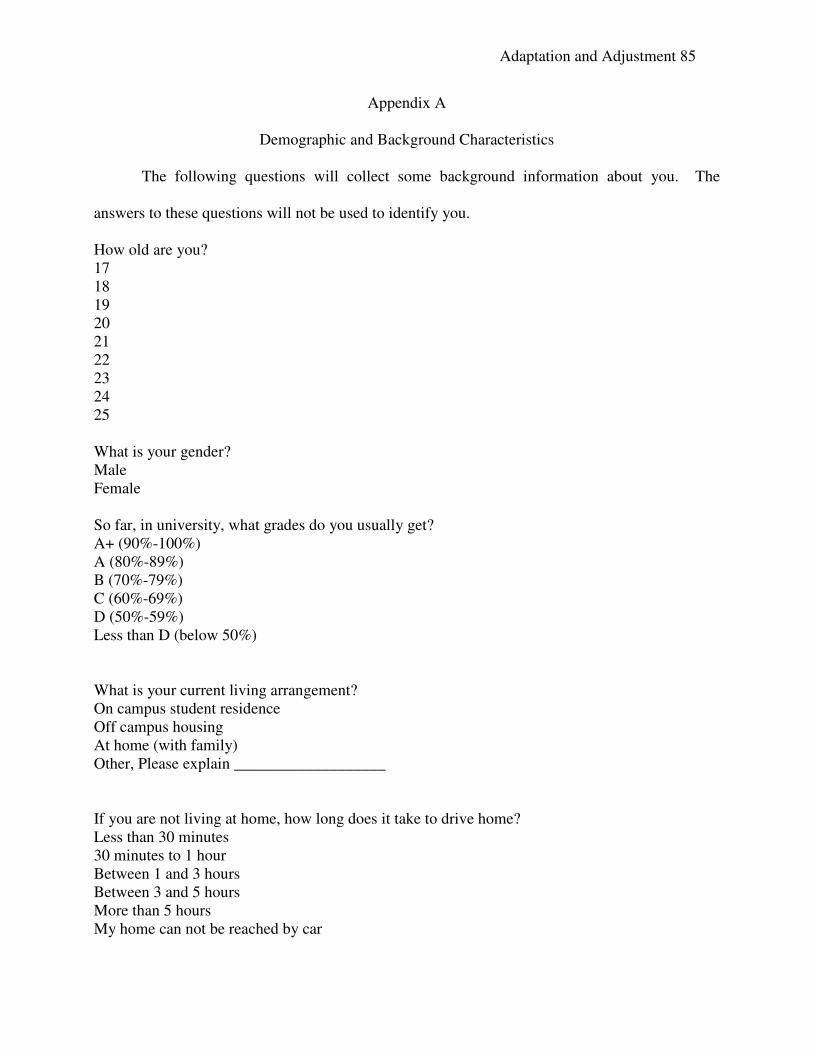
Adaptation and Adjustment 85
Appendix A
Demographic and Background Characteristics
The following questions will collect some background information about you. The
answers to these questions will not be used to identify you.
How old are you?
17
18
19
20
21
22
23
24
25
What is your gender?
Male
Female
So far, in university, what grades do you usually get?
A+ (90%-100%)
A (80%-89%)
B (70%-79%)
C (60%-69%)
D (50%-59%)
Less than D (below 50%)
What is your current living arrangement?
On campus student residence
Off campus housing
At home (with family)
Other, Please explain ___________________
If you are not living at home, how long does it take to drive home?
Less than 30 minutes
30 minutes to 1 hour
Between 1 and 3 hours
Between 3 and 5 hours
More than 5 hours
My home can not be reached by car
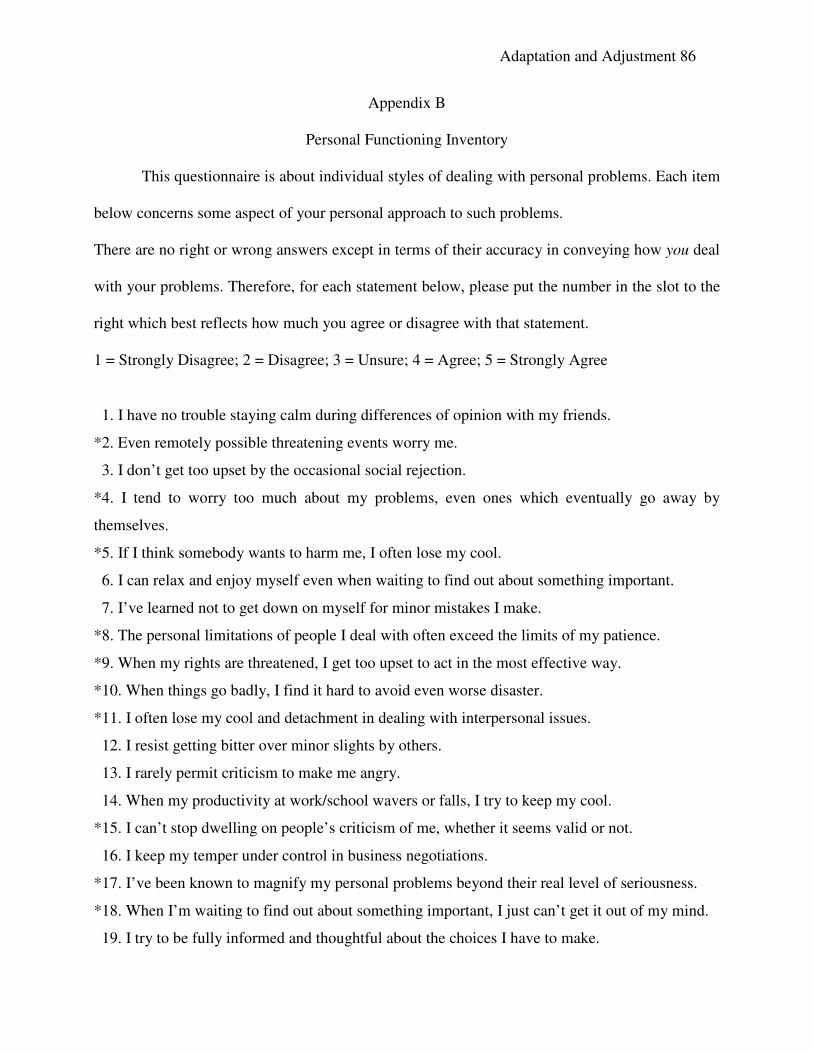
Adaptation and Adjustment 86
Appendix B
Personal Functioning Inventory
This questionnaire is about individual styles of dealing with personal problems. Each item
below concerns some aspect of your personal approach to such problems.
There are no right or wrong answers except in terms of their accuracy in conveying how you deal
with your problems. Therefore, for each statement below, please put the number in the slot to the
right which best reflects how much you agree or disagree with that statement.
1 = Strongly Disagree; 2 = Disagree; 3 = Unsure; 4 = Agree; 5 = Strongly Agree
1. I have no trouble staying calm during differences of opinion with my friends.
*2. Even remotely possible threatening events worry me.
3. I don’t get too upset by the occasional social rejection.
*4. I tend to worry too much about my problems, even ones which eventually go away by
themselves.
*5. If I think somebody wants to harm me, I often lose my cool.
6. I can relax and enjoy myself even when waiting to find out about something important.
7. I’ve learned not to get down on myself for minor mistakes I make.
*8. The personal limitations of people I deal with often exceed the limits of my patience.
*9. When my rights are threatened, I get too upset to act in the most effective way.
*10. When things go badly, I find it hard to avoid even worse disaster.
*11. I often lose my cool and detachment in dealing with interpersonal issues.
12. I resist getting bitter over minor slights by others.
13. I rarely permit criticism to make me angry.
14. When my productivity at work/school wavers or falls, I try to keep my cool.
*15. I can’t stop dwelling on people’s criticism of me, whether it seems valid or not.
16. I keep my temper under control in business negotiations.
*17. I’ve been known to magnify my personal problems beyond their real level of seriousness.
*18. When I’m waiting to find out about something important, I just can’t get it out of my mind.
19. I try to be fully informed and thoughtful about the choices I have to make.
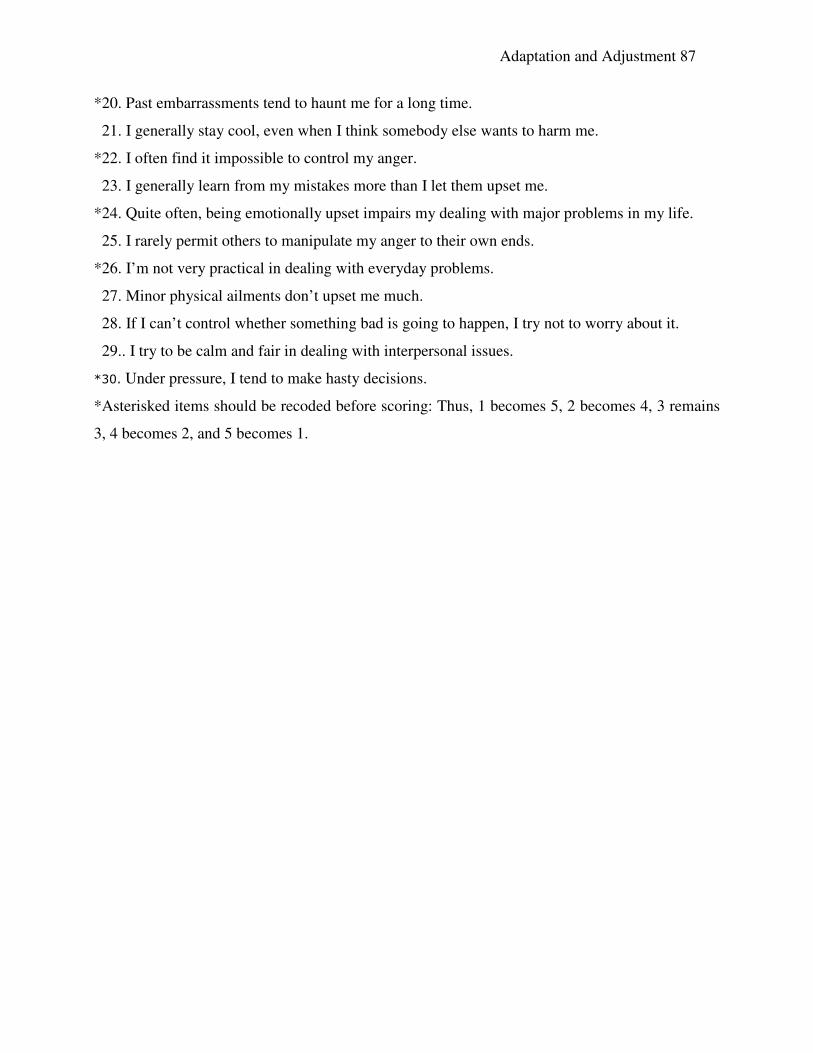
Adaptation and Adjustment 87
*20. Past embarrassments tend to haunt me for a long time.
21. I generally stay cool, even when I think somebody else wants to harm me.
*22. I often find it impossible to control my anger.
23. I generally learn from my mistakes more than I let them upset me.
*24. Quite often, being emotionally upset impairs my dealing with major problems in my life.
25. I rarely permit others to manipulate my anger to their own ends.
*26. I’m not very practical in dealing with everyday problems.
27. Minor physical ailments don’t upset me much.
28. If I can’t control whether something bad is going to happen, I try not to worry about it.
29.. I try to be calm and fair in dealing with interpersonal issues.
*30. Under pressure, I tend to make hasty decisions.
*Asterisked items should be recoded before scoring: Thus, 1 becomes 5, 2 becomes 4, 3 remains
3, 4 becomes 2, and 5 becomes 1.
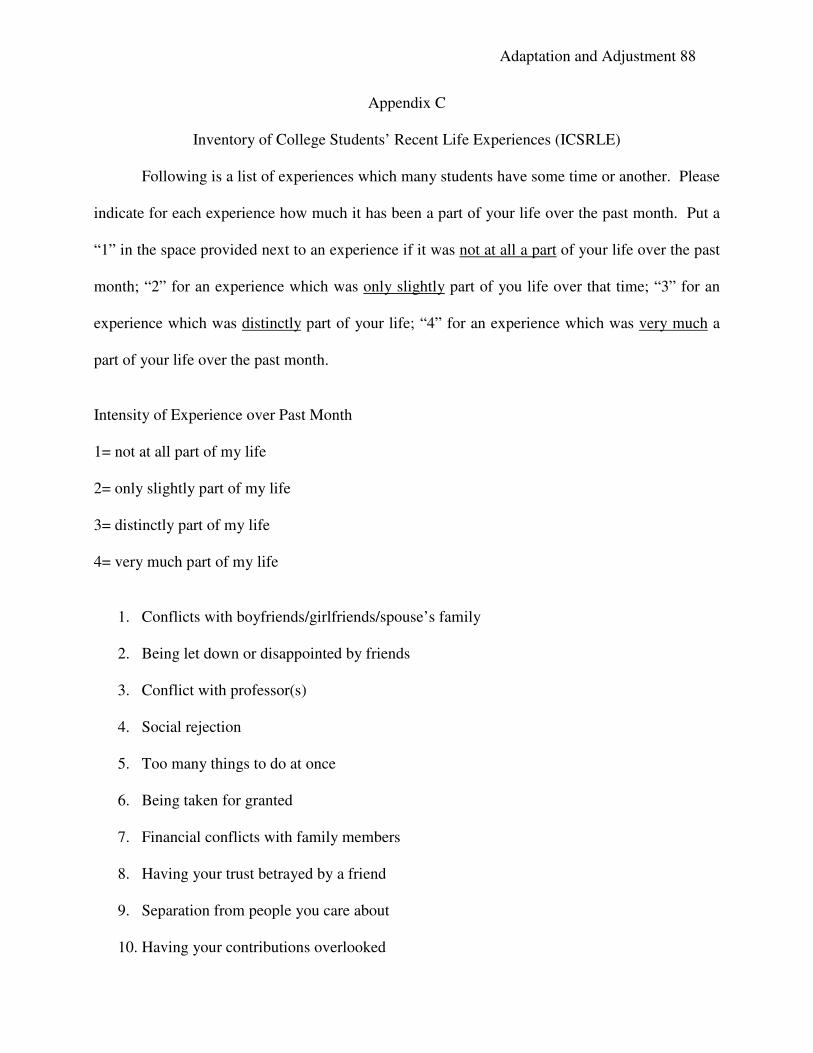
Adaptation and Adjustment 88
Appendix C
Inventory of College Students’ Recent Life Experiences (ICSRLE)
Following is a list of experiences which many students have some time or another. Please
indicate for each experience how much it has been a part of your life over the past month. Put a
“1” in the space provided next to an experience if it was not at all a part of your life over the past
month; “2” for an experience which was only slightly part of you life over that time; “3” for an
experience which was distinctly part of your life; “4” for an experience which was very much a
part of your life over the past month.
Intensity of Experience over Past Month
1= not at all part of my life
2= only slightly part of my life
3= distinctly part of my life
4= very much part of my life
1. Conflicts with boyfriends/girlfriends/spouse’s family
2. Being let down or disappointed by friends
3. Conflict with professor(s)
4. Social rejection
5. Too many things to do at once
6. Being taken for granted
7. Financial conflicts with family members
8. Having your trust betrayed by a friend
9. Separation from people you care about
10. Having your contributions overlooked
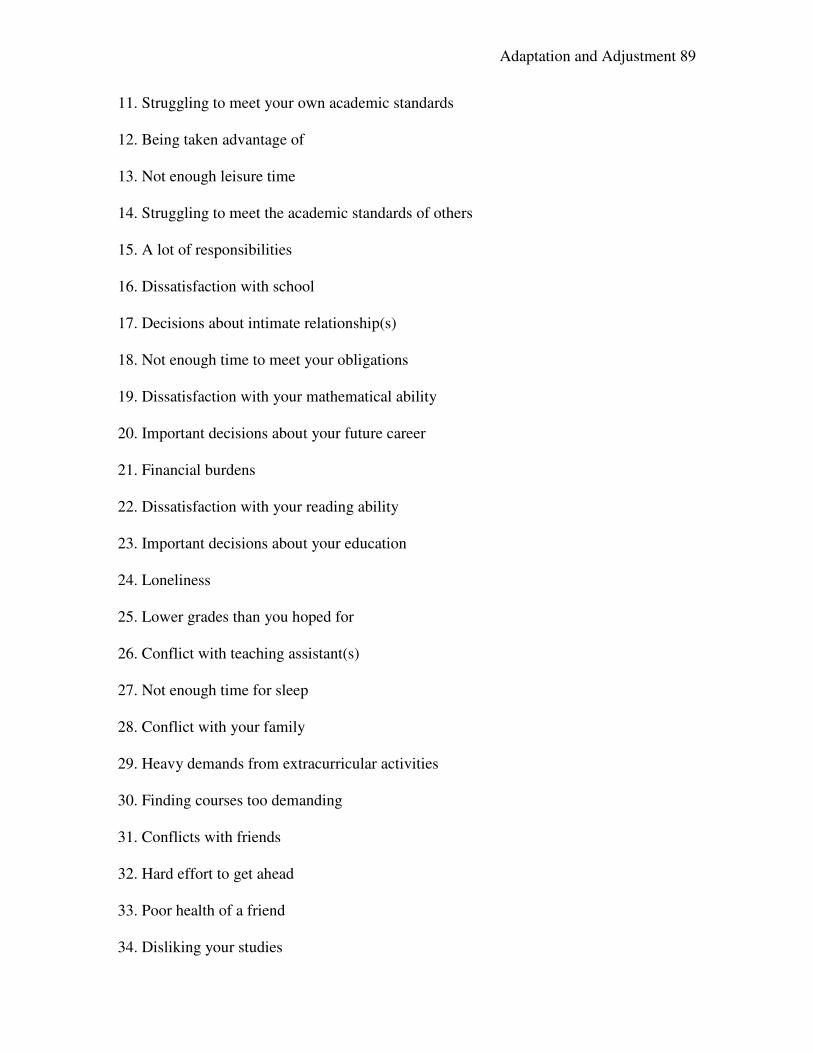
Adaptation and Adjustment 89
11. Struggling to meet your own academic standards
12. Being taken advantage of
13. Not enough leisure time
14. Struggling to meet the academic standards of others
15. A lot of responsibilities
16. Dissatisfaction with school
17. Decisions about intimate relationship(s)
18. Not enough time to meet your obligations
19. Dissatisfaction with your mathematical ability
20. Important decisions about your future career
21. Financial burdens
22. Dissatisfaction with your reading ability
23. Important decisions about your education
24. Loneliness
25. Lower grades than you hoped for
26. Conflict with teaching assistant(s)
27. Not enough time for sleep
28. Conflict with your family
29. Heavy demands from extracurricular activities
30. Finding courses too demanding
31. Conflicts with friends
32. Hard effort to get ahead
33. Poor health of a friend
34. Disliking your studies
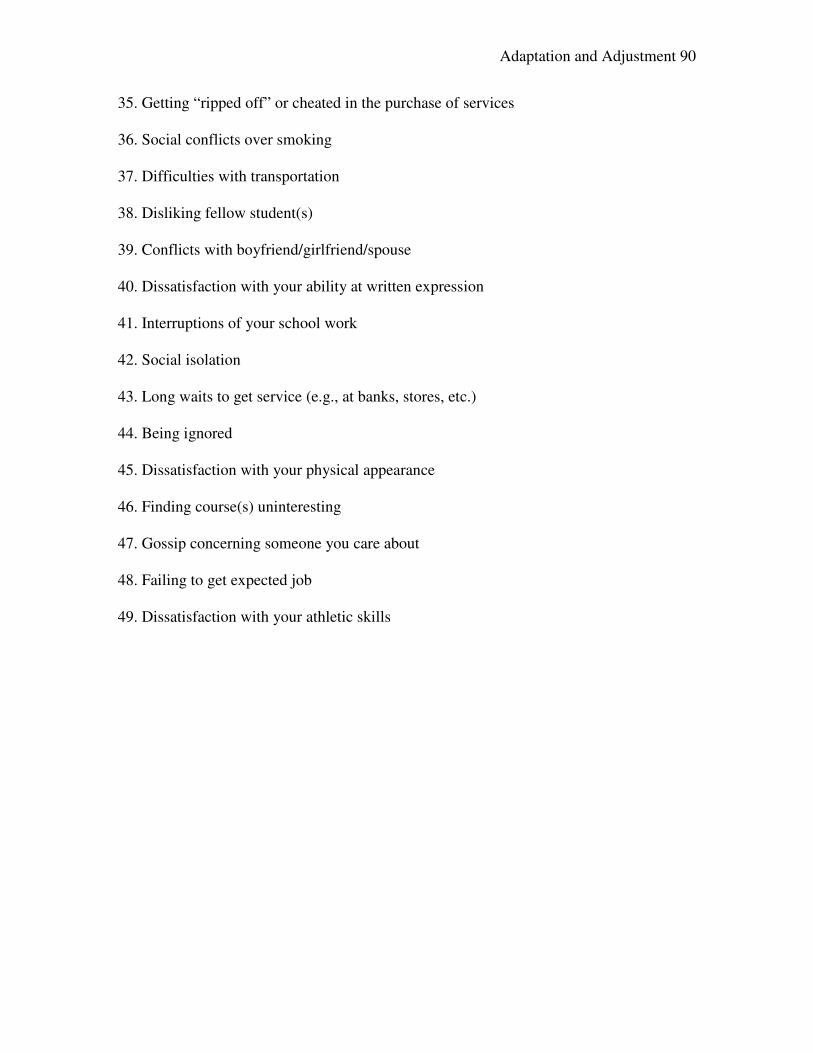
Adaptation and Adjustment 90
35. Getting “ripped off” or cheated in the purchase of services
36. Social conflicts over smoking
37. Difficulties with transportation
38. Disliking fellow student(s)
39. Conflicts with boyfriend/girlfriend/spouse
40. Dissatisfaction with your ability at written expression
41. Interruptions of your school work
42. Social isolation
43. Long waits to get service (e.g., at banks, stores, etc.)
44. Being ignored
45. Dissatisfaction with your physical appearance
46. Finding course(s) uninteresting
47. Gossip concerning someone you care about
48. Failing to get expected job
49. Dissatisfaction with your athletic skills
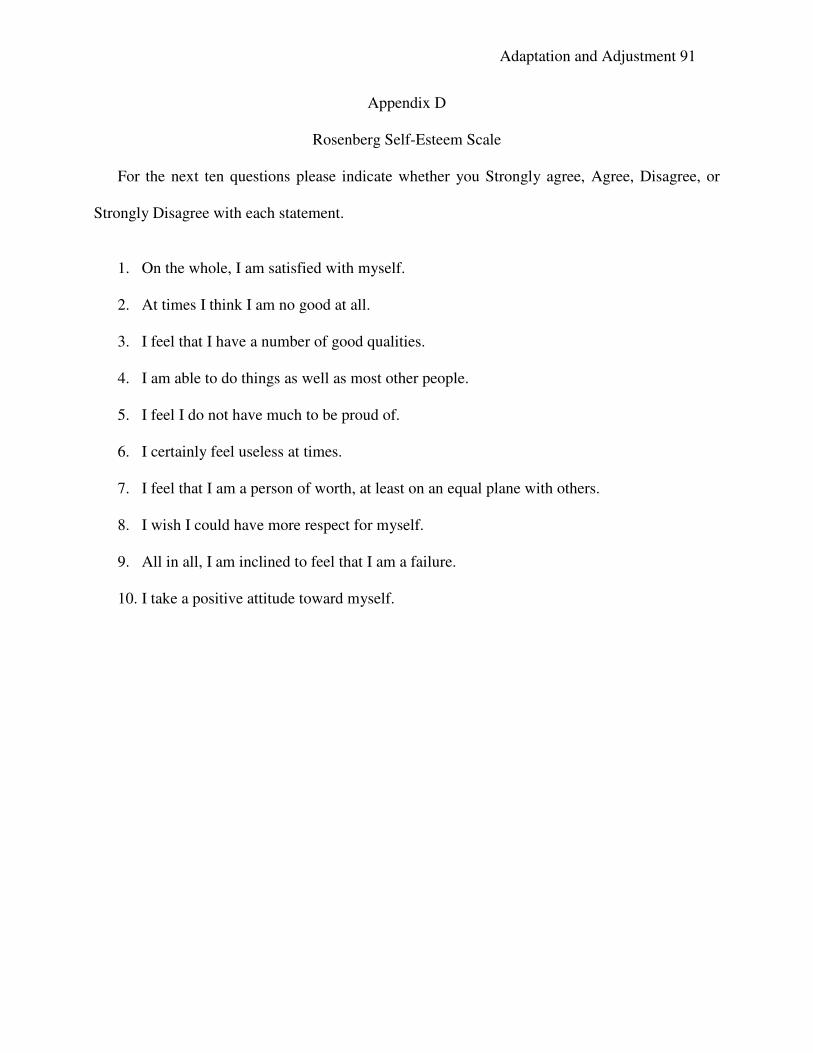
Adaptation and Adjustment 91
Appendix D
Rosenberg Self-Esteem Scale
For the next ten questions please indicate whether you Strongly agree, Agree, Disagree, or
Strongly Disagree with each statement.
1. On the whole, I am satisfied with myself.
2. At times I think I am no good at all.
3. I feel that I have a number of good qualities.
4. I am able to do things as well as most other people.
5. I feel I do not have much to be proud of.
6. I certainly feel useless at times.
7. I feel that I am a person of worth, at least on an equal plane with others.
8. I wish I could have more respect for myself.
9. All in all, I am inclined to feel that I am a failure.
10. I take a positive attitude toward myself.
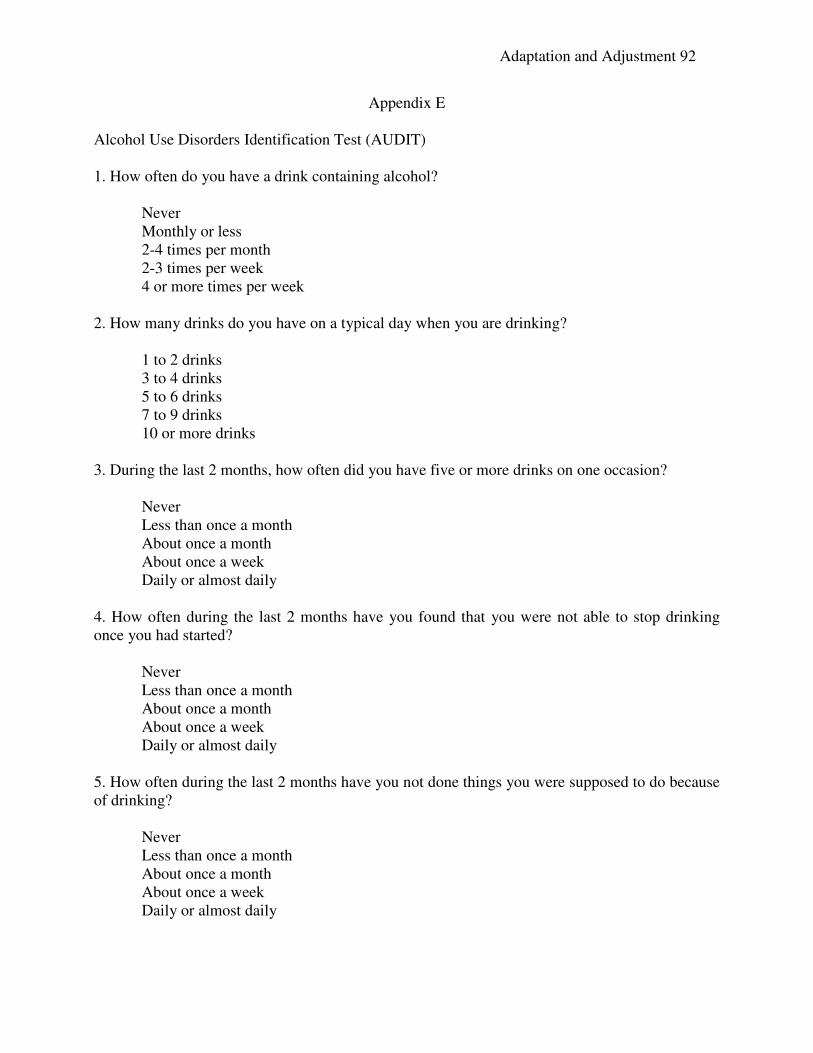
Adaptation and Adjustment 92
Appendix E
Alcohol Use Disorders Identification Test (AUDIT)
1. How often do you have a drink containing alcohol?
Never
Monthly or less
2-4 times per month
2-3 times per week
4 or more times per week
2. How many drinks do you have on a typical day when you are drinking?
1 to 2 drinks
3 to 4 drinks
5 to 6 drinks
7 to 9 drinks
10 or more drinks
3. During the last 2 months, how often did you have five or more drinks on one occasion?
Never
Less than once a month
About once a month
About once a week
Daily or almost daily
4. How often during the last 2 months have you found that you were not able to stop drinking
once you had started?
Never
Less than once a month
About once a month
About once a week
Daily or almost daily
5. How often during the last 2 months have you not done things you were supposed to do because
of drinking?
Never
Less than once a month
About once a month
About once a week
Daily or almost daily
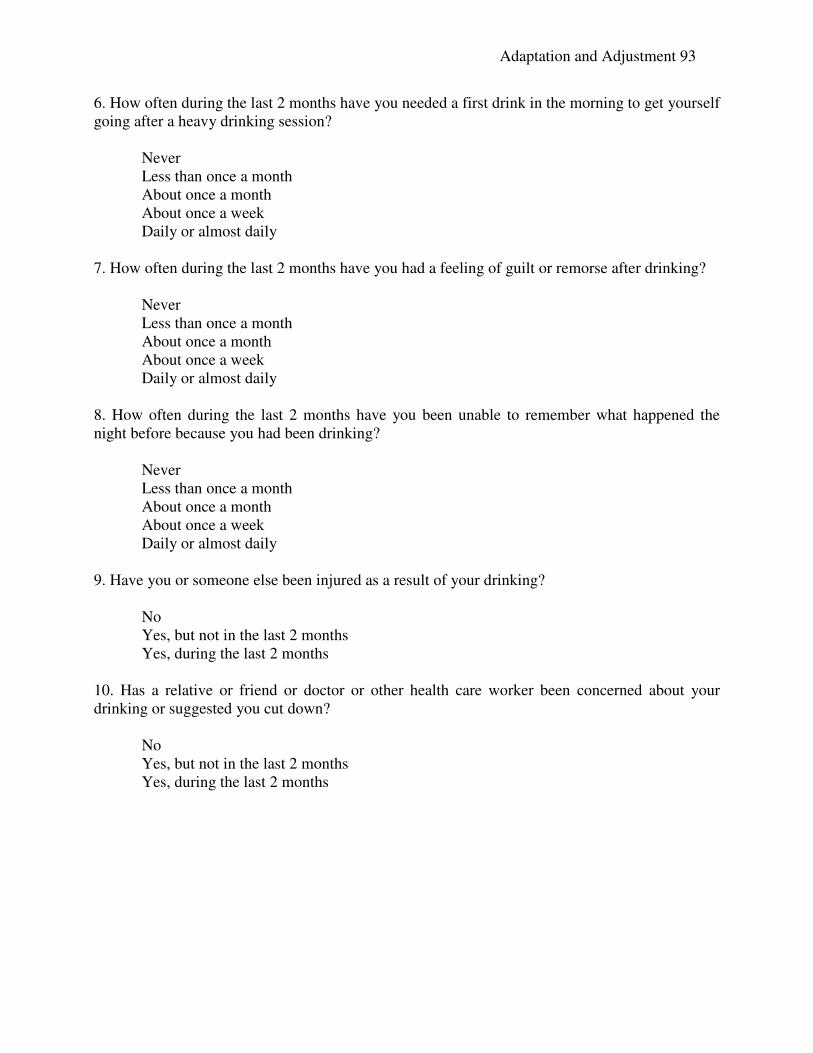
Adaptation and Adjustment 93
6. How often during the last 2 months have you needed a first drink in the morning to get yourself
going after a heavy drinking session?
Never
Less than once a month
About once a month
About once a week
Daily or almost daily
7. How often during the last 2 months have you had a feeling of guilt or remorse after drinking?
Never
Less than once a month
About once a month
About once a week
Daily or almost daily
8. How often during the last 2 months have you been unable to remember what happened the
night before because you had been drinking?
Never
Less than once a month
About once a month
About once a week
Daily or almost daily
9. Have you or someone else been injured as a result of your drinking?
No
Yes, but not in the last 2 months
Yes, during the last 2 months
10. Has a relative or friend or doctor or other health care worker been concerned about your
drinking or suggested you cut down?
No
Yes, but not in the last 2 months
Yes, during the last 2 months
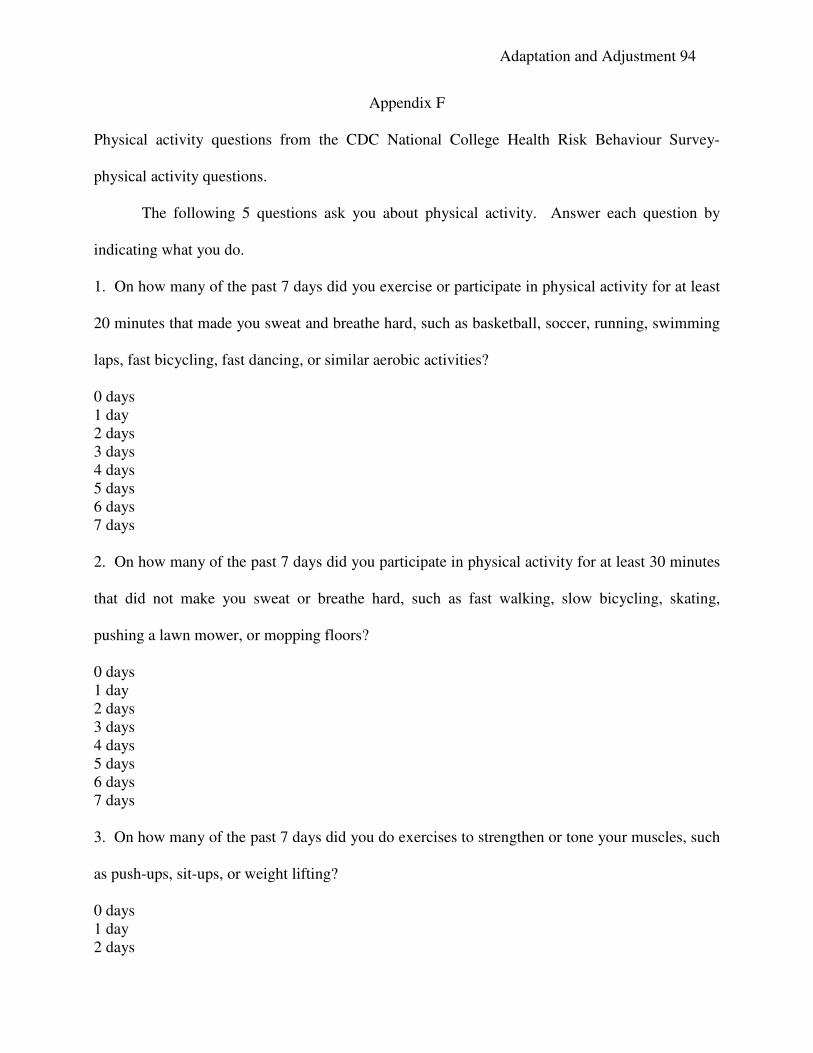
Adaptation and Adjustment 94
Appendix F
Physical activity questions from the CDC National College Health Risk Behaviour Survey-
physical activity questions.
The following 5 questions ask you about physical activity. Answer each question by
indicating what you do.
1. On how many of the past 7 days did you exercise or participate in physical activity for at least
20 minutes that made you sweat and breathe hard, such as basketball, soccer, running, swimming
laps, fast bicycling, fast dancing, or similar aerobic activities?
0 days
1 day
2 days
3 days
4 days
5 days
6 days
7 days
2. On how many of the past 7 days did you participate in physical activity for at least 30 minutes
that did not make you sweat or breathe hard, such as fast walking, slow bicycling, skating,
pushing a lawn mower, or mopping floors?
0 days
1 day
2 days
3 days
4 days
5 days
6 days
7 days
3. On how many of the past 7 days did you do exercises to strengthen or tone your muscles, such
as push-ups, sit-ups, or weight lifting?
0 days
1 day
2 days
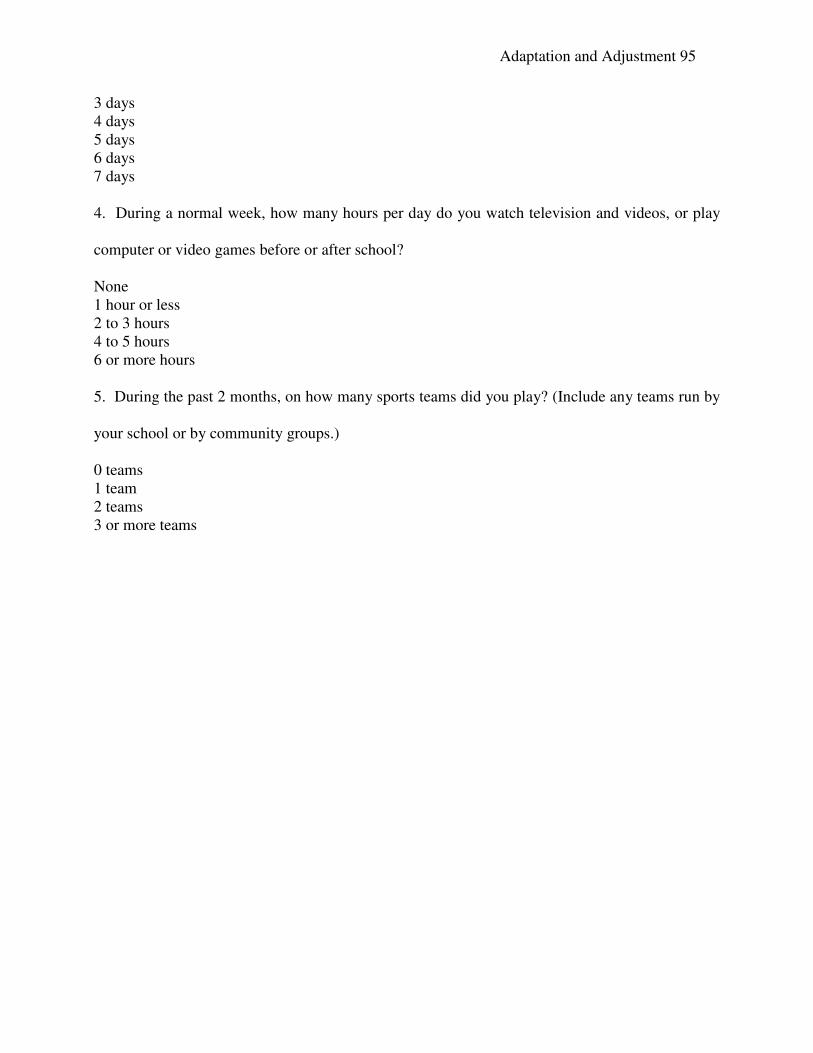
Adaptation and Adjustment 95
3 days
4 days
5 days
6 days
7 days
4. During a normal week, how many hours per day do you watch television and videos, or play
computer or video games before or after school?
None
1 hour or less
2 to 3 hours
4 to 5 hours
6 or more hours
5. During the past 2 months, on how many sports teams did you play? (Include any teams run by
your school or by community groups.)
0 teams
1 team
2 teams
3 or more teams
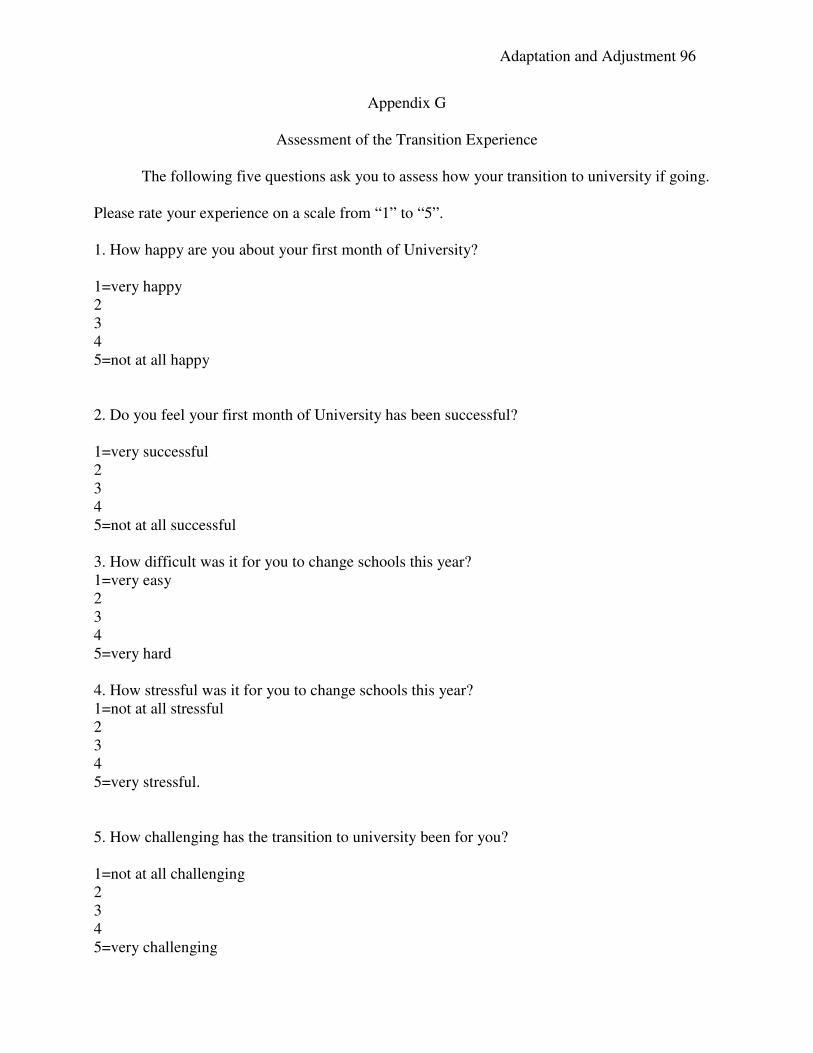
Adaptation and Adjustment 96
Appendix G
Assessment of the Transition Experience
The following five questions ask you to assess how your transition to university if going.
Please rate your experience on a scale from “1” to “5”.
1. How happy are you about your first month of University?
1=very happy
2
3
4
5=not at all happy
2. Do you feel your first month of University has been successful?
1=very successful
2
3
4
5=not at all successful
3. How difficult was it for you to change schools this year?
1=very easy
2
3
4
5=very hard
4. How stressful was it for you to change schools this year?
1=not at all stressful
2
3
4
5=very stressful.
5. How challenging has the transition to university been for you?
1=not at all challenging
2
3
4
5=very challenging
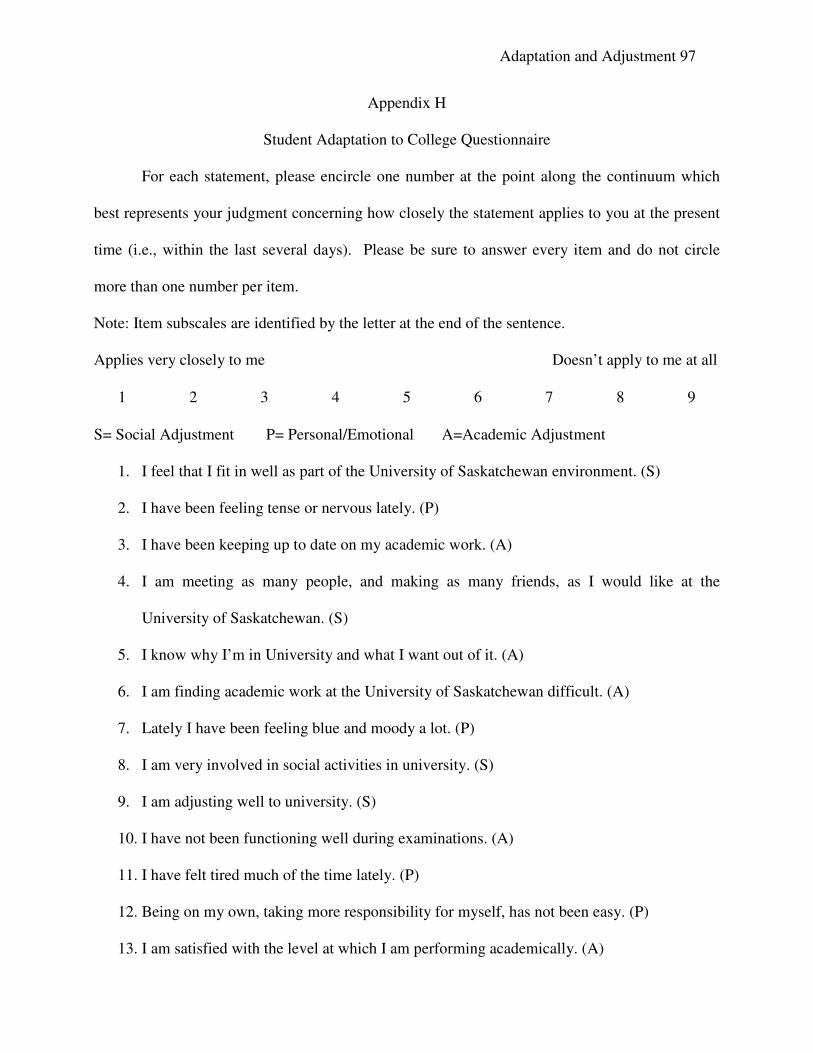
Adaptation and Adjustment 97
Appendix H
Student Adaptation to College Questionnaire
For each statement, please encircle one number at the point along the continuum which
best represents your judgment concerning how closely the statement applies to you at the present
time (i.e., within the last several days). Please be sure to answer every item and do not circle
more than one number per item.
Note: Item subscales are identified by the letter at the end of the sentence.
Applies very closely to me Doesn’t apply to me at all
1 2 3 4 5 6 7 8 9
S= Social Adjustment P= Personal/Emotional A=Academic Adjustment
1. I feel that I fit in well as part of the University of Saskatchewan environment. (S)
2. I have been feeling tense or nervous lately. (P)
3. I have been keeping up to date on my academic work. (A)
4. I am meeting as many people, and making as many friends, as I would like at the
University of Saskatchewan. (S)
5. I know why I’m in University and what I want out of it. (A)
6. I am finding academic work at the University of Saskatchewan difficult. (A)
7. Lately I have been feeling blue and moody a lot. (P)
8. I am very involved in social activities in university. (S)
9. I am adjusting well to university. (S)
10. I have not been functioning well during examinations. (A)
11. I have felt tired much of the time lately. (P)
12. Being on my own, taking more responsibility for myself, has not been easy. (P)
13. I am satisfied with the level at which I am performing academically. (A)
Adaptation and Adjustment 98
14. I have had informal personal contact with professors. (S)
15. I am pleased now about my decision to go to university.
16. I am pleased now about my decision to attend the University of Saskatchewan in
particular. (S)
17. I am not working as hard as I should at my coursework. (A)
18. I have several close social ties at the University of Saskatchewan. (S)
19. My academic goals and purposes are well-defined. (A)
20. I haven’t been able to control my emotions very well lately. (P)
21. I am not really smart enough for the academic work I am expected to be doing now. (A)
22. Lonesomeness for home is a source of difficulty for me right now. (S)
23. Getting a university degree is very important to me. (A)
24. My appetite has been good lately. (P)
25. I haven’t been very efficient in the use of study time lately. (A)
26. I enjoy living in a university residence (please omit if you do not live in a residence; any
university housing should be regarded as a residence). (S)
27. I enjoy writing papers for courses. (A)
28. I have been having a lot of headaches lately. (P)
29. I really haven’t had much motivation for studying lately. (A)
30. I am satisfied with the extracurricular activities available at the University of
Saskatchewan. (S)
31. I’ve given a lot of thought lately to whether I should ask for help from the --------- centre
or from a psychotherapist outside of the University. (P)
32. Lately, I have been having doubts regarding the value of a university education. (A)
Adaptation and Adjustment 99
33. I am getting along very well with my roommate(s). (please omit if you do not have a
roommate). (S)
34. I wish I were at another college or university rather than the University of Saskatchewan.
35. I’ve put on (or lost) too much weight recently. (P)
36. I am satisfied with the number and variety of courses available at the University of
Saskatchewan. (A)
37. I feel that I have enough social skill to get along well in the university setting. (S)
38. I have been getting angry too easily lately. (P)
39. Recently, I have had trouble concentrating when I try to study. (A)
40. I haven’t been sleeping very well. (P)
41. I’m not doing well enough academically for the amount of work I put in. (A)
42. I am having difficulty feeling at ease with other people at the University of Saskatchewan.
(S)
43. I am satisfied with the quality or caliber of courses at the University of Saskatchewan. (A)
44. I am attending classes regularly. (A)
45. Sometimes my thinking gets muddled up too easily. (P)
46. I am satisfied with the extent to which I am participating in social activities at the
University of Saskatchewan. (S)
47. I expect to stay at the University of Saskatchewan for a bachelor’s degree.
48. I haven’t been mixing too well lately with individual’s I might normally be attracted to.
(S)
49. I worry a lot about my university expenses. (P)
50. I am enjoying my academic work at the University of Saskatchewan. (A)
51. I have been feeling lonely a lot at the University of Saskatchewan. (S)
Adaptation and Adjustment 100
52. I am having a lot of trouble getting started on homework assignments. (A)
53. I feel I have good control over my life situation at the University of Saskatchewan.
54. I am satisfied with my program of courses for this semester. (A)
55. I have been feeling in good health lately. (P)
56. I feel I am very different from other students at the University of Saskatchewan in ways I
don’t like. (S)
57. On balance, I would rather be at home than here. (S)
58. Most of the things I am interested in are not related to any of my coursework at the
University of Saskatchewan. (A)
59. Lately, I have been giving a lot of thought to transferring to another university.
60. Lately, I have been giving a lot of thought to dropping out of university altogether and for
good.
61. I find myself giving considerable thought to taking time off from university and finishing
later.
62. I am satisfied with the professors I have now in my courses. (A)
63. I have some good friends or acquaintances at the University of Saskatchewan with whom
I can talk about any problems I may have. (S)
64. I am experiencing a lot of difficulty coping with the stresses imposed upon me in
university. (P)
65. I am quite satisfied with my social life at the University of Saskatchewan. (S)
66. I am quite satisfied with my academic situation at the University of Saskatchewan. (A)
67. I feel confident that I will be able to deal in a satisfactory manner with future challenges
here at the University of Saskatchewan.
Adaptation and Adjustment 101
Appendix I
For the opportunity to win a gift certificate
CONSENT FORM
You are invited to participate in a study entitled The Transition to University: Adaptation
and Adjustment. Please read this form carefully, and feel free to contact the researchers if you
have any questions.
Researcher(s): Melanie Smith (MA candidate) Department of Psychology, University of
Saskatchewan, 966-6665 and Dr. Patricia McDougall, Ph.D., Department of Psychology,
University of Saskatchewan, 966-8957.
Purpose and Procedure: The purpose of this study is to investigate whether certain
protective/risk factors such as daily hassles, self-esteem, and social support predict student’s
adjustment to university. Students who participate in the study will complete the questionnaire
online. This survey will take approximately 30 minutes of your time. We ask that you include
your NSID so that if you completed the first survey the information collected first semester can
be matched with your second survey. Upon completing your questionnaire, the goals of the study
will be fully explained in writing and you will be offered the opportunity to receive a summary of
the findings. You will have a chance to win a gift certificate from Future Shop or the Campus
Book Store. Winners of the draws will be contacted so that they can pick up their prize.
Potential Risks: There are no known risks associated with participation in this study. However,
some students may feel that they would like to talk to someone about some issues that are raised
by the questionnaire. On campus there are many centres where students can go to talk to someone
about any difficulties that they may be having. The Student Health Centre is in Room 145
Saskatchewan Hall (966-5768). The Student Help Center is located in Room 27 of Place Riel
(966-6981) and the Writing Center can be reached at 966-5486. You have the right to withdraw
from the study at any time; there are no penalties for doing so.
Potential Benefits: There are no direct personal benefits associated with participation in this
study other than a chance to win one of three gift certificates in October and then again in
January. Although personal benefits and/or benefits for the greater community are not
guaranteed, developing a better understanding of the transition to university may eventually help
students better survive their first year.
Storage of Data: The data that are collected in connection with this study will be stored with
Patti McDougall and Melanie Smith during the course of the study, and on CD’s kept by both
researchers for a period of five years.
Confidentiality: The findings from this study will be used in completion of a Masters Thesis
project. They may also be published in a scholarly journal and presented at a scholarly
conference. However, the data will be reported in aggregate form and it will not be possible to
identify individuals. Participant’s NSID numbers and contact information will be removed from
the data and replaced with an identification number (different from the NSID number) so that
Adaptation and Adjustment 102
individual data can not be identified by anyone other than the two primary researchers. The list of
NSID numbers, contact information, and identification numbers will be kept in a secure and
locked location. The master list of NSID numbers, contact information, and identification
numbers will be destroyed once the data from both parts of the study have been linked.
Right to Withdraw: You may withdraw from the study for any reason, at any time, without
penalty of any sort (and without loss of relevant entitlements, without affecting academic or
employment status, without losing access to relevant services etc). You also have the right to
leave individual questions blank. If you withdraw from the study at any time, you are free to
contact the researchers and request that the data you have contributed be destroyed. Your consent
to participate will be sought at the beginning of both the first and second questionnaires.
Questions: If you have any questions concerning the study, please feel free to contact the
researchers at the numbers provided above. This study has been approved on ethical grounds by
the University of Saskatchewan Behavioural Sciences Research Ethics Board on (insert date).
Any questions regarding your rights as a participant may be addressed to that committee through
the Office of Research Services (966-2084). Out of town participants may call collect. At the end
of the second questionnaire, there is a question that asks if you would like to receive a summary
of the results of this study. If you indicate that you would like to receive such a summary, one
will be emailed to you. In addition you may contact the investigators using the contact numbers
to request a study summary.
Consent to Participate: I agree to consent to this study, having read and understood the
background and procedure. I understand that I am free to withdraw from this study at any time
and this will in no way affect my academic status. By checking the “AGREE TO
PARTICIPATE” box below, you are consenting to participate in this study. If you choose not to
participate, please check “DO NOT AGREE TO PARTICIPATE” and exit the questionnaire
Agree to Participate
Do Not Agree to Participate
Adaptation and Adjustment 103
For bonus marks
CONSENT FORM
You are invited to participate in a study entitled The Transition to University: Adaptation
and Adjustment. Please read this form carefully, and feel free to contact the researchers if you
have any questions.
Researcher(s): Melanie Smith (MA candidate) Department of Psychology, University of
Saskatchewan, 966-6665 and Dr. Patricia McDougall, Ph.D., Department of Psychology,
University of Saskatchewan, 966-8957.
Purpose and Procedure: The purpose of this study is to investigate whether certain
protective/risk factors such as daily hassles, self-esteem, and social support predict student’s
adjustment to university. Students who participate in the study will complete the questionnaire
online. This survey will take approximately 30 minutes of your time. We ask that you include
your NSID so that if you completed the first survey the information collected first semester can
be matched with your second survey. Upon completing your questionnaire, the goals of the study
will be fully explained in writing and you will be offered the opportunity to receive a summary of
the findings. You will receive 1 bonus credit towards your Psychology 110.6 final mark.
Potential Risks: There are no known risks associated with participation in this study. However,
some students may feel that they would like to talk to someone about some issues that are raised
by the questionnaire. On campus there are many centres where students can go to talk to someone
about any difficulties that they may be having. The Student Health Centre is in Room 145
Saskatchewan Hall (966-5768). The Student Help Center is located in Room 27 of Place Riel
(966-6981) and the Writing Center can be reached at 966-5486. You have the right to withdraw
from the study at any time; there are no penalties for doing so.
Potential Benefits: There are no direct personal benefits associated with participation in this
study other than receiving 1 bonus credit towards your grade for Psychology 110.6 in October
and then a second bonus credit for participating again in January. Although personal benefits
and/or benefits for the greater community are not guaranteed, developing a better understanding
of the transition to university may eventually help students better survive their first year.
Storage of Data: The data that are collected in connection with this study will be stored with
Patti McDougall and Melanie Smith during the course of the study, and on CD’s kept by both
researchers for a period of five years.
Confidentiality: The findings from this study will be used in completion of a Masters Thesis
project. They may also be published in a scholarly journal and presented at a scholarly
conference. However, the data will be reported in aggregate form and it will not be possible to
identify individuals. Participant’s NSID numbers and contact information will be removed from
the data and replaced with an identification number (different from the NSID number) so that
individual data can not be identified by anyone other than the two primary researchers. The list of
NSID numbers, contact information, and identification numbers will be kept in a secure and
Adaptation and Adjustment 104
locked location. The master list of NSID numbers, contact information, and identification
numbers will be destroyed once the data from both parts of the study have been linked.
Right to Withdraw: You may withdraw from the study for any reason, at any time, without
penalty of any sort (and without loss of relevant entitlements, without affecting academic or
employment status, without losing access to relevant services etc). You also have the right to
leave individual questions blank. If you withdraw from the study at any time, you are free to
contact the researchers and request that the data you have contributed be destroyed. You will still
receive your course credit if you withdraw from the study.
Questions: If you have any questions concerning the study, please feel free to contact the
researchers at the numbers provided above. This study has been approved on ethical grounds by
the University of Saskatchewan Behavioural Sciences Research Ethics Board on (insert date).
Any questions regarding your rights as a participant may be addressed to that committee through
the Office of Research Services (966-2084). Out of town participants may call collect. At the end
of the second questionnaire, there is a question that asks if you would like to receive a summary
of the results of this study. If you indicate that you would like to receive such a summary, one
will be emailed to you. In addition you may contact the investigators using the contact numbers
to request a study summary.
Consent to Participate: I agree to consent to this study, having read and understood the
background and procedure. I understand that I am free to withdraw from this study at any time
and this will in no way affect my academic status. By checking the “AGREE TO
PARTICIPATE” box below, you are consenting to participate in this study. If you choose not to
participate, please check “DO NOT AGREE TO PARTICIPATE” and exit the questionnaire
Agree to Participate
Do Not Agree to Participate
Adaptation and Adjustment 105
Debriefing
Debriefing at Time 1 – October
During the first year of university some students do well and some students experience a
lot of difficulty. It is important that researchers and educators understand the experience of first
year students. We are surveying students during their first year in university in order to better
understand some of the factors that may be related to student adjustment at this time. We need to
know more about why some students do well in first year, whereas other students struggle and
sometimes drop out of university. Thank you for your participation in this study and thank you
for your time. We hope you will help us with this study again in January.
Debriefing at Time 2 – January
During the first year of university some students do well and some students experience a
lot of difficulty. It is important that researchers and educators understand the experience of first
year students. We are surveying students during their first year in university in order to better
understand some of the factors that may be related to student adjustment at this time. By asking
students about how they were doing in November and then again in March, we will be able to
look at changes over time and try to understand what might predict why people feel better
adjusted to university as compared to feeling as though they are not adapting well to university
life. For example, some researchers think that students who move away from home have a harder
time adjusting to being at university. In contrast, researchers argue that if you have the social
support you need (e.g., friends) you’ll do just fine. In general, people who are interested in this
area of research talk about risk (like moving away from home) and protective factors (like social
support) and how these factors connect to the stresses associated with moving into university.
Thank you for helping us to look at how what might make the transition smoother as compared to
more difficult. We appreciate the time you have taken to help with this study.
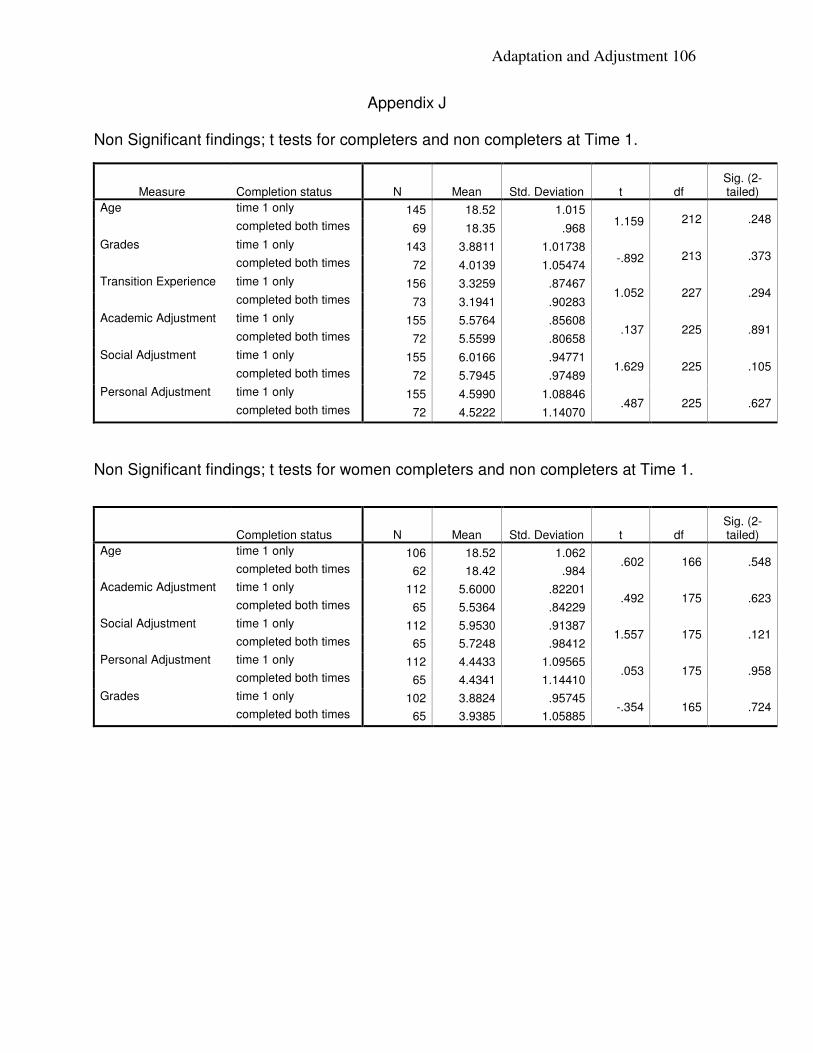
Adaptation and Adjustment 106
Appendix J
Non Significant findings; t tests for completers and non completers at Time 1.
Measure Completion status N Mean Std. Deviation t df Sig. (2-tailed)
Age
time 1 only 145 18.52 1.015 1.159 212 .248
completed both times 69 18.35 .968
Grades
time 1 only 143 3.8811 1.01738 -.892 213 .373
completed both times 72 4.0139 1.05474
Transition Experience
time 1 only 156 3.3259 .87467 1.052 227 .294
completed both times 73 3.1941 .90283
Academic Adjustment
time 1 only 155 5.5764 .85608 .137 225 .891
completed both times 72 5.5599 .80658
Social Adjustment
time 1 only 155 6.0166 .94771 1.629 225 .105
completed both times 72 5.7945 .97489
Personal Adjustment
time 1 only 155 4.5990 1.08846 .487 225 .627
completed both times 72 4.5222 1.14070
Non Significant findings; t tests for women completers and non completers at Time 1.
Completion status N Mean Std. Deviation t df Sig. (2-tailed)
Age
time 1 only 106 18.52 1.062 .602 166 .548
completed both times 62 18.42 .984
Academic Adjustment
time 1 only 112 5.6000 .82201 .492 175 .623
completed both times 65 5.5364 .84229
Social Adjustment
time 1 only 112 5.9530 .91387 1.557 175 .121
completed both times 65 5.7248 .98412
Personal Adjustment
time 1 only 112 4.4433 1.09565 .053 175 .958
completed both times 65 4.4341 1.14410
Grades
time 1 only 102 3.8824 .95745 -.354 165 .724
completed both times 65 3.9385 1.05885
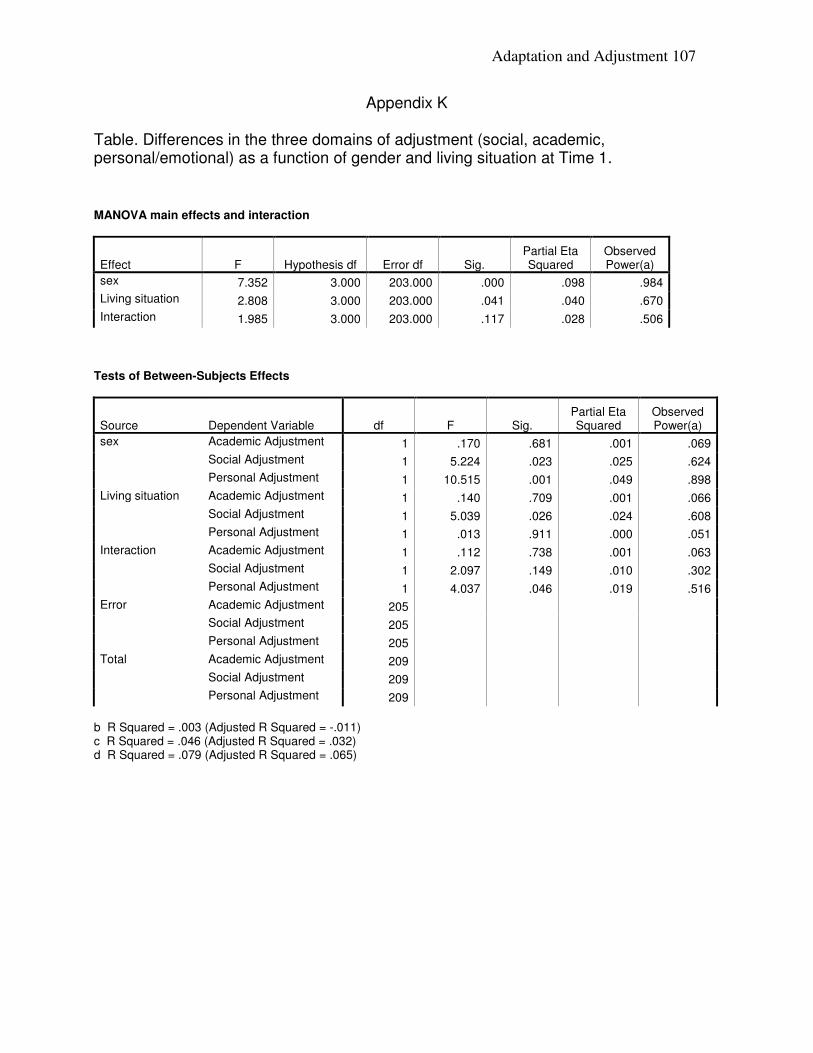
Adaptation and Adjustment 107
Appendix K Table. Differences in the three domains of adjustment (social, academic, personal/emotional) as a function of gender and living situation at Time 1. MANOVA main effects and interaction
Effect F Hypothesis df Error df Sig. Partial Eta Squared
Observed Power(a)
sex 7.352 3.000 203.000 .000 .098 .984
Living situation 2.808 3.000 203.000 .041 .040 .670
Interaction 1.985 3.000 203.000 .117 .028 .506
Tests of Between-Subjects Effects
Source Dependent Variable df F Sig. Partial Eta Squared
Observed Power(a)
sex
Academic Adjustment 1 .170 .681 .001 .069
Social Adjustment 1 5.224 .023 .025 .624
Personal Adjustment 1 10.515 .001 .049 .898
Living situation
Academic Adjustment 1 .140 .709 .001 .066
Social Adjustment 1 5.039 .026 .024 .608
Personal Adjustment 1 .013 .911 .000 .051
Interaction
Academic Adjustment 1 .112 .738 .001 .063
Social Adjustment 1 2.097 .149 .010 .302
Personal Adjustment 1 4.037 .046 .019 .516
Error Academic Adjustment 205
Social Adjustment 205
Personal Adjustment 205
Total Academic Adjustment 209
Social Adjustment 209
Personal Adjustment 209
b R Squared = .003 (Adjusted R Squared = -.011) c R Squared = .046 (Adjusted R Squared = .032) d R Squared = .079 (Adjusted R Squared = .065)
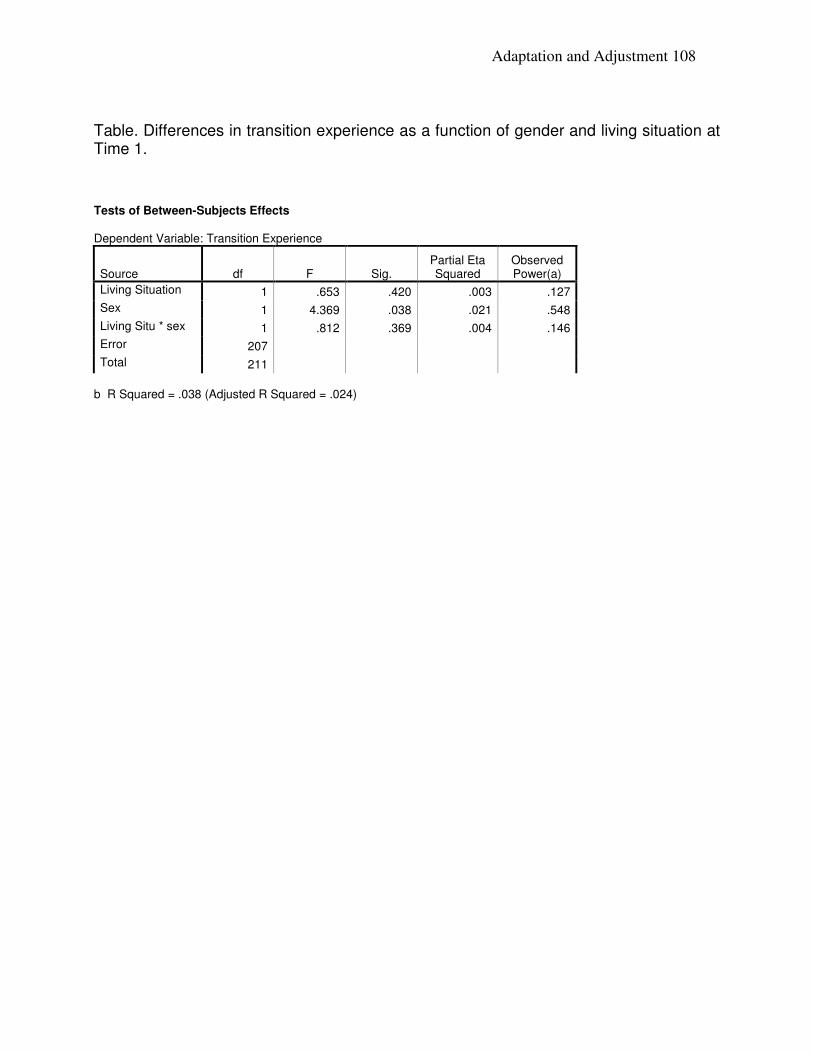
Adaptation and Adjustment 108
Table. Differences in transition experience as a function of gender and living situation at Time 1. Tests of Between-Subjects Effects Dependent Variable: Transition Experience
Source df F Sig. Partial Eta Squared
Observed Power(a)
Living Situation 1 .653 .420 .003 .127
Sex 1 4.369 .038 .021 .548
Living Situ * sex 1 .812 .369 .004 .146
Error 207
Total 211
b R Squared = .038 (Adjusted R Squared = .024)
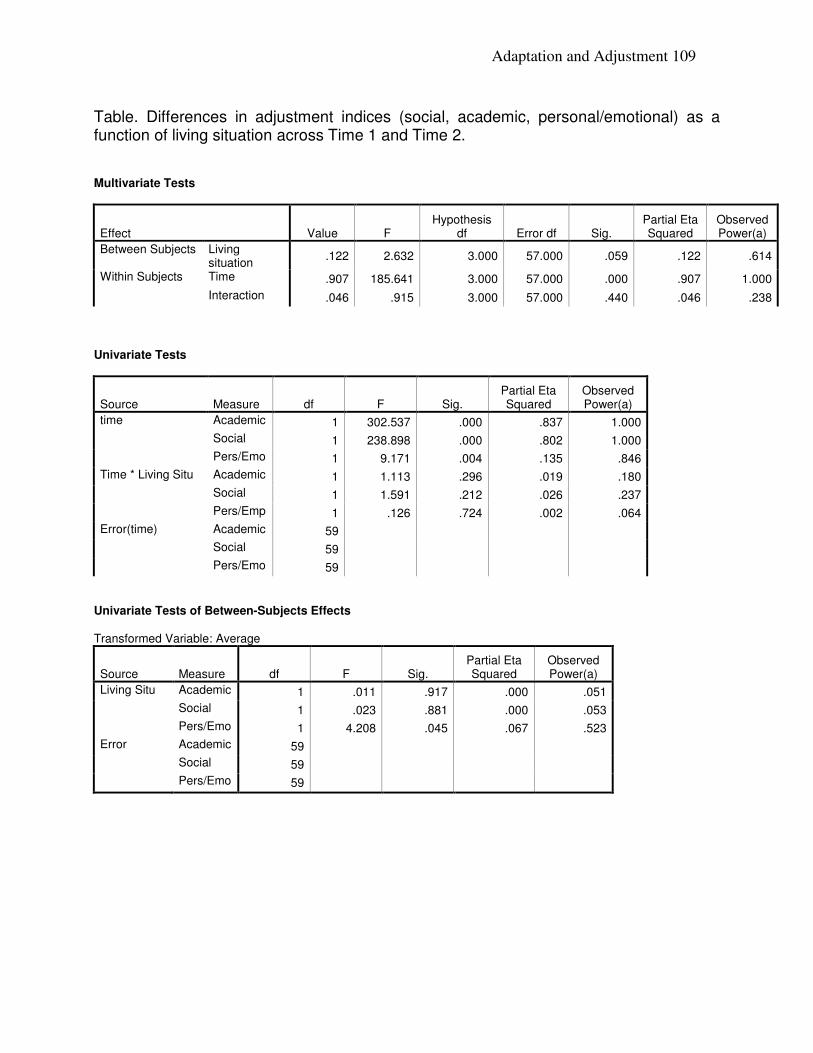
Adaptation and Adjustment 109
Table. Differences in adjustment indices (social, academic, personal/emotional) as a function of living situation across Time 1 and Time 2. Multivariate Tests
Effect Value F Hypothesis
df Error df Sig. Partial Eta Squared
Observed Power(a)
Between Subjects Living situation
.122 2.632 3.000 57.000 .059 .122 .614
Within Subjects Time .907 185.641 3.000 57.000 .000 .907 1.000
Interaction .046 .915 3.000 57.000 .440 .046 .238
Univariate Tests
Source Measure df F Sig. Partial Eta Squared
Observed Power(a)
time Academic 1 302.537 .000 .837 1.000
Social 1 238.898 .000 .802 1.000
Pers/Emo 1 9.171 .004 .135 .846
Time * Living Situ Academic 1 1.113 .296 .019 .180
Social 1 1.591 .212 .026 .237
Pers/Emp 1 .126 .724 .002 .064
Error(time) Academic 59
Social 59
Pers/Emo 59
Univariate Tests of Between-Subjects Effects Transformed Variable: Average
Source Measure df F Sig. Partial Eta Squared
Observed Power(a)
Living Situ Academic 1 .011 .917 .000 .051
Social 1 .023 .881 .000 .053
Pers/Emo 1 4.208 .045 .067 .523
Error Academic 59
Social 59
Pers/Emo 59
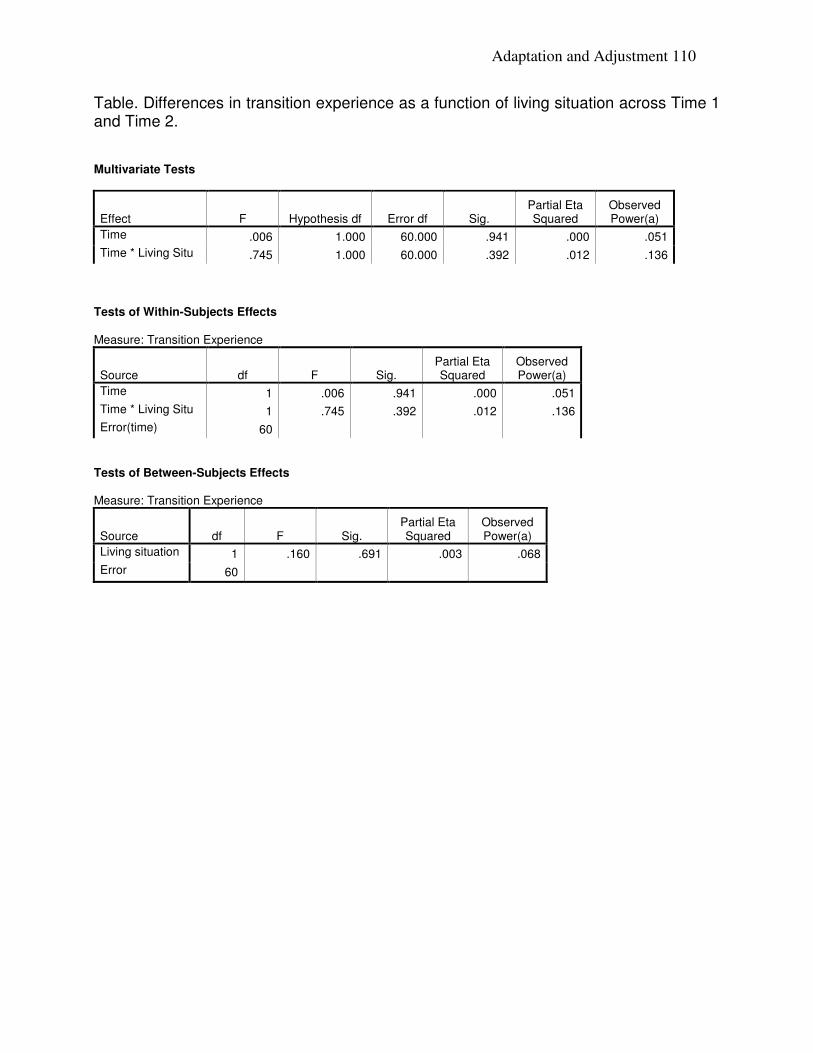
Adaptation and Adjustment 110
Table. Differences in transition experience as a function of living situation across Time 1 and Time 2. Multivariate Tests
Effect F Hypothesis df Error df Sig. Partial Eta Squared
Observed Power(a)
Time .006 1.000 60.000 .941 .000 .051
Time * Living Situ .745 1.000 60.000 .392 .012 .136
Tests of Within-Subjects Effects Measure: Transition Experience
Source df F Sig. Partial Eta Squared
Observed Power(a)
Time 1 .006 .941 .000 .051
Time * Living Situ 1 .745 .392 .012 .136
Error(time) 60
Tests of Between-Subjects Effects Measure: Transition Experience
Source df F Sig. Partial Eta Squared
Observed Power(a)
Living situation 1 .160 .691 .003 .068
Error 60
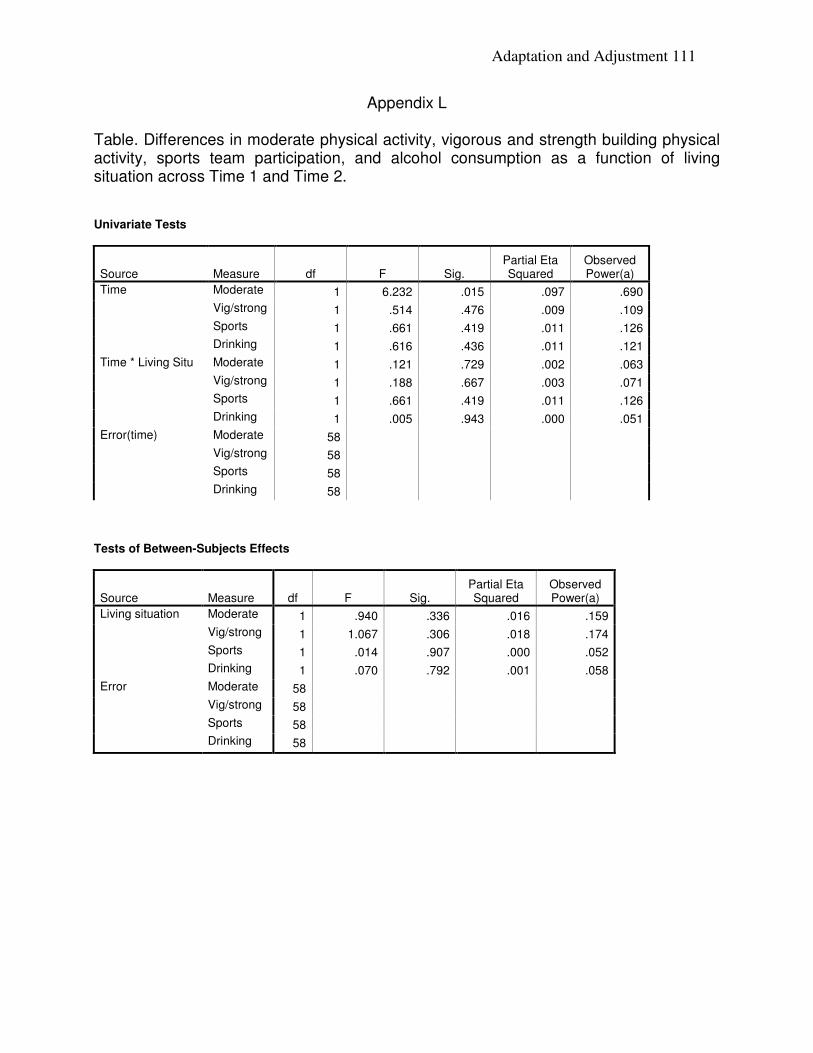
Adaptation and Adjustment 111
Appendix L
Table. Differences in moderate physical activity, vigorous and strength building physical activity, sports team participation, and alcohol consumption as a function of living situation across Time 1 and Time 2. Univariate Tests
Source Measure df F Sig. Partial Eta Squared
Observed Power(a)
Time Moderate 1 6.232 .015 .097 .690
Vig/strong 1 .514 .476 .009 .109
Sports 1 .661 .419 .011 .126
Drinking 1 .616 .436 .011 .121
Time * Living Situ Moderate 1 .121 .729 .002 .063
Vig/strong 1 .188 .667 .003 .071
Sports 1 .661 .419 .011 .126
Drinking 1 .005 .943 .000 .051
Error(time) Moderate 58
Vig/strong 58
Sports 58
Drinking 58
Tests of Between-Subjects Effects
Source Measure df F Sig. Partial Eta Squared
Observed Power(a)
Living situation Moderate 1 .940 .336 .016 .159
Vig/strong 1 1.067 .306 .018 .174
Sports 1 .014 .907 .000 .052
Drinking 1 .070 .792 .001 .058
Error Moderate 58
Vig/strong 58
Sports 58
Drinking 58
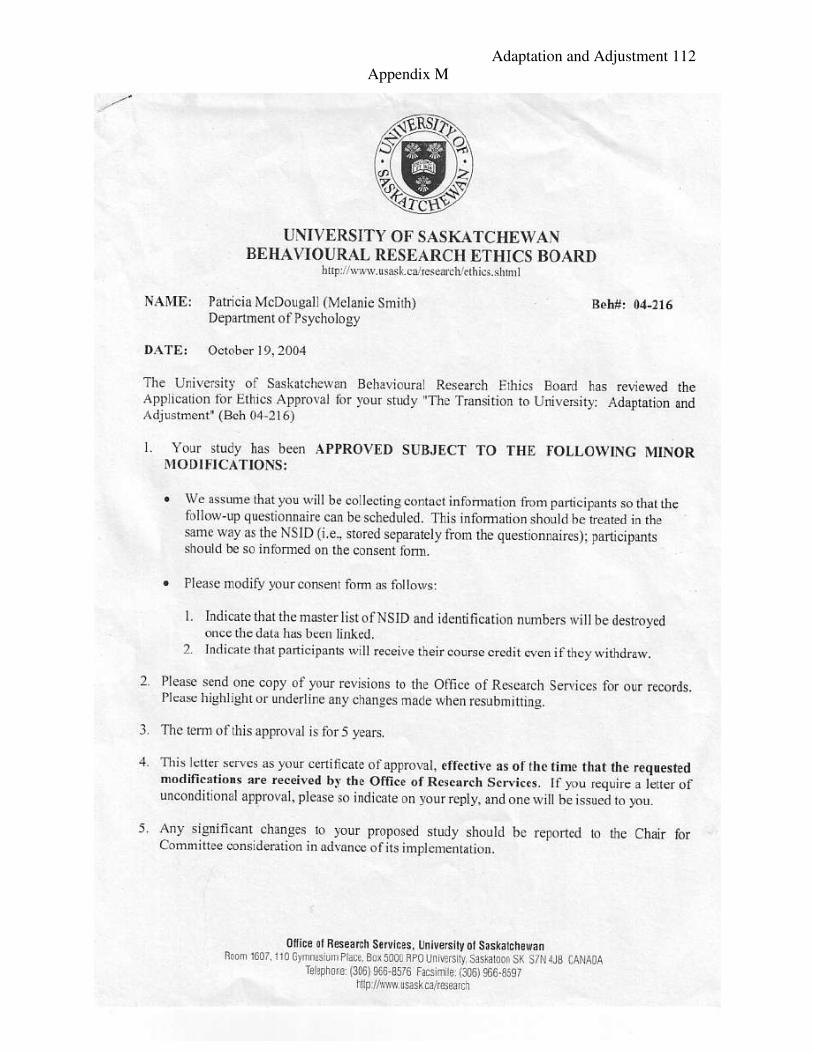
Adaptation and Adjustment 112
Appendix M
Adaptation and Adjustment 113