Embed Size (px)
Citation preview
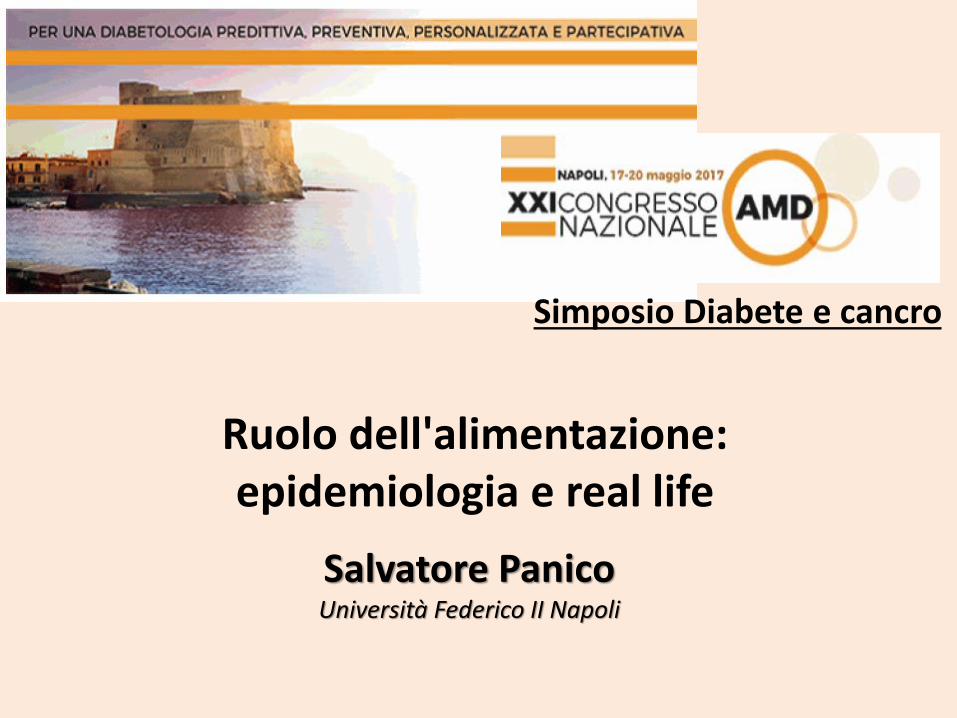
Ruolo dell'alimentazione: epidemiologia e real life
Salvatore PanicoUniversità Federico II Napoli
Simposio Diabete e cancro
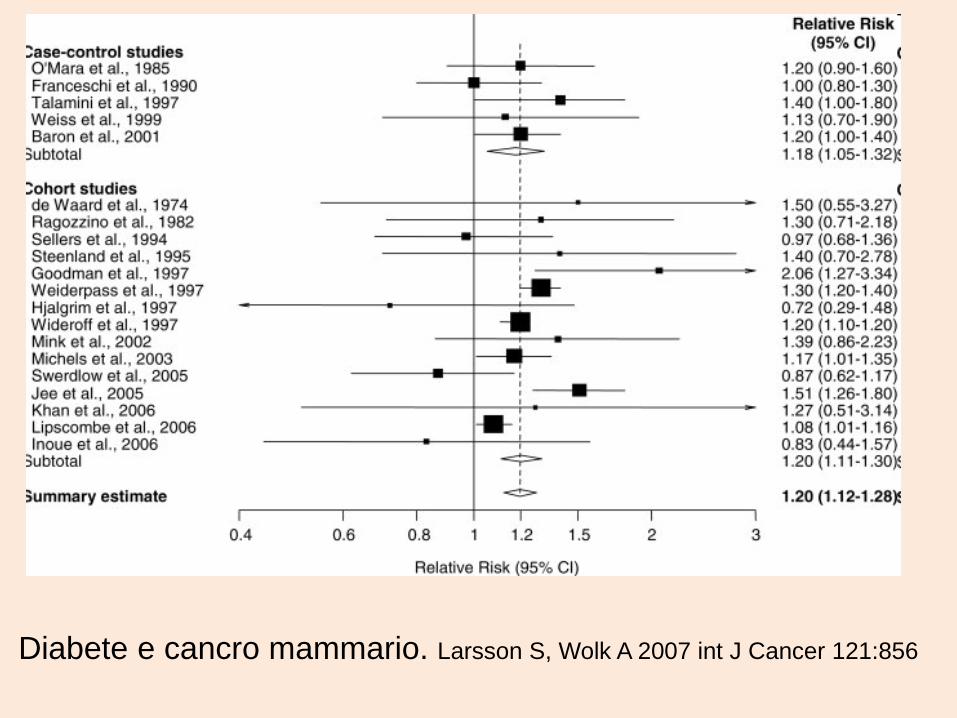
Diabete e cancro mammario. Larsson S, Wolk A 2007 int J Cancer 121:856
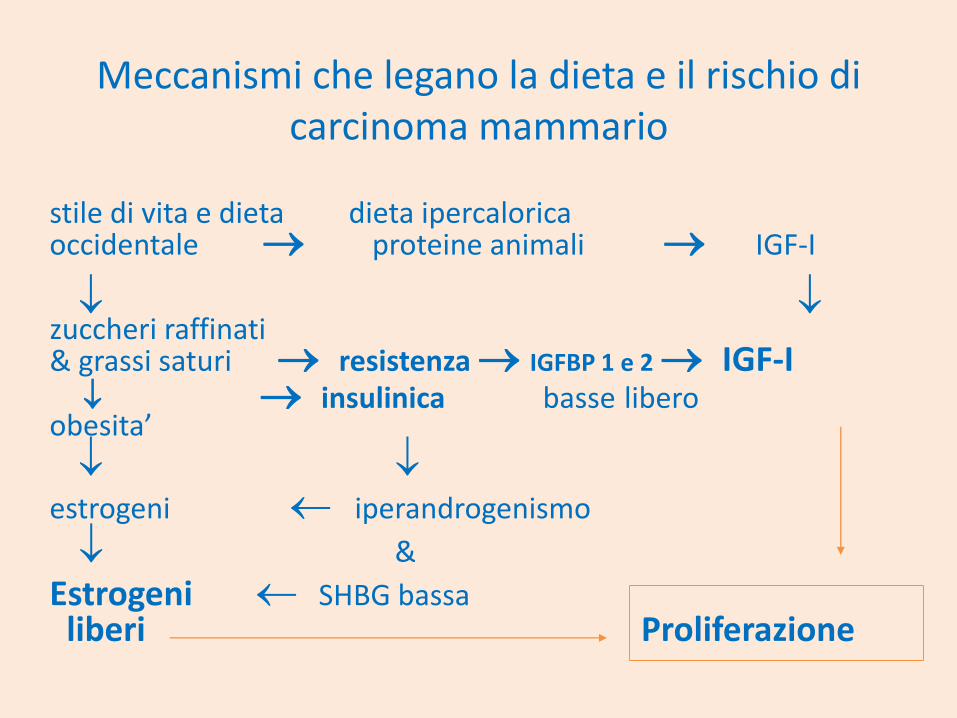
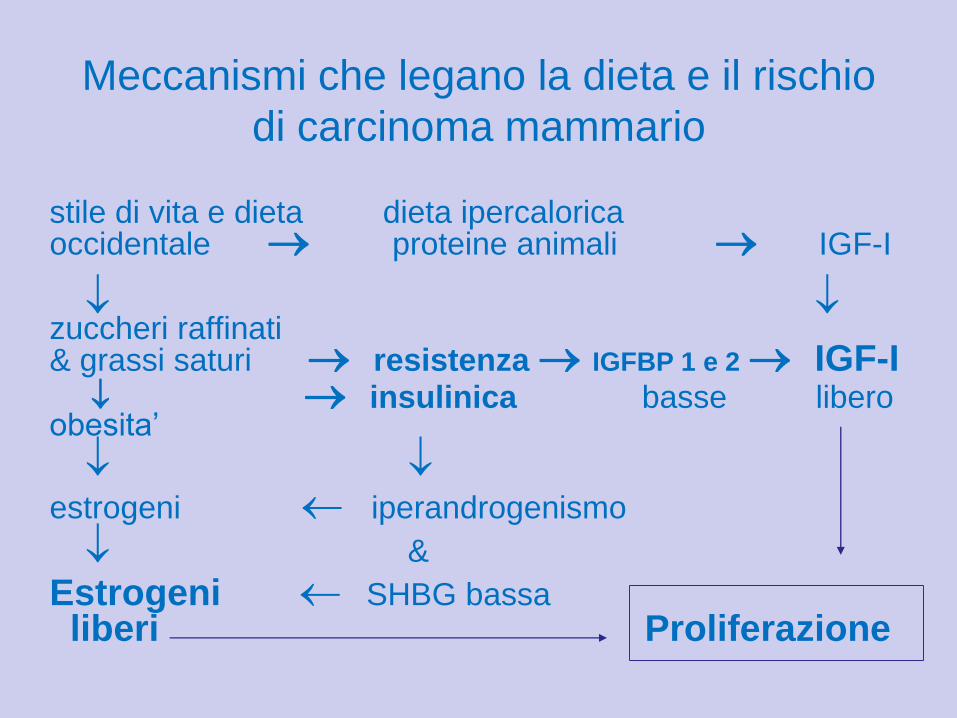
Meccanismi che legano la dieta e il rischio di carcinoma mammario
stile di vita e dieta dieta ipercaloricaoccidentale proteine animali IGF-I
zuccheri raffinati & grassi saturi resistenza IGFBP 1 e 2 IGF-I insulinica basse libero
obesita’
estrogeni iperandrogenismo
&
Estrogeni SHBG bassaliberi Proliferazione
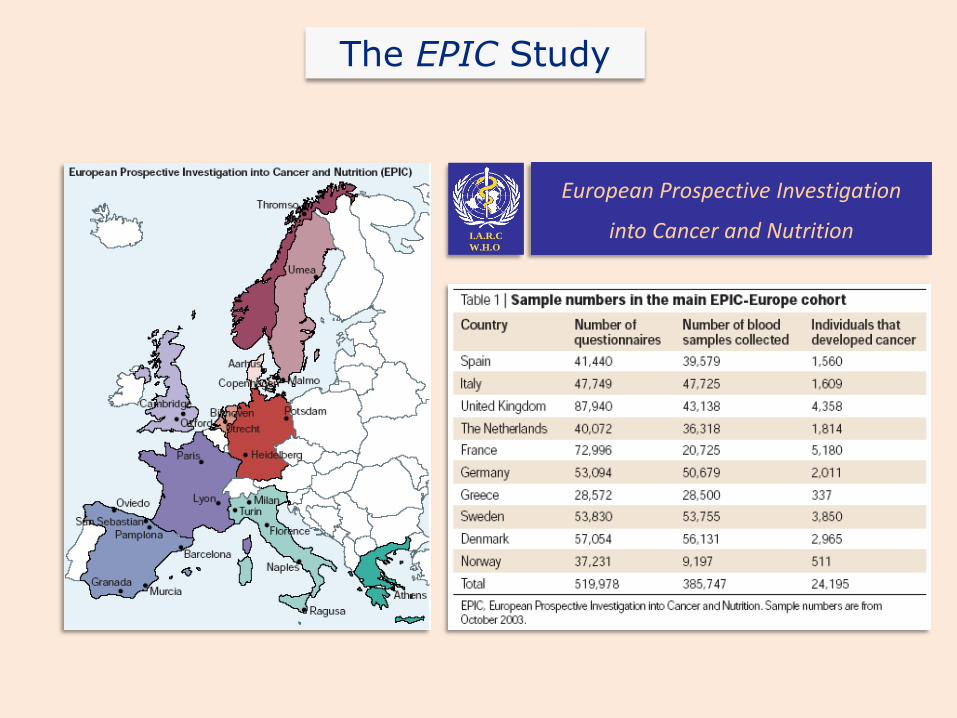
The EPIC Study
I.A.R.C
W.H.O
European Prospective Investigation
into Cancer and Nutrition

Banca biologica
• 30 ml sangue venoso:
– 20 ml citrato +10 ml secco
• 28 aliquote da 500 l :
– plasma 12 (red straws)– siero 8 (yellow straws)– leucociti 4 (blue straws)– globuli rossi 4 (green straws)
28 aliquote x 300.000 soggetti = 8.4 milioni di aliquote,
Metà in ciascun centro EPIC, metà alla IARC di Lione
Più: 12 x 110,000= 1.3 milioni in Svezia e Danimarca

Average effect of environment and/or life style
Combined effect of Genetic Susceptibility AND Life-Style(Adapted from G.Rose, 1985)
Population mean A Population mean B
G. Rose’s approaches:
“sick individuals and sick populations”
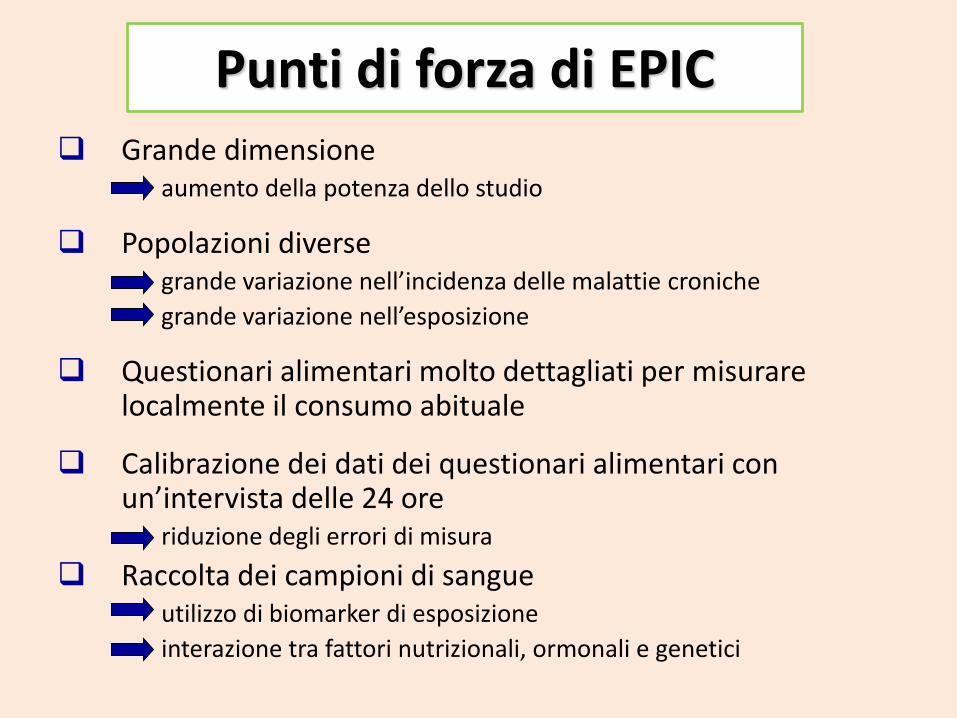
Punti di forza di EPIC Grande dimensione
aumento della potenza dello studio
Popolazioni diverse grande variazione nell’incidenza delle malattie croniche
grande variazione nell’esposizione
Questionari alimentari molto dettagliati per misurare localmente il consumo abituale
Calibrazione dei dati dei questionari alimentari con un’intervista delle 24 ore
riduzione degli errori di misura
Raccolta dei campioni di sangue utilizzo di biomarker di esposizione
interazione tra fattori nutrizionali, ormonali e genetici

Acrylamide
Bladder cancer
Brain cancer
Brain cancer
Breast cancer
Cervical cancer
Colorectal cancer
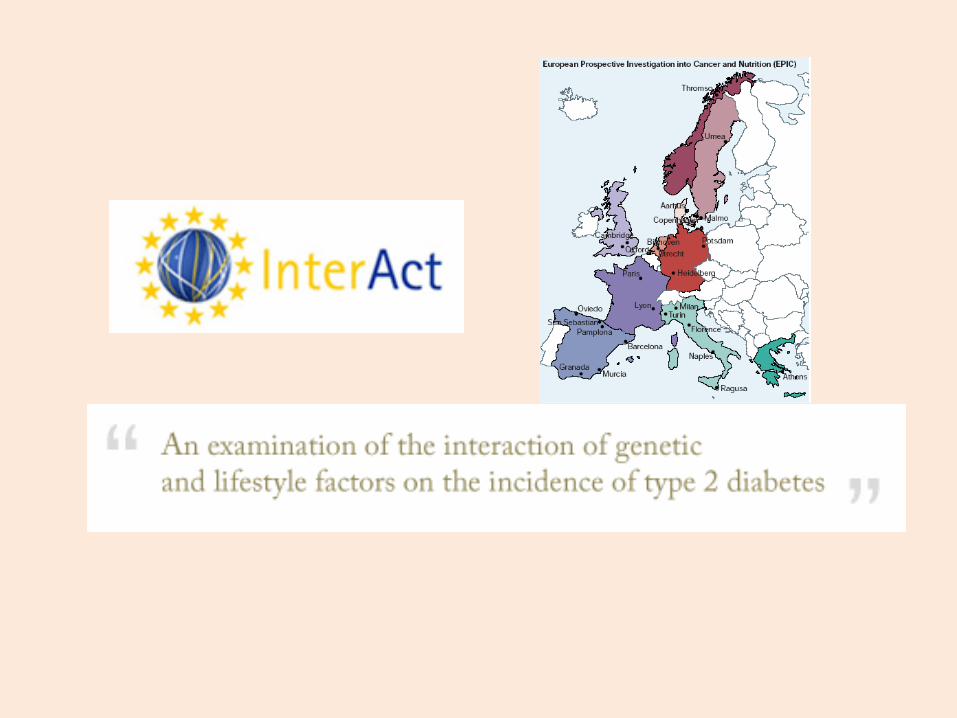
INTERACT (diabetes)
EPIC-ELDERLY
EPIC-HEART
EPIC-rheumatoid arthritis
NEURO EPIC
EUR-GAST
GENETICS
Kidney cancer
Liver cancer
Lung
Malignant Lymphoma
Molecular Biomarkers
Nutrition (SNIPE)
Nutritional Biomarkers
Obesity
Osteoporosis
LIFEPATH
Prostate cancer
Rare cancers
Red/Processed Meat
Pancreatic cancer (Panscan)
Skin Cancer
Statistics
Survivorship Working Group
Thyroid
Total Mortality
GEN-AIR
PANACEA (Weight change)
EPIC ESCAPE

HRs for incident type 2 diabetes in men compared with
women across InterAct centres and countries
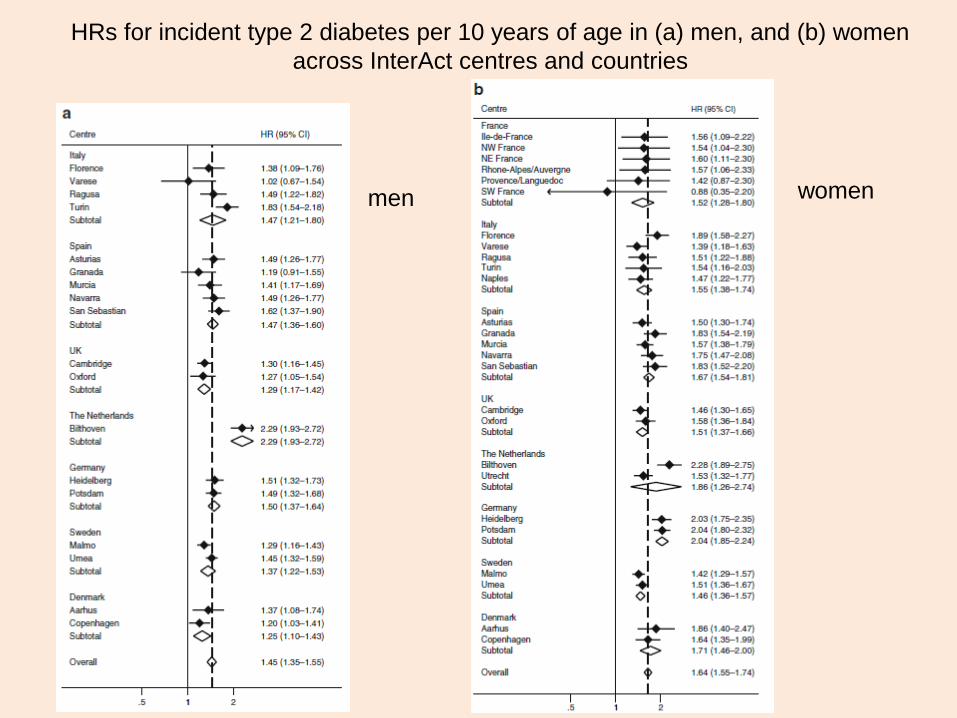
HRs for incident type 2 diabetes per 10 years of age in (a) men, and (b) women
across InterAct centres and countries
men women
Il Global Burden of Disease è stato stimato attraverso il Disability-adjusted life years (DALYs) che misura la gravità globale di una malattia, espressa come il numero di anni persi a causa della malattia, per disabilità o per morte prematura.
The Lancet, October 7°, 2016Global Burden of Diseases
GBD Men
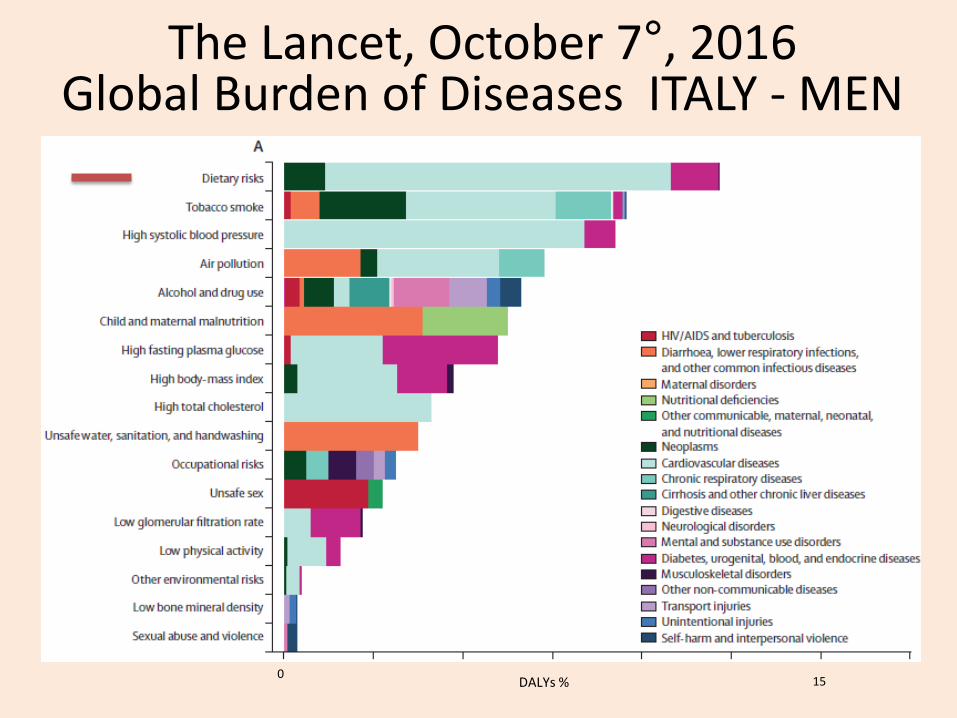
The Lancet, October 7°, 2016Global Burden of Diseases ITALY - MEN
DALYs %0
15
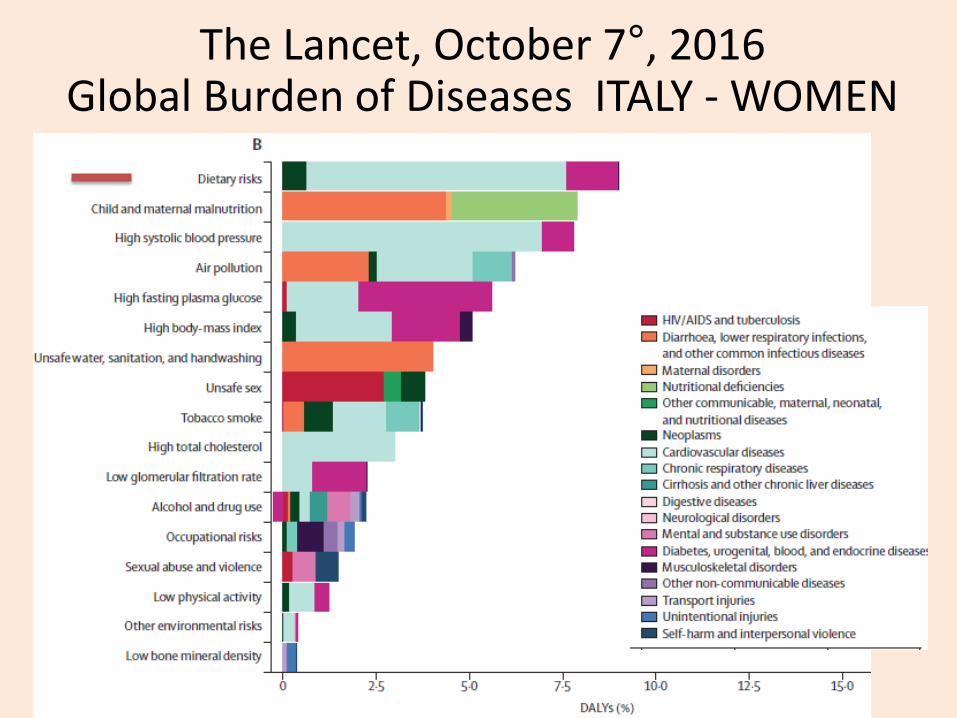
The Lancet, October 7°, 2016Global Burden of Diseases ITALY - WOMEN
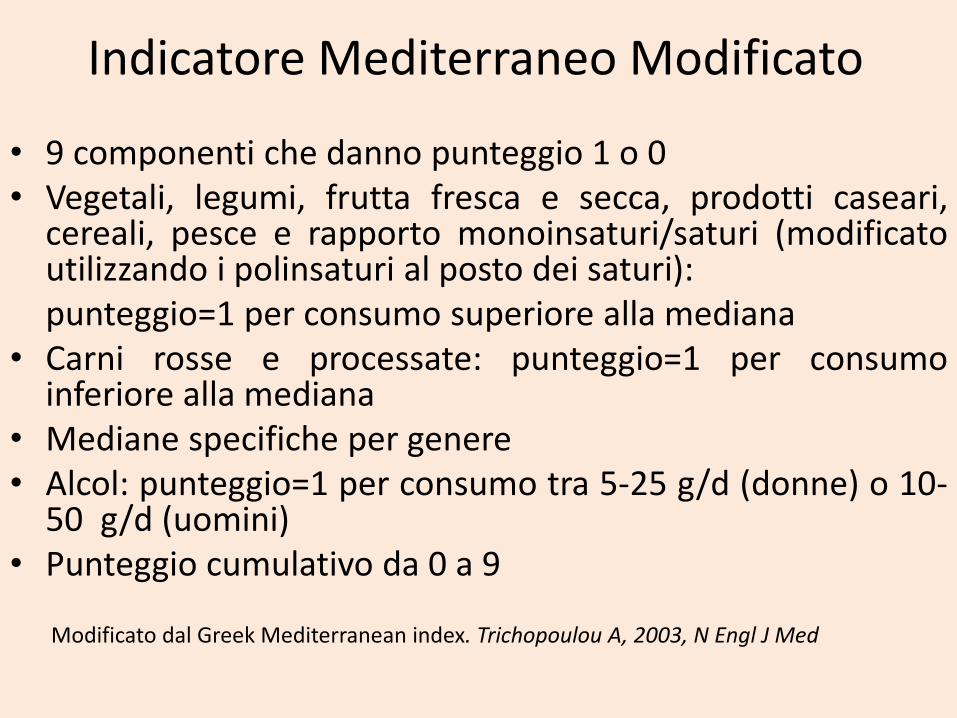
Indicatore Mediterraneo Modificato
• 9 componenti che danno punteggio 1 o 0• Vegetali, legumi, frutta fresca e secca, prodotti caseari,
cereali, pesce e rapporto monoinsaturi/saturi (modificatoutilizzando i polinsaturi al posto dei saturi):punteggio=1 per consumo superiore alla mediana
• Carni rosse e processate: punteggio=1 per consumoinferiore alla mediana
• Mediane specifiche per genere• Alcol: punteggio=1 per consumo tra 5-25 g/d (donne) o 10-
50 g/d (uomini)• Punteggio cumulativo da 0 a 9
Modificato dal Greek Mediterranean index. Trichopoulou A, 2003, N Engl J Med
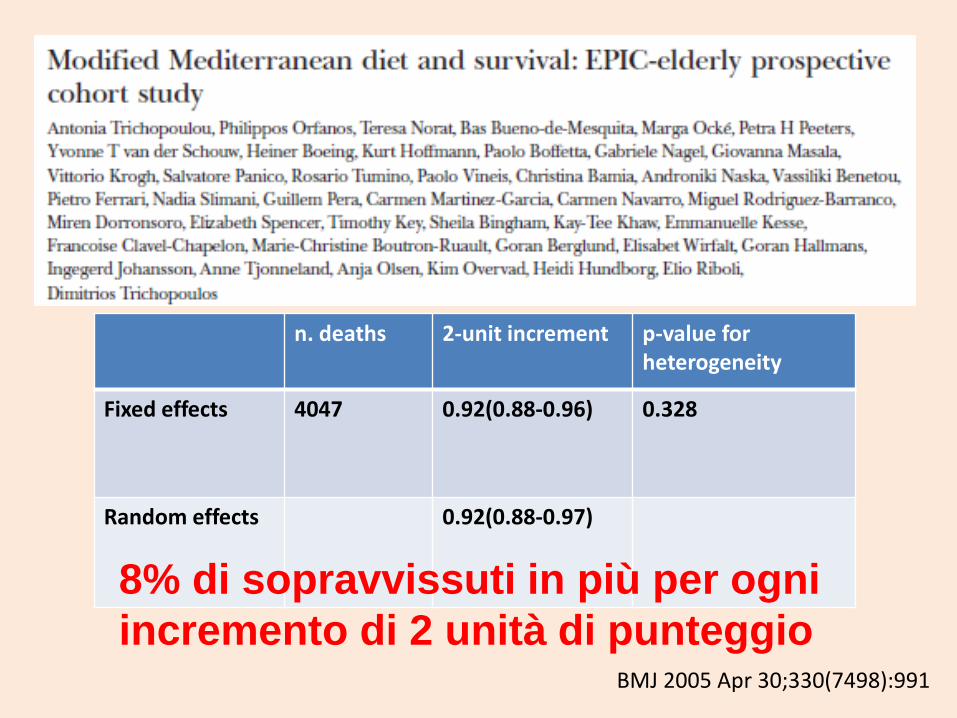
n. deaths 2-unit increment p-value forheterogeneity
Fixed effects 4047 0.92(0.88-0.96) 0.328
Random effects 0.92(0.88-0.97)
BMJ 2005 Apr 30;330(7498):991
8% di sopravvissuti in più per ogni
incremento di 2 unità di punteggio

Br J Cancer (2011) 104, 1493 – 1499
8% di tumori in meno per punteggi
medio alti

Mediterranean Diet and Type2Diabetes Risk in the European
Prospective Investigation Into Cancer and Nutrition (EPIC)
Study - INTERACT
Diabetes Care 34:1913–1918, 2011

0,4
0,6
0,8
1,0
1,2
1,4
1,6
1,8
2,0
Average daily consumption in grams
processed meat
red meat
fish
<10 10-20 20-40 40-80 >80
g/day
Statistical model adjusted for : energy, height, weight, physical activity,fiber, alcohol and tobacco
Norat T. et al. (JNCI, 2005)
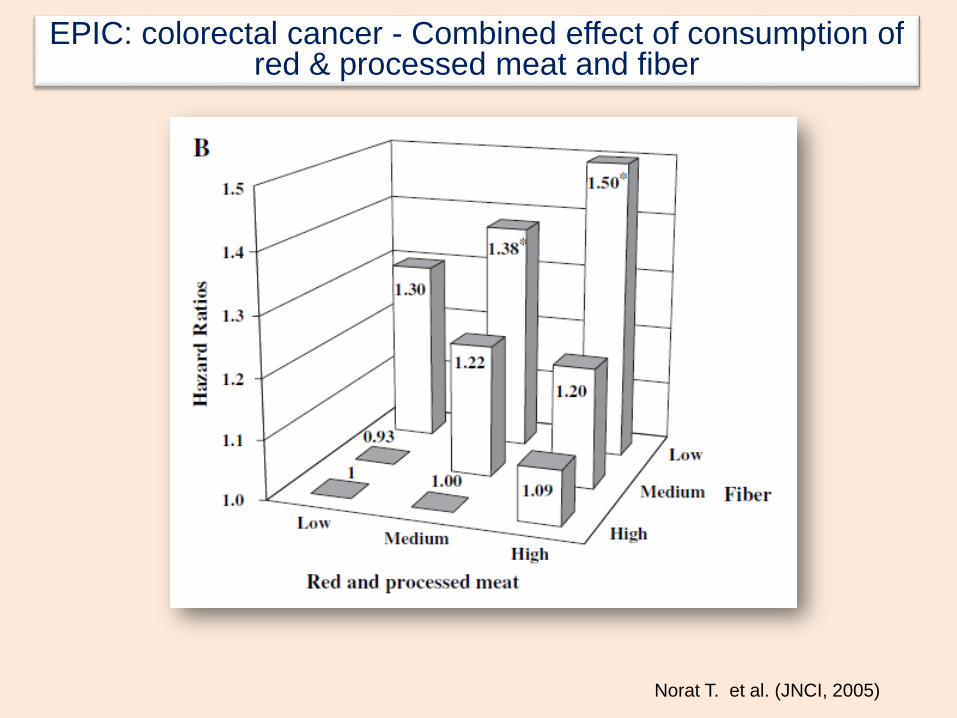
EPIC: colorectal cancer - Combined effect of consumption of red & processed meat and fiber
Norat T. et al. (JNCI, 2005)
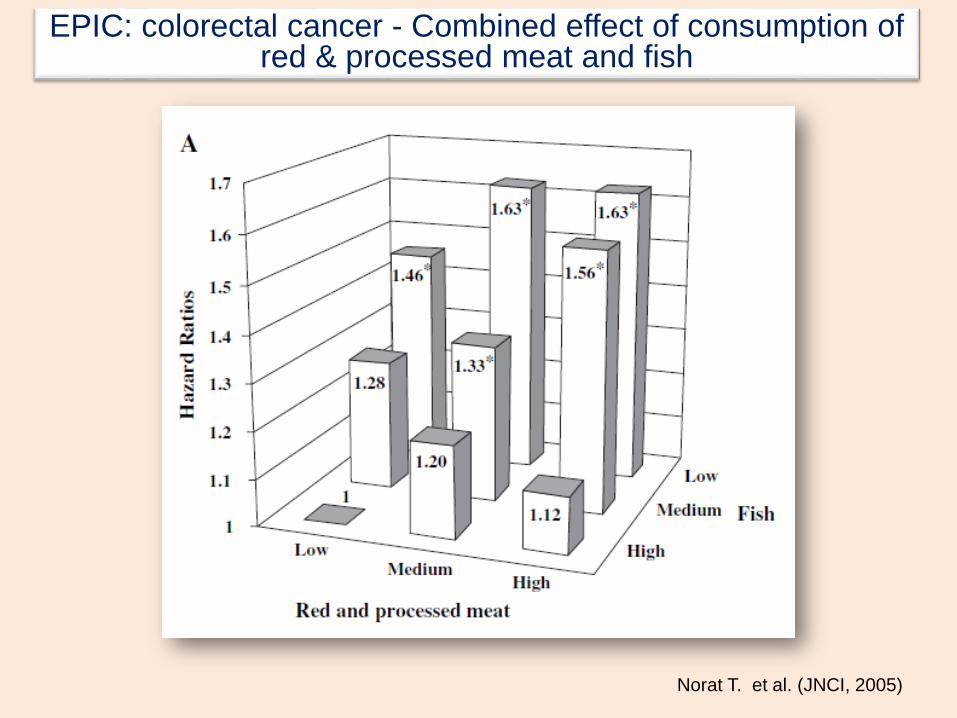
EPIC: colorectal cancer - Combined effect of consumption of red & processed meat and fish
Norat T. et al. (JNCI, 2005)
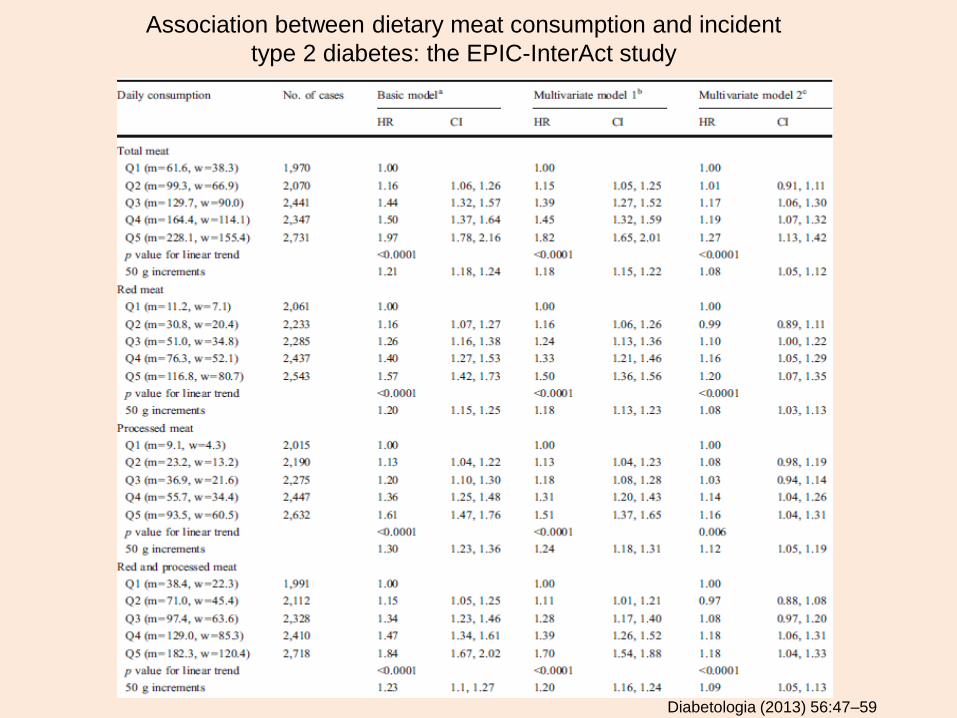
Association between dietary meat consumption and incident
type 2 diabetes: the EPIC-InterAct study
Diabetologia (2013) 56:47–59
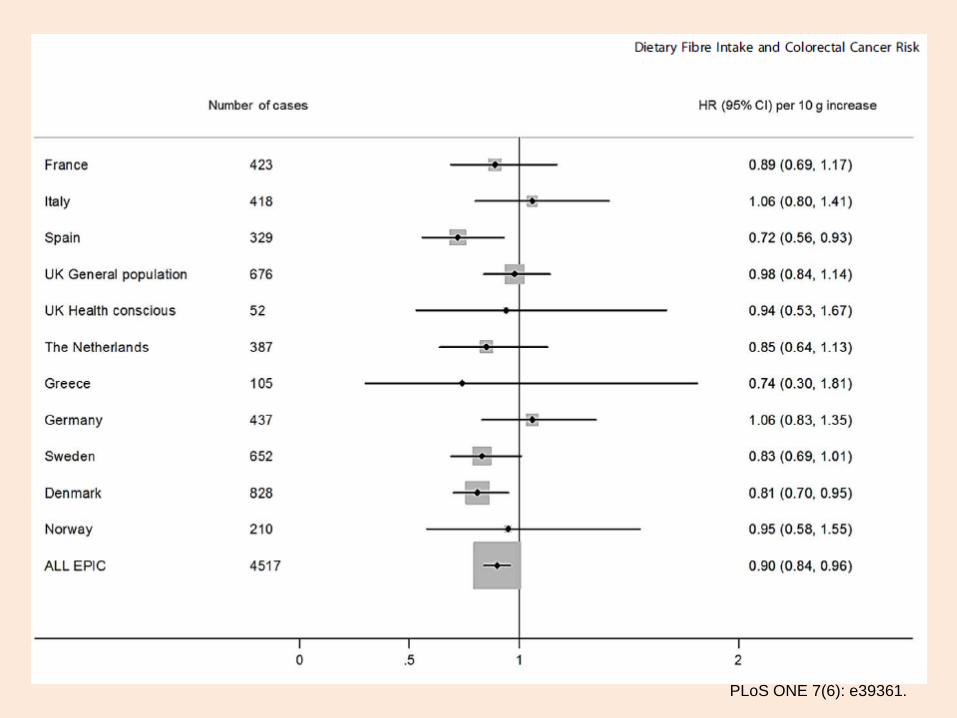
PLoS ONE 7(6): e39361.
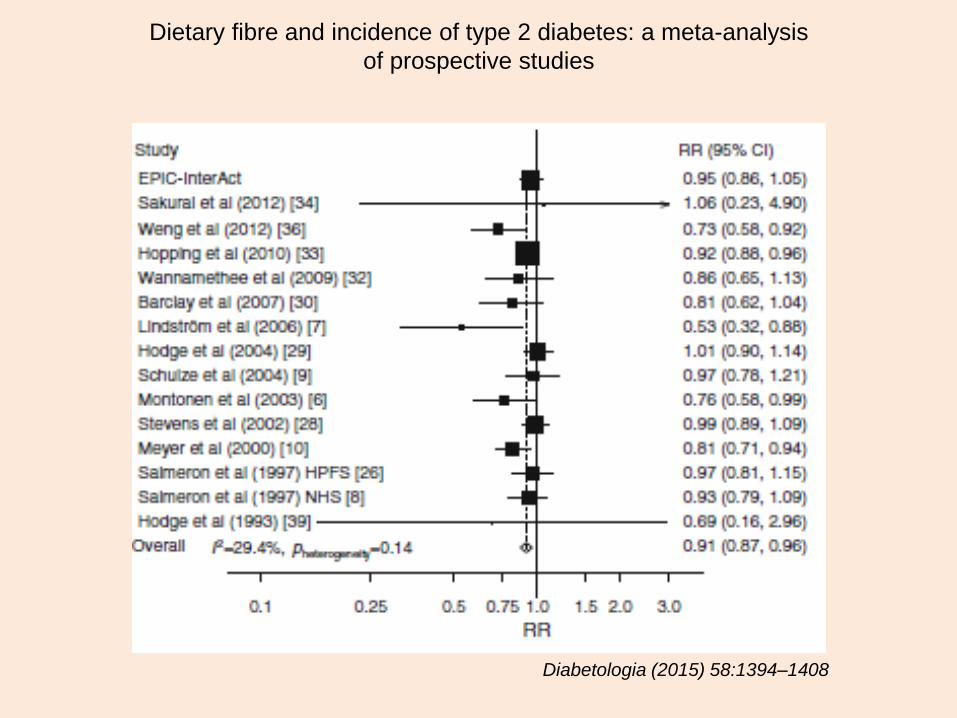
Dietary fibre and incidence of type 2 diabetes: a meta-analysis
of prospective studies
Diabetologia (2015) 58:1394–1408
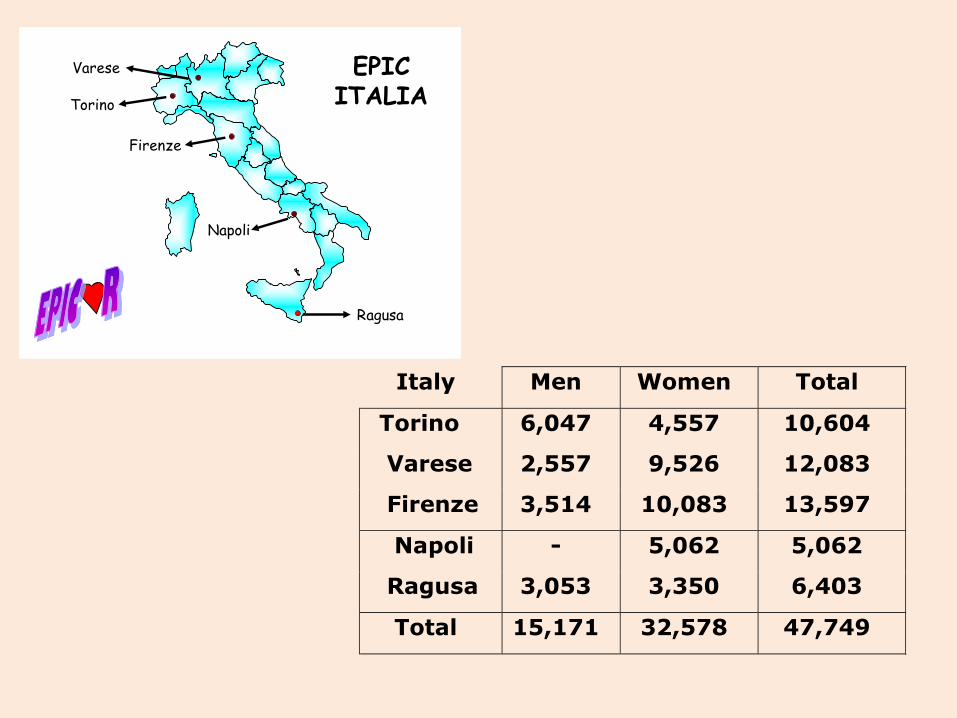
Italy Men Women Total
Torino 6,047 4,557 10,604
Varese 2,557 9,526 12,083
Firenze 3,514 10,083 13,597
Napoli - 5,062 5,062
Ragusa 3,053 3,350 6,403
Total 15,171 32,578 47,749
Ragusa
Napoli
Firenze
Torino
Varese EPIC ITALIA
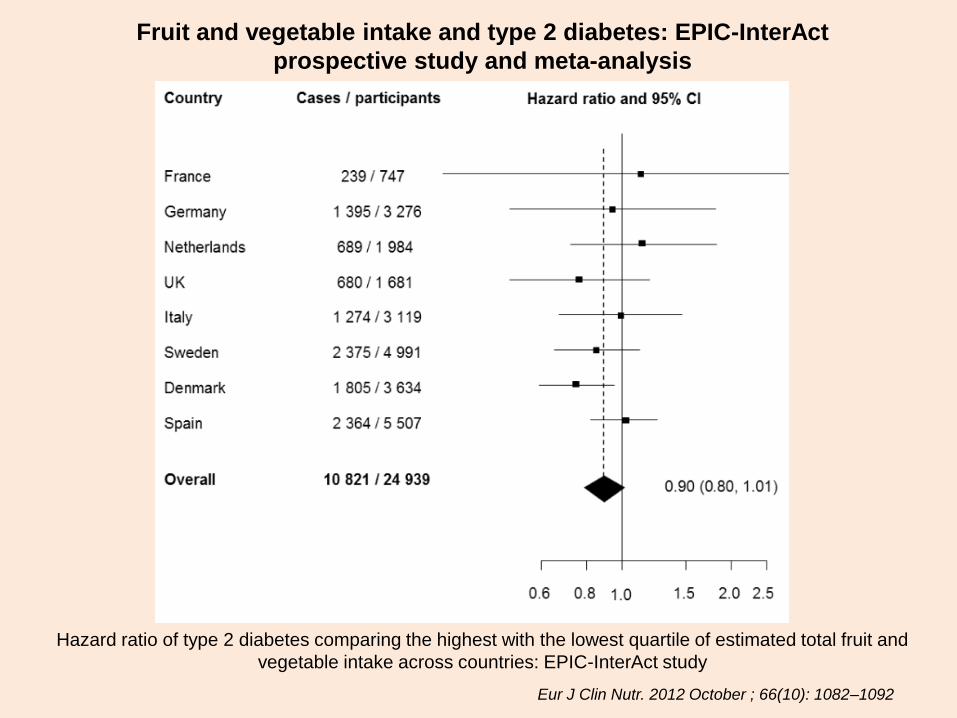
Fruit and vegetable intake and type 2 diabetes: EPIC-InterAct
prospective study and meta-analysis
Hazard ratio of type 2 diabetes comparing the highest with the lowest quartile of estimated total fruit and
vegetable intake across countries: EPIC-InterAct study
Eur J Clin Nutr. 2012 October ; 66(10): 1082–1092
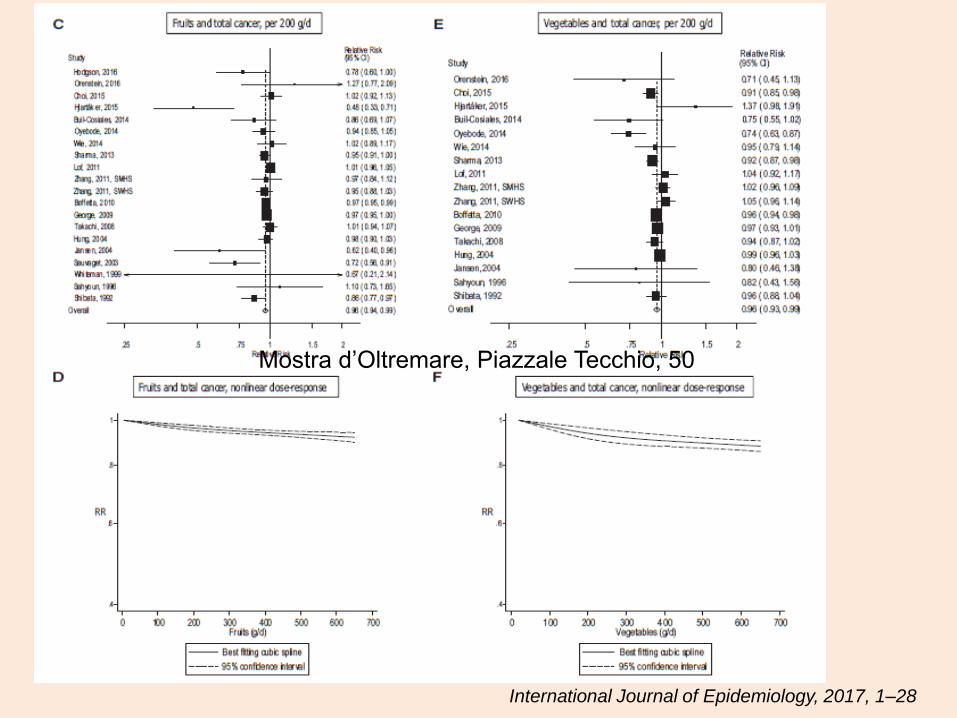
International Journal of Epidemiology, 2017, 1–28
Mostra d’Oltremare, Piazzale Tecchio, 50
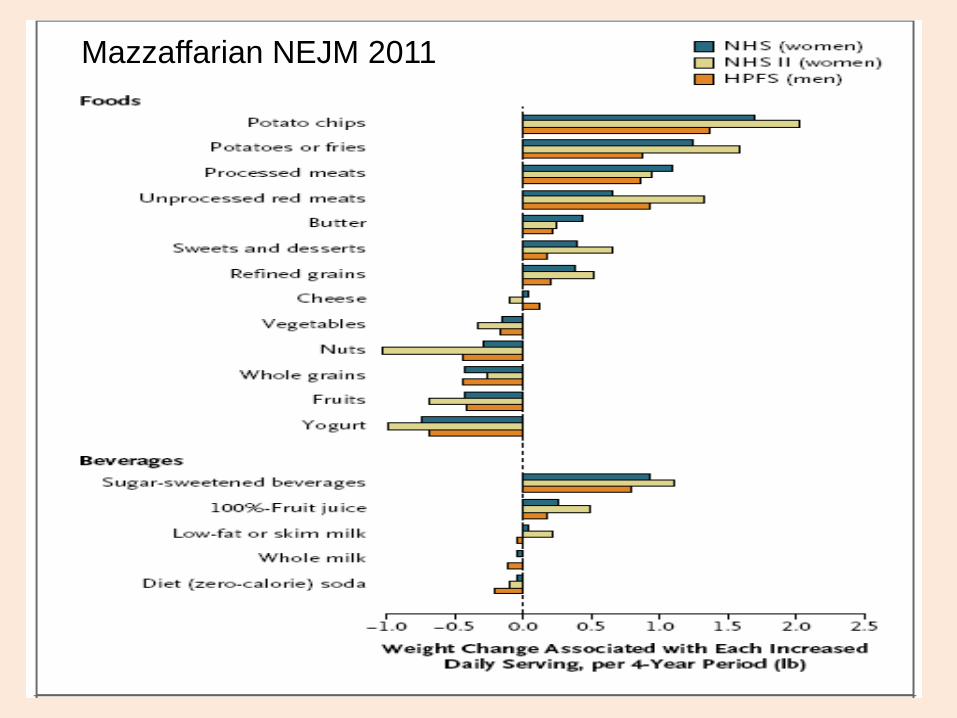
Mazzaffarian NEJM 2011

Consumption of sweet beverages and type 2 diabetes incidence in European
adults: results from EPIC-InterAct
Diabetologia (2013) 56:1520–1530

Mediterranean dietary patterns and prospective weight change in
participants of the EPIC-PANACEA project
Am J Clin Nutr 2010;92:912–21.

EPIC: rischio di diventare sovrappeso (per i normopeso) od obesi (per i sovrappeso) in funzione del consumo proteico (Vergnaud
2012)
0
0,2
0,4
0,6
0,8
1
1,2
1,4
1,6
<14% 14-16 16-18 18-20 20-22 >22%
normopeso
sovrappeso
al reclutamento
Introito di proteine in percentuale delle calorie totali
P < 0.05 Ptrend <0.0001
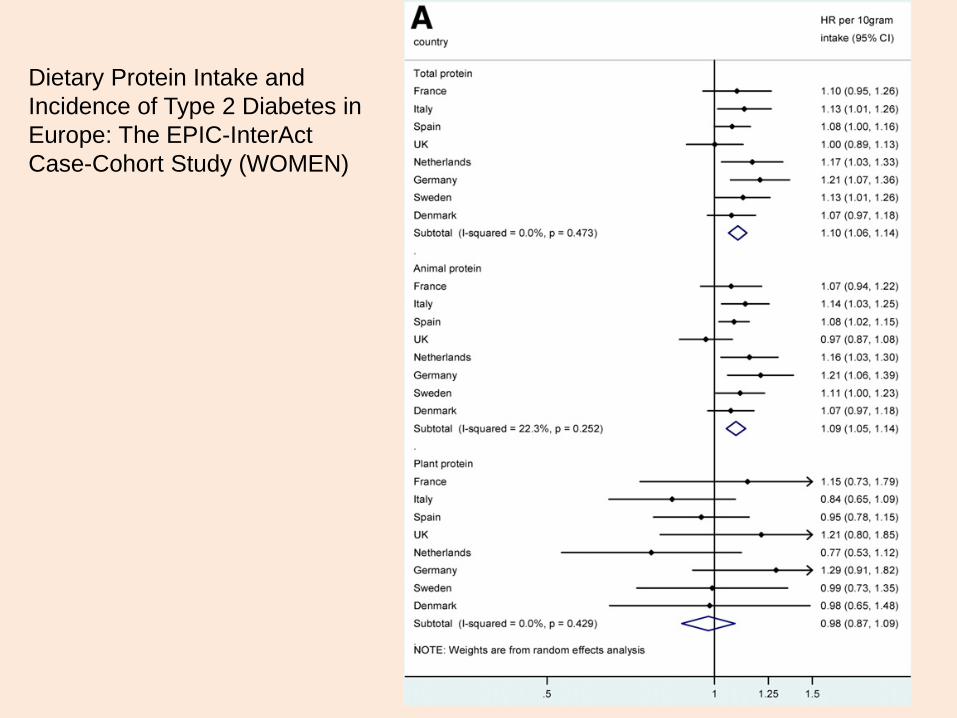
Dietary Protein Intake and
Incidence of Type 2 Diabetes in
Europe: The EPIC-InterAct
Case-Cohort Study (WOMEN)
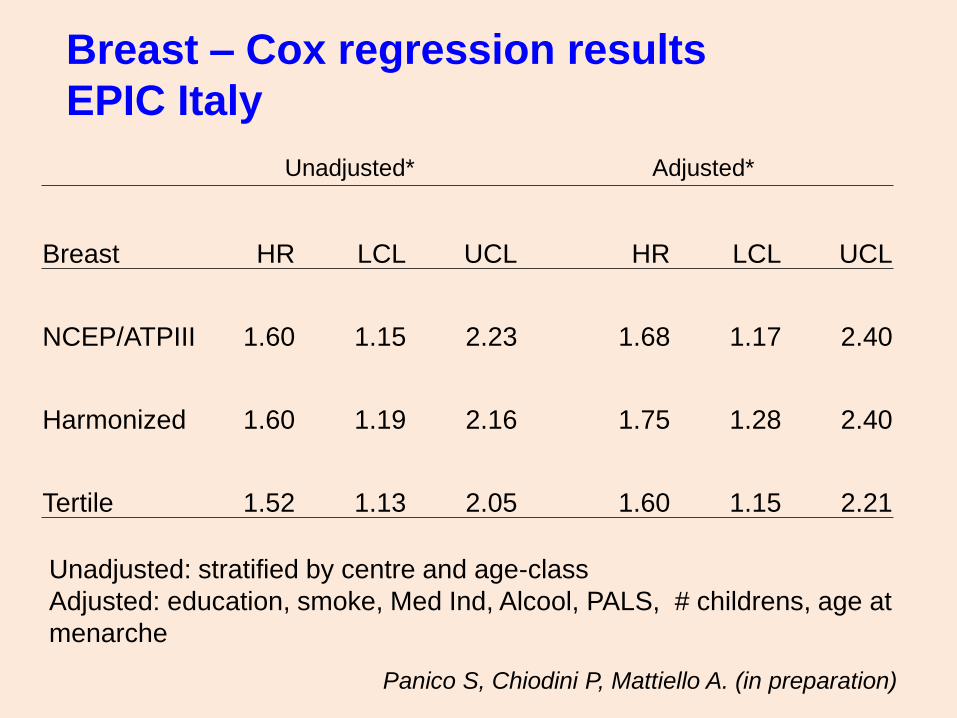
Breast – Cox regression results
EPIC Italy
Unadjusted: stratified by centre and age-class
Adjusted: education, smoke, Med Ind, Alcool, PALS, # childrens, age at
menarche
Breast HR LCL UCL HR LCL UCL
NCEP/ATPIII 1.60 1.15 2.23 1.68 1.17 2.40
Harmonized 1.60 1.19 2.16 1.75 1.28 2.40
Tertile 1.52 1.13 2.05 1.60 1.15 2.21
Panico S, Chiodini P, Mattiello A. (in preparation)
Unadjusted* Adjusted*
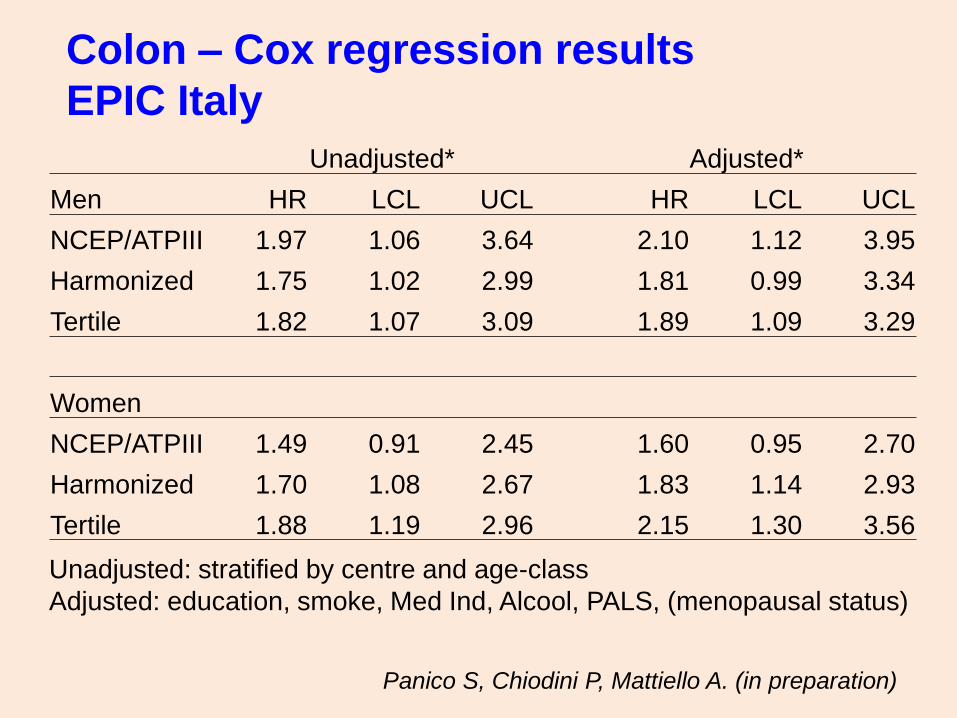
Colon – Cox regression results
EPIC Italy
Unadjusted: stratified by centre and age-class
Adjusted: education, smoke, Med Ind, Alcool, PALS, (menopausal status)
Unadjusted* Adjusted*
Men HR LCL UCL HR LCL UCL
NCEP/ATPIII 1.97 1.06 3.64 2.10 1.12 3.95
Harmonized 1.75 1.02 2.99 1.81 0.99 3.34
Tertile 1.82 1.07 3.09 1.89 1.09 3.29
Women
NCEP/ATPIII 1.49 0.91 2.45 1.60 0.95 2.70
Harmonized 1.70 1.08 2.67 1.83 1.14 2.93
Tertile 1.88 1.19 2.96 2.15 1.30 3.56
Panico S, Chiodini P, Mattiello A. (in preparation)
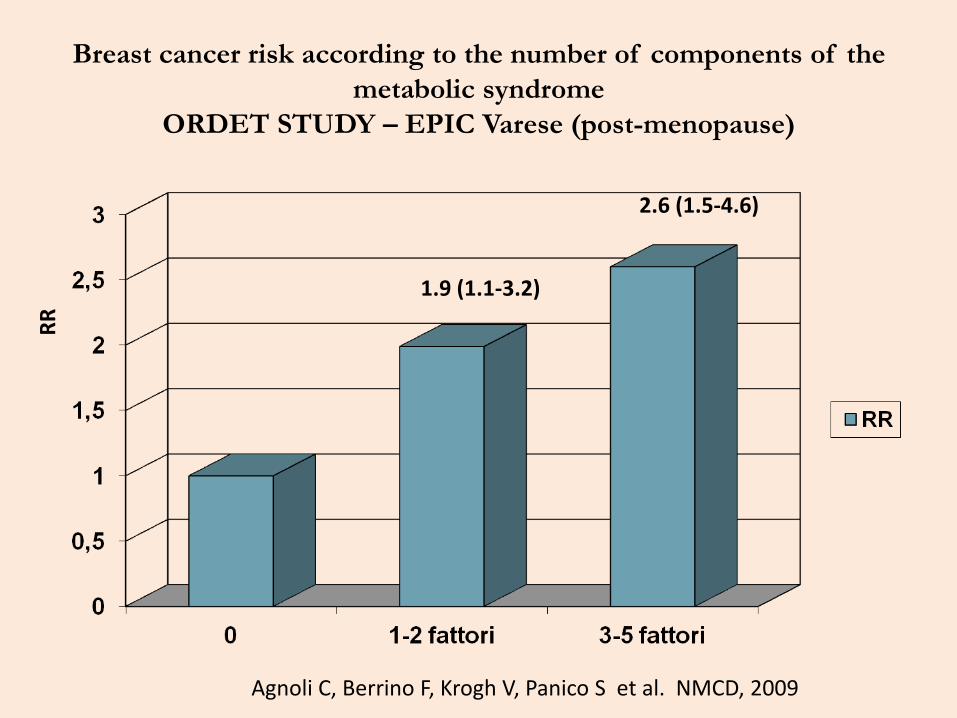
Breast cancer risk according to the number of components of the
metabolic syndrome
ORDET STUDY – EPIC Varese (post-menopause)
Agnoli C, Berrino F, Krogh V, Panico S et al. NMCD, 2009
RR
2.6 (1.5-4.6)
1.9 (1.1-3.2)
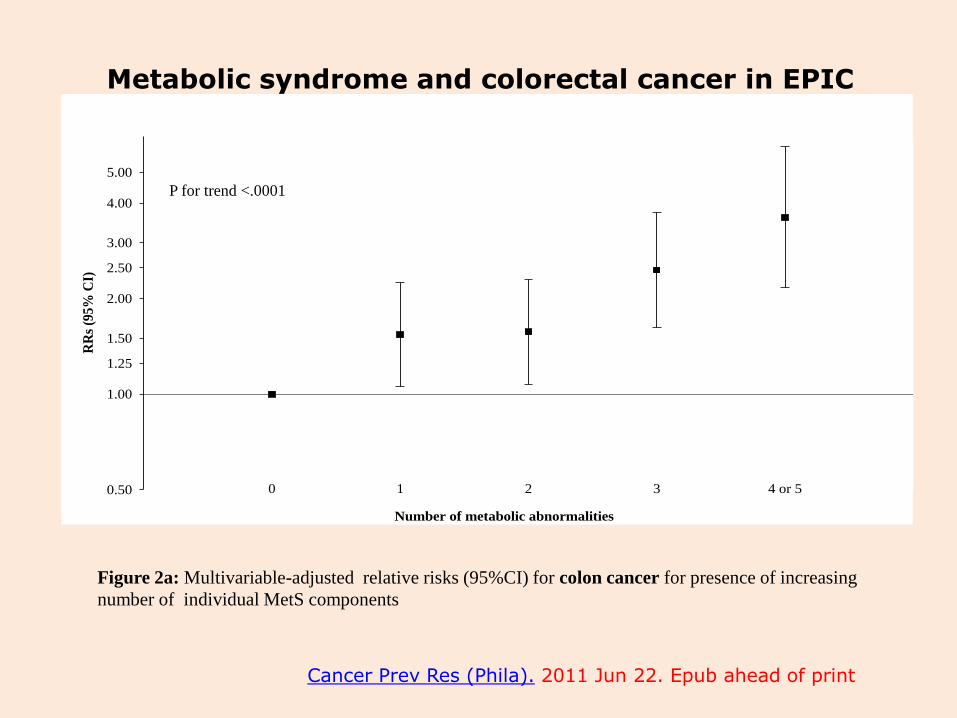
Number of metabolic abnormalities
0 1 2 3 4 or 5
RR
s (9
5%
CI)
0.50
1.00
1.25
1.50
2.00
2.50
3.00
4.00
5.00
Figure 2a: Multivariable-adjusted relative risks (95%CI) for colon cancer for presence of increasing
number of individual MetS components
P for trend <.0001
Cancer Prev Res (Phila). 2011 Jun 22. Epub ahead of print
Metabolic syndrome and colorectal cancer in EPIC

Un nuovo concetto si afferma grazie all’epidemiologia nutrizionale del cancro:
La carcinogenesi metabolica

DIANA (DIeta e ANdrogeni)sperimentazione preventiva controllata
per valutare l’efficacia di un cambiamento dello stile di vita
per prevenire o ritardare lo sviluppo di recidive e metastasi nelle donne operate di carcinoma mammario
Meccanismi che legano la dieta e il rischio
di carcinoma mammario
stile di vita e dieta dieta ipercaloricaoccidentale proteine animali IGF-I
zuccheri raffinati & grassi saturi resistenza IGFBP 1 e 2 IGF-I insulinica basse libero
obesita’
estrogeni iperandrogenismo
&
Estrogeni SHBG bassaliberi Proliferazione

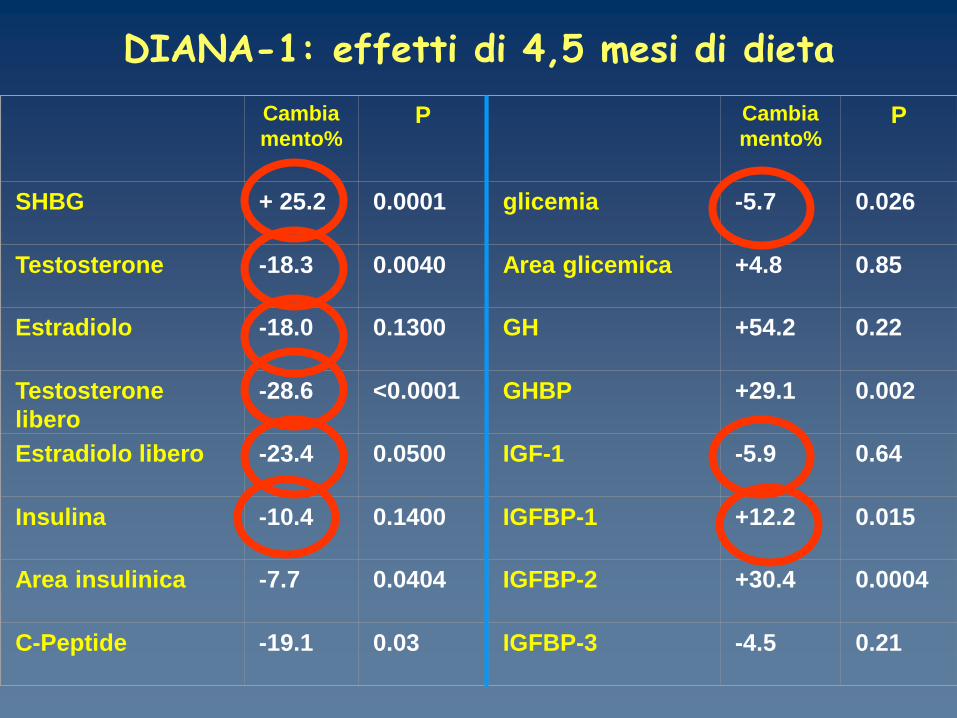
DIANA-1: effetti di 4,5 mesi di dieta
Cambia
mento%P Cambia
mento%P
SHBG + 25.2 0.0001 glicemia -5.7 0.026
Testosterone -18.3 0.0040 Area glicemica +4.8 0.85
Estradiolo -18.0 0.1300 GH +54.2 0.22
Testosterone
libero
-28.6 <0.0001 GHBP +29.1 0.002
Estradiolo libero -23.4 0.0500 IGF-1 -5.9 0.64
Insulina -10.4 0.1400 IGFBP-1 +12.2 0.015
Area insulinica -7.7 0.0404 IGFBP-2 +30.4 0.0004
C-Peptide -19.1 0.03 IGFBP-3 -4.5 0.21
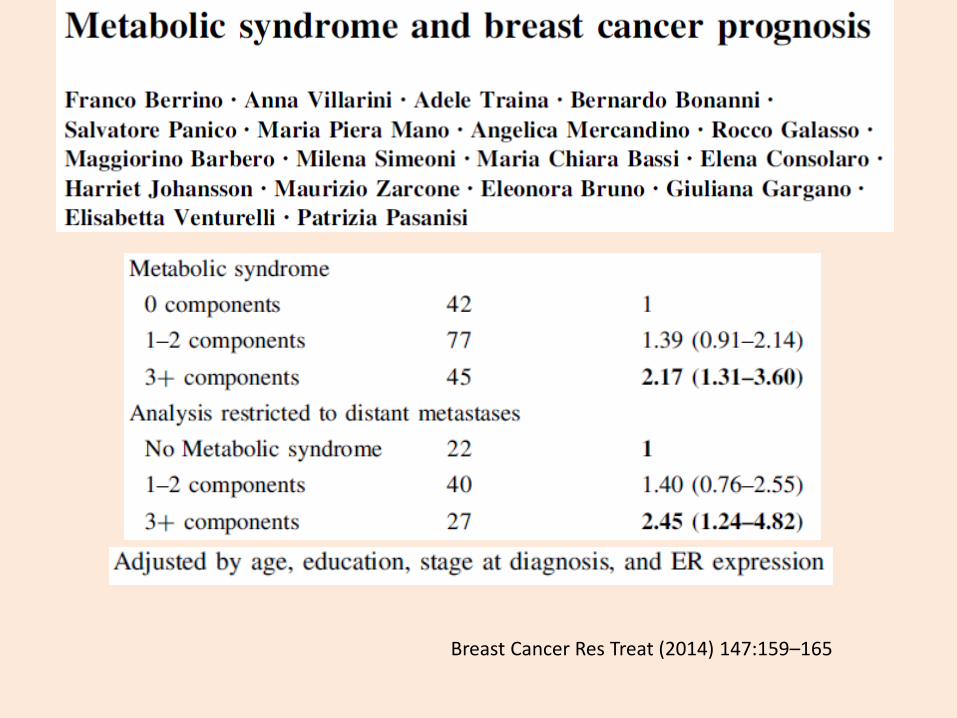
Breast Cancer Res Treat (2014) 147:159–165
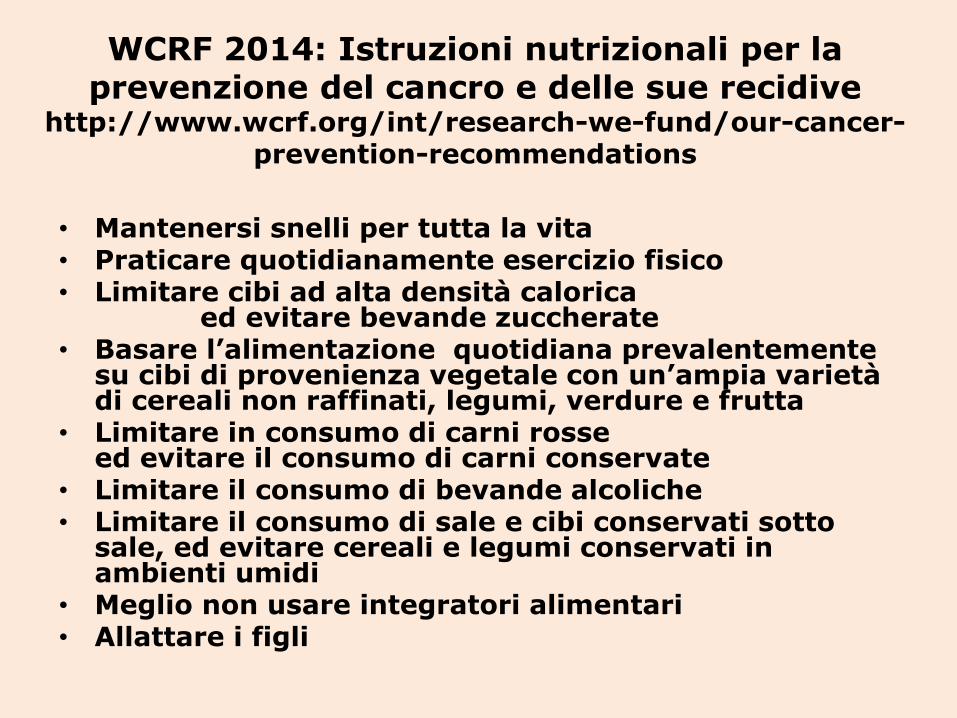
WCRF 2014: Istruzioni nutrizionali per la prevenzione del cancro e delle sue recidive
http://www.wcrf.org/int/research-we-fund/our-cancer-prevention-recommendations
• Mantenersi snelli per tutta la vita• Praticare quotidianamente esercizio fisico• Limitare cibi ad alta densità calorica
ed evitare bevande zuccherate• Basare l’alimentazione quotidiana prevalentemente
su cibi di provenienza vegetale con un’ampia varietà di cereali non raffinati, legumi, verdure e frutta
• Limitare in consumo di carni rosse ed evitare il consumo di carni conservate
• Limitare il consumo di bevande alcoliche• Limitare il consumo di sale e cibi conservati sotto
sale, ed evitare cereali e legumi conservati in ambienti umidi
• Meglio non usare integratori alimentari• Allattare i figli
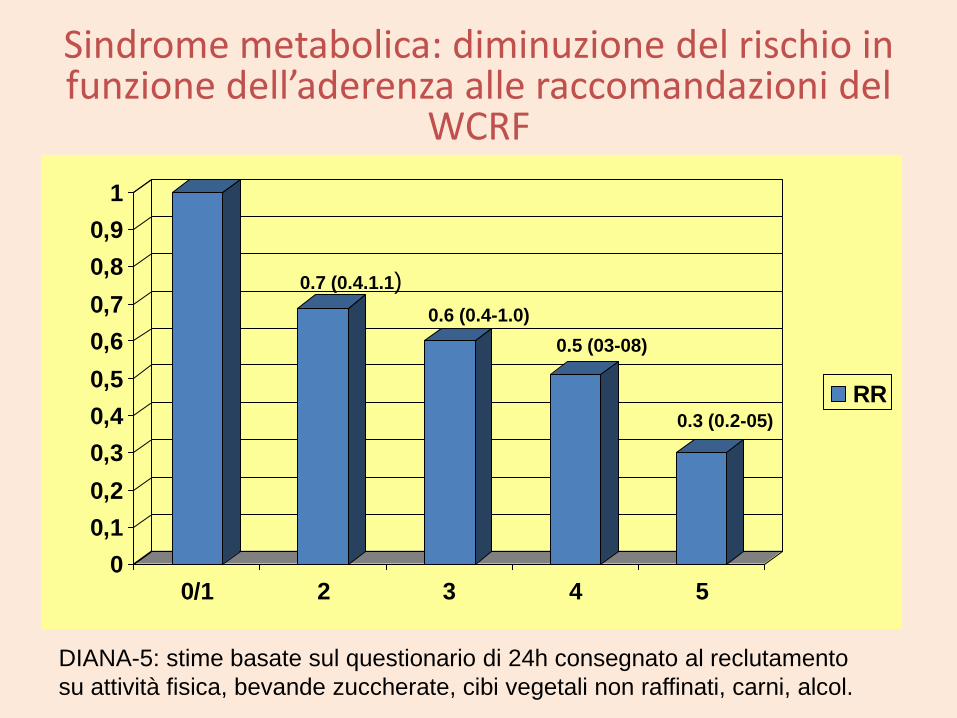
Sindrome metabolica: diminuzione del rischio in funzione dell’aderenza alle raccomandazioni del
WCRF
0
0,1
0,2
0,3
0,4
0,5
0,6
0,7
0,8
0,9
1
0/1 2 3 4 5
RR0.3 (0.2-05)
0.5 (03-08)
0.6 (0.4-1.0)
0.7 (0.4.1.1)
DIANA-5: stime basate sul questionario di 24h consegnato al reclutamento
su attività fisica, bevande zuccherate, cibi vegetali non raffinati, carni, alcol.
DIANA-1: effetti di 4,5 mesi di dieta
Cambia
mento%P Cambia
mento%P
SHBG + 25.2 0.0001 glicemia -5.7 0.026
Testosterone -18.3 0.0040 Area glicemica +4.8 0.85
Estradiolo -18.0 0.1300 GH +54.2 0.22
Testosterone
libero
-28.6 <0.0001 GHBP +29.1 0.002
Estradiolo libero -23.4 0.0500 IGF-1 -5.9 0.64
Insulina -10.4 0.1400 IGFBP-1 +12.2 0.015
Area insulinica -7.7 0.0404 IGFBP-2 +30.4 0.0004
C-Peptide -19.1 0.03 IGFBP-3 -4.5 0.21

% change of breast cancer risk factors in two randomised studies
Berrino 2001, DIANA-1
MEDITERRASIAN DIET
104 healthy women
SHBG + 25
Testosterone – 18
Free-test – 29
Estradiol – 18
Insulin – 10
IGF-I – 6
Campagnoli 2012:
METFORMIN 1500mg
108 breast cancer patient
+ 14
– 25
– 29
– 38
– 25
– 6

Metformin use and the risk of colorectal adenoma: A systematic review and meta-
analysis
Journal of Gastroenterology and Hepatology 32 (2017) 957–965
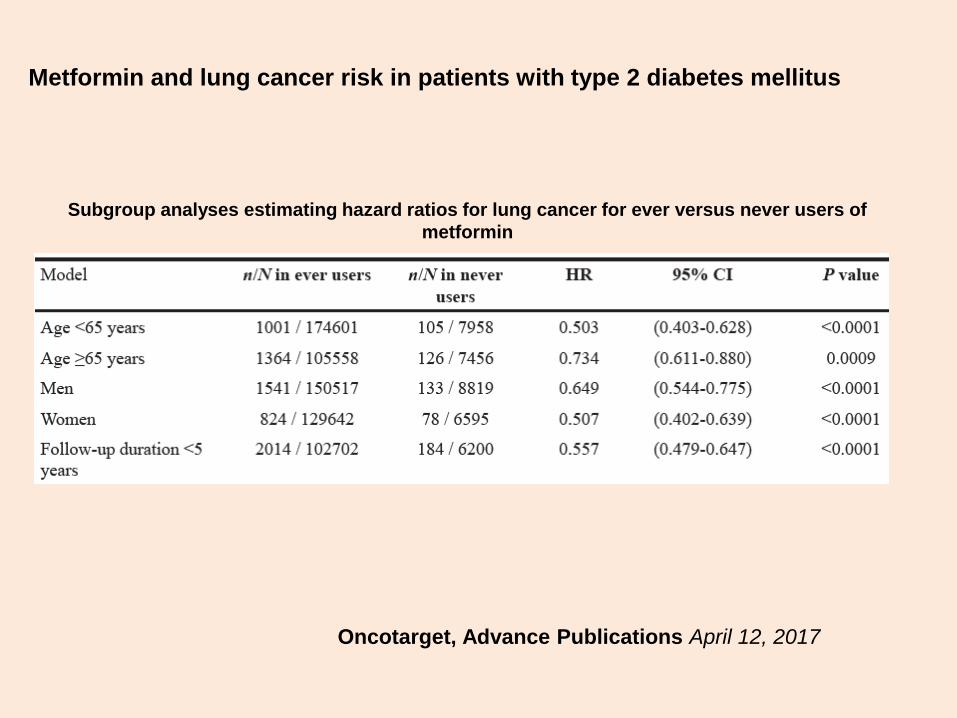
Metformin and lung cancer risk in patients with type 2 diabetes mellitus
Oncotarget, Advance Publications April 12, 2017
Subgroup analyses estimating hazard ratios for lung cancer for ever versus never users of
metformin

Conclusions: The relative effect of a T2D genetic risk score
is greater in younger and leaner participants. However, this
subgroup is at low absolute risk and would not be a logical
target for preventive interventions. The high absolute risk
associated with obesity at any level of genetic risk highlights
the importance of universal rather than targeted approaches
to lifestyle intervention.
Gene-Lifestyle Interaction and Type 2 Diabetes: The
EPIC InterAct Case-Cohort Study
PLoS Med 2014;11(5): e1001647


![[Ebook - ITA] - Naturopatia - Ortotrofia - La scienza dell'alimentazione](https://img.pdfslide.net/doc/110x75/5571fa71497959916992398c/ebook-ita-naturopatia-ortotrofia-la-scienza-dellalimentazione.jpg)