Embed Size (px)
Citation preview

Seediscussions,stats,andauthorprofilesforthispublicationat:https://www.researchgate.net/publication/281452530
Ruptureprocessesofthe2012September5Mw7.6Nicoya,CostaRicaearthquakeconstrainedbyimprovedgeodeticand...
ArticleinGeophysicalJournalInternational·July2015
DOI:10.1093/gji/ggv295
CITATION
1
READS
47
7authors,including:
ChengliLiu
ChineseAcademyofSciences
11PUBLICATIONS89CITATIONS
SEEPROFILE
YongZheng
59PUBLICATIONS761CITATIONS
SEEPROFILE
AllanLópez
UniversityofCostaRica
8PUBLICATIONS13CITATIONS
SEEPROFILE
AllcontentfollowingthispagewasuploadedbyAllanLópezon03September2015.
Theuserhasrequestedenhancementofthedownloadedfile.Allin-textreferencesunderlinedinblueareaddedtotheoriginaldocumentandarelinkedtopublicationsonResearchGate,lettingyouaccessandreadthemimmediately.

Geophysical Journal InternationalGeophys. J. Int. (2015) 203, 175–183 doi: 10.1093/gji/ggv295
GJI Seismology
Rupture processes of the 2012 September 5 Mw 7.6 Nicoya,Costa Rica earthquake constrained by improved geodeticand seismological observations
Chengli Liu,1 Yong Zheng,1 Xiong Xiong,1 Rongjiang Wang,2 Allan Lopez3 and Jun Li11State Key Laboratory of Geodesy and Earth’s Dynamics, Institute of Geodesy and Geophysics, Chinese Academy of Sciences,Wuhan 430077, China. E-mail: [email protected] German Research Centre for Geosciences, D-14473 Potsdam, Germany3Centro de Investigaciones en Ciencias Geologicas, Universidad de Costa Rica; Universidad Latina de Costa Rica, Costa Rica
Accepted 2015 July 13. Received 2015 June 19; in original form 2015 February 4
S U M M A R YOn 2012 September 5, the anticipated interplate thrust earthquake ruptured beneath the Nicoyapeninsula in northwestern Costa Rica close to the Middle America trench, with a magnitudeMw 7.6. Extensive co-seismic observations were provided by dense near-field strong groundmotion, Global Positioning Systems (GPS) networks and teleseismic recordings from globalseismic networks. The wealthy data sets available for the 2012 Mw 7.6 Nicoya earthquakeprovide a unique opportunity to investigate the details of the rupture process of this earthquake.By implementing a non-linear joint inversion with high-rate GPS waveform, more static GPSoffsets, strong-motion data and teleseismic body waveform, we obtained a robust and accuraterupture model of the 2012 Mw 7.6 Nicoya earthquake. The earthquake is dominantly a purethrust component with a maximum slip of 3.5 m, and the main large slip patch is located belowthe hypocentre, spanning ∼50 km along dip and ∼110 km along strike. The static stress dropis about 3.4 MPa. The total seismic moment of our preferred model is 3.46 × 10²⁰ N m, whichgives Mw = 7.6. Due to the fast rupture velocity, most of the seismic moment was releasedwithin 70 s. The largest slip patch directly overlaps the interseismic locked region identifiedby geodetic observations and extends downdip to the intersection with the upper plate Moho.We also find that there is a complementary pattern between the distribution of aftershocks andthe co-seismic rupture; most aftershocks locate in the crust of the upper plate and are possiblyinduced by the stress change caused by the large slip patch.
Key words: Seismic cycle; Earthquake ground motions; Earthquake source observations;Seismicity and tectonics; Body waves; Subduction zone processes.
1 I N T RO D U C T I O N
The Cocos Plate subducts northeastwards beneath the CaribbeanPlate (along the Middle America Trench) at a rate of ∼8.5 cm yr−1
(DeMets et al. 2010). Due to this rapid convergence rate, theNicoya region of northwestern Costa Rica is frequently subjectedto strong earthquakes. Since 1853, three earthquakes of M > 7occurred in this region: 1853 (M ≥ 7.5), 1900 (M ≥ 7.5), and1950 (M = 7.7) (Protti et al. 2014). Furthermore, geodetic stud-ies have suggested that the Nicoya Peninsula is a locked zone inwhich significant seismic strain was accumulated over time (Nor-abuena et al. 2004; Outerbridge et al. 2010; Walter et al. 2011;Feng et al. 2012; Jiang et al. 2012), as a consequence, a strongearthquake was anticipated in this region for many years (Nishenko1991; Protti et al. 2001). On 2012 September 5, an interplatethrust earthquake occurred beneath the Nicoya Peninsula with amoment magnitude (Mw) of 7.6. This event was recorded by adense network of strong-motion seismometers in the near-field,
teleseismic recordings from global seismic networks and GlobalPositioning System (GPS) networks, including static GPS offsetsand high-rate GPS (Dixon et al. 2013; Protti et al. 2014). Thesewealthy data sets (Fig. 1) provide a unique opportunity to investi-gate the details of the rupture processes of the 2012 Mw 7.6 Nicoyaearthquake.
Accurate slip models are critically important for estimatingCoulomb stress changes and, consequently, for assessing seismichazard and possible post-seismic mechanisms. A number of rup-ture models have been derived for this event by using teleseismicdata (Ye et al. 2013), geodetic data (Protti et al. 2014) or joint in-version of multiple data sets (Yue et al. 2013). In detail, Ye et al.(2013) used teleseismic body waves to resolve the rupture model.However, due to the well-known propagation effects, teleseismicdata can only constrain the ruptured area relative to the hypocen-tre (rupture initiation point) and are insufficient for resolving rup-ture processes in detail (Delouis et al. 2010; Zhang et al. 2014).Protti et al. (2014) built a static rupture model for this earthquake
C© The Authors 2015. Published by Oxford University Press on behalf of The Royal Astronomical Society. 175
by guest on August 18, 2015
http://gji.oxfordjournals.org/D
ownloaded from
176 C. Liu et al.
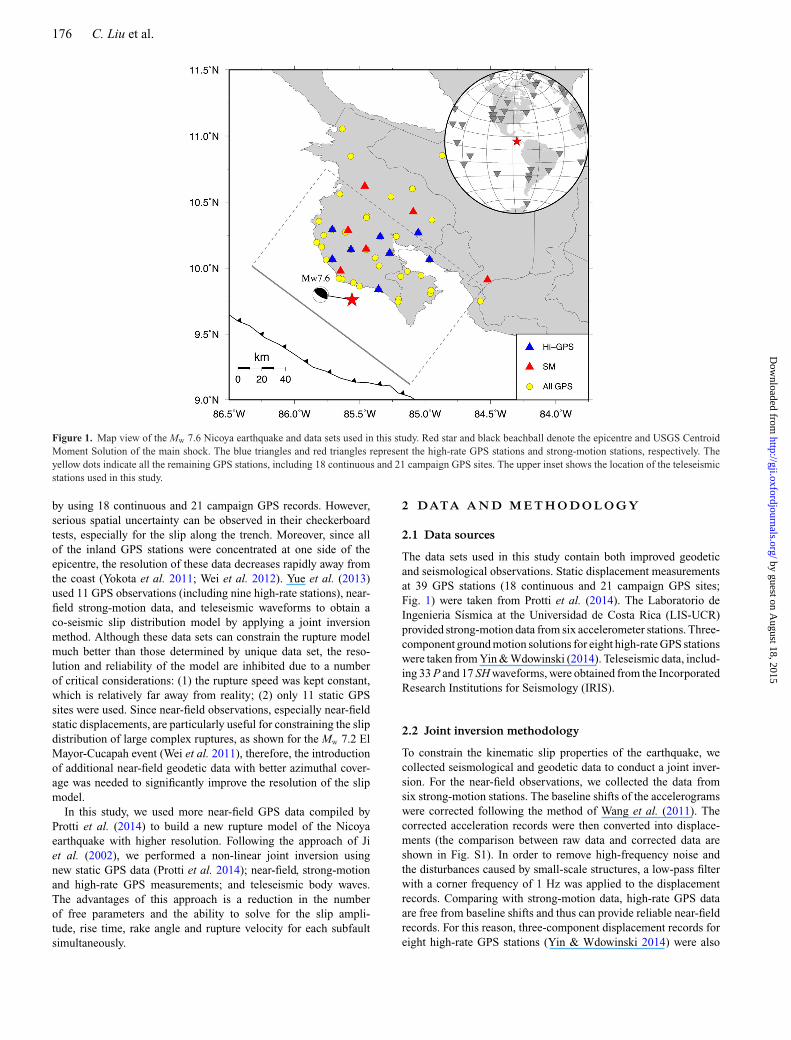
Figure 1. Map view of the Mw 7.6 Nicoya earthquake and data sets used in this study. Red star and black beachball denote the epicentre and USGS CentroidMoment Solution of the main shock. The blue triangles and red triangles represent the high-rate GPS stations and strong-motion stations, respectively. Theyellow dots indicate all the remaining GPS stations, including 18 continuous and 21 campaign GPS sites. The upper inset shows the location of the teleseismicstations used in this study.
by using 18 continuous and 21 campaign GPS records. However,serious spatial uncertainty can be observed in their checkerboardtests, especially for the slip along the trench. Moreover, since allof the inland GPS stations were concentrated at one side of theepicentre, the resolution of these data decreases rapidly away fromthe coast (Yokota et al. 2011; Wei et al. 2012). Yue et al. (2013)used 11 GPS observations (including nine high-rate stations), near-field strong-motion data, and teleseismic waveforms to obtain aco-seismic slip distribution model by applying a joint inversionmethod. Although these data sets can constrain the rupture modelmuch better than those determined by unique data set, the reso-lution and reliability of the model are inhibited due to a numberof critical considerations: (1) the rupture speed was kept constant,which is relatively far away from reality; (2) only 11 static GPSsites were used. Since near-field observations, especially near-fieldstatic displacements, are particularly useful for constraining the slipdistribution of large complex ruptures, as shown for the Mw 7.2 ElMayor-Cucapah event (Wei et al. 2011), therefore, the introductionof additional near-field geodetic data with better azimuthal cover-age was needed to significantly improve the resolution of the slipmodel.
In this study, we used more near-field GPS data compiled byProtti et al. (2014) to build a new rupture model of the Nicoyaearthquake with higher resolution. Following the approach of Jiet al. (2002), we performed a non-linear joint inversion usingnew static GPS data (Protti et al. 2014); near-field, strong-motionand high-rate GPS measurements; and teleseismic body waves.The advantages of this approach is a reduction in the numberof free parameters and the ability to solve for the slip ampli-tude, rise time, rake angle and rupture velocity for each subfaultsimultaneously.
2 DATA A N D M E T H O D O L O G Y
2.1 Data sources
The data sets used in this study contain both improved geodeticand seismological observations. Static displacement measurementsat 39 GPS stations (18 continuous and 21 campaign GPS sites;Fig. 1) were taken from Protti et al. (2014). The Laboratorio deIngenieria Sısmica at the Universidad de Costa Rica (LIS-UCR)provided strong-motion data from six accelerometer stations. Three-component ground motion solutions for eight high-rate GPS stationswere taken from Yin & Wdowinski (2014). Teleseismic data, includ-ing 33 P and 17 SH waveforms, were obtained from the IncorporatedResearch Institutions for Seismology (IRIS).
2.2 Joint inversion methodology
To constrain the kinematic slip properties of the earthquake, wecollected seismological and geodetic data to conduct a joint inver-sion. For the near-field observations, we collected the data fromsix strong-motion stations. The baseline shifts of the accelerogramswere corrected following the method of Wang et al. (2011). Thecorrected acceleration records were then converted into displace-ments (the comparison between raw data and corrected data areshown in Fig. S1). In order to remove high-frequency noise andthe disturbances caused by small-scale structures, a low-pass filterwith a corner frequency of 1 Hz was applied to the displacementrecords. Comparing with strong-motion data, high-rate GPS dataare free from baseline shifts and thus can provide reliable near-fieldrecords. For this reason, three-component displacement records foreight high-rate GPS stations (Yin & Wdowinski 2014) were also
by guest on August 18, 2015
http://gji.oxfordjournals.org/D
ownloaded from
Rupture process of the 2012 Mw 7.6 Nicoya earthquake 177
used in the inversion, and the GPS waveforms are also filtered witha low-pass filter with a corner frequency of 1 Hz.
However, almost all of the near-field data sets are located to theeast side of the source region, this kind of unevenly azimuthal dis-tribution may decrease the resolution in distal offshore areas (Diaoet al. 2011, 2012; Loveless & Meade 2011). This problem can bepartially compensated by incorporating teleseismic data set (e.g.Ammon et al. 2011; Koketsu et al. 2011; Wei et al. 2012; Yue &Lay 2013). So we chose high-quality teleseismic data with goodazimuthal coverage to improve the azimuthal data coverage. Thedata selected, 33 P and 17 SH waveforms, have high signal-to-noiseratio and good azimuthal distribution during the joint inversion(Fig. 1). The instrument responses were deconvolved from the orig-inal recordings to obtain ground displacements, and the broad-bandseismograms were bandpass filtered between 0.003 and 1 Hz.
Based on the United States Geological Survey (USGS) CentroidMoment Solution, and the geological environment in the sourceregion, we chose a slip model that consists of a single rupture planewith a length of 168 km along the strike and 112 km down dip,and with strike and dip angles of 307◦ and 21◦, respectively. Wediscretized the fault plane into a total of 336 subfaults, each witha dimension of 8 × 7 km along strike and dip, respectively. Therupture was assumed to initiate at the epicentral location (85.56◦W,9.76◦N, 13.1 km) as determined by Yue et al. (2013).
To obtain a kinematic slip model, we applied a finite fault inver-sion method, which performs the waveform inversion in the waveletdomain, along with a simulated annealing method to simultaneouslyinvert slip amplitude, rake angle, rise time and average rupture ve-locity (Ji et al. 2002, 2003). An advantage of this method is itsability to combine multiple data sets, including geodetic and seis-mic data, to retrieve the rupture evolution on the fault. In orderto eliminate singular value between neighbouring subfaults effec-tively and create the visual effect of more smoothing, we imposedadditional constraints by minimizing the slip differences betweenneighbouring subfaults, and by assuming the seismic moment inthe Global Centroid Moment Tensor (GCMT) catalogue (3.42 ×10²⁰ N m) as the reference moment. The Green’s functions usedto invert the geodetic and seismic data were calculated using a1-D layered crustal velocity model, modified from Crust2.0 (Bassinet al. 2000), and the local seismic velocity model (Table S1) asproposed by DeShon & Schwartz (2004), respectively. During theinversion process, the slip value for each subfault was allowed tovary from 0 to 6 m, and the search for the rake angle was performedin the range from 48◦ to 138◦, with a search step of 3◦. The averagerupture velocity was allowed to vary from 1.5 to 3.5 km s−1, with astep of 0.1 km s−1. Finally, the rise time in the inversion model wasallowed to change from 2.0 to 24.0 s, with a time step of 2.0 s.
3 C H E C K E R B OA R D T E S T S
Checkerboard tests are used to provide a direct visualization of therelative resolutions of different data sets. Thus, before conductingthe inversions of the real data sets, we performed checkerboardtests to investigate the resolutions of the unique data set and jointinversions for the rupture model (Fig. 2a). Similar to the inversionswith the real data, we built a test model in which the fault plane wasstriking 307◦ and dipping 21◦. The synthetic data were generated forthe same stations that provided the real data (Fig. 1) and the sameGreen’s functions were used in both the checkerboard tests and thereal data inversions. The slip patches contained 4 × 4 (32 × 28 km)subfaults, with each subfault having a slip of 3 m, a rake angle of
90◦, an average rupture velocity of 2.5 km s−1 and a rise time of12 s. The theoretical displacement and velocity waveforms werecomputed for each geodetic and seismic station. We then invertedthe synthetic data without adding noise both separately and jointly.In the inversion, the slip amplitude was allowed to vary from 0to 6 m, the rake angle ranged from 48◦ to 138◦, the rise time wasallowed to vary from 2.0 to 24.0 s, with a time step of 2.0 s and therupture velocity was allowed to vary from 1.5 to 3.5 km s−1.
The results of the checkerboard tests show that the joint inver-sion provides higher resolution than any other models determinedby unique data set (Fig. 2). The teleseismic body wave data setmodel shows a poor resolution (Fig. 2b), which is not sufficientto resolve the rupture process in detail. Comparing with previousdata sets, the resolution of the high-rate GPS data is improved dra-matically (Fig. 2c), especially to the northwest of the epicentre.However, slip resolution in the southeastern part of the fault planeremains relatively low due to the absence of stations to the southand southeast of the hypocentre. For the strong-motion data, theupdip slip pattern is smeared along the strike direction. Similar tothe high-rate GPS data, resolution in the southeastern part is stillneeded improvement (Fig. 2d). The GPS static offsets generallyhave good resolution for downdip slip, but are poorly resolved forthe near-trench slip, and especially poorly resolved for the slip to thesoutheast of the hypocentre (Fig. 2e), which is in good agreementwith the model of Protti et al. (2014). Comparing with all the uniquedata set models, the resolution of the joint inversion model is muchbetter, especially for the slip near the trench, where both the slippattern and the slip amplitude are significantly improved (Fig. 2f).Moreover, other parameters, including rupture velocity, rise timeand rake angle, are all almost perfectly resolved (Figs S2 and S3b),even when a 5 per cent or 10 per cent level of Gaussian white noiseis added to all synthetics, the input model is still recovered very well(Fig. S3).
In addition, we also conducted two tests with different grid spac-ing to explore the model resolution. In one checkerboard test, thegrid size is 56 × 42 km and the other one is similar to the realslip pattern. The test results show that the inverted rupture mod-els also provide a good resolution (Fig. S4). From these resolutiontests, we proposed that the joint inversion is capable of providinghigh-resolution and reliable rupture model for the Mw 7.6 Nicoyaearthquake.
4 R E S U LT S A N D D I S C U S S I O N
In this study, we used a joint inversion to define a finite fault model ofthe Nicoya earthquake (Fig. 3). Our optimized model shows that thetotal seismic moment was 3.46 × 10²⁰ N m, equals to a magnitudeof Mw 7.6, and that the dominant mechanism was pure thrust with amaximum slip of 3.5 m, which occurred at a depth of 25 km belowthe epicentre (Fig. 3a). The largest slip patch was located belowthe hypocentre, extending ∼50 km along dip and ∼110 km alongstrike. This area directly overlaps a locked onshore interseismicregion, as indicated by geodetic observations (Feng et al. 2012),and extends downdip to the intersection between the subducted slaband the Moho (Fig. 3b). Taken as a circular fault, the large slippatch has a radius (R) of 30 km and an average slip (�D) of 2.5 m.With a rigidity of 3.0 × 10⁴ MPa, the estimated static stress drop,using the expression �σ = 7π
16 μ�DR (Kanamori & Anderson 1975),
was 3.4 MPa. This is consistent with a median stress drop (around3.3 MPa) of global interpolate earthquakes (Kanamori & Anderson1975; Allmann & Shearer 2009). Secondary oblique strike slip
by guest on August 18, 2015
http://gji.oxfordjournals.org/D
ownloaded from

178 C. Liu et al.
Figure 2. Checkerboard tests for the model resolution. (a) The input slip model used to generate synthetic data. Both seismic waveforms and static data aregenerated at stations recording the main event and used in the inversion. The inversion results using only the teleseismic data (b), high-rate GPS waveform data(c), strong-motion data (d), static GPS offsets (e) and combined all above data sets (f). Green star indicates the epicentre of the main shock.
asperities were also found along both sides of the major slip asperity,located above the hypocentre. The dominant slip direction of the leftasperity is 135◦ along the rake direction and the rake angle of theright asperity is 55◦, which are consistent with the direction of theco-seismic displacements observed by GPS stations near the coast
(Fig. 4). However, their magnitudes are much smaller than that ofthe major slip patch.
Our preferred slip model shows that the rupture initiated withsmall amplitude near the hypocentre, and then it propagated mainlyalong the dip direction with a relatively slow speed (1–2 km s−1)
by guest on August 18, 2015
http://gji.oxfordjournals.org/D
ownloaded from

Rupture process of the 2012 Mw 7.6 Nicoya earthquake 179
Figure 3. (a) Slip distribution calculated from our joint inversion. The red star indicates the hypocentre, the colour bar shows the scale of the slip amplitude,the white arrows represent the slip directions and the contours outline the rupture propagation time in second. (b) The surface projection of the inverted slipdistribution. Grey dots indicate the aftershocks from the RSN catalogue. The black contour indicates the interseismic locked region (Feng et al. 2012). Thewhite dashed line shows the surface projection of Moho interface. The inset shows the moment-rate function of this earthquake.
Figure 4. Comparison between the observed horizontal (a) and vertical (b) displacements and those predicted from our preferred model. The black arrows arethe static GPS data and the red arrows are synthetics.
in the first 10 s. After the first 10 s, the rupture speed below thehypocentre was accelerated to 3.0 km s−1 (Fig. 3a), and the momentrate function reached a peak value at about 20 s (Fig. 3b). After20 s, two additional significant slip patches were located on bothside of the epicentre (Fig 3a), with a magnitude of 1.5 m. In orderto make sure whether these two slip patches represent real slip orjust artificial effects of the inversion, we conducted several testswith different conditions to verify them. Their appearance in eachof these tests showed that the two patches are stable features of ourfinite rupture model instead of artefacts.
The co-seismic rupture pattern revealed in our preferred model isconsistent with the distribution of aftershocks reported by the RedSismologica Nacional (RSN). Most aftershocks were located in thecrust of the upper plate and were likely induced by the Coulombstress change caused by the large slip patch. Another notable phe-nomenon is that a cluster of aftershocks was located in the weak rup-ture zone between the epicentre and the largest slip patch (Fig. 3b).This cluster might be caused by the unreleased strain during theprocess of the co-seismic rupture of the main shock.
Besides the consistency between the slip pattern and the after-shock distribution, the synthetic waveforms of our preferred modelalso fit with other observations well. Our preferred model can wellexplain the static displacements (Fig. 4), high-rate GPS waveforms(Fig. 5), most strong-motion observations (Fig. 6) and teleseismicobservations (Fig. 7). Relatively larger mismatches can only befound in the strong-motion data. For example, the waveforms inthe E–W component of the GNSR and GLIB stations show particu-larly large misfits in the later portions of the records (Fig. 6). Thesemisfits are presumably due to path effects caused by complicatedstructures, especially within the sediments. In addition, near-fieldhorizontal strong-motion records are usually contaminated by bothco-seismic ground tilts and analogue-to-digital conversion (Boore2003), which can cause baseline shift during the integration pro-cess from accelerogram to displacement. Although we correctedthe strong-motion records, using the method of Wang et al. (2011),it remains difficult to retrieve ground displacements accurately, es-pecially for the post-event static displacement seismograms (Wanget al. 2011).
by guest on August 18, 2015
http://gji.oxfordjournals.org/D
ownloaded from

180 C. Liu et al.
Figure 5. Comparison of the high-rate GPS records (black line) and synthetic seismograms (red line) derived from our model. Both data and synthetics arealigned by the first P arrivals. The number at the first of each seismogram indicates the station name; the number at the right top is the maximum displacementof the records in cm.
Figure 6. Comparison of the strong-motion records (black line) and synthetic seismograms (red line) derived from our model. Both data and synthetics arealigned by the first P arrivals. The number at the first of each seismogram indicates the station name; the number at the right top is the maximum displacementof the records in cm.
To further verify the reliability of our rupture model, we com-pared our results with the results of other studies. In the inversion ofProtti et al. (2014), a co-seismic large slip patch was located directlybeneath the Nicoya Peninsula, consistent with our preferred model.However, in contrast to our model, significant continuous slip can be
observed near the trench. However, their checkerboard test demon-strates that the resolution in their model boundaries is quite low,especially for boundary near the trench. Furthermore, in our model,although there is also an obvious slip updip of the hypocentre, therupture area is smaller. Yue et al. (2013) also showed a relatively
by guest on August 18, 2015
http://gji.oxfordjournals.org/D
ownloaded from

Rupture process of the 2012 Mw 7.6 Nicoya earthquake 181
Figure 7. Comparison of teleseismic displacement records in black and synthetic seismograms in red predicted by the slip model; the seismograms are bandpassfiltered with a frequency band of 0.003–1 Hz. Both data and synthetic seismograms are aligned to the P and SH arrivals. The number at the end of each traceis the peak displacement of the data in micrometres. The azimuth and distance in degrees are shown at the beginning of each record with the azimuth on top.
by guest on August 18, 2015
http://gji.oxfordjournals.org/D
ownloaded from

182 C. Liu et al.
small slip area with no significant slip near the trench. This suggeststhat the strong rupture trench-proximal slip patch in the model ofProtti et al. (2014) may be an artificial effect caused by the lowresolution of their data set.
Overall, the rupture model of Yue et al. (2013) is most consis-tent with our model. However, due to the different data sets utilizedby the two models there are still some differences between them.For example, Yue et al. (2013) used only 11 GPS static offsets toconstrain the slip model, while we used 39 GPS data sites, thus ourGPS data have much better azimuthal coverage. To investigate theslip discrepancies between the models, we conducted two additionalcheckerboard tests to explore the relative resolution powers of ourjoint work and the inversion of Yue et al. (2013). First, we testedthe co-seismic displacement resolution. As we used more static datathan Yue et al. (2013), the resolution of our static model is muchbetter, especially for the slip patches at greater depths and near themodel boundaries (Fig. S1). Second, we compared the resolutionsbetween the data sets of Yue et al. (2013) and those of our preferredmodel (Fig. S2). As expected, the spatial resolution of our jointinversion is much better than that of Yue et al. (2013). These resultssuggest that the slip discrepancies and the differences in co-seismicdisplacement between our joint inversion and the inversion of Yueet al. (2013) mainly reflect data set selection. The results also showthat our preferred model provides a higher resolution and more re-liable rupture pattern for the Nicoya earthquake. Moreover, in orderto test the influence of the rupture velocity, we tested many inver-sions by assuming different constant rupture velocities (the rupturevelocities were chosen between 1.5 and 3.5 km s−1 with an intervalof 0.5 km s−1), and also assuming a variable rupture velocity, whichwas allowed to vary in the range from 1.5 to 3.5 km s−1. By com-parison, the model derived from the variable rupture velocity yieldsa better fit to all data sets (Table S2) than the other models.
5 C O N C LU S I O N S
By implementing a joint inversion of high-rate GPS waveforms,more static GPS offsets than in previous studies, strong-motiondata and teleseismic body waveforms, we obtained a robust andaccurate rupture model of the 2012 Mw 7.6 subduction zone thrustearthquake of the Nicoya Peninsula, northwestern Costa Rica. Ourmodel shows that the earthquake was dominated by pure thrust slipwith maximum amplitude of 3.5 m. The largest area of slip waslocated below the hypocentre, extending ∼50 km along the dip and∼110 km along the strike. The static stress drop was about 3.4 MPaand the total seismic moment was 3.46 × 10²⁰ N m, equivalent toMw 7.6. Due to the fast rupture velocity, most of the seismic momentwas released within 70 s.
The largest slip patch directly overlaps the interseismic lockedzone, as indicated by geodetic observations, and extends downdip tothe intersection with the Moho. We also found that the distributionof aftershocks was complementary to the co-seismic rupture pattern.Most aftershocks were located in the crust of the upper plate andwere likely induced by the Coulomb stress change caused by thelarge slip patch identified in this study.
A C K N OW L E D G E M E N T S
This work was supported by the National Natural Science Foun-dation of China (Grant Numbers 41422401 and 41321063), theChinese Earthquake Administration (Grant Number 201308013)and by an Excellent Young Scientist grant from Hubei Province
(Grant Number 2012FFA026). We would like to thank Aaron Moya(Earthquake Engineering Laboratory, UCR) for providing thestrong-motion data, Lepolt Linkimer and Wilfredo Rojas (RSN,UCR) for preparing the aftershock catalogue, Haitao Yin (Earth-quake Administration of Shandong Province) for the high-rate GPSdata and the IRIS data centre for providing the broad-band teleseis-mic waveforms. All figures were generated using the open-sourceGeneric Mapping Tools software (Wessel & Smith 1991).
R E F E R E N C E S
Allmann, B.P. & Shearer, P.M., 2009. Global variations of stress dropfor moderate to large earthquakes, J. geophys. Res., 114, B01310,doi:10.1029/2008JB005821.
Ammon, C.J., Lay, T., Kanamori, H. & Cleveland, M., 2011. A rupturemodel of the 2011 off the Pacific coast of Tohoku earthquake, EarthPlanets Space, 63, 693–696.
Bassin, C., Laske, G. & Masters, G., 2000. The current limits of resolutionfor surface wave tomography in North America, EOS, Trans. Am. geophys.Un., 81, 897.
Boore, D.M., 2003. Analog-to-digital conversion as a source of drifts indisplacements derived from digital recordings of ground acceleration,Bull. seism. Soc. Am., 93, 2017–2024.
Delouis, B., Nocquet, L.M. & Vallee, M., 2010. Slip distribution of theFebruary 27, 2010 Mw = 8.8 Maule earthquake, central Chile, from staticand high-rate GPS, InSAR, and broadband teleseismic data, Geophys.Res. Lett., 37, L17305, doi:10.1029/2010GL043899.
DeMets, C., Gordon, R.G. & Argus, D.F., 2010. Geologically current platemotions, Geophys. J. Int., 181, 1–80.
DeShon, H.R. & Schwartz, S.Y., 2004. Evidence for serpentinization of theforearc mantle wedge along the Nicoya Peninsula, Costa Rica, Geophys.Res. Lett., 31, L21611, doi:10.1029/2004GL021179.
Diao, F., Xiong, X., Sidao, N., Yong, Z. & Can, G., 2011. Slip model ofthe Mw 9.0 Sendai earthquake (Japan) and its Mw 7.9 aftershock derivedfrom GPS data, Chin. Sci. Bull., 56(27), 2941–2947.
Diao, F., Xiong, X. & Yong, Z., 2012. Static slip model of the Mw 9.0 Tohoku(Japan) earthquake: results from joint inversion of terrestrial GPS dataand sea-floor GPS/Acoustic data, Chin. Sci. Bull., 57(18), 1676–1683.
Dixon, T.H., Schwartz, S., Protti, M., Gonzalez, V., Newman, A. & Marshall,J., 2013. Detailed data available for recent Costa Rica earthquake, EOS,Trans. Am. geophys. Un., 94(2), 17–18.
Feng, L., Newman, A.V., Protti, M., Gonzalez, V., Jiang, Y. & Dixon, T.H.,2012. Active deformation near the Nicoya Peninsula, northwestern CostaRica, between 1996 and 2010: interseismic megathrust coupling, J. geo-phys. Res., 117, B06407, doi:10.1029/2012JB009230.
Ji, C., Wald, D.J. & Helmberger, D.V., 2002. Source description of the 1999Hector Mine, California, earthquake, Part I: wavelet domain inversiontheory and resolution analysis, Bull. seism. Soc. Am., 92(4), 1192–1207.
Ji, C., Helmberger, D.V., Wald, D.J. & Ma, K.F., 2003. Slip history and dy-namic implications of the 1999 Chi-Chi, Taiwan, earthquake, J. geophys.Res., 108(B9), 2412, doi:10.1029/2002JB001764.
Jiang, Y., Wdowinski, S., Dixon, T.H., Hackl, M., Protti, M. & Gonzalez,V., 2012. Slow slip events in Costa Rica detected by continuous GPSobservations, 2002–2011, Geochem. Geophys. Geosyst., 13, Q04006,doi:10.1029/2012GC004058.
Kanamori, H. & Anderson, D.L., 1975. Theoritical basis of some empiricalrelations in seismology, Bull. seism. Soc. Am., 65, 1073–1095.
Koketsu, K. et al., 2011. A unified source model for the 2011 Tohokuearthquake, Earth planet. Sci. Lett., 310(3), 480–487.
Loveless, J.P. & Meade, B.J., 2011. Spatial correlation of in-terseismic coupling and co-seismic rupture extent of the 2011Mw = 9.0 Tohoku-oki earthquake, Geophys. Res. Lett., 38, L17306,doi:10.1029/2011GL048561.
Nishenko, S.P., 1991. Circum-Pacific seismic potential: 1989–1999, Pureappl. Geophys., 135, 169–259.
by guest on August 18, 2015
http://gji.oxfordjournals.org/D
ownloaded from

Rupture process of the 2012 Mw 7.6 Nicoya earthquake 183
Norabuena, E. et al., 2004. Geodetic and seismic constraints on some seis-mogenic zone processes in Costa Rica, J. geophys. Res., 109, B11403,doi:10.1029/2003JB002931.
Outerbridge, K. et al., 2010. A tremor and slip event on the Cocos-Caribbeansubduction zone as measured by a global positioning system (GPS) andseismic network on the Nicoya Peninsula, Costa Rica, J. geophys. Res.,115, B10408, doi:10.1029/2009JB006845.
Protti, M., Guendel, F. & Malavassi, E., 2001. Evaluacion del potencialsısmico de la Penınsula de Nicoya, Editorial Fundacion UNA.
Protti, M. et al., 2014. Nicoya earthquake rupture anticipated by geodeticmeasurement of the locked plate interface, Nat. Geosci., 7(2), 117–121.
Walter, J.I., Schwartz, S.Y., Protti, M. & Gonzalez, V., 2011. Persistenttremor within the northern Costa Rica seismogenic zone, Geophys. Res.Lett., 38, L01307, doi:10.1029/2010GL045586.
Wang, R., Schurr, B., Milkereit, C., Shao, Z. & Jin, M., 2011. An improvedautomatic scheme for empirical baseline correction of digital strong-motion records, Bull. seism. Soc. Am., 101(5), 2029–2044.
Wei, S. et al., 2011. Superficial simplicity of the 2010 El Mayor-Cucapahearthquake of Baja California in Mexico, Nat. Geosci., 4, 615–618.
Wei, S., Graves, R., Helmberger, D., Avouac, J.P. & Jiang, J., 2012. Sourcesof shaking and flooding during the Tohoku-Oki earthquake: a mixture ofrupture styles, Earth planet. Sci. Lett., 333, 91–100.
Wessel, P. & Smith, W.H.F., 1991. Free software helps map and display data,EOS, Trans. Am. geophys. Un., 72, 445–446.
Ye, L., Lay, T. & Kanamori, H., 2013. Large earthquake rupture processvariations on the Middle America megathrust, Earth planet. Sci. Lett.,381(0), 147–155.
Yin, H. & Wdowinski, S., 2014. Improved detection of earthquake-inducedground motion with spatial filter: case study of the 2012 M = 7.6 CostaRica earthquake, GPS Solutions, 18(4), 563–570.
Yokota, Y., Koketsu, K., Fujii, Y., Satake, K., Sakai, S., Shinohara, M. &Kanazawa, T., 2011. Joint inversion of strong motion, teleseismic, geode-tic, and tsunami datasets for the rupture process of the 2011 Tohoku earth-quake, Geophys. Res. Lett., 38, L00G21, doi:10.1029/2011GL050098.
Yue, H. & Lay, T., 2013. Source rupture models for the Mw 9.0 2011 Tohokuearthquake from joint inversions of high-rate geodetic and seismic data,Bull. seism. Soc. Am., 103(2b), 1242–1255.
Yue, H., Lay, T., Schwartz, S.Y., Rivera, L., Protti, M., Dixon, T.H., Owen,S. & Newman, A.V., 2013. The 5 September 2012 Nicoya, Costa RicaMw 7.6 earthquake rupture process from joint inversion of high-rateGPS, strong-motion, and teleseismic P wave data and its relationshipto adjacent plate boundary interface properties, J. geophys. Res., 118,5453–5466.
Zhang, Y., Wang, R., Chen, Y., Xu, L., Du, F., Jin, M., Tu, H. & Dahm,T., 2014. Kinematic rupture model and hypocenter relocation of the 2013
Mw 6.6 Lushan Earthquake Constrained by strong-motion and teleseismicdata, Seism. Res. Lett., 85(1), 15–22.
S U P P O RT I N G I N F O R M AT I O N
Additional Supporting Information may be found in the online ver-sion of this paper:
Table S1. 1-D velocity model used in this study.Table S2. Misfits versus different rupture velocities.Figure S1. Baseline correction of strong-motion records. Left:three components of original strong-motion records at each station.Middle: velocity seismograms integrated from the original strong-motion records. Right: displacement seismograms integrated fromthe velocity seismograms, and the red lines show the correcteddisplacement waveform.Figure S2. (a) Rise time of the input model. (b) Rise time obtainedby joint inverting the synthetic data.Figure S3. (a) Input slip model. (b) Slip model obtained by joint in-verting the synthetic data sets with no noise. (c) Slip model obtainedby joint inverting the synthetic data sets with 5 per cent Gaussianwhite noise. (d) Same as (c), but with 10 per cent Gaussian whitenoise. The black contours indicate the target and inverted ruptureinitiation time. The white arrows denote the rake angles.Figure S4. Checkerboard tests with different slip patches. Panels(a) and (c) show the target model with different slip patches. Panels(b) and (c) present the corresponding inverted results. The blackcontours indicate the target and inverted rupture initiation time.The white arrows denote the rake angles.Figure S5. The checkerboard tests for static GPS data resolution.(a) The inversion result of using our data and (b) using the data ofYue et al. (2013). Light blue triangles indicate the static GPS stationlocations.Figure S6. Comparing the resolution of (a) using our data sets and(b) the data sets of Yue et al. (2013) (http://gji.oxfordjournals.org/lookup/suppl/doi:10.1093/gji/ggv295/-/DC1).
Please note: Oxford University Press is not responsible for the con-tent or functionality of any supporting materials supplied by theauthors. Any queries (other than missing material) should be di-rected to the corresponding author for the paper.
by guest on August 18, 2015
http://gji.oxfordjournals.org/D
ownloaded from
View publication statsView publication stats