Embed Size (px)
Citation preview

CHAPTER III
RURAL EMPLOYMENT IN THE CONTEXT OF
THE HILL ECONOMY: THEORETICAL FRAMEWORK
AND EMPIRICAL EVIDENCES
I. Theoretical Foundations and Empirical Evidences
1. Labour Transfer Model
The problems of development in the developing countries have generally been
analysed within the frame of dualistic nature of economy-- the low productive, labour
surplus rural economy with predominant agriculture base and high productive,
modem industrial urban sector. The key issue has been how to transform the rural
economy, characterising the excessive labour supply and low productivity in the
predominant agriculture sector. The dual economy model originally developed by W.
Arthur Lewis (1954), and later by John Fei and Gustav Ranis (1964) has shown that
with the development of modem sector, the surplus labour from agriculture
(backward) sector would be gradually absorbed in to modem sector as development
takes its roots. The basic premise of this formulation was that in the subsistence
sector the wages are determined by tradition, subsistence need and other non
economic factors while the urban wages are determined by the marginal productivity.
Since the rural wage is higher than the labour productivity or marginal product of
labour and there will be no incentive to raise the wage until the labour productivity is
enhanced sufficiently to equal the wage. Thereafter, as the marginal product or labour
productivity continues rising, the wage will go up. Therefore, in the Lewisian
framework there is Ulllimited supply of labour to the modem sector at the subsistence
wage rates until they ceased to be under-employed in the agriculture sector.
Therefore, in the early phase of industrial development, the income generated would
be wholly accrued by the industrial capitalist class. This surplus is critical for
industrial development that facilitates faster labour transfer and modem sector
employment growth.
The labour transfer model however, failed to generate adequate employment and the
key assumptions of his theory did not fit in well with the realities or empirical
43

foundation of agrarian economies. Experience show that the labour absorption
capacity in the industrial sector has been quite limited owing to higher capital
intensity and fast industrial restructuring that tend to displace existing labour with
capital. The wage constancy assumption in the industrial sector even for
underemployed rural labourers seems quite unreasonable, untenable and does not
borne out by the facts (Sen, 1966, 1975; Lal, 1976; Rosenzweig, 1978; Bardhan,
1979). Unlike in industrial economies, a large volume of workforce in the developing
countries is engaged in self-employment activities (agricultural and in the informal
economy), where the productivity is low and Lewisian price mechanism does not
seem to operate nor the rural to urban migration thesis based on wage differentials
adequately explains the empirical findings of agrarian economies. Push factors often
seem to dominate in the migration process, which is governed by various factors such
as seasonality, erosion of assets, landlessness and poverty particularly in the context
of backward economies. Many micro-evidences corroborate this thesis (Lipton, 1980;
Oberai and Singh, 1983; Breman, 1985; Bora, 1996). Lewis himself realised many
constraints of his theory when he revisited and observed the following major
constraints: large size of traditional sector, pervasiveness of labour saving
innovations, and vulnerability of small-scale enterprises (Lewis, 1979).
The static equilibrium assumption derived from the neo-classical theory holds that the
working of economic forces will cause spatial differences to narrow, also does not fit
in the realities of backward economies, where institutional and structural rigidities
retard the growth process. It was therefore, argued that the principal reason for
lagging growth in developing countries or geographic regions can be explained with
the cumulative causation hypothesis (Myrdal, 1957) and not by the unrealistic stable
equilibrium assumption. This hypothesis relates to geographic dualism or regional
inequalities applicable to nations and regions within nations that show very wide
differences in terms of industrialisation, income, trade, employment and levels of
unemployment. Myrdal argues that the process of migration, capital movements,
trade and other means of development retard the growth process of backward regions
through the strong backwash effects and weak spread effects that eventually slow up
the growth of the whole region or country. Migration from the backward region, for
instance, denudes that area of human capital, entrepreneurs, depress the demand for
goods and services and factors of production while the developed region experience
44

increase in the demand for goods and services, enterprise, factors of production and
economic and social infrastructures. Myrdal's description of resource transfer from
the backward areas to the developed ones works to the advantage of later and this
kind of exploitative relation holds also true to some extent in the backward hill
regions which act as resource supplier to the plain areas and remain by and large
heavily dependent of developed regions of the country. Myrdal's hypothesis also
asserts that at the initial stage migration will be selective (skilled and educated) and
later the migration will be less selective and spread effects would be stronger and
more powerful. However, this hypothesis has not been validated in the context of
backward economies. It is often observed that out-migration is not that selective in
backward economies particularly in the hill regions primarily because of the
subsistence nature of economy and low industrial base. In such economies the spread
effects remain weak even after a substantive period primarily because of the regional
specificity that perpetuates the economy to remain marginal entity in the development
process.
2. Trade Induced Development Argument
In the classical and neo-classical framework, trade was viewed as a propelling force
to development. Classical economists viewed comparative advantage is the key to
efficient resource allocation and country can enjoy higher income by specialising
production according to its comparative advantage and trading. The exports led
. growth theory further suggests that the country could even vent for surplus through
exporting raw material or primary products (staple) in which they enjoy comparative
advantage that would induce higher rates of growth and strengthen linkage effect with
other sectors and eventually enhance employment and incomes. Staple theory (along
processing) in a way is closer to Rostow's leading sector analogy, which can act as
prime mover and propelling force for the rest of economy (Meier, 1975). However,
trade theory is built upon factor price equalisation theorem and assumption of
immobility of factors of production, especially labour which instead stimulating
growth perpetuates in cumulative causation and results in inequality in the lagging
regions (Myrdal, 1957). Whilst, the backward economies with peculiar regional
specificity (e.g. hill regions) have shown strong patterns of out-migrating to lowland
areas caused primarily by the differing opportunities or amenities between the two
distinct areas and more so carried out as a coping mechanism. Though many such .
45
backward areas have certain resource advantages in terms of niche products yet the
resources cannot be used intensively due to specificity characteristics (viz,
inaccessibility, fragility and marginality) that keep the region at a disadvantaged
position. There are thus obvious limitations both in the Lewisian theory and export
led theory, which suggest venting surplus to the backward economies through
exporting labour and trade theory through exporting staple resources.
3. Industrialisation Strategy
It is argued that the b,ackward economies suffer from low equilibrium trap and to get
out from this state of underdevelopment, it is prerequisite to have 'critical minimum
efforts' and needed 'big push' in the form of planned large-scale investment, what has
been known as a doctrine of balanced growth (Rosenstein-Rodan, 1943). This theory
essentially looks the problem of underdevelopment or backwardness in terms of scale
of investment necessary to overcome indivisibility on both the supply and demand
sides. Supply side bottlenecks are lumpiness of capital that needed huge investment in
large number of activities simultaneously, which can take advantage of external
economies and demand side indivisibility refers to limitations posed by the size of
market. If numbers of activities are established simultaneously, each will provide
market for others. The theory thus recognises the indivisibility of supply side and
complementarities of demand side and emphasises to strike a balance between
different sectors of economy namely the agriculture and the industry. The theory
assumes the criticality of large-scale investment to overcome underdevelopment and
rightly so. However, it has been observed that large-scale investment does not
automatically results in employment and income generating activities as has been
postulated. in theory but often such investment in hill economies leads to ecologically
unsustainable development primarily by ignoring the regional specificity (e.g. vital
bio-physical system). The mountain specificities poses constraints on development
activities and generally not suitable for highly diversified economic structure (Papola,
1996). Infrastructure development instead in inducing the momentum of growth
create vast degradation of resources (due to excessive use) and the fact remains that
greater accessibility has helped outflow of resources (natural and human)
uninterruptedly and the gains from the development have gone mostly to the plain
areas. The complementarities of supply and demand side activities are often missing
in the hill regions primarily because lack of focus to incorporate hill specificities
46

(ecology and environment) while conceptualising and operationalising the
infrastructural development (Jodha, 1992).
4. Regional Growth Theory Argument
The regional growth theory suggest that a good resource base and locational
advantage are pre-requisite for growth process to unleash and regional growth has
been promoted typically by the ability of the region to produce goods and services
that are demanded by the national economy and outside the national economy. For
growth process to take-off it is necessary that the region must characterise by the
substantial promise for expansion of resource in relation to its demand. The demand
for the goods and services (derived from resources) must exhibit a high-income
elasticity. The other important aspect is that the resources (or goods and services)
must generate locationally forward and backward linkages in order to generate
multiplier effects and create markets. To a large extent such linkages would depend
upon how returns from the goods and services demanded by the outside region could
generate active demand for regionally produced goods and services (Perloff and
Wingo Jr, 1964). As the regional markets expand it creates condition for self
reinforcing and self-sustaining regional growth pattern. For such growth to occur, the
most critical or the prime mover for successive stages of development is strong
manufacturing base. But in the backward region and typically in hill region the
"economic relationships between the mountains and plains have been of to hinterland
- metropolis, in which the highlands served as a source of primary products (raw
material) for the mainstream, lowland economies and societies, with all the structural
and operational inequities associated with such relationships" (Jodha, 1997). Seldom
have the activities carried out based on hill products generated momentum of internal
linkages and the benefits of resources have by and large accrued to outside hill
economy. The mountain economies even after a considerable period of state
interventions with a view to promoting development activities have remained by and
large poor and the developed parts/centres of the country, unlike usual regional
growth trajectory as visualised in the early stages of development, still acts as " ....
suction pumps, pulling in more dynamic elements from the more static regions. The
remainder of the country is thus relegated to a second-class, peripheral position. It is
placed in a quasi-colonial relationship to a centre, experiencing net outflows of
people, capital and resources, most of which redound to the advantage of the centre
47
where economic growth will tend to be rapid, sustained and cumulative" (Friedman
and Alonso, 1964).
5. Agricultural Strategy
Many countries during 1960s and 1970s crafted their policies around the centrality of
Lewisian model with a view to faster development of urban industrial sector and
greater resource allocation (rather, deliberately) was made to favour the urban areas at
the cost of rural sector. As a result of overriding priority accorded to industrialisation
policy, agriculture sector received relatively smaller share of national resources. The
experiences of development planning until mid 1970's have amply shown that the
policies promoting industrialisation helped urban areas but benefits thereof did not
trickle down to the rural areas. The critiques of industrialisation strategy detected
urban bias in development strategy and this led to the formulation of alternative
strategy widely known as "agriculture first strategy" credited to Lipton (1968) and
Mellor (1976) who explained that the causes of continued rural poverty and
unemployment is due to primacy given to the capital-intensive industrialisation.
Mellor brought out to the fore the virtuous linkages of consumption and production
sides of agricultural growth and envisaged that the fast agriculture growth would in
turn produce non-farm linkages as road of rural industrialisation (Mellor, 1976;
1986). The empirical evidences suggest that the agricultural development has had
positive impact on the growth of non-farm sector through various linkage effects
(Bhalla, 1993; Papola, 1987; Unni, 1991). Punjab and Haryana are the prime
examples of such virtuous linkages where fast agricultural development led growth of
non-farm sector through ploughing back the agricultural surpluses in to the non
agriculture sector.
However, in the context of hill economy such linkages are often weak due to
subsistence nature of agriculture and other difficult agricultural conditions that hardly
produce any surplus for the market. In spite of being agriculturally backward, these
regions have certain other distinct advantages over others in terms of agro-climatic
features enabling the growth of variety of high value cash crops and enterprises based
on mountain niche products.
Such enterprise-based activities have been developed in certain parts of hilly region in
the Hindu Kush Himalayan Region based on niche products. The most widely known
example is Western Sichuan (China), where over two-dozen products have been
48

developed based on mountain specific resources. The other areas where specific
products (rather limited one) have been developed are apple cultivation in Himachal
Pradesh, vegetable farming in Garampani area in Nainital district, ginger and
pineapple in Meghalaya and other part of North Eastern states, tea plantation and
processing in Ilam district in Nepal, livestock and dairy development in areas closer
to Kathmandu and apple cultivation in Arunachal Pradesh (papola, et. aI, 2005).
In the context of hilly region, enterprise based activity can take different forms -
diversification from cereal based products to high value horticultural products to
simple processing, and other enterprise based activities such as livestock, forest (non
timber), artisan and tourism based.
There are case studies, which amply demonstrate that agricultural transformation
based on high value crops have increased food security and improved living
conditions. However, for successful transformation accessibility to wider market
network, strong R&D institutions are critical (Sharma, 1996; Sharma, 1997; Sharma
and Sharma, 1997; Tulchan, 1997; Badhani, 1998).
Himachal Pradesh is a case in point that diversified into high value crop, in particular
apples that have brought about virtuous production and consumption linkages, which
helped attain higher levels of growth of employment and income (Sharma, 2005).
This has also increased opportunities for non-farm employment (Chand, 1995).
Uttarakhand also holds considerable promise for development of horticulture and
other niche based products such as micro hydel plants, tourism and other amenity
services, minor forest products and wool processing.
6. The Rural Non-Farm Sector
It was clearly recognised that the problem of rural unemployment and
underemployment could not be solved due to inherent structural problems associated
within agriculture sector. Evidently, this sector has been characterised by low
productivity (as a consequence of large volume of labour employed), iniquitous
distribution of land and diminishing land man ratio, the provision of productive
employment to burgeoning labour force within agriculture sector was conceived a
difficult proposition. The rural non-farm sector (RNF), on the other hand, has gained
considerable significance as an alternative strategy for employment generation,
poverty reduction and higher rate of growth. The rationale for attaching importance
to the rural non-farm sector rested on the following premises. Firstly, the labour
49

absorptive capacity in agriculture sector is limited particularly in land scarce
countries. Moreover, it has been found difficult to bring about deep-rooted
redistributive land reforms (Saith, 1992). Secondly, out migration to urban areas
cannot be assumed to be capable of providing adequate livelihood opportunities for
all those unable to make living in agriculture. Also, out migration have serious
implications to both the urban areas (in terms of pressure on scarce urban
infrastructure) and rural areas (in terms of skill drain). Thirdly, expansion of rural
non-farm activities has significant spin-off effects for agricultural development.
Relatively low labour cost and low capital intensity in numerous non-farm activities
tend to have positive linkage effects to the rural economy. Finally, these activities
offer income potential during slack season and provide means to cope/survive when
farming fails (Gordon and Craig, 2001).
Empirical evidences suggest that there has been considerable deceleration of
agriculture employment growth in rural areas during the 1980's and 1990's. It
registered 0.5 per cent growth during 1983 to 1987-88 and then picked up to 2.16 per
cent during 1987-88 but again plummeted to 0.20 per cent during 1993-94 to 1999-
00. Such a catastrophic fall in the growth of agriculture employment shows inability
of this sector to absorb further labour force. However, in spite of significant decline
in agriculture employment growth, the RNF sector registered 2.0 per cent growth
during 1987-88 to 1993-94 and 2.3 per cent during 1993-94 to 1999-00. Though
employment in the non-farm activities increased, albeit marginally during 1993-94 to
1999-00 yet there has been substantial reduction in poverty (Bhalla, 1998).
The growth in rural non-agriculture employment during 1983 to 1987-88 was,
however, significantly higher (5.2 per cent) and this growth has helped absorb the
excess labour from the agriculture sector, though temporarily as a large volume of
employment was generated through construction activities as a part to cope up severe
drought situation. The proportion of rural non-agriculture employment increased from
16.6 per cent in 1977-78 to 23.8 per cent in 1999-00. The share of males increased
relatively much faster (7.2 percentage points) than the females (2.8 percentage points)
during 1977-78 to 1999-00. Activities like construction, trade and transport have
expanded while manufacturing activities stagnated. The share of employment for
males increased relatively faster in the tertiary sector while for females increase was
higher in the secondary sector. The picture across states varies significantly. States
50

like Bihar, Kerala, Assam and Himachal Pradesh have shown fast growth in later half
of the 1990's while states like Karnataka, Maharashtra and Andhra Pradesh show low
diversification (Sharma et.al, 2001).
The recent NSS round (2004-05) results, however, show significant up trends in the
employment growth of agriculture and non-agriculture sector. Agriculture sector
employment grew at about 1.7 per cent per annum during 1999-00 to 2004-05 and
non-agriculture employment recorded an all time high both in terms of share and
growth during this period. Non-agriculture sector recorded 5.7 per cent per annum
growth rate during 1999-00 to 2004-05 and its share has gone up to about 27.4 per
cent in 2004-05.
This newfound interest in the rural non-farm sector has generated a large body of
literature .from numerous regional level studies (disaggregated to state and district
levels) to village level studies identifying and analysing causes and determinants of
the growth of non-farm sector. The first set of studies mostly relied on secondary data
from NSS and Census, while village level studies utilised the field data collected from
the households. These studies were both analytical in nature using quantitative
techniques to descriptive types as well. Most of these studies have tried to disentangle
the alternative hypotheses postulated in the literature (Unni, 1991, 2000). These
hypotheses related to three major arguments put forth for the growth of rural non
farm sector namely; agriculture growth induced argument, prime movers outside
agriculture and residual sector hypothesis.
(i) Agriculture Growth Linkage Hypothesis
It was postulated that the accelerated growth of agricultural sector, consequent upon
green revolution technologies, would enhance farm productivity and income levels
that in turn would help expansion of both agriculture and non-agricultural sectors
through demand led growth. This growth would occur through consumption and
production linkages of agriculture sector with that of non-agricultural sector (Mellor,
1976, 1986). Consumption linkages emanate from the increased farm incomes that
result in increased demand for non-farm sector goods and services produced in nearby
villages and towns. Also, increased farm productivity would push the real wages
upwards and the labourers would too demand more farm and non-farm output. The
production linkages occur within agriculture sector both from input side (backward)
as well as from output side (forward). Backward linkages typically emanate from
51

agriculture to non-agriculture sector in the form of increased demand for agricultural
inputs such as farm implements and machineries etc, while the forward linkages
necessitates processing of agricultural outputs (food products, edible oils, tobacco etc)
that would spring up agro-processing units. This demand led induced growth would
promote various non-agriculture employment and incomes opportunities and would in
turn help the rural industrialisation process. This hypothesis has been empirically
validated by numerous studies (see in particular: Papola, 1987; Dev, 1990; Hazell and
Haggbladel991; Unni, 1991, 1994; Bhalla, 1993; Chadha, 1994).
(ii) Prime Movers Outside Agriculture Hypothesis
Empirical validation of agriculture led growth model recognised the importance of
other prime movers out side agriculture, which were identified as important factors
for the growth of non-farm sector and agriculture as a sole prime mover for the
growth of non-farm sector was countered (Bhalla, 1993, 1997). While the growth of
agriculture was acknowledged for the expansion of non-farm sector activities, the role
Of prime movers outside agriculture such as growth of urbanisation, infrastructure
development, rural development programmes and education and skill formation
assumed increasingly significant aspects for work force diversification. Bhalla (1993)
while analysing the district level data from the Census, argues that shift in consumer
taste in favour of urban products and agricultural inputs has had significant impact on
the growth of non-farm sector particularly in agriculturally prosperous districts. Also,
the increasing links with the urban centers provide impetus for rural workforce
diversification, particularly in corridor districts (Bhalla, 1997). Studies by Unni
(1991), Jayaraj (1994), Eapen (1995), Srivastava and Dubey (2002) have found
significant and positive influence of urbanisation in rural non-farm growth. These
urban towns also provide increasing income opportunities to rural population through
commuting (Vaidyanathan, 1986; Basant et aI, 1998).
Also, activities that generate strong linkage to the rural areas in terms of employment
and income generation to the rural population irrespective of their location seem to be
occurring important space dimension of the rural non-farm sector growth (Saith,
1992). Small towns in rural hinterland have been playing extremely important role in
creating employment and income opportunities in the non-farm sector to the nearby
villages through generating backward and forward linkages. Productivity and income
52
levels in the non-farm enterprises have been found generally higher where such towns
are more widely dispersed than concentrated in a few towns (Papola, 1992).
Rural infrastructure (particularly roads, telecommunications and electricity) is another
prime mover that has been facilitating growth of non-farm sector in terms of
providing employment and income opportunities through self-employment and wage
employment. Hazell and Haggblade (1991) underscore the importance of rural
infrastructure in enhancing the income multipliers of agriculture growth to the non
farm sector. Harris (1991) did recognise the importance of agriculture growth as a
necessary condition for the expansion of rural non-farm sector, however he observed
that it was not a sufficient condition and highlighted the need for improved rural
infrastructure. Similarly, studies by Jayaraj (1994) and Narayanmoorthy et. al. (2002)
underscores the importance of transport infrastructure in promoting rural non-farm
employment. Likewise, Shukla (1992) also observed the beneficial impact of good
roads on rural trading and non-household manufacturing activities. But then
development of roads and communications Can also result in backwash effects to the
rural economy, it may fmd easy market for cheap urban goods and thereby producing
obliterating effects to the rural traditional enterprises and lead to out-migration of
rural youth than contributing to development of local rural non-farm sector (Reardon
1999;Islam, 1997). Numerous other activities tend to agglomerate where the
infrastructure is adequate and eventually non-farm sector gets benefited (Binswanger
et. aI., 1989). Infrastructure development also helps people to access to new
opportunities through commuting nearby towns.
Education is also reckoned another important factor that influences the growth of
rural non- farm growth in villages and small rural towns (Islam, 1997; Chadha, 1997;
Lanjouw, 1999). Eapen (1994) also notes the important role of education in the
context of Kerala that helped to shift employment from farm to non-farm sector.
However job preference of the educated persons in Kerala has been towards salaried
jobs rather than self-employment (Mathew, 1995). Likewise, Jayaraj (1994), Basant
(1993) Narayanmoorthy (2002) observed the positive relationship between literacy
and rural non-farm sector employment. Also, the role of government programmes and
public expenditure in rural development programmes has been an important
contributory factor for promoting non-farm sector activities. In fact the rising public
expenditure during 1980s was the major factor for growth of non-farm sector and also
53

deceleration in non-farm employment during early 1990s was attributed to drop in
public expenditure (Ghosh, 1995; Sen, 1996, 1997).
Apart from the role of specific factors influencing the growth of non-farm sector, a
number of studies have also identified the influence of composite factors on the
expansion of non-farm activities (see in particular: Harris, 1991; Eapen, 1995;
Vaidynathan, 1994; Basant, 1993;Visaria and Basant, 1994).
(iii) Residual Hypothesis
Contrary to the broad development perspective envisaged in the structural change
thesis that is followed by prosperity induced (through urbanisation, modernisation of
agricultural growth and infrastructural development) which leads to diversified
occupational structure (Kuznets, 1966) and eventually helps increase the demand for
labour in non-agricultural sector. It is argued (McGee, 1971) that such transformation
of surplus labour from agricUlture to industry is mere a distress induced phenomenon
that ultimately gets transformed in to low productive service occupations rather than
in industry that has limited absorptive capacity. In other words the central issue in the
context of non-farm activities is whether diversification of workforce is demand
induced or merely acts as a sponge for surplus labour in the farm sector. This debate
has probably excited most discussion in the literature of non-farm sector.
The residual sector hypothesis was credited to Vaidyanathan (1986) who noted a
positive correlation between non-farm sector growth of employment and
unemployment rate and postulated that non-farm sector absorbed surplus labour from
agriculture when the absorptive capacity of farm sector and in urban areas is limited,
the non-farm sector employment acts as a sponge for growing labour force. A large
number of studies have however contested this hypothesis by empirical validation.
Evidences at macro level suggest that the earning levels in non-agriculture activities
have been significantly higher than the agricultural activities (Papola, 1992).
Evidence also suggests that productivity and wage rates in non-farm sector are
significantly higher than in the agriculture sector (Bhalla, 1998). The decade of
1980's amply show that sharp fall in poverty in rural areas (with rising real wages),
was largely due to dynamism in diversification of rural economy into non-farm
activities, despite the fact that employment growth in agriculture was the slowest
(Ghosh, 1995; Sen, 1997). The post 1987-88 scenarios (i. e. up to 1993-94) however,
show reversal of trend in this diversification process, more particularly for females
54
(Chadha, 1997). The deceleration of such diversification of workforce is largely
attributed to fiscal compression of economic reforms process (Chadha, 1997; Sen,
1998). The state wise analysis during the decade of 1970's and 1980's clearly brings
out that those states which have done fairly well in agriculture have also done better
in diversification into non-agriculture sector and thus strengthening the argument of
the virtuous linkages of farm and non-farm sector (Chadha, 1997). This thesis has
been widely accepted by other scholars like Vaidyanathan, (1986); Vyas and Mathai
(1978); Unni (1998). It is also important that a large section of workforce is engaged
in self-employed activities in the non-agricultural sector and wage rate as such does
not seem to influence the supply of workers in this segment. And it is highly unlikely
to discard the residual hypothesis on the basis of wage rates. One cannot, therefore
completely rule out the possibility of residual hypothesis in certain areas or segment
of population. Higher levels of employment in non-farm activities have been
observed to co-exist with high incidence of rural poverty in many of less developing
countries and diversification is merely transitory phenomenon associated with stress
(Seth, 1992). Although employment in terms of man-days may appear to have
increased in the non-farm sector, yet in terms of earnings, the distress seems to be
apparent (Chadha, 1994). Some of the studies found weak production inter linkages
between the farm and non-farm sectors (Dev, 1990; Unni; 1991). Some times the
distress push processes work strongly in some region (Verma, et.al, 1995). Also,
some part of the region seems to have stronger linkage effect while other part still
shows the distress-induced effects (Singh, 1994). RNF may manifest distress situation
in case of supplementary workers and who, in fact have no main occupation but
whose employment is of subsidiary nature and those who are engaged in secondary
activities (Bhalla, 1990).
(iv) Limitations of Existing Literature in the Context of Hill Economy
Available literature (see: Unni, 1998 for detailed review) suggests various alternative
positions for growth of non-agriculture sector, which analyses the relationship
between various indicators and the non-agricultural employment. But the context of
analysis in most of these studies has been restricted to the non-hill economy. The
constraints posed by the terraced type cultivation do not lend much support to the
Mellorian type of linkages for the growth of non-farm sector. Not only this, lack of
development in general raises the issues of the productivity and income of numerous
55
types of non-farm activities mushrooming. How sustainable are they? Does their
existence represent dynamism or merely involutionary growth? When agriculture and
manufacturing are at precarious situation, relatively faster growth of tertiary segment
needs a detailed probe with the help of other prime movers outside agriculture
(Bhalla, 1993). The case of the hill economy presents a typical example of rather.
unexplored and relatively less researched area. As the experts have aptly concluded
that "it is not obvious how readily the emergence of vibrant RNFE can be engineered
in a remote, agriculturally backward and sparsely populated area i.e. lack of case
examples" (World Bank, 2000). Literacy rate is comparatively much higher in the
hill areas and also share of rural non-farm employment has shown increasing trend
over the years. This line of causation seems to be undisputed as scholars have shown
that high level of education helps movement into non-farm activities (Chadha, 1997;
Lanjouw, 1999). But in the context of hill region, significantly large number of
educated persons out-migrates in search of jobs outside, such a flight of human
capital has obvious drain to local economy. Yet, in addition to level of education,
there are other factors such as caste, gender and size of land holdings that also
influence the employment opportunities in the hill areas (Lanjouw and Shariff, 1999).
II. Economic Characteristics of the Uttarakhand
Mountain economies pose specific problems and within it there exists wide diversity
and variability both in terms of resource endowments, development potential as well
as constraints. The Uttarakhand state is characterised by economic backwardness. It is
predominantly a hilly and mountainous region characterised by undulating
topography, varied climate, limited arable land and difficult agricultural conditions.
This has resulted in low economic base. The habitants are sparsely populated and
widely scattered. The declining forest cover and its environmental consequences on
land and water resources also pose serious problems. Increasing population pressure
coupled with heavy dependence on low productive agriculture, industrial
backwardness, lack of social services, inadequate infrastructure and harsh
geographical features characterise the region. Also, long gestation period of projects
and relatively higher per unit cost of infrastructure development and low returns on
investment resulted in limited income earning opportunities.
The dominant characteristics of its backwardness are closely related to its mountain
specificities viz. inaccessibility, fragility and marginality. Although, agriculture is the
56

main occupation of the people but it suffers from several inherent maladies. Land
holdings are small, fragmented and scattered. Preponderance of cultivators in tiny
size of land parcels is most common barring tarai region---Dehradun, Udham Singh
Nagar and Hardwar districts. Marginal holdings account for about 70 per cent and
small holding 18 per cent of total holdings in the state. Irrigation facilities are very
low and agriculture is mainly rainfed. Net irrigated area as a percentage of net
cropped area in the state is 44 per cent in 2005 and there is a wide variation between
hill and non-hill districts. Out of this hill area has only about 10 per cent. Share in
total irrigated area in the hills is about 12 per cent while for the plains it is 88 per
cent. Net sown area as per cent of total reported area has marginally increased from
13.2 per cent in 1982-83 to 13.5 per cent in 2004-05. If the plain districts in the state
are excluded the percentage dips down to 10 per cent. Traditional agriculture
practices are predominant and hardly any drastic changes can be made due to several
constraints. Use of fertilizer consumption is abysmally low (2 per cent) in the hill
districts while four plain districts use 98 per cent of total fertilizer consumption. This
has resulted in low productivity and low returns from agricultural crops. All these
factors lead to limited food availability hence the food insecurity that is common
feature in many parts of the hill districts in the state (IDFC, 2002). Agriculture is
primary occupation of the people but the specificities of land use pattern differ
considerably from place to place. For instance, in the higher altitude agro-pastoralism
is dominant while on. the lower altitude settled agriculture on terrace slope is
practiced. In the valleys intensive agriCUlture is widely prevalent (Farooque and
Rawat, 1997). These factors greatly influence the production, consumption and
livelihood patterns. The other components of agriculture are livestock production and
horticulture. The livestock is central to agricultural development as it provides
draught power for cultivation, milk, meat, wool, skin etc. Livestock increased
marginally during 1983-98 with decline in the growth of sheep, cattle population and
relatively high growth of poultry, and buffalo population. The proportion of scrub
cattle population is large in the livestock population. The quality of cattle is generally
poor with low productivity. There is demand for improved variety of livestock but
lack of good feed supplies, poor marketing and infrastructure for animal has
hampered the livestock growth on commercial lines. Also, over the years pressure on
land has resulted degradation of pastures and erosion of common grazing land.
57

· Horticulture (fruits and vegetables) has potential for high returns but technological
and other constraints have severely restricted the scope of expansion. The agriculture
is largely traditional with little diversification to potential areas according to its land
capability (Shah, 1996). The manufacturing base is very low, large industries are
almost non-existent and the share of employment in manufacturing sector is very low
(2.5 per cent) in the hilly districts. Household manufacturing base, in particular, is
observed to be disappearing fast. The shift of workforce from primary to the tertiary
sector largely constitutes the proliferation of 'other services', which comprises of
government activities rather than the growth of trade, transport, storage and
commerce. While in general there has been substantial inter-sectoral movement of
workforce from agriculture to other sectors of economy but in value terms the level of
development in manufacturing, services and industrialisation has been negative for all
hilly districts in Uttarakhand and their relative ranking is in the bottom rung of 369
districts in the country chosen for study by S.C. Gulati (quoted in Bora, 2000). Per
capita NDDP in the plain districts is generally higher (higher than the state average)
compared to the hill districts. The various i~icators of development in the state show
the low levels of development with marked inter district disparities. The plain
districts (namely Dehradun and Udham Singh Nagar and Hardwar) are relatively
better off than other hilly districts in the state (Annexure III.l).
Lack of productive employment has forced people to seek multiple livelihood
strategies as the main coping mechanism to meet increasing food and cash
requirements. Unemployment among adult males has led to large-scale out-migration
in search of livelihood and employment. The migrants in tum have been supporting
back their families through remittance;· this phenomenon is sometimes termed as
'money order economy'. This movement of people from the region is closely related
to its backwardness. In all hilly districts of the state out migration exceeds
immigration. Micro level studies also show high rate of out migration particularly
among educated youth. By and large push factors motivated to a large number of
migrants (70 per cent) and pull factors did so for smaller magnitude (19 per cent).
Also, the region suffers net loss due to out migration (Bora, 1996). Not only has this,
the. consequence of migration of able-bodied men thus putting drain to human
resources but also entailing enormous burden on the women. The hill women perform
all activities except ploughing and their workload and drudgery is extra ordinary.
58

They work about 14 to 16 hours per day (Planning Commission, 1985). Surprisingly,
backwardness exists in tandem with high literacy rate. As per 2001 Census, literacy·
rate in Uttarakhand has increased to 72.3 per cent (84 per cent for males and 60.3 per
cent for females). Higher literacy rate further accentuates the out migration process.
This drain of educated youth is primarily due to low productive base of the economy.
Also, in the hill region caste relation plays an important role in determining the level
of education and livelihood. Labour relation and caste linkages greatly influence the
employment and earnings. The development interventions since the Fifth Five Year
Plan, when special hill area development programme was initiated, have been in the
nature of the general strategy of development. Never the development of hill area was
conceived in terms of formulation of region specific development strategy (Papola,
1983). This has produced undesirable socio-economic and cultural results in the state.
Planners and policy makers often failed to understand the hill specificities that have
resulted in adverse impact on the carrying capacity of the system. A fast growing
contractor-business class regime has exploited the forest and mineral wealth
indiscriminately. Development administration has been insensitive to the needs of the
people. The people's movements (e.g. chipko movement and separate hill state) were
the clear manifestation of the neglect of aspiration of the people and the sustainable
development ofthe hill economy (Joshi, 1995, 1999).
From the long-term development perspective, agriculture field crops have limited
scope for increased productivity, employment and incomes due to limitation posed by
the hill agriculture. However, the region offers potentials for development in view of
its specific resource endowments and relative advantages such as forest wealth, water
resources, tourist amenities services, mineral resources and cultivation of high value
non-food crops (fruits, vegetables, seeds, medicinal plants, exotic flowers, mushroom,
etc.). There has been considerable increase in the growth of area under fruits and
vegetables over the years. Production of vegetables increased from 508 MT to 692
MT, vegetables increased from 388 MT to 461 MT during 1996-97 to 2005-06. There
are studies, which show that in Himachal Pradesh, which presents a similar case of
hill region, diversified into vegetables and fruit cultivation and have attained higher
levels of growth of employment and income. This has also increased opportunities for
non-farm employment (Chand, 1995). Uttarakhand also hold considerable promise
for development of horticulture. Area study in Uttarakhand also shows that incomes
59

as well as employment are much higher in the case of vegetable crops than
conventional crops. Commercialisation of agriculture also tends to check out
migration (Badhani, 1998). Another area study (Chand, 1996) shows that how
irrigation is critical factor for high payoff off-season vegetable crop that have been
proved highly remunerative than traditional crops. Another area where there is a large
scope of development is animal husbandry and rearing sheep and goats for woollen
products. This is primarily because of large land area under· forest and pastures.
Forest is most important resource in Uttarakhand. Forest area covers 61 per cent of
the reported area in 2004-05. It produces wealth of forest produce including minor
forest produce. It contributes quite significantly to the earnings of the state
government. Most of the benefits of this resource in the past have, however, gone to
the plain area. As it is well known that the timber is taken out from the hill region in
unprocessed form and the real value addition occurs in the plain areas and there is a
small fraction of it accrues to local people in the form of wage component (Joshi,
2001).
There were 809 khadi udhyog / gramodhyog units and 32,116 SSI units employing
4,987 and 87279 persons respectively during 2006-07. There are 752 factories
registered under Factories Act employing 51,762 persons in 2004-05. Industrial
sickness is quite high as more than 36 per cent units are closed involving 22.7 per
cent of industrial employment. Government has taken series of measures to revive
and rehabilitate the sick units (Government ofUttarakhand, 2003). The major small
scale industries in Uttarakhand are Khadi, handicrafts, handloom fabrics and food
products. Industrial activity is highly skewed in the state of Uttarakhand. Most of the
industrial activities are concentrated in the plains and hills are bereft from
industrialization. Dehradun, Hardwar, Nainital and Udham Singh Nagar have about
89 per cent of the factories set up in Uttarakhand and 94 per cent of all the employed
in the state (Mittal et.al, 2008) .
Integrated Industrial Development Policy 2008 was launched in February especially
for the industrial development of hilly and remote areas in the state. While Nainital
and Dehradun ranked among the top 15 industrially developed districts in erstwhile
Uttar Pradesh, four districts, namely, Chamoli, Pithoragarh, Uttarkashi and Almora,
were among the 15 industrially most backward districts in that state (Singh, 1997).
60

Industrial activities are concentrated in plain districts namely Udham Singh Nagar,
Hardwar, Nainital and Dehradun. These districts have about 89 per cent of the
factories set up in the state. Also, vast majority of workers (94 per cent) are employed
in the plains.
Hill districts offer vast potential for development of tourism industry. In 2007 alone
221.54 lakh domestic tourists and 1.06 lakh foreign tourists visited in Uttarakhand
and it is one of the key GDP drivers. The region offers unique environment for various
types of pollution free and precision-based enterprises (e.g. electronics) and amenities
services like hotels, resorts and tourism and offers vast scope for promoting new concepts
of tourism. The region is rich in water resources with a niche for the generation of
hydro-electricity. However, about 11.0 per cent potential has been harnessed
presently, as against estimated potential of 25,450 MW power generations. The
region can utilise this huge potential to meet the growing domestic power needs and
export the surplus to other states. This can be one of the important sources of revenue
generation. Development of micro and mini projects would be environmentally most
appropriate to utilise water resources. With greater involvement of private sector the
resources can be utilised most efficiently and optimally.
All these activities have considerable prospects for providing sustainable livelihood.
As the hill economy gets diversified and commercialised, the employment and
income would be enhanced within area or at commuting distance, thereby reducing
forced migration.
III. Rural Non-Farm Employment in Uttarakhand
Uttarakhand now comprises of thirteen districts (seven in Garhwal region and six in
Kumaon region)". The total popUlation in 2001 is 84.79 lakh comprising of 43.16
lakh males (or 50.9 per cent) and 41.63 lakh females (or 49.1 per cent). Annual
growth of population declined from 2.2 per cent during 1971-81 to 1.8 per cent during
1991-2001. Workforce participation (main workers) in 1981 was 36.19 per cent
(47.69 per cent males and 24.20 per cent females), which declined marginally to
35.17 per cent in 1991 (47.33 per cent males and 22.19 per cent females). This
proportion has declined sharply to 27.96 per cent (37.08 per cent males and 18.68 per
*Garhwal region consists of Chamoli, Rudraprayag, Dehradun, Garhwal, Tehri Garhwal, Uttarkashi and Hardwar districts and Kumaon region consists of Almora, Bageshwar, Nainital, Udham Singh Nagar, Pithoragarh and Champawat districts. Hardwar district has been added and remaining twelve districts have been carved out from erstwhile eight districts.
61
cent females) in 2001. The main and marginal workers together show that there has
been a steep increase in the percentage of marginal workers in population in the
1990s. Percentage of marginal workers almost doubled from 4.8 per cent in 1991 to
10.51 per cent in 2001 in the state. Gender-wise, the WPR of male (marginal)
workers increased by more than five times (from 1.5 per cent to 8.8 per cent) during
the period 1991-2001. The share of female population as marginal workers is still
very high as compared to their male counterparts, which also increased by about 4
percentage points during the decade, 1991-2001 (Table 3.1). As per census the share
of the agricultural and allied sector in employment (main workers) in the state
decreased from 71 per cent in 1981 to 67 per cent in 1991 and further to 55 per cent
in 2001. The share of the secondary sector employment declined marginally from 8.8
per cent in 1981 to 8 per cent in 1991 and 13.3 per cent in 2001 (Table 3.2). Almost
entire shift in employment from the primary sector, particularly in 1980s has been
absorbed by the services sector in the state, which accounted for one-fourth of
employment in the state in 1991. In 2001 there has been relatively faster
diversification of workforce from agriculture sector. Surprisingly, share of rural
women workforce in agriculture is highest (cultivators+agriculture
labourers+livestock, fishing etc.). Their share was 97.94 per cent in 1971, 97.77 per
cent in 1981 and 96.74 per cent in 1991 and 92 per cent in 2001---a decline of 1.2
percentage points during 20 years (1971-1991) is a case of structural stagnation. Their
high participation in agricultural activities does manifests to their low productivity
and increasing vulnerability.
A noteworthy feature, however, is that the pace of diversification of rural workforce
from agriculture to non-agriculture has accelerated in the 1990s, as there has been a
decline by 5.4 percentage points (excluding Hardwar) during the decade 1991-2001
(Tables 3.2 and 3.4). Across districts, the share of rural non-farm employment is
substantially higher in three districts namely, Dehradun (51 per cent), Hardwar (42.6
per cent) and Nainital (32 per cent), whereas in the remaining districts, it ranges
between 18 to 30 per cent, the larger share of rural non-farm employment being
mainly in construction, trade and government services. This wide variation in the
share of rural non-farm employment (sector-wise) among the districts is mainly due
to their urban base--the three districts with highest share of rural non-farm
employment have highest degree of urbanization in the state, which provide
62

employment opportunities to the rural workforce mainly through commuting daily to
nearby urban centers (Table 3.4). The NSS data do not show any remarkable changes
in the structure of employment in rural areas, as there has been hardly any significant
decline (about 3.9 percentage points) in the share of agriculture in employment during
the past 18 years, i.e. 1987-88 to 2004-05. Construction is a dominant activity in rural
areas as it employed about 6.10 per cent of the rural workforce in the state. 'Public
services are the next largest employer accounting for about 5.0 per cent share in rural
employment (Table 3.3). What also emerges that whatever has been the degree of
structural changes in employment, it has been limited to male workers, and more so
among the rural males (Awasthi, et.al., 2005).
As per Economic Census (1998), there are about 2.05 lakh non-farm enterprises in the
state comprising 1.43 lakh own account enterprises and 0.62 lakh establishments.
About 58 per cent of these units (56 per cent own account and 62 establishments) are
concentrated in 3 plain districts (Dehradun, Nainital and Hardwar), and over 91 per
cent of registered units are located in these districts, which are agriculturally and
industrially well endowed (Table 3.5). Most of the units in these districts are located
in the urban areas (78 per cent). These districts are well developed in terms of
infrastructure, connectivity, market links and urbanization, which helped relatively
faster growth of non-farm enterprises while hill districts are at disadvantaged position
due to its peculiar geographical settings that impede the growth of these enterprises.
The proportion of these units in the hill districts is as low as 3.6 per cent in Uttarkashi
to 11 per cent in Pithoragarh district while the plain district the share ranges from16
per cent in Dehradun to 22 per cent in Nainital (Table 3.5). The pattern of change
between the period 1990 and 1998 shows that these units (both own account as well
as establishments) are declining in Dehradun and NainitaI (rural and urban) and
increasing in Hardwar district while urban areas in all hill districts show increase
consistently and with marginal decline in rural areas in 3 districts (Chamoli, Pauri
Garhwal and Pithoragarh). The concentration of own account units in the rural areas·
of hill districts is declining .( except marginal increase of 1 per cent in Uttarkashi)
probably because of various constraints being faced by these units both from supply
and demand side (Table 3.6). Sectoral distribution of non-farm enterprises show that
trade & commerce (45 per cent) and services (28 per cent) dominated in the state but
63

more than half of the manufacturing (51 per cent), trade & commerce (63 per cent),
and services enterprises (58 per cent) are concentrated in 3 plain districts (Table 3.7).
Quick results of Fifth Economic Census (2005) shows that total non-farm enterprises
increased from 2.05 lakh in 1998 to about 2.92 lakh units in 2005. Three plain
districts (namely, Hardwar, Dehradun and Udham Singh Nagar) account for about 43
per cent of non-farm enterprises providing 52 per cent employment.
1. Typology of Rural Non-farm Activities
Conceptually, rural non-farm sector constitutes a large number of activities out side
agriculture sector (crop cultivation) such as auxiliary, off-farm activities, rural
industrial sector, services and non-agricultural labour in creation of public
infrastructure (Saith, 1992). Such a broader definition of rural non-farm sector
encompassing all non-agricultural activities excluding crop husbandry is desirable, as
this would capture all aspects of rural diversification (Papola and Sharma, 2005). In
rural non-farm sector, self-employment is the dominant category and regular and
wage employment in the public or government sector is minuscule and is likely to
shrink further and therefore a large part of employment has necessarily to come in the
form of self-employment and casual employment from the unorganised sector.
Enterprises are the main source of employment creation that consists of variety of
household and non-household activities in rural setting. Heterogeneity is widespread
in rural enterprises in terms of capital use, product groups, productivity and
production relations. The duality within enterprises is often discernible; a large
number of enterprises have linkages to local economy using locally available raw
material, traditional skills and low degree of technology and a substantial part of
output is meant for final consumption in the local economy. Such enterprises use
mostly family labour with little surplus and majority of them are operating at low
margin of subsistence. Seasonal enterprises, artisan based and caste-based enterprises
fall in this category. Without technological improvements, skiII development and
product diversification the existing traditional household and tiny/small units would
gradually obliterate and liquidate (Islam, 1987). The other types of enterprises are
those that use improved technology, hired labourers, and have linkages outside the
local economy. Such enterprises are operating more or less on stable basis with
surplus as a prime motive for growth of enterprises. These enterprises have been
providing most of the employment outside agriculture to the rural population either
64

on regular basis or seasonal basis. However, many of these enterprises face numerous
structural problems that make them increasingly difficult to compete and survive in a
competitive environment. There is need to look in to the problems of these enterprises
both from the supply as well as demand side and make the policy environment
conducive for the growth of these enterprises. Notwithstanding, in a changed
economic environment, most of the employment is likely to be generated in small and
micro enterprises in the unorganized sector and it is therefore critical to promote such
enterprise through formulating appropriate strategies and policies to overcome them.
As discussed in the preceding section that the Uttarakhand (hill districts) is
characterised by the subsistence agriculture and any drastic transformation within
cereal-based agriculture has obvious limitations to provide employment and income
opportunities due to the problems associated with hill agriculture. In any case
traditional agriculture with its low productive base and increasing pressure of
population on limited cultivable land does not seem to be viable and sustainable
option for providing employment and livelihood any longer. Also, the industrial base
is precarious in the hill districts and that does not offer much scope for sustained
employment and incomes. Large-scale industrial activity is neither possible nor
desirable in view of ecological and environmental considerations. Wherever such
activities have been undertaken it has had disastrous effects to the ecology and
environment and greater human sufferings (e.g. mine extracting activities and
construction of large dams). It is therefore important that any activity chosen for
development has necessarily to take in to consideration its impact on ecology and
environment on the one hand and sustainability of activities in terms of providing
employment and incomes to the local population on the other. Also, due to the
mountain specificities only certain kinds of activities can be considered for promotion
based on niche resources or comparative advantage in the area concerned. Such
activities could be developed and specialised through commercialization and trade
(Papola, 1996).
(i) Enterprise Based Activities
Enterprise based activities are critical for sustainable employment generation and
enhancing income levels which in tum can help improving the living standard of
people. Owing to typical hill specificities (inaccessibility, fragility and marginality),
limited and thinly spread resource base, lack of infrastructural facilities, distant
65

markets, low entrepreneurial base, lack of appropriate policy support severely
constrict enterprise-based activities, particularly in the hilly region. Also, ecological
and environmental considerations pose severe limitations to the large-scale enterprise
development. As result, entrepreneurial activity is mostly concentrated in the plain
districts, which do not have many handicaps that are usually associated with the hilly
region. Though the hill region possesses certain mountain specific resources, which
have potential to be developed as niche products having comparative advantage to the
region yet there are not many examples of harnessing these unique resources in to
tradable products and services for the wider markets. Traditionally, hill districts have
developed numerous tiny and household based activities utilising locally available
resources and skills, mostly for sub serving the needs of local economy through trade
and exchange under mutual obligation system but very little meant for external trade.
This kind of enterprise-based activities has, however limited product lines, carried out
on a small scale with little surplus for reinvestment. But over the years these
enterprises are languishing and operating at a low equilibrium trap with little product
diversification and surplus. The major reasons for sickness of these enterprises can be
attributed to both the supply and demand side aspects. Supply side constraints are
related to lack of credit, training, market support, availability of appropriate
technology, power, shrinking local resource base, and other structural bottleneck.
While demand side constraints are typically. related to lack of product
competitiveness (hence low internal and external demand), increasing competition in
the product market from the plain areas, limited linkages and integration to other
directly productive segments of economy etc.
In the context of hilly region, enterprise based activity can take different forms -
diversification from cereal based products to high value horticultural products to
simple processing, and other enterprise based activities such as livestock, forest (non
timber), artisan and tourism based.
(a)Natural resource based enterprises
The amount of land available for cultivation in the state, particularly in the hill
districts is very limited, as it constitutes only 12.4 per cent of the total reported area
with significant variation in the land utilisation pattern between the hill and plain
districts. The plain districts (Hardwar and Udham Singh Nagar) have as high as 53
per cent of net sown area while the hill districts have as lowest as 3.7 per cent in
66
Uttarkashi district. Per capita availability agricultural land is quite low in the state
(0.09 hectare as compared to 0.17 hectare in India during the year 2000). Also, lack
of irrigation hinders the use of improved agricultural practices such as high yielding
varieties of seeds and use of fertilizers and pesticides resulting in very low
agricultural productivity in hill districts. This, in turn, imposes severe limitations on
the part of state to meet its food requirements for increasing population resulting
persistent food deficits in all the hill district barring Nainital (IDFC, 2002). It is
therefore important from the long-term perspective to diversify the cereal crop based
activities to high value horticultural crops (fruits, vegetables and medicinal plants) for
which the state has comparative advantage. Harnessing the niche based farming
products can eventually help to achieve food security through direct use of products
or trade in such products (Jodha, 1992). Developing such high payoff activities
would have positive impact on livelihood security and also on the ecology without
degrading resources .. There are case studies, which amply demonstrate that
agricultural transformation based on high value crops have increased food security
and improved living conditions. However, for successful transformation accessibility
to wider market network, strong R&D institutions are critical (Sharma, 1996; Sharma,
1997; Sharma and Sharma, 1997; Tulchan, 1997; Badhani, 1998). Such
diversification has helped restrict out migration (Badhani, 1998). It is observed that
income accrual from the sale of primary products (horticultural) is generally very low
due to lack of processing and value addition activities in the region. The major
reasons for lack of enterprise activities are the small scale and dispersed production,
lack of transport and institutional mechanism that does not allow processing to be
viable in the region. However, with appropriate policy interventions it is possible to
develop enterprise-based activities that would provide higher income through
processing and value addition and help develop upstream and down stream linkages
necessary to generate internal momentum of growth. Such enterprise-based activities
have been developed in certain parts of hilly region iIi the Hindu Kush Himalayan
Region based on niche products. The most widely known example is Western
Sichuan (China), where over two-dozen products have been developed based on
mountain specific resources. The other areas where specific products (rather limited
one) have been developed are apple cultivation in Himachal Pradesh, vegetable
farming in Garampani area in Nainital district, ginger and pineapple in Meghalaya
67

and other part of North Eastern states, tea plantation and processing in Ilam district in
Nepal, livestock and dairy development in areas closer to Kathmandu and apple
cultivation in Arunachal Pradesh (papola, et. aI, 2005).
Though area under commercial crops in the state is comparatively low (one fifth of
net cropped area) yet there has been significant growth in the area and production of
vegetables, particularly potato crop. Fruit crops production has also increased albeit
lower than the vegetable crops. It has been found that the average yield of fruit and
vegetable crops is comparatively higher than that of the traditional food grain crops,
which has witnessed an increasing trend over the years. However, lack of processing
and enterprise based activities within hill districts, the benefits largely accrued to the
enterprises in the plain areas. The hilly districts, therefore act as a supplier of the
primary products and the benefits thereof redound to the advantage of the plain areas,
where processing takes place.
The experience of Himachal Pradesh with a similar land holdings pattern shows that
how agriculture could be made more remunerative through diversification in to
horticulture crops and can create more employment and better income opportunities -
- clearly a lesson to be learned.
In addition, there are other products based on natural resources such as flowers,
medicinal plants, herbs, tea, mushroom, bamboo based products, honey, spices, and
minor forest produce etc. which can be promoted and developed for wider market.
Value addition through processing can enhance income levels of the people but it
would require input support of various kinds in an integrated manner.
(b)Livestock based enterprises
Livestock is central to crop based activities as it helps in numerous ways: provides
draught power for ploughing the field, milk and milk products, meat, skin, hides and
wool. Livestock activities form an important supplementary source of income
particularly to the poor household. It acts as an insurance against vulnerability to the
poor particularly when crop fails or entitlements are lost or severely eroded. Some of
the livestock activities form the basis of enterprises in the hill districts such as animal
rearing, dairying, wool and woollen based products etc. However, most of the
activities suffer from numerous handicaps: demand constraints, access to market,
quality, lack of linkages and other support services. Enlargement of value of products
by moving up the wider market with higher quality and higher unit value remains the
68

major problem for the enterprise development. It has been observed that some of the
traditional enterprises such as wool-based enterprises are languishing primarily
because of increasing competition from the plain areas and apathy of government
agencies to promote these activities. However, there is good scope for promoting
some of these activities, particularly having distinct advantage for external trade (viz.
woolen products) while others can create increasing market for local economy (viz.
dairying products).
(c) Traditional skill based enterprises
Many traditional skill-based activities have come up autonomously over time in the
hill region that formed central to their subsistence economy. Some skills developed in
view of availability of forest based resources (viz. rope making, broom making, wood
products etc) and some skills are based on livestock resources (viz. manufacture of
woolen products, tannery) while some are based on jajmani system (black smithy,
tailoring, and priest services, ploughing etc.) and in some cases handicrafts products.
However, some of these traditional skills have either vanished or gradually
disappearing or languishing due to various reasons. There is an urgent need to revive
them through promotional and support mechanism. Some of the products have the
potential for meeting the demand of higher echelons and cater to niche market (viz.
handicrafts).
(d)Tourism and amenities based enterprises
The hiIIy region offers unique environment for various types of pollution free and
precision-based enterprises (e.g. electronics) and amenities services like hotels,
resorts and tourism. There is vast scope for promoting new concepts of tourism like
pilgrimage tourism, health tourism, wildlife tourism, cultural tourism and trekking,
adventure sports, river rafting, skiing, angling and aero sports, winter sports etc.
Tourism and amenities services assume one of the main economic drivers and lead
sectors for many hilI economies that contribute substantively to their GDP. It
contributes not only directly (tourist flow) but also indirectly through developing and
supporting many tourist related activities (e.g. vegetable production, poultry raising,
handicrafts etc). Though income originating from tourism has been impressive over
the years yet the gain from it has been minimal to the local economy due to low
retention capacity of this income. This is primarily due to little linkages generated by
t'ourism industry to the local production base as a result large part of income flows
69

outside the local economy for procuring goods and services. It is often argued that the
tourism industries in the mountain economies generate considerable leakages rather
than strengthening linkages (Sharma, 2000).
Obviously, there are constraints in promoting the enterprises in the hilly region,
where resources are limited and dispersed (with low possibility of resource use
intensification), limited access to market, inputs, infrastructural bottlenecks and lack
of appropriate institutional mechanism and suitable policy environment to support
enterprise based activities (papola et aI, 2005). However, there is immense potential
for enterprise development in the hilly region based on niche products in which the
region possesses the comparative advantages. There is therefore a need for according
high priority for enterprise development and creating a favourable economic and
conducive policy environment in the region keeping in view constraints and
potentials (hill perspective) while formulating enterprise development policy.
2. Nature of Linkages
Most of the household based enterprises are linked to limited local economy, drawing
upon local resources and skills and catering to the needs of local economy with little
or no surplus for expansion and productivity improvement. These are related to
manufacturing agricultural implements, collection of forest products, construction of
houses etc. In away, they are subsisting' at a low level of margin and with little or no
possibilities of further employment and income in the existing scale of operation.
Though some activities are linked beyond local economy and have potential for
increased employment and incomes such as woolen products, handicrafts and
furniture etc. yet due to lack of technological improvements, product diversification
and market support, most of these activities confront from numerous handicaps.
There are some activities, which have social linkages to certain social classes under
jajmani system (mutual obligation). For example, scheduled caste households
manufacture agricultural implements and provide certain services (ploughing) to
upper castes households (Brahmin and Khastriya) in lieu of fixed quantity of food
grains and this system has been providing social security to lower social group
(SCs) since very long time, however, this system has significantly eroded over the
years. In certain areas numbers of new products are coming up based on local
resources having distinct locational advantages such as medicinal plants, herbs, seeds,
floriculture, mushrooms, fruits and off-season vegetables that have linkages to wider
70

markets outside the local economy. These resources can be promoted as enterprise
based activities that would provide greater value additions and employment
opportunities. Linking these specialised products with urban market and
strengthening rural-urban linkages through greater infrastructural development and
communication and market network would help these enterprises to forge linkages for
sustained growth. Tourism is yet another important industry that can be promoted
through introducing new concepts and greater linkages to the production segments
and other services that impinge directly to the expansion of tourism related activities.
These mountain products have immense potential for employment and income
generation through enterprise development.
IV. Need for the Study
It is widely known that rural households and individuals derive their incomes from
diverse and multiple sources of activities and often-large official surveys provide
little or no information about the informal nature of activities, in particular secondary
sources of employment and incomes. Yet, understanding this complexity is so
important and so central to comprehend the extremely complex and heterogeneous
character of this sector. In view of certain limitations of the aggregative nature of
data provided by the census and the NSS, it is necessary to supplement by carrying
out micro level studies in order to capture the nuances and dynamics of various non
farm sector activities so as to have a fuller picture and better perspective. Though the
regional aggregate data helps to understand the macro evidences yet it does not help
understanding the micro realities and processes involved by which individual
households diversifies activities (Dnni, 2000). In particular, these aggregate sources
of data do not capture the following aspects of the nature of study being proposed
(Vaidyanathan, 1997).
(i) Employment conditions across different social class, their educational! training background and incomes.
(ii) Linkages between farm and non-farm activities.
(iii) Migration pattern (seasonal or long- term) among different social groups and its impact on the place of migration and analyse the motivational factors for migration
(iv) Identification of activities having prospects of becoming lead sector in view of the resource base.
71

(v) Impact assessment and the role of various government policies/programmes in generating employment and skill base.
V. Objectives
Within the above broad framework, the study attempts to understand the nature,
growth and pattern of employment. In particular, the study focuses on non-farm
activities. The specific objectives of the study are as follows:
(i) To study the livelihood diversities and income patterns ofthe people in the farm and non-farm sector by gender, social groups and educational levels across spatial entities.
(ii) To understand the nature and trends of occupational diversification of workforce.
(iii) To analyse the pattern of non-farm employment and incomes by household features and its linkages with rural enterprises.
(iv) To analyse the migration flows, remittance patterns and linkages among different social groups.
(v) To analyse policy implications and evolve development strategies in the
perspective of hill economy.
VI. Hypotheses
(i) Small parcels of land holdings with ecologically fragile region offer limited potential for labour absorption in field crops for a growing labour force.
(ii) Diversification of agriculture into high value horticultural crops and development of other potential segments promotes employment and incomes of the people.
(iii) Growth of diversified non-farm sector restricts out migration and stop drain of human resources from the hill economy.
(iv) Relatively higher share of workforce in non-farm sector in Uttarakhand translates into higher income levels at household/region levels.
(v) Education and skill development among males and females are linked to disparities in employment opportunities in non-farm sector.
VII. Methodology
The study is mainly based on primary survey, however, some important sources of
secondary data have been used from NSSO and Census to supplement the primary
72
sources of data. Findings of the NSS and Census have been put together and are
presented in Chapter IV.
In all, 40 villages and 400 households have been selected across 4 hill districts and 8
development blocks for detailed investigations.
(i) Sampling
The Uttarakhand State has two administrative regions -- the Kumaon region with six
districts and the Garhwal region with seven districts. In both the regions four hill
districts has been chosen --- two hill districts in each region namely Almora and
Pithoragarh in Kumaon region and Tehri Garhwal and Uttarkashi in Garhwal region
(Annexure III.2). Districts having entire or substantial area falling in the plain areas
have not been considered since they do not reflect the distinct features of the hill
economy. The rationale for selection of districts is based on the following variables.
* Percentage of rural non-farm workers to total workforce * Percentage of urban population to total population * Area under non food crops * Percentage of area under horticulture
(a) Selection of district
All the districts have been ranked separately in each region based on their relative
share in the above variables. In each region two districts have been chosen -- one with
the highest value of composite index and another with the lowest value of composite
index· .
(b)Selection of blocks
Similarly, in each selected district all the blocks falling in the district are ranked using
the above variables. Again, one block with highest value of composite index and
another block with the lowest value of composite index have been selected.
© Selection of villages
All the villages in the selected blocks have been stratified on the basis of distance
criteria from the block he~dquarters. Villages have been selected nearer to the block
(up to 5 Kms.), middle distant villages (More than 5 Kms. but up to 15 Kms.) and
very far off villages (More than 15 Kms.). In each block 5 villages have been selected
Actual value-minimum value/maximum value-minimum value. The formula applied gave scale-free values for each of the variable. Composite index was derived by taking the average value of the index of the four variables.
73

drawing 2 villages each from middle distant and very far-off villages and 1 village
from nearer to the block in order to capture nuances of village economies. In all 40
villages has been selected spread over 8 developmental blocks.
(d) Selection o/households
In each village, 10 households have been chosen following stratified random
sampling procedure. First, list of household in a village has been stratified on the
basis of social groups and then all the social groups have been proportionately
represented in the sampling frame. In the hill area, number of households in a village
generally is smaller and thinly spread over and 10 households in every village form
about 20 to 30 per cent.
(ii) Survey Tools
The primary data has been collected through structurally designed questionnaires
(household, village schedule and enterprise survey) eliciting information on various
aspects of household economy, village economy and about enterprises. Household
questionnaire covered information on household particulars such as age, education
level, occupation (principal and subsidiary), employment status, migrant status etc.
Particulars on land and other productive assets have been also collected that has
profound impact on the livelihoods pattern of rural population. Employment pattern
and income from agriculture and animal husbandry has also been gathered. Migration
is important phenomenon in the hill region 'of the state and a large number of people
out-migrate in search of livelihoods for varying length and durations. Information has
been collected on migratory patterns and its implications on the region. Apart from
this, information has also been collected on the different segments of non-farm
employment. Special survey on rural enterprises has also been conducted in order to
understand the nature and types of enterprises, employment, incomes and their
linkages to the local economy. Information about villages in terms of various social
and economic infrastructure and amenities has been collected through village
schedule in order to comprehend diversities in village economies (Annexure III.3).
Focus group. discussions (FGD) technique was also used to generate a profile of
people's perceptions. One village from each block was selected for FGD. FGD was
carried out in 8 villages which were randomly selected. The discussions were
designed to elicit responses pertaining to the villagers perceptions of livelihood
74

issues-the assets, vulnerability, peoples' perceptions for improvement in access to
livelihoods and employment opportunities available (Annexure IX. 1 ). Also,
participatory rural appraisal (PRA) exercise was also undertaken in selected villages
through social mapping and wealth ranking in order to understand the physical
characteristics and socio-economic conditions of the community (Annexure IX.2).
(iii) Analytical Tools
Most of the results are presented in the form of bi-variate and multi-variate tables.
Compound annual growth (CAG) and coefficient of variation (CV) have been used to
show the trend and variations over time. CAG is used for calculating an annual
growth rate whose value fluctuates widely from one period to the next. While the
coefficient of variation represents the ratio of the standard deviation to the mean and
it is a useful statistic for comparing the degree of variation from one data series to
another, even if the means are drastically different from each other.
CAG: A= P (1 - rIlOO) n
Where; A=Value after n years; P=Initial value; r =Rate of growth; n =Number of
years.
CV: The CV expresses the variation as a Percentage of the mean, and is calculated as follows: CV% = (cr /I!)* 100
where; (j = standard deviation; I! = arithmetic mean
(iv) Models
In order to show causality, between some variables and stated objectives, multiple
regressions and logistic models have been used. The purpose of multiple regressions
is to establish the relationship between several independent or predictor variables and
a dependent or criterion variable. While logistic regression model is used for
prediction of the probability of occurrence of an event that makes use of several
predictor variables that may be either numerical or categories.
(i) Multiple Regression Model
Multiple regressions are fitted in order to compute extent of causality between
household income and non-farm employment along with other controlling factors.
The model uses ordinary least square (OLS) method.
75

y = Po+ PIXI + P2X2 + ............. + PkXk+ Jl
where; y is the dependent variable (monthly per capita income MPCI)
XI,X2, ........ Xk are the k independent variables and
PI, P2,... . Pk are the corresponding regression coefficients.
Po is the constant term.
Values of 13 coefficients of multiple regression models show the extent of impact of
predictor variables on criterion variable.
(iO Logistic Regression Model
Logistic model is a class of binary response models in the form:
P(y=llX) = G( Po+ PIXI + P2X2 + ............. + PkXk) = G(Po+XP)
where G is a function taking on values strictly between zero and one O<G(z)<l, for
all real numbers z. X is the vector of independent variables and P is the corresponding
vector of the regression coefficients.
In the logit model,G is the logistic function:
G(z) = eZj 1 + eZ = A(z),
1 Y (P) = ---------------
1 + e_ z
Y = Probability of happening the event; P=l, when event happens; P=o, when event does not happen; e = Base of natural logarithms.
This is the cumulative distribution function for a standard logistic random variable.
VIII. Scheme of Presentation
The thesis has been structured in to nine chapters. The first chapter discusses the
broad features and development issues in mountain economies across the world,
mainly the Alps mountain regions of European countries, Andean mountain ranges in
the South America and Hindu Kush Himalayan (HKH) region countries in the South
Asia.
This is followed by issues and diversity of development experience of Indian hill
economies, mainly in ten hill states, which is presented in chapter two. Chapter three
reviews the literature on the non-farm sector from the theoretical perspective and
from empirical realities. In the end, chapter describes the objectives, hypotheses,
study area, sampling method, and tools used. Chapter four analyses the patterns and
trends of rural non-farm sector utilising secondary sources of data, primarily from the
76

NSS and Census. Chapter five to eight presents empirical findings based on primary
survey. Chapter five presents broad features of socio-economic and demographic
characteristics of sample households. Chapter six reports evidence on employment
and livelihood diversities in the region. Chapter seven examines the pattern of non
farm employment and rural enterprises and chapter eight analyses migration patterns
and linkages. The concluding chapter (chapter nine) summarizes the main
conclusions and reports policy imperatives.
Table: 3.1 Work Participation Rate in Uttarakhand
Area/Sex Main Main plus mareinal 1981@ 1991 2001 1981@
Rural Person 37.07 36.8 28.40 42.97 Male 46.85 46.65 34.73 48.71 Female 27.94 26.74 22.27 37.93 Total Person 36.19 35.17 27.96 41.13 Male 47.69 47.33 37.08 49.24 Female 24.21 22.19 18.68 32.7 Note: @ Excludes Hardwar distriCt. Source: 1. Census ofIndia, Primary Census Abstract, Uttar Pradesh, 1981-1991.
2. Census ofIndia, 2001.
77
1991
42.81 48.48 37.06
39.94 48.78
30.5
2001
41.44 45.35 37.65
38.47 45.91 30.89
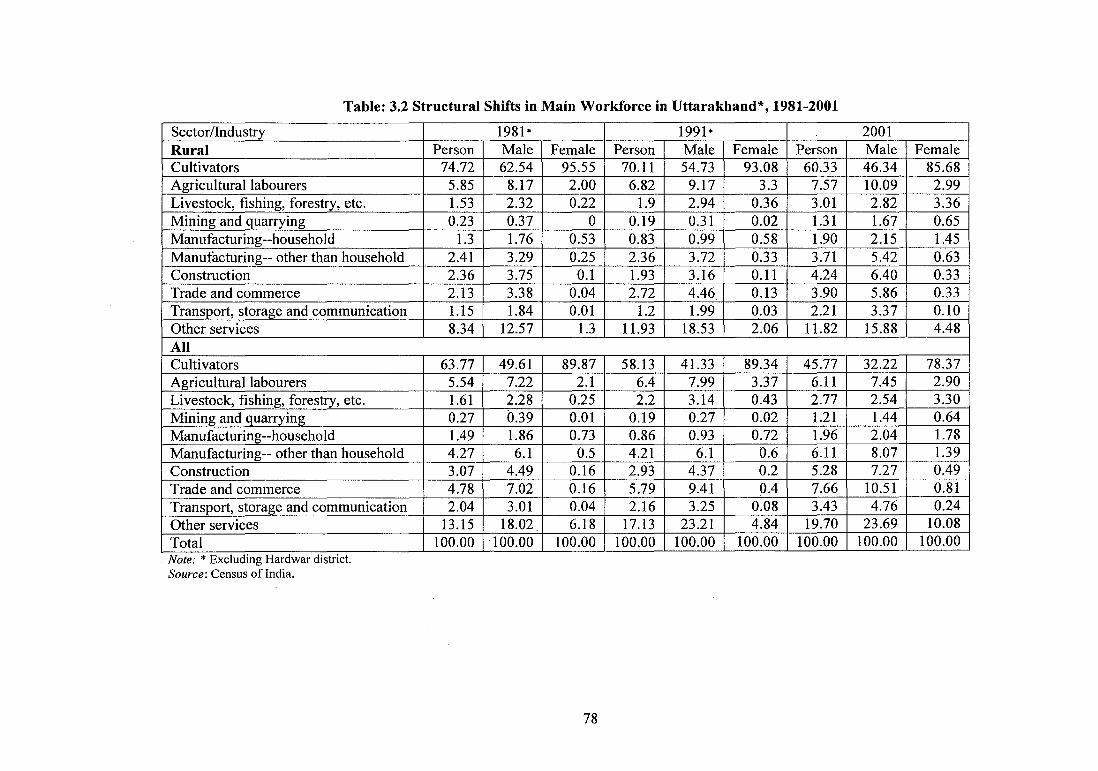
Table: 3.2 Structural Shifts in Main Workforce in Uttarakhand*, 1981-2001
Sector/Industry Rural Cultivators Agricultural labourers Livestock, fishing, forestry, etc. Mining and quarrying Manufacturing --househo ld Manufacturing-- other than household Construction Trade and commerce Transport, storage and communication Other services All Cultivators Agricultural labourers Livestock, fishing, forestry, etc. Mining and quarrying Manufacturing--household Manufacturing-- other than household Construction Trade and commerce Transport, storage and communication Other services Total Note: * Excludmg Hardwar dIstriCt. Source: Census ofIndia.
Person 74.72
5.85 1.53 0.23
1.3 2.41 2.36 2.13 1.15 8.34
63.77 5.54 1.61 0.27 1.49 4.27 3.07 4.78 2.04
13.15 100.00
1981 * Male Female 62.54 95.55
8.17 2.00 2.32 0.22 0.37 0 1.76 0.53 3.29 0.25 3.75 0.1 3.38 0.04 1.84 0.01
12.57 1.3
49.61 89.87 7.22 2.1 2.28 0.25 0.39 0.01 1.86 0.73 6.1 0.5
4.49 0.16 7.02 0.16 3.01 0.04
18.02 6.18 100.00 100.00
78
1991 * Person Male Female Person
70.11 54.73 93.08 60.33 6.82 9.17 3.3 7.57
1.9 2.94 0.36 3.01 0.19 0.31 0.02 1.31 0.83 0.99 0.58 1.90 2.36 3.72 0.33 3.71 1.93 3.16 0.11 4.24 2.72 4.46 0.13 3.90
1.2 1.99 0.03 2.21 11.93 18.53 2.06 11.82
58.13 41.33 89.34 45.77 6.4 7.99 3.37 6.11 2.2 3.14 0.43 2.77
0.19 0.27 0.02 1.21 0.86 0.93 0.72 1.96 4.21 6.1 0.6 6.11 2.93 4.37 0.2 5.28 5.79 9.41 0.4 7.66 2.16 3.25 0.08 3.43
17.13 23.21 4.84 19.70 100.00 100.00 100.00 100.00
2001 Male Female 46.34 85.68 10.09 2.99 2.82 3.36 1.67 0.65 2.15 1.45 5.42 0.63 6.40 0.33 5.86 0.33 3.37 0.10
15.88 4.48
32.22 78.37 7.45 2.90 2.54 3.30 1.44 0.64 2.04 1.78 8.07 1.39 7.27 0.49
10.51 0.81 4.76 0.24
23.69 10.08 100.00 100.00

Table: 3.3 Percentage Distribution of Workers (UPSS) by Industrial Category in Uttarakhand
Industry 1987-88 1993-94 1999-2000 2004-05 Rural
Agriculture etc. 82.29 84.42 79.49 78.40 Mining & quarrying 0.07 0.27 0.00 0.00 Manufacturing 5.80 1.52 3.49 3.40 Electricity water etc. 0.04 0.10 0.25 0.20 Construction 5.07 4.51 7.71 6.10 Trade, hotel and
1.91 1.52 2.06 4.40 restaurant Transport etc. 0.37 0.75 2.00 2.00 Fin. inter, business act.
0.20 0.38 0.54 0.50 etc. Pub. admin., edu., etc 4.26 6.36 4.36 5.00 Total 100.00 100.00 100.00 100.00
Total Agriculture etc. 72.75 75.62 64.46 61.69 Mining & quarrying 0.06 0.32 0.00 0.00 Manufacturing 6.51 2.74 5.50 5.54 Electricity water etc. 0.44 0.23 1.06 0.48 Construction 5.62 4.25 8.23 7.16 Trade, hotel and
4.61 restaurant
3.66 6.75 10.06
Transport etc. 0.80 1.63 2.43 3.33 Fin. inter, business act.
0.74 0.94 1.70 1.05 etc. Pub. adm., educ., etc 8.47 10.45 9.87 10.66 Total 100.00 100.00 100.00 100.00 Source: NSSO, Households Umt Record Data for vanous Rounds.
79

iDistrict
Almora Bageshwar Chamoli Champawat lDehradun Garhwal Hardwar lNainital Pithoragarh iRudraprayag rrehri Garhwal Udham Singh Nagar Uttarkashi Uttarakhand Uttarakhand excl. Hardwar India
Table: 3.4 District-wise Percentage Distribution of Workers by Industry Division (Main plus Marginal), 2001
Total Rural Culti- Agri. Sub House-
Other Culti- Agri.
Sub Household Other vators labour total hold workers
vators labour total industry workers industry
74.77 1.38 76.16 1.18 22.66 79.48 1.47 80.95 1.18 17.87 69.91 2.01 71.92 1.61 26.46 77.33 2.09 79.42 1.56 19.01 64.36 1.38 65.74 1.82 32.44 70.35 1.41 71.77 1.70 26.53 74.67 3.07 77.74 1.88 20.38 76.20 3.12 79.31 1.87 18.81 18.64 7.01 25.65 2.22 72.13 36.25 13.07 49.31 2.57 48.12 67.06 1.55 68.62 1.15 30.24 73.85 1.68 75.53 1.10 23.37 22.63 19.06 41.69 3.98 54.33 31.44 25.97 57.41 4.29 38.30 42.03 8.60 50.64 1.85 47.51 56.69 11.51 68.19 2.03 29.77 67.70 1.17 68.86 3.86 27.27 72.94 1.26 74.20 3.62 22.18 75.78 0.53 76.31 0.92 22.77 76.85 0.54 77.39 0.92 21.69 69.85 1.20 71.05 0.85 28.10 76.43 1.31 77.74 0.89 21.37 29.72 25.63 55.35 3.30 41.35 40.13 32.83 72.96 2.20 24.83 75.10 1.91 77.00 1.42 21.57 79.01 2.01 81.02 1.45 17.53 49.77 8.26 58.03 2.23 39.74 61.75 9.75 71.50 2.07 26.43
54.04 6.56 60.60 1.96 37.44 65.88 7.54 73.42 1.77 24.81
31.71 26.69 58.4 4.07 37.52 42.14 31.2 73.34 3.77 22.9 Source: Registrar General of India (2002), Census of Indza, 2001, Workers and Non-workers, (ElectroniC Data), New Deihl.
80
Total
100.00 100.00 100.00 100.00 100.00 100.00 100.00 100.00 100.00 100.00 100.00 100.00 100.00 100.00
100.00
100.00

Table: 3.5 Number of Non-farm Enterprises in Uttarakhand
District Own account Establishments All enterprises
Number Percentage Number Percentage Number Percentage Uttarkashi 4791 3.36 2562 4.11 7353 Chamoli 10038 7.04 4433 7.11 14471 Tehri 9340 6.55 3427 5.49 12769 Dehradun 18116 12.70 13643 21.87 31759 Pauri 8960 6.28 3818 6.12 12778 Pithoragarh 12820 8.99 3969 6.36 16789 Almora 17123 12.01 5669 9.09 22792 Nainital 30243 21.20 14569 23.36 44812 Hardwar 31189 21.87 10283 16.49 41472 Total 142620 100.00 62373 100.00 204995 .. Source: Economic Census, 1998, Economics and StatIstIcs DIviSIOn, State Planmng InstItute,
Lucknow.
3.58 7.06 6.33
15.49 6.23 8.19
11.12 21.87 20.23
100.00
Table: 3.6 Percentage Distribution of Non-farm Enterprises in Uttarakhand
District 1990 1998 2005 Rural Urban Rural Urban Rural Urban
Uttarkashi 4.98 1.44 5.36 1.58 4.91 1.91 Chamoli 11.60 3.18 10.36 3.32 10.61 3.33 Tehri 4.98 2.22 9.66 2.34 8.00 2.22 Dehradun 8.97 26.99 7.99 24.00 8.58 23.43 Pauri 10.46 4.89 7.41 4.90 8.61 4.10 Pithoragarh 11.06 3.45 11.05 4.95 12.16 5.79 Almora 16.25 4.08 17.03 4.42 13.87 4.26 Nainital 16.10 31.72 14.45 30.22 17.92 30.83 Hardwar 11.10 22.03 16.69 24.27 15.34 24.13 Total 100.00 100.00 100.00 100.00 100.00 100.00 . . ... Sources: (1) EconomIC Census, 1990 and 1998, EconomIcs and StatIStICS DlVlSIon, State Plannmg
Institute, Lucknow. (ii) Economic Census, 2005 (Quick Results) Economic and Statistical Directorate, Uttarakhand
81
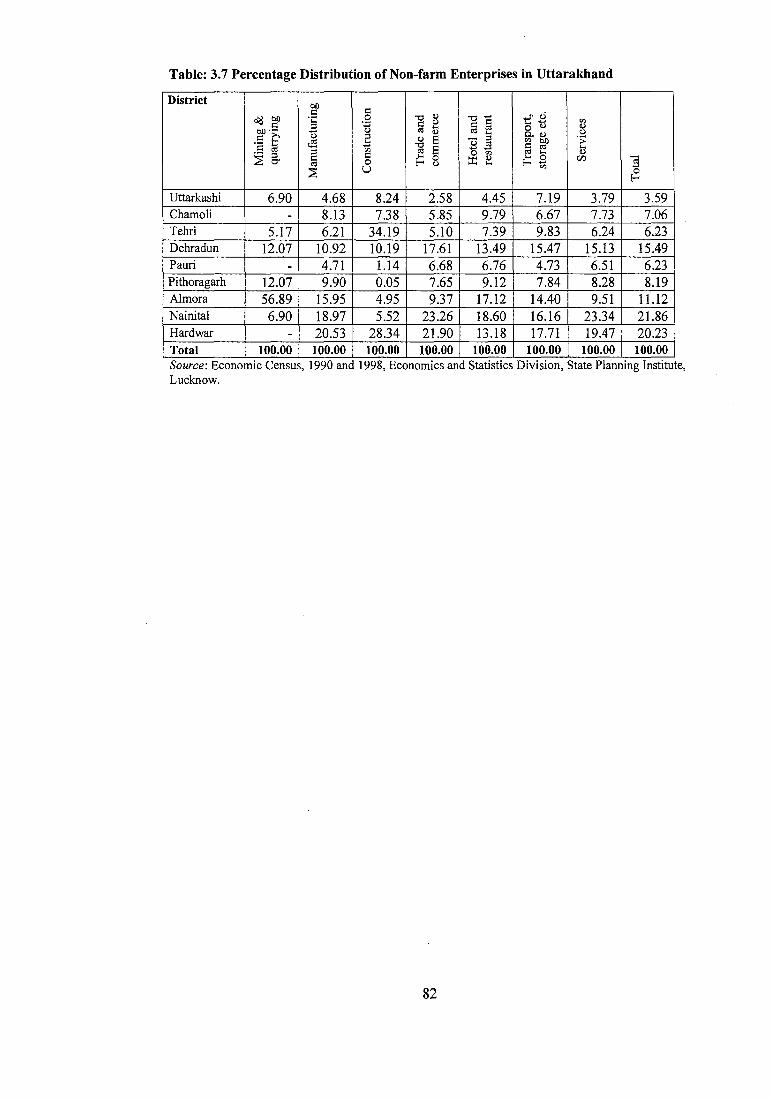
Table: 3.7 Percentage Distribution of Non-farm Enterprises in Uttarakhand
District 00 I:: I:: . (.)
o'd OO .;:: 0 -0 ~ -0 .... 'p I:: <.) I:: I:: 'g~ til I:: ;:l .... ~
00'- .... <.) «I ~ «I i:! o..Q) <.)
.5 S <.) ;:l ~ E - ;:l .;;
r.S .!:: -0 ~ «I til 00 I:: «I til E ........ I:: «I ....
;:l «I o til «I .... Q) .- ;:l I:: .... ~CT I:: 0 ::r: ~
.... 0 If.l -a «I 0 E-< <.) E-<t:; .... ~ u 0
E-<
Uttarkashi 6.90 4.68 8.24 2.58 4.45 7.19 3.79 3.59 Chamoli - 8.13 7.38 5.85 9.79 6.67 7.73 7.06 Tehri 5.17 6.21 34.19 5.10 7.39 9.83 6.24 6.23 Dehradun 12.07 10.92 10.19 17.61 13.49 15.47 15.13 15.49 Pauri - 4.71 1.14 6.68 6.76 4.73 6.51 6.23 Pithoragarh 12.07 9.90 0.05 7.65 9.12 7.84 8.28 8.19 Almora 56.89 15.95 4.95 9.37 17.12 14.40 9.51 11.12 NainitaI 6.90 18.97 5.52 23.26 18.60 16.16 23.34 21.86 Hardwar - 20.53 28.34 21.90 13.18 17.71 19.47 20.23 Total 100.00 100.00 100.00 100.00 100.00 100.00 100.00 100.00 ... Source: Economic Census, 1990 and 1998, Economics and Statistics DIvIsion, State Planmng Institute, Lucknow.
82


![Perubahan Sosial - eprints.dinus.ac.ideprints.dinus.ac.id/14467/1/[Materi]_Pengantar_sosiologi_-_Mutia_Rahmi_Pratiwi...Struktur sos, sistem kom dan organisasi sosial • Struktur sosial](https://img.pdfslide.net/doc/110x75/5d45a20b88c9936f738d0c1d/perubahan-sosial-materipengantarsosiologi-mutiarahmipratiwistruktur.jpg)