Embed Size (px)
Citation preview
Rural Poverty and the Cost of Living:
Implications of Current Discussions on Changing How We Measure Poverty
Dean Jolliffe
Economic Research Service, USDA
Paper available for comments.
The views expressed in this paper do not necessarily reflect the views of the Economic Research Service of the U.S. D. A.
Email: [email protected]
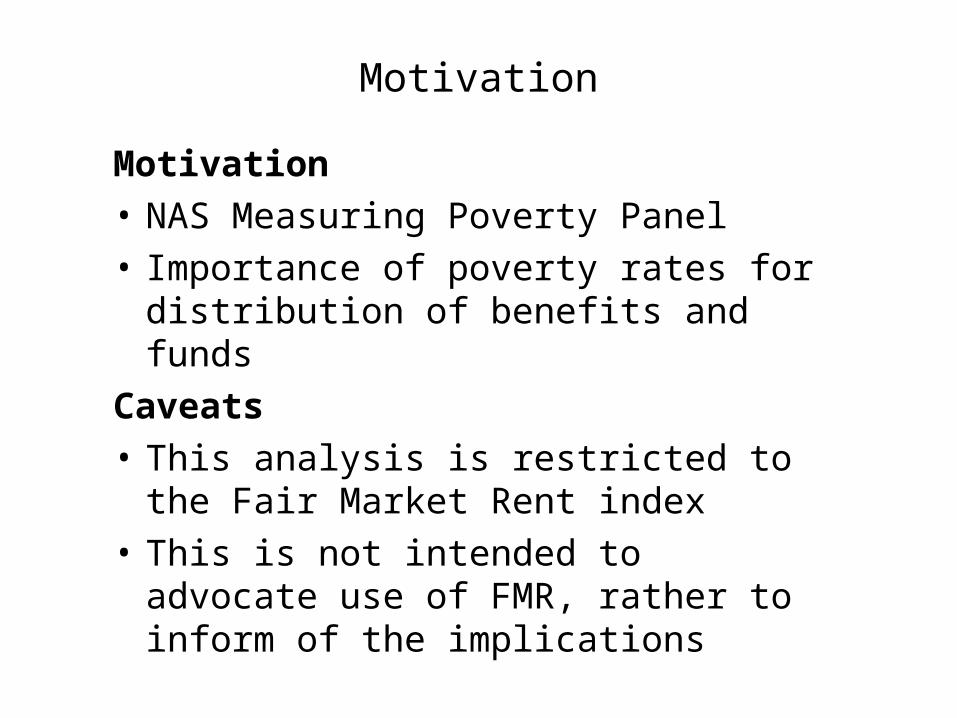
Motivation
Motivation
• NAS Measuring Poverty Panel
• Importance of poverty rates for distribution of benefits and funds
Caveats
• This analysis is restricted to the Fair Market Rent index
• This is not intended to advocate use of FMR, rather to inform of the implications

Outline of Presentation
• Review Foster-Greer-Thorbecke family of poverty indices.
• Describe the data: March Supplement to the CPS from 1989 to 2001 and the Fair Market Rent Index
• Results
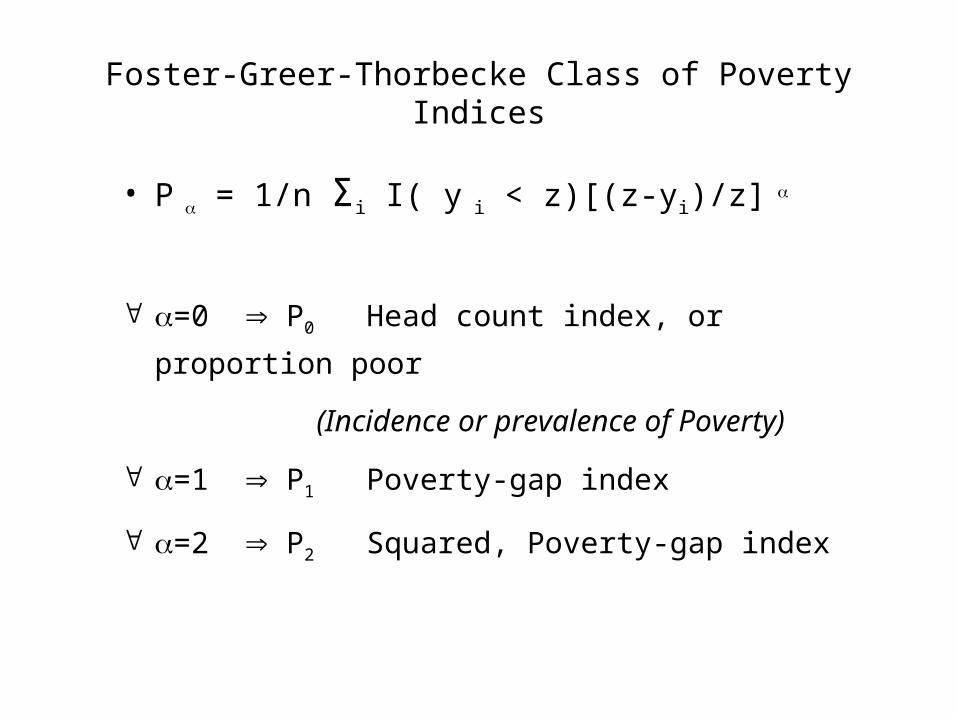
Foster-Greer-Thorbecke Class of Poverty Indices
• P = 1/n Σi I( y i < z)[(z-yi)/z]
=0 P0 Head count index, or proportion poor
(Incidence or prevalence of Poverty)
=1 P1 Poverty-gap index
=2 P2 Squared, Poverty-gap index
A few examples of why the differences across P0, P1, and P2 matter
• FSP Example: Transfer money to poor person, but not enough to convert into nonpoor. The person is better off, but this is not reflected in P0. P1 and P2 do reflect the change in welfare and are lowered.
• Example: Transfer money from poor to someone who is extremely poor. (Same caveat as above). Inequality is less, mean income the same, any Shur-concave SWF increases; but P0 and P1 are unaffected. P2 is lowered.
• Example: Is there a discrete difference in welfare at the poverty line? P0 suggests there is, P2 is differentiable at z.
• Example: Measurement error and the recommendations of the National Academy of Science’s panel on poverty measurement. P1 and P2 are more robust to measurement error than P0. (next slide)
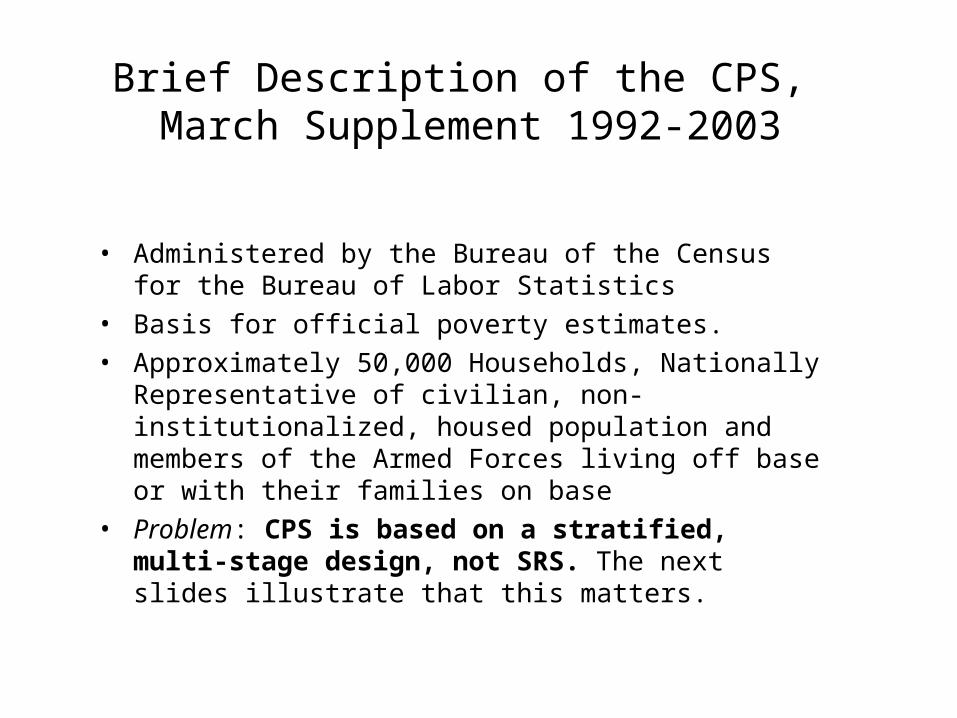
Brief Description of the CPS, March Supplement 1992-2003
• Administered by the Bureau of the Census for the Bureau of Labor Statistics
• Basis for official poverty estimates.
• Approximately 50,000 Households, Nationally Representative of civilian, non-institutionalized, housed population and members of the Armed Forces living off base or with their families on base
• Problem: CPS is based on a stratified, multi-stage design, not SRS. The next slides illustrate that this matters.

Brief Description of Fair Market Rent (FMR) Data
• FMR collected by HUD for Section 8 (housing voucher program)
• Rent + utilities for ‘standard quality’ housing (FMR taken at 40th percentile)
• Full coverage (354 metro, 2350 nonmetro), aggregated to 100 observations (met/nonmet by State)
• ALTERNATIVES: CPI experiments, ACCRA
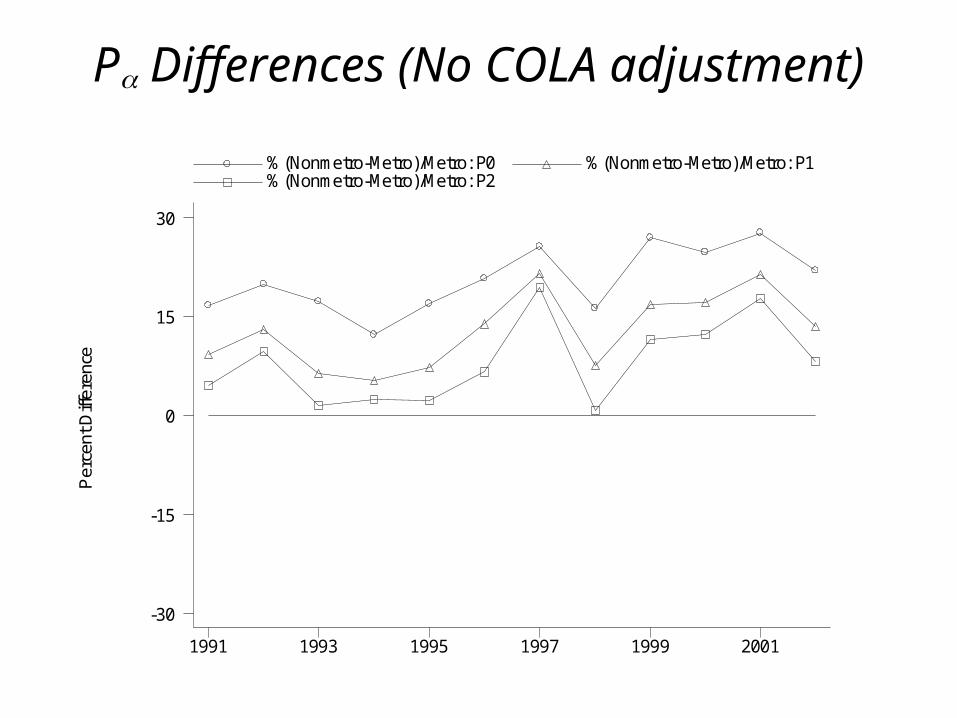
P Differences (No COLA adjustment)P
erce
nt D
iffer
ence
%(Nonmetro-Metro)/Metro: P0 %(Nonmetro-Metro)/Metro: P1 %(Nonmetro-Metro)/Metro: P2
1991 1993 1995 1997 1999 2001
-30
-15
0
15
30
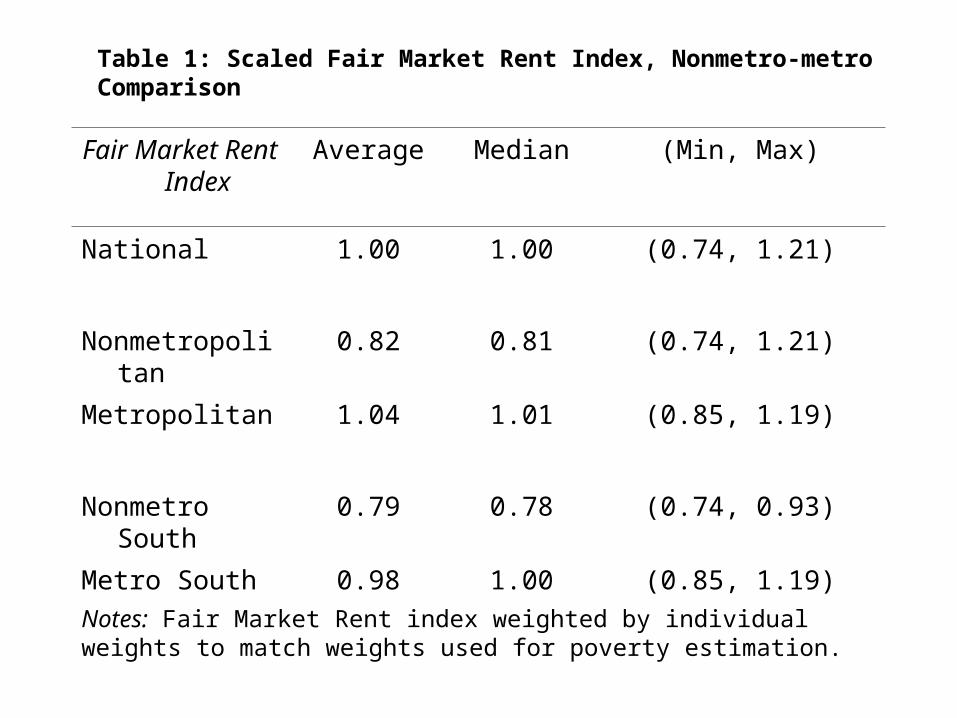
Table 1: Scaled Fair Market Rent Index, Nonmetro-metro Comparison
Notes: Fair Market Rent index weighted by individual weights to match weights used for poverty estimation.
Fair Market Rent Index
Average Median (Min, Max)
National 1.00 1.00 (0.74, 1.21)
Nonmetropolitan 0.82 0.81 (0.74, 1.21)
Metropolitan 1.04 1.01 (0.85, 1.19)
Nonmetro South 0.79 0.78 (0.74, 0.93)
Metro South 0.98 1.00 (0.85, 1.19)
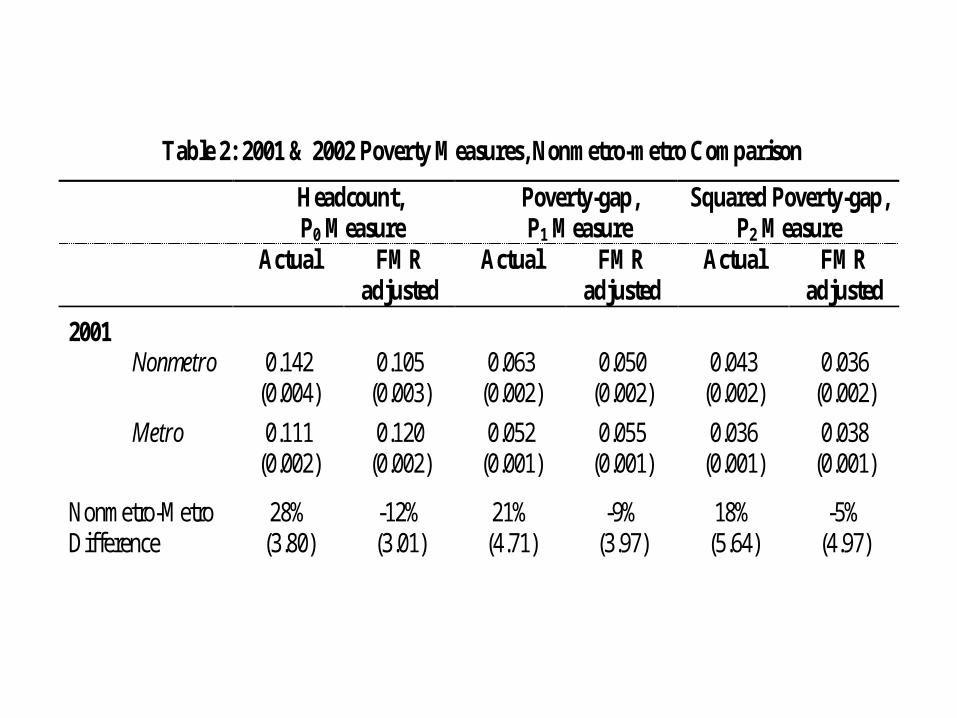
Table 2: 2001 & 2002 Poverty Measures, Nonmetro-metro Comparison Headcount,
P0 Measure Poverty-gap, P1 Measure
Squared Poverty-gap, P2 Measure
Actual FMR adjusted
Actual FMR adjusted
Actual FMR adjusted
2001 Nonmetro 0.142 0.105 0.063 0.050 0.043 0.036 (0.004) (0.003) (0.002) (0.002) (0.002) (0.002) Metro 0.111 0.120 0.052 0.055 0.036 0.038 (0.002) (0.002) (0.001) (0.001) (0.001) (0.001) Nonmetro-Metro Difference
28% (3.80)
-12% (3.01)
21% (4.71)
-9% (3.97)
18% (5.64)
-5% (4.97)
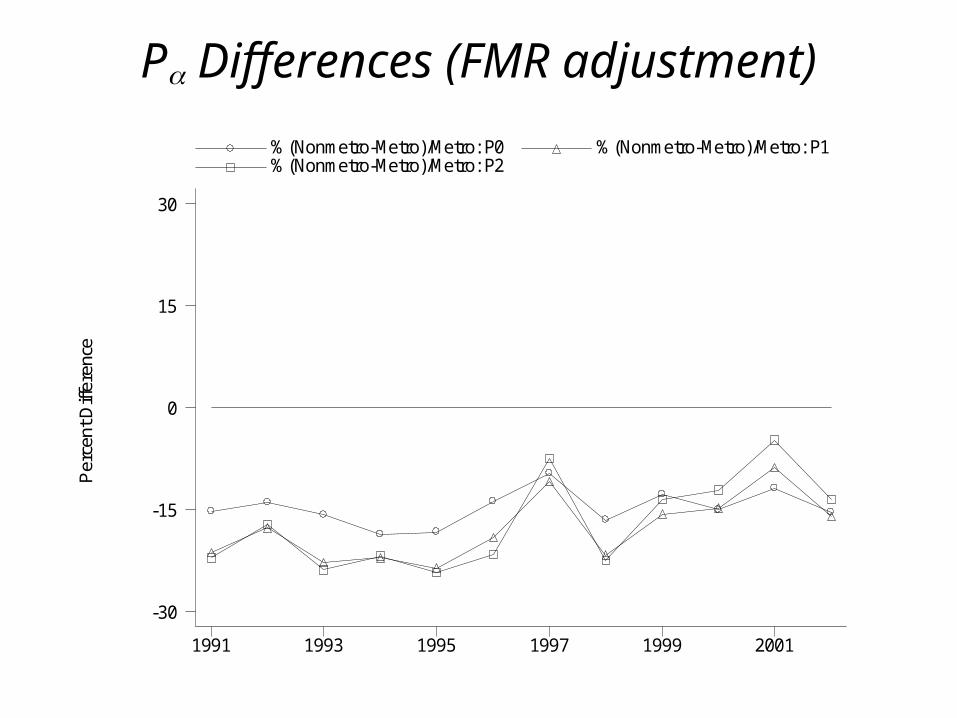
P Differences (FMR adjustment)P
erce
nt D
iffer
ence
%(Nonmetro-Metro)/Metro: P0 %(Nonmetro-Metro)/Metro: P1 %(Nonmetro-Metro)/Metro: P2
1991 1993 1995 1997 1999 2001
-30
-15
0
15
30

Distribution of Income to Needs of the Poor, 2001
De
nsi
ty o
f W
elfa
re R
atio
, 2
00
1
Welfare Ratio, 2001
Nonmetro Metro
0 .25 .5 .75 1
.3
.6
.9
1.2
1.5
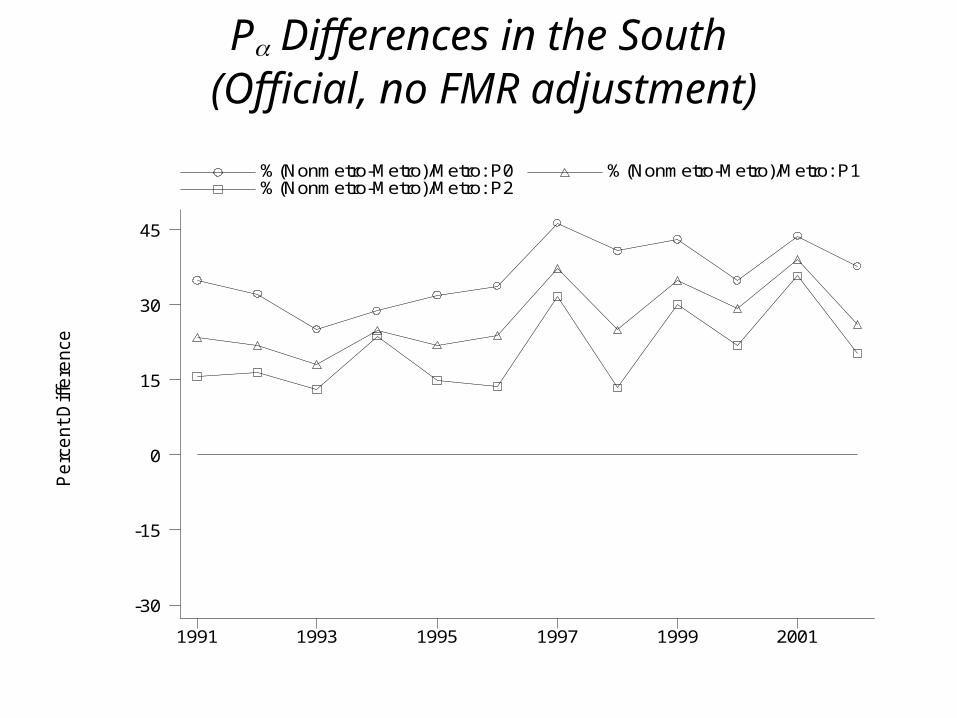
P Differences in the South (Official, no FMR adjustment)
Pe
rce
nt D
iffe
rence
%(Nonmetro-Metro)/Metro: P0 %(Nonmetro-Metro)/Metro: P1 %(Nonmetro-Metro)/Metro: P2
1991 1993 1995 1997 1999 2001
-30
-15
0
15
30
45
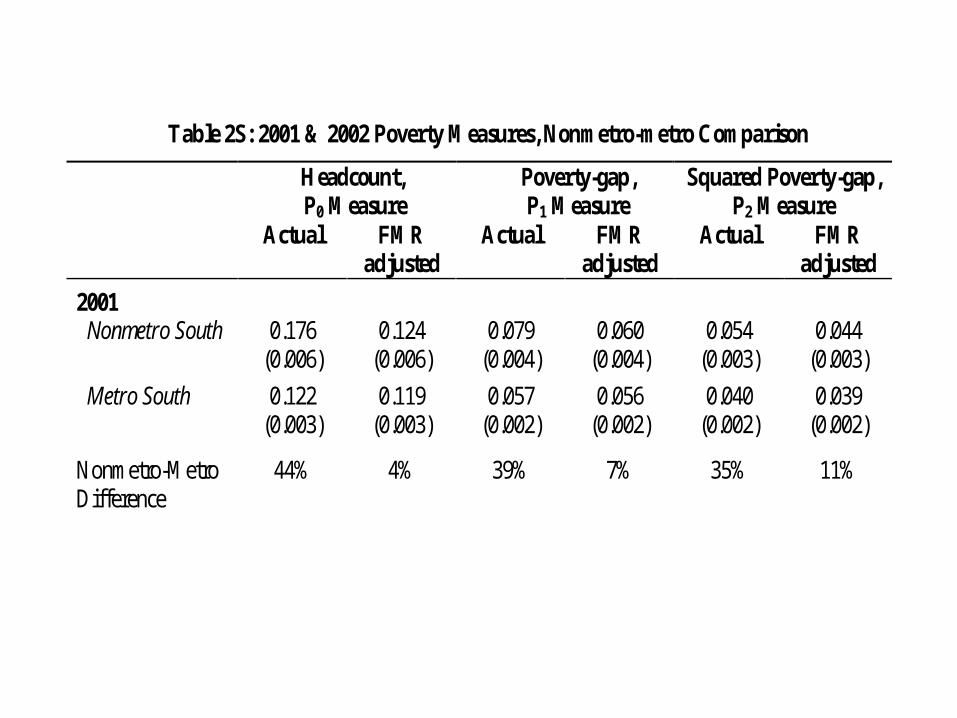
Table 2S: 2001 & 2002 Poverty Measures, Nonmetro-metro Comparison Headcount,
P0 Measure Poverty-gap, P1 Measure
Squared Poverty-gap, P2 Measure
Actual FMR adjusted
Actual FMR adjusted
Actual FMR adjusted
2001 Nonmetro South 0.176 0.124 0.079 0.060 0.054 0.044 (0.006) (0.006) (0.004) (0.004) (0.003) (0.003) Metro South 0.122 0.119 0.057 0.056 0.040 0.039 (0.003) (0.003) (0.002) (0.002) (0.002) (0.002) Nonmetro-Metro Difference
44%
4%
39%
7%
35%
11%
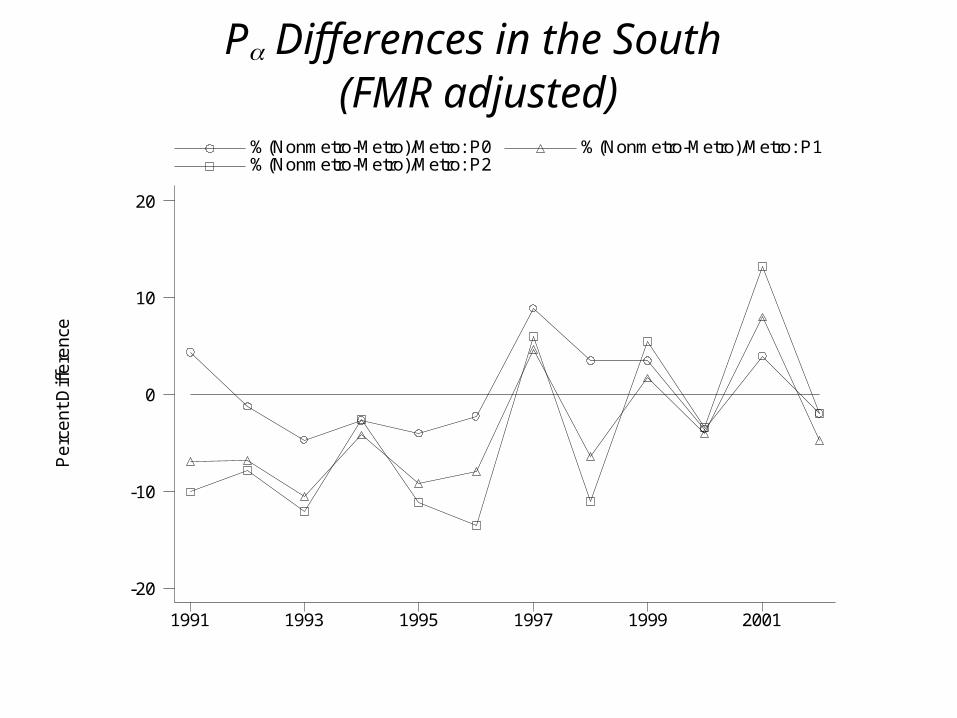
P Differences in the South (FMR adjusted)
Pe
rce
nt D
iffe
rence
%(Nonmetro-Metro)/Metro: P0 %(Nonmetro-Metro)/Metro: P1 %(Nonmetro-Metro)/Metro: P2
1991 1993 1995 1997 1999 2001
-20
-10
0
10
20
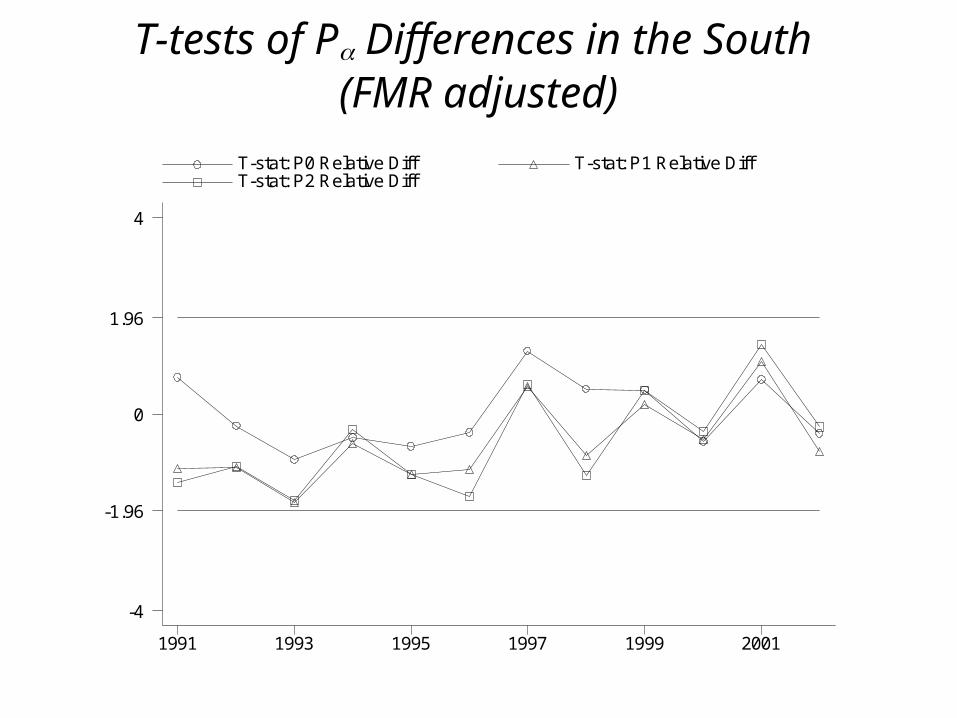
T-tests of P Differences in the South (FMR adjusted)
T-stat: P0 Relative Diff T-stat: P1 Relative Diff T-stat: P2 Relative Diff
1991 1993 1995 1997 1999 2001
-4
-1.96
0
1.96
4
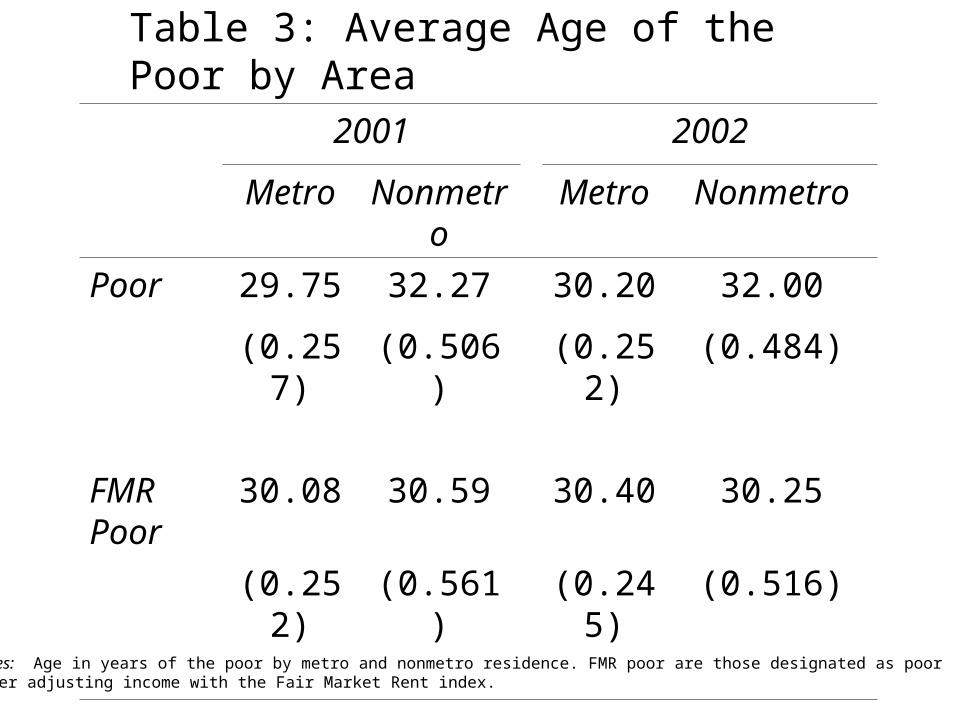
Table 3: Average Age of the Poor by Area
2001 2002
Metro Nonmetro Metro Nonmetro
Poor 29.75 32.27 30.20 32.00
(0.257) (0.506) (0.252) (0.484)
FMR Poor
30.08 30.59 30.40 30.25
(0.252) (0.561) (0.245) (0.516)
Notes: Age in years of the poor by metro and nonmetro residence. FMR poor are those designated as poor after adjusting income with the Fair Market Rent index.

Age distribution of the Poor, 2001 D
ensi
ty o
f Age
, 200
1
Age, 2001
Nonmetro Metro
0 10 20 30 40 50 60 70 80
0
.01
.025
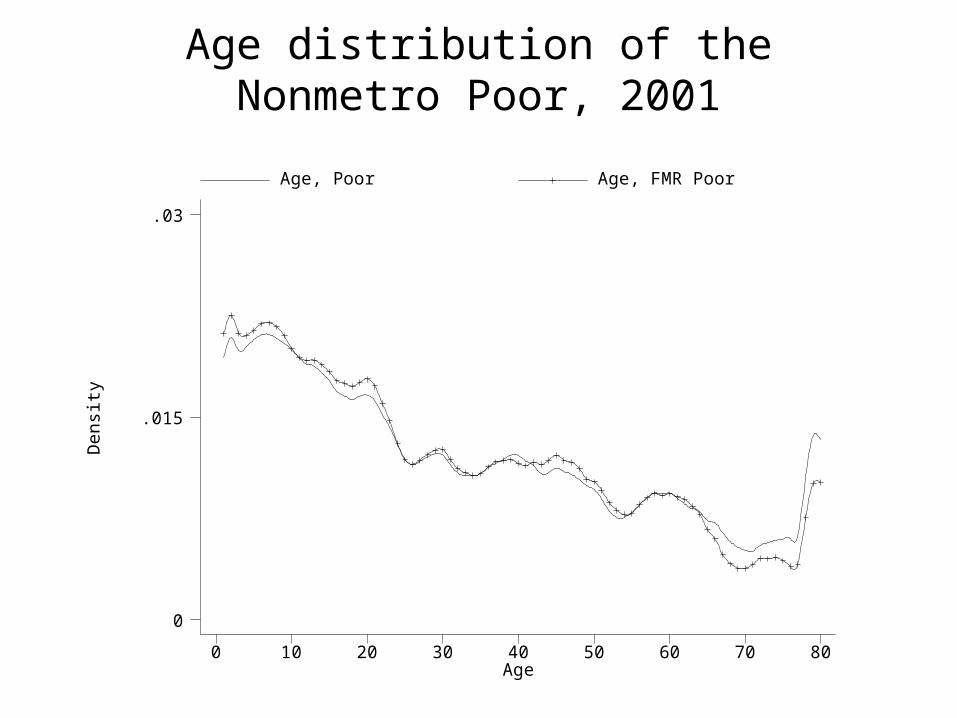
Age distribution of the Nonmetro Poor, 2001D
ensi
ty
Age
Age, Poor Age, FMR Poor
0 10 20 30 40 50 60 70 80
0
.015
.03
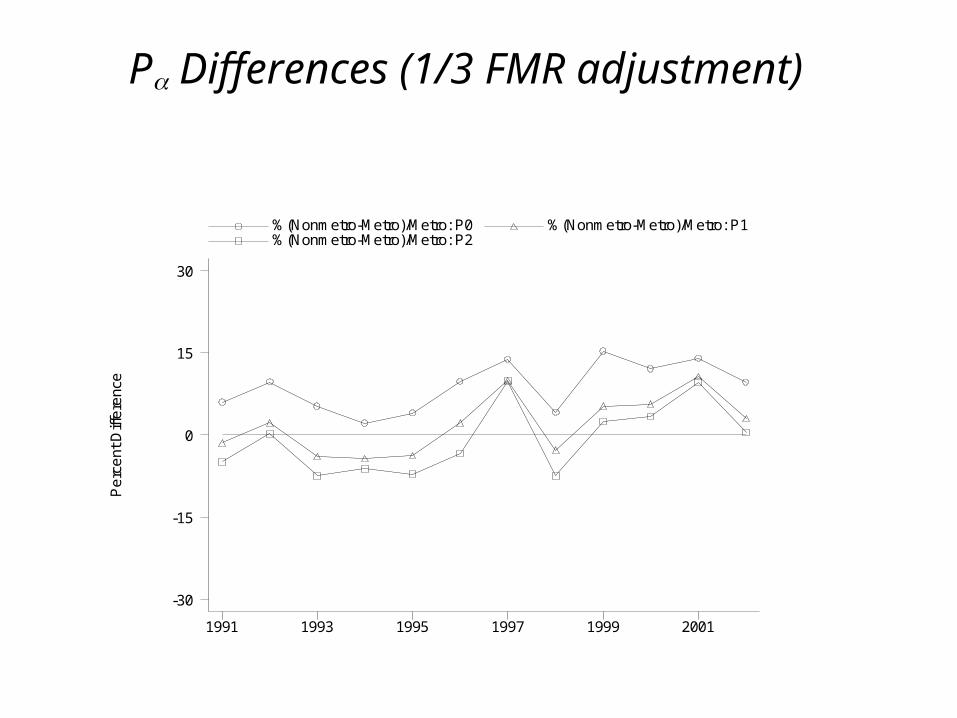
P Differences (1/3 FMR adjustment) P
erc
ent
Diff
ere
nce
%(Nonmetro-Metro)/Metro: P0 %(Nonmetro-Metro)/Metro: P1 %(Nonmetro-Metro)/Metro: P2
1991 1993 1995 1997 1999 2001
-30
-15
0
15
30
Conclusions
• FMR as COLA fully reverses Metro – Nonmetro poverty rankings (national)
• Of the Nonmetro poverty population, the elderly are disproportionately affected
• Important to be aware of implications of FMR (could affect area distribution of social safety net)
• 1/3 FMR moderates findings