Embed Size (px)
Citation preview

UBS Investment Research
Russian Economic Perspectives
Russia in the tide of global events - Erratum Introducing our new monthly publication: Russian Economic Perspectives
This is the first edition of Russian Economic Perspectives, our new monthlypublication on the Russian economy. The first part of the report will contain afocus piece on key recent developments in the Russian economy and financialmarkets. The second will feature a comprehensive chart book and data annex monitoring performance in various sectors of the economy. ** This document replaces one published earlier today which contained data errors in the table onpage 36 **
Repeat of 2008/09 collapse looks unlikely Emerging financial markets have been at the mercy of global events recently, andthis has been particularly true for Russia, a key producer of growth-sensitive commodities. But while global events will likely continue to exert a majorinfluence, we do not expect Russia to suffer another collapse as in 2008/09. Firstly,while cautious, our global growth outlook is not super-pessimistic; we expect oil to remain at cUS$100/bbl. Secondly, Russia has already seen sizeable capitaloutflows in recent quarters, and any additional outflows should be less dramatic. Thirdly, FX risk in Russian balance sheets seems to be smaller than in 2008/09.
But short-term outlook remains cautious Still, despite better risk perception recently, the risk to our global growth scenariois arguably skewed to the downside. Should global growth concerns intensify anddrag commodity prices down, the outlook for Russia would suffer, perhapsseverely. We believe a lasting recovery of Russian markets will depend on strongerconvictions that external growth will not collapse – and this clarity might not emerge for some time. Consequently, our short-term outlook remains cautious.
Declining inflation, more cautious on the RUB, Q3 growth outlook positiveInflation is declining and should finish 2011 at around 7%, close to the CBR’s 6-7% target range. CBR rate hikes look unlikely, not least because higher moneymarket rates – a reflection of institutional weaknesses in the interbank markets –have already caused a tightening in liquidity. Given the cautious (global) outlook we have revised our rouble forecasts towards softer levels, but still expect therouble to appreciate next year. The growth outlook for Q3 2011 looks reasonablypromising; we expect real GDP to increase by 5% y/y or more.
Global Economics Research
Russia
London
19 October 2011
www.ubs.com/economics
Reinhard Cluse
+44-20-7568 6722
Gyorgy KovacsEconomist
[email protected]+44-20-7568 7563
Jennifer MillerAssociate Economist
[email protected]+44-20-7568 6585
Chart 1: Chart of the month – the oil price and USD/RUB
60
70
80
90
100
110
120
130
Jan-10 Apr-10 Jul-10 Oct-10 Jan-11 Apr-11 Jul-11 Oct-11
27
28
29
30
31
32
33
Oil price, Urals, US$/bbl (lhs) USD/RUB, inv erted (rhs)
Source: Haver, UBS This report has been prepared by UBS Limited ANALYST CERTIFICATION AND REQUIRED DISCLOSURES BEGIN ON PAGE 37.
ab

Russian Economic Perspectives 19 October 2011
UBS 2
Contents page
Gross domestic product 9 Gross domestic product (cont.) 10 Structure of GDP 11 Private consumption 12 Investment 13 Foreign trade 14 IP and other production indices 15 Economic activity – short-term indicators 16 UBS Russian Lead Economic Indicator1 17 Labour market and income 18 Inflation 19 Money and credit 20 Trade and current account 21 Financial account and FX reserves 22 External debt & international investment position 23 Fiscal policy 24 Monetary policy 26 The Rouble 27 Financial markets 28 Russia in a regional context 30 Russia, Ukraine and Kazakhstan 32 Data and forecast tables 34
Reinhard Cluse
+44-20-7568 6722
Gyorgy KovacsEconomist
[email protected]+44-20-7568 7563
Jennifer MillerAssociate Economist
[email protected]+44-20-7568 6585

Russian Economic Perspectives 19 October 2011
UBS 3
** This document replaces one published earlier today which contained data errors in the table on page 36 **
Russia in the tide of global events While domestic factors certainly matter as a driving force of events in the emerging financial markets, external factors – above all the euro zone debt crisis and its potential to force Europe into a recession – are currently far more dominant. And this holds for Russia more than most other EM countries, given the great importance of growth-sensitive oil and commodities in the Russian economy. Consequently, the recent weeks have been a roller-coaster: amid greatly increased pessimism about global growth and lower oil prices, Russian equities have sold off heavily, the rouble has depreciated, bond yields and CDS spreads have widened, and Russian interbank rates have shot up. But when global risk appetite started to recover in early October, led by signs that European banking recapitalisation might make progress, risk assets rallied, and so did Russian markets.
Chart 2: RTS stock index and oil price Chart 3: MSCI Russia versus World & EM - YTD
500
1000
1500
2000
2500
Jan-08 Jan-09 Jan-10 Jan-11
40
60
80
100
120
140
160
RTS index (Jan-95=100) Oil price, US$/bbl (rhs)
70
80
90
100
110
120
Jan-11 Mar-11 May -11 Jul-11 Sep-11
MSCI Global MSCI EM MSCI Russia
index , Jan 2011=100
Source: Haver, UBS Source: Haver, UBS
We believe the close connection between Russian performance and global risk appetite (as a function of euro zone events) will hold over the coming months. What would UBS forecasts suggest then? Our global house view centres on a cautious (but not super-pessimistic) scenario in which recession in the euro zone (and the global economy) is avoided. We expect an ‘orderly’ Greek sovereign default early in 2012, by which time the necessary institutional firewalls should be in place to ensure that it does not trigger a European banking crisis and, hence, a European recession.
We forecast euro zone growth to slow to a weak – but nevertheless a positive – 1% in 2012. Based on this scenario, we believe oil prices should stay at around US$100/bbl (Brent), down from this year, but not drastically. This would be a reasonably constructive scenario for Russia, which, according to our base-case forecasts, should then see real GDP growth of 3.4% next year (consensus 4.0%), a current account surplus of 4% of GDP, and a fiscal deficit of 2% of GDP.1
1 We work on the following rule of thumb: a rise in the oil price of US$10/barrel lifts Russia’s budget balance by 1-1.5% of GDP and the current account balance by 1.5% of GDP.
Russia has been at the mercy of global events recently
UBS’s global outlook is cautious, but not super-pessimistic

Russian Economic Perspectives 19 October 2011
UBS 4
Why a 2008/09-style collapse seems unlikely now
In other words, we do not expect a collapse of the Russian economy as in 2009, when real GDP contracted by 7.8% – and this is for mainly three reasons. Firstly, as we already indicated, our global base-case scenario implies that a dramatic fall in oil prices comparable to 2008/09, when prices crashed from US$145/bbl to less than US$40/bbl, will be avoided. Secondly, while Russia was a 'crowded trade' in 2006-08, and then suffered huge capital outflows during the crisis, the country has already seen sizeable capital outflows in 2010/11, so that additional outflows should now be less dramatic. Thirdly, we think exchange rate risk is less dramatic today. In 2006-08, the rouble was on a one-way road of appreciation, which took USD/RUB all the way to 23.30. Many Russian entities expected the appreciation to continue and were happy to borrow in FX. This turned out to be a painful mistake when the RUB weakened all the way back to USD/RUB36 during the crisis, inflicting great damage on private sector balance sheets. Given this experience, and the much more volatile performance of the RUB over the past two years, net FX open positions seem to be less of a problem for Russian balance sheets now, particularly in the banking sector.
The only area where Russia is clearly in a less comfortable position is public finance. Given much stronger public spending than before the 2008/09 crisis, Russia's budget now balances at an oil price of US$115/bbl – in 2008, the budget breakeven oil price was much lower, at cUS$65/bbl. This makes Russia vulnerable to a sharp decline in energy prices and implies that the Russian government at present has less scope to react to a sharp slowdown in growth with a major fiscal stimulus.
Downside risks remain acute
Yet, despite better risk perception recently, the forecast risk to our global growth scenario is arguably skewed to the downside. Should concerns about euro zone debt and/or euro zone recession re-emerge, and take oil and commodity prices down again, the Russian economic outlook and Russian asset prices would once again suffer, perhaps severely. We believe a lasting recovery in Russian markets will depend on stronger convictions that external growth will not collapse – and we might not get this clarity for a few more months.
What’s happening in the short term?
Inflation on the decline
Inflation peaked at 9.6% y/y in May and is now on the way down, falling to 7.2% y/y by September. Two main forces are at work. Firstly, recent food price trends have been benign, thanks to a good harvest. Over the past four months, food prices have declined a cumulative 2.9%, taking significant pressure off CPI, given the 37.7% weight of food in the Russian CPI basket. Secondly, base effects have turned strongly positive since the impact of the sharp food-related inflation increase in mid-2010 started to fade from the y/y numbers. We expect both factors to stay at work for now and we expect inflation to hover around 7% until year-end, before going lower in early 2012. This is broadly in line with most recent guidance from the CBR, which should consequently come reasonably close to meeting its aim of bringing inflation to 6-7% by end-2011.
Russia is unlikely to suffer a collapse as in 2008/09
Russia’s fiscal position is less comfortable than before the 2008/09 crisis
Downside risks arguably predominate at this stage
End-2011E inflation at around 7% y/y

Russian Economic Perspectives 19 October 2011
UBS 5
Chart 4: CPI forecast, % y/y Chart 5: CPI and USD/RUB
02468
10121416
Jan-07 Jan-08 Jan-09 Jan-10 Jan-11 Jan-12CPI, % y /y
forecast
56789
10111213141516
Jan-07 Jan-08 Jan-09 Jan-10 Jan-11
22
24
26
28
30
32
34
36
CPI, % y /y (lhs) USD/RUB (rhs)
Source: Haver, UBS estimates Source: Haver, UBS
While headline inflation is likely to go down, there will nevertheless be some pro-inflationary impact from the weaker RUB. Since July, the rouble has lost about 9.4% against the basket, which – if sustained – should add around 1.5-2pp to inflation over the coming 3-4 quarters (assuming 20% pass-through), with perhaps 1-1.5pp materialising by end-2011. Eventually, we believe the inflation impact might be somewhat less, as we see a good chance that the RUB, rather than remaining at current levels, will recover more of the recent losses.
No CBR rate hikes
Given the decline in inflation and concerns about growth, we do not think the CBR will hike policy rates anytime soon. As such, it will likely disregard the recent recommendation by the IMF, which (in its Art. IV report from September) urged it to tighten monetary policy. But arguably, the monetary tightening has already happened – even without CBR rate hikes – as liquidity conditions in the interbank money markets have recently tightened substantially.
Chart 6: Monetary policy and inflation outlook
0
2
4
6
8
10
12
Sep-09 Mar-10 Sep-10 Mar-11 Sep-11 Mar-12 Sep-12CPI, % y /y Ov ernight CBR deposit rate, % Refinancing rate, % 1 day repo, %
forecast
Source: Haver, UBS estimates
Rouble weakness to prevent faster decline in inflation
CBR likely to keep rates on hold
Russian Economic Perspectives 19 October 2011
UBS 6
Money market strains
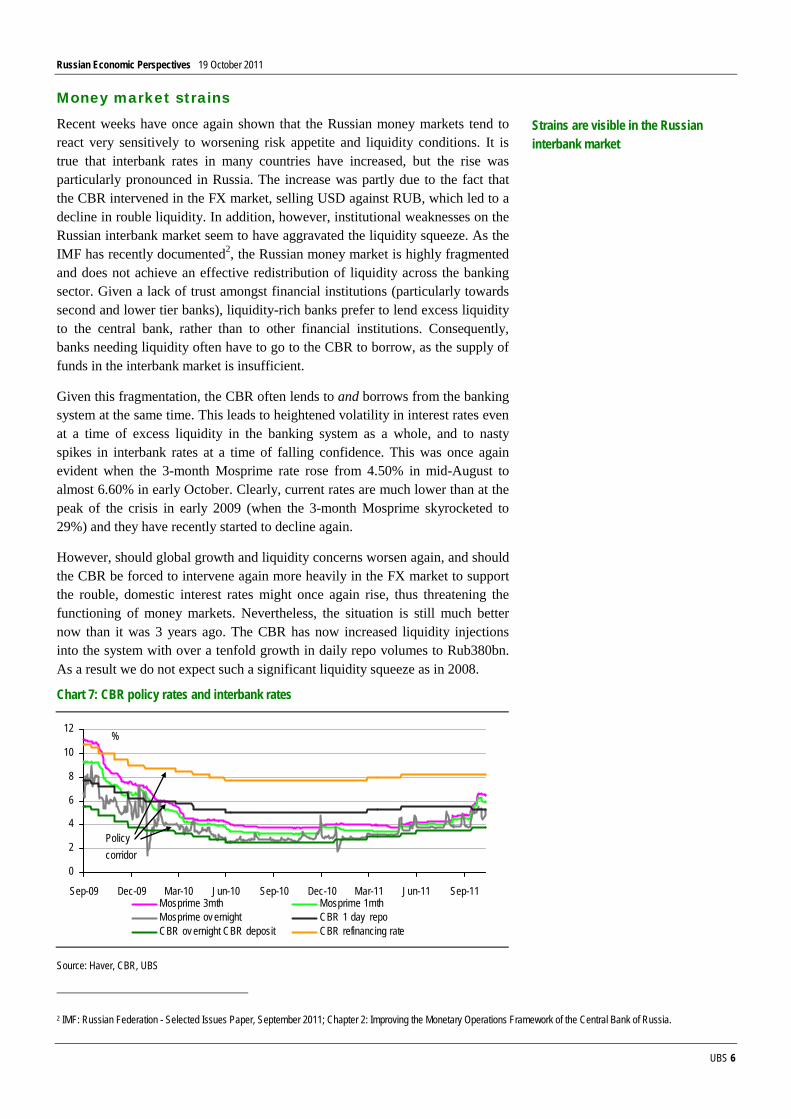
Recent weeks have once again shown that the Russian money markets tend to react very sensitively to worsening risk appetite and liquidity conditions. It is true that interbank rates in many countries have increased, but the rise was particularly pronounced in Russia. The increase was partly due to the fact that the CBR intervened in the FX market, selling USD against RUB, which led to a decline in rouble liquidity. In addition, however, institutional weaknesses on the Russian interbank market seem to have aggravated the liquidity squeeze. As the IMF has recently documented2, the Russian money market is highly fragmented and does not achieve an effective redistribution of liquidity across the banking sector. Given a lack of trust amongst financial institutions (particularly towards second and lower tier banks), liquidity-rich banks prefer to lend excess liquidity to the central bank, rather than to other financial institutions. Consequently, banks needing liquidity often have to go to the CBR to borrow, as the supply of funds in the interbank market is insufficient.
Given this fragmentation, the CBR often lends to and borrows from the banking system at the same time. This leads to heightened volatility in interest rates even at a time of excess liquidity in the banking system as a whole, and to nasty spikes in interbank rates at a time of falling confidence. This was once again evident when the 3-month Mosprime rate rose from 4.50% in mid-August to almost 6.60% in early October. Clearly, current rates are much lower than at the peak of the crisis in early 2009 (when the 3-month Mosprime skyrocketed to 29%) and they have recently started to decline again.
However, should global growth and liquidity concerns worsen again, and should the CBR be forced to intervene again more heavily in the FX market to support the rouble, domestic interest rates might once again rise, thus threatening the functioning of money markets. Nevertheless, the situation is still much better now than it was 3 years ago. The CBR has now increased liquidity injections into the system with over a tenfold growth in daily repo volumes to Rub380bn. As a result we do not expect such a significant liquidity squeeze as in 2008.
Chart 7: CBR policy rates and interbank rates
0
2
4
6
8
10
12
Sep-09 Dec-09 Mar-10 Jun-10 Sep-10 Dec-10 Mar-11 Jun-11 Sep-11Mosprime 3mth Mosprime 1mthMosprime ov ernight CBR 1 day repo CBR ov ernight CBR deposit CBR refinancing rate
Policy corridor
%
Source: Haver, CBR, UBS
2 IMF: Russian Federation - Selected Issues Paper, September 2011; Chapter 2: Improving the Monetary Operations Framework of the Central Bank of Russia.
Strains are visible in the Russian interbank market

Russian Economic Perspectives 19 October 2011
UBS 7
The rouble
Higher interest rates currently give some support to the rouble. That said, headwinds related to (a) global growth and oil price risks and (b) concern about uncertain investment conditions in Russia have recently predominated. During the first three quarters of 2011, Russia saw private capital outflows of US$49.4bn, more than during the full year 2010 (US$33.7bn). While many observers, including ourselves, were hopeful that capital outflows would come to a halt in H2 2011, recent announcements about the country’s political leadership will have increased uncertainty once again. In particular, the fact that Finance Minister Kudrin, a well-respected fiscal conservative, is leaving the government has caused disappointment, which might well lead to further capital outflows. Against the background of these external and Russia-specific concerns, which might not dissipate quickly, a more cautious outlook on the rouble seems warranted.
Chart 8: RUB against USD, EUR and USD-EUR basket – YTD Chart 9: Private capital flows and USD/RUB
272931333537394143
Jan-11 Mar-11 May -11 Jul-11 Sep-11USD/RUB RUB v s basket EUR/RUB
-120000
-90000
-60000
-30000
0
30000
60000
Q1-2006 Q3-2007 Q1-2009 Q3-2010
23
25
27
29
31
33
35
Priv ate capital flow s, US$ mn (lhs) USD/RUB, inv erted (rhs)
Source: Haver, UBS Source: Haver, UBS
Our FX strategists, who are responsible for short-term currency forecasting, now anticipate a year-end exchange rate of USD/RUB31.50. Weaker than the current spot rate, this forecast implies some risk that European policymakers will over the coming weeks deliver less of a ‘comprehensive solution’ to the European debt crisis than the markets currently anticipate. Combined with our (admittedly aggressive) end-2011 forecast of USD/EUR1.20, this would imply a RUB/basket rate of 34.34, around 5% stronger than the current basket value (36.08). For next year, assuming an average oil price of US$100/bbl and modest capital outflows from Russia, we now forecast a year-end rate of USD/RUB30 – a more cautious assessment than our previous forecast of USD/RUB28, which stemmed from a time of greater optimism on the global economy in 2012. Assuming an end-2012 rate of USD/EUR1.30, this would imply a basket value of around 34, i.e. roughly 1% stronger compared with end-2011.
Growth – short-term outlook positive
While growth disappointed in H1 2011 (at 3.7% y/y), we continue to believe that Q3 GDP numbers will be better, and probably above 5% y/y, despite the 3.9% y/y drop in September industrial production growth. Thanks to pension increases in H1 and the deceleration in inflation, we believe real disposable income growth (which was negative earlier this year) will continue to recover
Risk of oil price collapse weighs on the RUB
RUB likely to appreciate next year, but by less than we previously anticipated
Q3 growth should be reasonably strong
Russian Economic Perspectives 19 October 2011
UBS 8
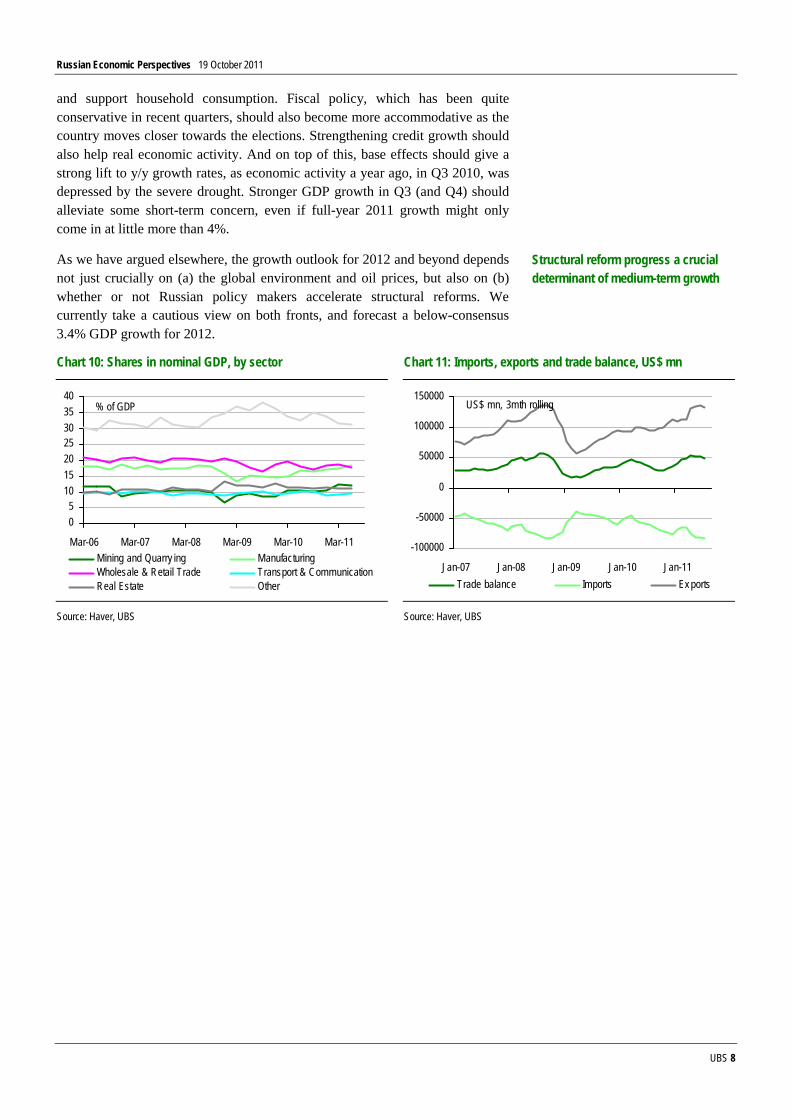
and support household consumption. Fiscal policy, which has been quite conservative in recent quarters, should also become more accommodative as the country moves closer towards the elections. Strengthening credit growth should also help real economic activity. And on top of this, base effects should give a strong lift to y/y growth rates, as economic activity a year ago, in Q3 2010, was depressed by the severe drought. Stronger GDP growth in Q3 (and Q4) should alleviate some short-term concern, even if full-year 2011 growth might only come in at little more than 4%.
As we have argued elsewhere, the growth outlook for 2012 and beyond depends not just crucially on (a) the global environment and oil prices, but also on (b) whether or not Russian policy makers accelerate structural reforms. We currently take a cautious view on both fronts, and forecast a below-consensus 3.4% GDP growth for 2012.
Chart 10: Shares in nominal GDP, by sector Chart 11: Imports, exports and trade balance, US$ mn
05
10152025303540
Mar-06 Mar-07 Mar-08 Mar-09 Mar-10 Mar-11Mining and Quarry ing Manufacturing Wholesale & Retail Trade Transport & Communication Real Estate Other
% of GDP
-100000
-50000
0
50000
100000
150000
Jan-07 Jan-08 Jan-09 Jan-10 Jan-11Trade balance Imports Ex ports
US$ mn, 3mth rolling
Source: Haver, UBS Source: Haver, UBS
Structural reform progress a crucial determinant of medium-term growth

Russian Economic Perspectives 19 October 2011
UBS 9
Gross domestic product Growth in H1 2011 disappointed, at 3.7% y/y, but we expect Q3 GDP growth of more than 5% y/y, thanks to stronger household consumption, public spending in the run-up to the elections, and positive base effects.
Chart 12: Real GDP and industrial production, % y/y Chart 13: Real GDP, % q/q and % y/y
-15
-10
-5
0
5
10
Mar-2006 Sep-2007 Mar-2009 Sep-2010
-20
-15
-10
-5
0
5
10
15
Real GDP, % y /y (lhs) IP, % y /y (rhs)
-15
-10
-5
0
5
10
Mar-06 Dec-06 Sep-07 Jun-08 Mar-09 Dec-09 Sep-10 Jun-11
-5-4-3-2-10123
Real GDP, % y /y (lhs) Real GDP, sa, % q/q (rhs)
Source: Haver, UBS Source: Haver, UBS
Chart 14: Real GDP, domestic demand & net exports, ppt Chart 15: Contributions to y/y GDP growth, by expenditure, ppt
-20
-15
-10
-5
0
5
10
15
Q1-2006 Q3-2007 Q1-2009 Q3-2010
Real GDP grow th, % y /y Domestic demand Net ex ports
contribution to y /y GDP grow th, ppt
-20-15-10-505
1015
Q1-2006 Q3-2007 Q1-2009 Q3-2010Gov t ex penditure Priv ate consumptionGFCF StocksNet ex ports Real GDP, % y /y
contribution to y /y grow th, ppt
Source: Haver, UBS Source: Haver, UBS
Chart 16: Contribution to US$ GDP growth Chart 17: GDP per capita, US$
-60
-40
-20
0
20
40
60
1997 1999 2001 2003 2005 2007 2009GDP deflator (inflation), %USD/RUB, av erage, % changeReal GDP grow th, %Nominal GDP grow th, USD, %
0
2000
4000
6000
8000
10000
12000
1997 1999 2001 2003 2005 2007 2009GDP per capita, US$
Source: Haver, UBS Source: Haver, UBS

Russian Economic Perspectives 19 October 2011
UBS 10
Gross domestic product (cont.)
Chart 18: Gross value added, by sector, % y/y Chart 19: Contributions to y/y GDP growth, by sector, ppt
-20-15-10-505
101520
Mar-06 Mar-07 Mar-08 Mar-09 Mar-10 Mar-11Real GVA MiningManufacturing Wholesale & retail tradeTransport & communication Real estate
% y /y
-10
-5
0
5
10
Q1-2006 Q3-2007 Q1-2009 Q3-2010Mining ManufacturingWholesale & retail trade Transport & communicationReal estate OtherReal GVA, % y /y
contribution to grow th, ppt
Source: Haver, UBS Source: Haver, UBS
Chart 20: Real and nominal GDP growth, % y/y Chart 21: Real and nominal GDP, indexed, Mar 2006=100
-12-8-4048
12162024283236
Mar-06 Mar-08 Mar-10Real GDP, % y /y Nominal GDP, % y /y
100
120
140
160
180
200
220
Mar-06 Mar-08 Mar-10Real GDP Nominal GDP
Index , Mar 2006=100 +19.6%
-2.8%
Source: Haver, UBS Source: Haver, UBS
Chart 22: Total output and real GDP growth Chart 23: Russia, Eurozone and Global real GDP growth, %
-15
-10
-5
0
5
10
Mar-2006 Sep-2007 Mar-2009 Sep-2010Total output (5 basic indicators), % y /y , 3mma (lhs)Real GDP, % y /y (rhs)
-8-6-4-202468
10
2001 2002 2003 2004 2005 2006 2007 2008 2009 2010
Russia Eurozone Global
%
Source: Haver, UBS Source: Haver, UBS

Russian Economic Perspectives 19 October 2011
UBS 11
Structure of GDP
Chart 24: Share of nominal GDP, by expenditure Chart 25: Share of nominal GDP, by expenditure
0
10
20
30
40
50
60
Mar-06 Mar-07 Mar-08 Mar-09 Mar-10 Mar-11
Gov t ex penditure Priv ate consumptionInv estment Ex portsImports Net ex ports
% of GDP
Gross Capital Formation
23%
Net ex ports8%
Gov t Ex penditure
18%
Priv ate consumption
51%
% of GDP
Source: Haver, UBS Source: Haver, UBS
Chart 26: Share of nominal GDP, by sector Chart 27: Share of nominal GDP, by sector
05
10152025303540
Mar-06 Mar-07 Mar-08 Mar-09 Mar-10 Mar-11Mining and Quarry ing Manufacturing Wholesale & Retail Trade Transport & Communication Real Estate Other
% of GDP
Other30%
Manufacturing 19%
Wholesale & Retail Trade
18%
Mining and Quarry ing
12%Real Estate
11%
Transport & Communicatio
n 10%
% of GDP
Source: Haver, UBS Source: Haver, UBS

Russian Economic Perspectives 19 October 2011
UBS 12
Private consumption
Chart 28: Private consumption and retail sales, % y/y Chart 29: Private consumption and consumer confidence
-10
-5
0
5
10
15
Mar-2006 Mar-2007 Mar-2008 Mar-2009 Mar-2010 Mar-2011
-10
-5
0
5
10
15
20
Real priv ate consumption, % y /y (lhs)Retail sales, % y /y (rhs)
-10
-5
0
5
10
15
Mar-06 Dec-06 Sep-07 Jun-08 Mar-09 Dec-09 Sep-10 Jun-11
-40-35-30-25-20-15-10-505
Priv ate consumption, real, % y /y (lhs)Consumer confidence (rhs)
Source: Haver, UBS Source: Haver, UBS
Chart 30: Private consumption and disposable income Chart 31: Sub-components of retail sales, % y/y
-10
-5
0
5
10
15
Mar-2006 Mar-2007 Mar-2008 Mar-2009 Mar-2010 Mar-2011
-10
-5
0
5
10
15
20
Real priv ate consumption, % y /y (lhs)Real disposable income, % y /y , 3mma (rhs)
-15-10-505
10152025
Jan-07 Jan-08 Jan-09 Jan-10 Jan-11Retail sales: Food Retail sales: Non-foodRetail sales: Serv ices Retail sales
% y /y
Source: Haver, UBS Source: Haver, UBS
Chart 32: Private consumption and car sales, % y/y Chart 33: Private consumption and car sales
-10
-5
0
5
10
15
20
Mar-2006 Sep-2007 Mar-2009 Sep-2010
-100
-50
0
50
100
150
Priv ate consumption, real, % y /y (lhs)Passenger car sales, % y /y (rhs)
-10
-5
0
5
10
15
20
Mar-2006 Sep-2007 Mar-2009 Sep-2010
050000
100000150000
200000250000
300000350000
Priv ate consumption, real, % y /y (lhs)Passenger car sales, units (rhs)
Source: Haver, UBS Source: Haver, UBS

Russian Economic Perspectives 19 October 2011
UBS 13
Investment
Chart 34: Fixed capital investment and business confidence Chart 35: Fixed capital investment and capacity utilisation
-30
-20
-10
0
10
20
30
Jan-07 Jan-08 Jan-09 Jan-10 Jan-11
-25-20-15-10-50510
Fix ed capital inv estment, real, % y /y (lhs)
Business confidence: Mfg (rhs)
-30
-20
-10
0
10
20
30
Jan-07 Jan-08 Jan-09 Jan-10 Jan-11
5355575961636567
Fix ed capital inv estment, real, % y /y (lhs)
Capacity utilisation: Mfg (rhs)
Source: Haver, UBS Source: Haver, UBS
Chart 36: Fixed capital investment and construction, % y/y Chart 37: Shares in fixed capital investment, by sector
-30
-20
-10
0
10
20
30
Jan-07 Jan-08 Jan-09 Jan-10 Jan-11
-40
-20
0
20
40
60
80
Fix ed capital inv estment, real, % y /y (lhs)
Construction: Value of w ork performed, % y /y (rhs)
0
5
10
15
20
25
1994 1997 2000 2003 2006 2009Mining ManufacturingElec, gas & w ater Transport & communicationReal estate & business activ ity Other
% of GDP
Source: Haver, UBS Source: Haver, UBS
Chart 38: Fixed capital investment and oil price, % y/y Chart 39: Fixed investment & inventories
-30
-20
-10
0
10
20
30
Jan-07 Jan-08 Jan-09 Jan-10 Jan-11
40
60
80
100
120
140
Fix ed capital inv estment, real, % y /y (lhs)Oil price, Urals, US$/bbl (rhs)
-1000
0
1000
2000
3000
4000
Q1-2007 Q1-2008 Q1-2009 Q1-2010 Q1-2011Gross fix ed capital formation Business inv entories
Gross capital formation
Source: Haver, UBS Source: Haver, UBS
Russian Economic Perspectives 19 October 2011
UBS 14
Foreign trade
Chart 40: Imports, exports and trade balance, US$ mn Chart 41: Imports, exports and trade balance, % y/y
-100000
-50000
0
50000
100000
150000
Jan-07 Jan-08 Jan-09 Jan-10 Jan-11Trade balance Imports Ex ports
US$ mn, 3mth rolling
-40-30-20-10
01020304050
Jan-07 Jan-08 Jan-09 Jan-10 Jan-11
100,000
120,000
140,000
160,000
180,000
200,000
Imports, 12mth rolling, % y /y (lhs)Ex ports, 12mth rolling, % y /y (lhs)Trade balance, US$ mn, 12mth rolling (rhs)
Source: Haver, UBS Source: Haver, UBS
Chart 42: Shares of exports, by country Chart 43: Share of exports, by country
0
5
10
15
Jan-07 Jan-08 Jan-09 Jan-10 Jan-11Netherlands Germany Ukraine
Belarus France US
Japan Finland Sw itzerland
Ex ports by country , % of total
Ukraine 6%
US3%
Others33%
Japan 3%
UK3%
Finland 3%
Kazakhstan 3%
Sw itzerland 2%
France 3%
Belarus 5%
Turkey 5%
China 6%
Italy 6%
Netherlands 12% Germany
7%
Ex ports by country
Source: Haver, UBS Source: Haver, UBS
Chart 44: Share of imports, by country Chart 45: Share of imports, by country
0
5
10
15
20
Jan-07 Jan-08 Jan-09 Jan-10 Jan-11China Ukraine USItaly Belarus Poland Kazakhstan Sw itzerland
Imports by country , % of total Others30%
Kazakhstan 2%
UK2%
Turkey 2%
Finland 2%
Netherlands 2%
Sw itzerland 1%
Poland 2%
Belarus 4%
Italy 4%
France 5%
Japan 5%
US5%
Ukraine 6%
China 16%
Germany 12%
Imports by country
Source: Haver, UBS Source: Haver, UBS

Russian Economic Perspectives 19 October 2011
UBS 15
IP and other production indices
Chart 46: Five basic indicators, % y/y Chart 47: IP, oil production and construction, % y/y
-20
-10
0
10
20
30
Jan-07 Oct-07 Jul-08 Apr-09 Jan-10 Oct-10 Jul-11Total output AgricultureConstruction Industrial productionRetail trade Transportation
%
-30
-20
-10
0
10
20
Jan-07 Jan-08 Jan-09 Jan-10 Jan-11
-20-100102030405060
Industrial production (lhs) Manufacturing production (lhs)
Crude oil production (lhs) Construction (rhs)
%
Source: Haver, UBS Source: Haver, UBS
Chart 48: Energy production, % y/y Chart 49: Industrial production and capacity utilisation
-30
-20
-10
0
10
20
30
Jan-07 Jan-08 Jan-09 Jan-10 Jan-11Coal production, % y /y Crude oil production, % y /yElectricity production, % y /y Natural gas production, % y /y
-20
-15
-10
-5
0
5
10
15
Jan-07 Jan-08 Jan-09 Jan-10 Jan-11
53
55
57
59
61
63
65
67
IP, % y /y (lhs) Capacity utilisation: Manufacturing (rhs)
Source: Haver, UBS Source: Haver, UBS
Chart 50: Oil production and oil price Chart 51: Industrial production and oil price
0
2
4
6
8
10
Jan-02 Jan-04 Jan-06 Jan-08 Jan-10
0
20
40
60
80
100
120
140
Oil production, mbd (lhs) Oil price, urals, $/bbl (rhs)
-20
-15
-10
-5
0
5
10
15
Jan-07 Jan-08 Jan-09 Jan-10 Jan-11
20
40
60
80
100
120
140
IP, % y /y (lhs) Oil price, urals, $/bbl (rhs)
Source: Haver, US Energy Information Administration, UBS Source: Haver, UBS

Russian Economic Perspectives 19 October 2011
UBS 16
Economic activity – short-term indicators
Chart 52: Business and consumer confidence Chart 53: Business confidence and oil price
-25
-20
-15
-10
-5
0
5
10
Jan-2007 Jan-2008 Jan-2009 Jan-2010 Jan-2011
-40-35-30-25-20-15-10-505
Business confidence (lhs) Consumer confidence (rhs)
-25-20-15-10-505
1015
Jan-07 Oct-07 Jul-08 Apr-09 Jan-10 Oct-10 Jul-11
020406080100120140
Business confidence: Manufacturing (lhs)Business confidence: Mining (lhs)Oil price, Urals, US$/bbl (rhs)
Source: Haver, UBS Source: Haver, UBS
Chart 54: Industrial production and PMI Chart 55: Sub-components of PMI
-30-25-20-15-10-505
1015
Jan-07 Jan-08 Jan-09 Jan-10 Jan-11
30
35
40
45
50
55
60
Total IP, % y /y (lhs) Mfg IP, % y /y (lhs) Mfg PMI (rhs)
30354045505560
Jan-07 Jan-08 Jan-09 Jan-10 Jan-11Mfg PMI OutputNew orders Employ mentStock of finished goods New ex port ordersServ ices PMI
Source: Haver, UBS Source: Haver, UBS
Chart 56: Russia and global PMI versus oil price
30
35
40
45
50
55
60
Jan-07 Jan-08 Jan-09 Jan-10 Jan-11
40
60
80
100
120
140
Russia manufacturing PMI (lhs) Global manufacturing PMI (lhs)
Oil price, Urals, US$/bbl (rhs)
Source: Haver, UBS

Russian Economic Perspectives 19 October 2011
UBS 17
UBS Russian Lead Economic Indicator1 Chart 57: UBS lead economic indicator and IP Chart 58: UBS lead economic indicator and IP
-1.5
-1.0
-0.5
0.0
0.5
1.0
Jan-07 Jan-08 Jan-09 Jan-10 Jan-11
-20
-15
-10
-5
0
5
10
15
UBS lead economic indicator (lhs) IP % y /y , sa (rhs)
-1.5
-1.0
-0.5
0.0
0.5
1.0
Jan-07 Jan-08 Jan-09 Jan-10 Jan-11
1.201.251.301.351.401.451.501.551.60
UBS lead economic indicator (lhs) IP index , sa (rhs)
index , Jan01=1
Source: Haver, UBS Source: Haver, UBS
Chart 59: UBS diffusion index Chart 60: UBS lead economic indicator and oil price
-8-6-4-202468
Jan-08 Jul-08 Jan-09 Jul-09 Jan-10 Jul-10 Jan-11 Jul-11Orders Reserv esM2 CDS spreadOil price House prices3mth interbank rates UBS diffusion index
-1.2-1.0-0.8-0.6-0.4-0.20.00.20.40.6
Jan-07 Jan-08 Jan-09 Jan-10 Jan-11
30
50
70
90
110
130
150
UBS lead economic indicator (lhs) Oil price, US$/bbl (rhs)
Source: Haver, UBS Source: Haver, UBS
Chart 61: UBS EMEA lead economic indicators
-3.00-2.50-2.00-1.50-1.00-0.500.000.501.001.50
Jan-07 Jul-07 Jan-08 Jul-08 Jan-09 Jul-09 Jan-10 Jul-10 Jan-11 Jul-11Russia Turkey South Africa Israel Czech Republic Hungary Poland EMEA
Source: Haver, UBS. 1For a technical introduction to our lead indicators, see ‘Q-Series: EMEA Economic Perspectives, When will EMEA turn the corner?’, 10 July 2009. For the latest update of our lead indicators for seven EMEA economies, see ‘EMEA Lead Economic Indicator, EMEA: clear slowdown, but no recession’, 31 August 2011.

Russian Economic Perspectives 19 October 2011
UBS 18
Labour market and income Real disposable income was negative earlier this year, as rising inflation eroded the purchase power of incomes; this weighed on household consumption. Recent developments in real disposable income have been better, however, and this suggests a strengthening in household consumption.
Chart 62: Wages, pensions, disposable income and CPI, % y/y Chart 63: Unemployment rate and y/y change
-100
102030405060
Jan-07 Jan-08 Jan-09 Jan-10 Jan-11Nominal w ages, % y /yReal disposable income, % y /yPensions, % y /yReal w ages, % y /yCPI, % y /y
-2
0
2
4
6
8
10
Jan-07 Jan-08 Jan-09 Jan-10 Jan-11Unemploy ment change, y /y , in pptUnemploy ment rate, NSA, %Unemploy ment rate, SA, %
Source: Haver, UBS Source: Haver, UBS
Chart 64: Employment Chart 65: Employment, unemployment and labour force
69.0
69.5
70.0
70.5
71.0
71.5
72.0
Jan-07 Jan-09 Jan-11
-3
-2
-1
0
1
2
3
Employ ment, mn (lhs) Employ ment, % y /y (rhs)
-3-2-101234
Jan-07 Jan-09 Jan-11
-20-100102030405060
Employ ment, % y /y (lhs) Labour force, % y /y (lhs)
Unemploy ment, % y /y (rhs)
Source: Haver, UBS Source: Haver, UBS

Russian Economic Perspectives 19 October 2011
UBS 19
Inflation After peaking at 9.6% y/y in May, inflation is now declining; by September, the rate had fallen to 7.2%. We expect inflation to hover around or slightly above 7% until end-2011, before moving lower in H1 2012.
Chart 66: CPI, core CPI and PPI, % y/y Chart 67: Main components of CPI, % y/y
-12-606
1218243036
Jan-07 Jan-08 Jan-09 Jan-10 Jan-11CPI, % y /y Core CPI, % y /y PPI, % y /y
2
7
12
17
22
Jan-07 Jan-08 Jan-09 Jan-10 Jan-11CPI Core CPIFood (inc. alcohol) Non-food goodsServ ices
%
Source: Haver, UBS Source: Haver, UBS
Chart 68: Contributions to y/y CPI growth, ppt Chart 69: CPI and M2 money supply, % y/y
02468
10121416
Jan-07 Jan-08 Jan-09 Jan-10 Jan-11Food (inc. alcohol) Non-food goodsServ ices CPI, % y /y
contribution to y /y CPI grow th,
4
14
24
34
44
54
64
Jan-07 Jan-08 Jan-09 Jan-10 Jan-11CPI, % y /y M2 money supply , % y /y
Source: Haver, UBS Source: Haver, UBS
Chart 70: CPI, oil price and Economist global food index Chart 71: CPI forecast, % y/y
5
7
9
11
13
15
Jan-07 Jan-08 Jan-09 Jan-10 Jan-11
-70
-20
30
80
130
CPI, % y /y (lhs)Oil price, urals, % y /y (rhs)Economist global food index , % y /y (rhs)
02468
10121416
Jan-07 Jan-08 Jan-09 Jan-10 Jan-11 Jan-12CPI, % y /y
forecast
Source: Haver, Thomson Reuters, UBS Source: Haver, UBS

Russian Economic Perspectives 19 October 2011
UBS 20
Money and credit Credit growth continues to recover.
Chart 72: Private sector credit and M2, % y/y Chart 73: Corporate and retail loans and deposits, % y/y
-10
0
10
20
30
40
50
60
Jan-07 Jan-08 Jan-09 Jan-10 Jan-11Priv ate sector credit, % y /y M2, % y /y
-20
0
20
40
60
80
100
Jan-07 Jan-08 Jan-09 Jan-10 Jan-11Corporate loans, % y /y Retail loans, % y /yCorporate deposits, % y /y * Retail deposits, % y /y
Source: Haver, UBS Source: Haver, UBS
Chart 74: Private sector credit and deposits, % y/y Chart 75: Private sector credit and deposits, % of GDP
-20
0
20
40
60
80
Jan-07 Jan-08 Jan-09 Jan-10 Jan-11
90
100
110
120
130
Priv ate sector credit, % y /y (lhs)Priv ate sector deposits, % y /y (lhs)Loan-to-deposit ratio, % (rhs)
20
25
30
35
40
45
50
Jan-07 Jan-08 Jan-09 Jan-10 Jan-11
9095100105110115120125130
Priv ate sector credit, % of GDP (lhs)Priv ate sector deposits, % of GDP (lhs)Loan-to-deposit ratio, % (rhs)
Source: Haver, UBS Source: Haver, UBS
Chart 76: Private sector credit, % of GDP Chart 77: Russia credit growth versus peers, % y/y
0
10
20
30
40
50
Jan-07 Jan-08 Jan-09 Jan-10 Jan-11Retail loans, % of GDP Corporate loans, % of GDP
-20
0
20
40
60
80
100
Jan-07 Jan-08 Jan-09 Jan-10 Jan-11Ukraine Kazakhstan TurkeySouth Africa Poland Russia
% y /y
Source: Haver, UBS Source: Haver, UBS

Russian Economic Perspectives 19 October 2011
UBS 21
Trade and current account Russia’s current account continues to enjoy a healthy surplus. Our rule of thumb is that a US$10/bbl change in the price of oil will change Russia’s current account balance by 1.5% of GDP.
Chart 78: Sub-components of current account, US$ bn Chart 79: Sub-components of current account, % of GDP
-50
0
50
100
150
200
Jan-08 Jul-08 Jan-09 Jul-09 Jan-10 Jul-10 Jan-11 Jul-11Current account Trade Serv ices
Income Transfers
US$ bn, 12mth
-5
0
5
10
15
Jan-08 Jul-08 Jan-09 Jul-09 Jan-10 Jul-10 Jan-11 Jul-11Current account Trade Serv ices
Income Transfers
% of
Source: Haver, UBS Source: Haver, UBS
Chart 80: Exports, imports and trade balance Chart 81: Current account and oil price
-60-40-20
020406080
Jan-08 Aug-08 Mar-09 Oct-09 May -10 Dec-10 Jul-11
100
120
140
160
180
200
Ex ports, % y /y (lhs)Imports, % y /y (lhs)Trade balance, 12mth cumulativ e, US$ bn (rhs)
2
4
6
8
10
12
Q1-2006 Q3-2007 Q1-2009 Q3-2010
405060708090100110120
Current account, % of GDP (lhs) Oil price, Urals, US$/bbl (rhs)
Source: Haver, UBS Source: Haver, UBS
Chart 82: Oil and non-oil current account balance, US$ mn Chart 83: Oil and non-oil current account balance, % of GDP
-300000-200000-100000
0100000200000300000400000
Mar-06 Mar-07 Mar-08 Mar-09 Mar-10 Mar-11Oil current account balance, US$ mn, 12mth rolling
Non-oil current account balance, US$mn, 12mth rolling
-20-15-10-505
10152025
Mar-06 Mar-07 Mar-08 Mar-09 Mar-10 Mar-11
Oil current account balance, % of GDP
Non-oil current account balance, % of GDP
Source: Haver, UBS Source: Haver, UBS

Russian Economic Perspectives 19 October 2011
UBS 22
Financial account and FX reserves
Chart 84: Sub-components of financial account, US$ mn Chart 85: Sub-components of financial account, % of GDP
-150,000
-100,000
-50,000
0
50,000
100,000
150,000
Q1-2006 Q3-2007 Q1-2009 Q3-2010Current account FDIPortfolio Deriv ativ esOther inv estment E&O
12mth cumulativ e, US$ mn
-10
-5
0
5
10
15
Q1-2006 Q3-2007 Q1-2009 Q3-2010Current account FDIPortfolio Deriv ativ esOther inv estment E&O
% of GDP
Source: Haver, UBS Source: Haver, UBS
Chart 86: Current account, net FDI and basic balance, US$ mn Chart 87: Private capital flows and oil price
-20,0000
20,00040,00060,00080,000
100,000120,000140,000160,000
Q1-2006 Q3-2007 Q1-2009 Q3-2010
Current account Net FDI Basic balance
12mth cumulativ e, US$ mn
-120000
-90000
-60000
-30000
0
30000
60000
Q1-2006 Q3-2007 Q1-2009 Q3-2010
20
40
60
80
100
120
Priv ate capital flow s, US$ mn (lhs)Oil price, Urals, US$/bbl (rhs)
Source: Haver, UBS Source: Haver, UBS
Chart 88: Foreign exchange reserves, US$ bn Chart 89: FX reserves and USD/RUB
0
100
200
300
400
500
600
Jan-08 Oct-08 Jul-09 Apr-10 Jan-11Reserv e fund National w elfare fundOther fx reserv es Reserv e position in the IMFSDRs Gold
US$ bn
300000
350000
400000
450000
500000
550000
600000
Jan-07 Jan-08 Jan-09 Jan-10 Jan-11
22
24
26
28
30
32
34
36
FX reserv es, US$ mn (lhs) USD/RUB, inv erted (rhs)
Source: Haver, UBS Source: Haver, UBS
Russian Economic Perspectives 19 October 2011
UBS 23
External debt & international investment position
Chart 90: External debt, by sector, US$ bn Chart 91: External debt, by maturity, US$ bn
0
100
200
300
400
500
600
Mar-06 Mar-07 Mar-08 Mar-09 Mar-10 Mar-11Ex ternal debt: Priv ate sector (non-banks)Ex ternal debt: BanksEx ternal debt: Public sector
US$ bn
0
100
200
300
400
500
600
Mar-06 Mar-07 Mar-08 Mar-09 Mar-10 Mar-11Ex ternal debt: Short-term Ex ternal debt: Long-term
US$ bn
Source: Haver, UBS Source: Haver, UBS
Chart 92: International investment position – Assets, US$ mn Chart 93: International investment position - Liabilities, US$ mn
0
200000400000
600000800000
10000001200000
1400000
2000 2001 2002 2003 2004 2005 2006 2007 2008 2009 2010Direct Inv estment Abroad Portfolio Inv estment Other Inv estment Reserv e Assets
US$ mn IIP: Assets
0
200000
400000
600000800000
1000000
1200000
1400000
2000 2001 2002 2003 2004 2005 2006 2007 2008 2009 2010Direct Inv estment in Russia Portfolio Inv estment Other Inv estment
US$ mn IIP: Liabilities
Source: Haver, UBS Source: Haver, UBS
Chart 94: Net foreign assets of banks, US$ mn Chart 95: Net foreign assets of private sector (non-banks)
-150000-100000-50000
050000
100000150000200000250000
2003 2004 2005 2006 2007 2008 2009 2010Assets of banks Liabilities of banks
Net foreign assets of banks
US$ mn
-600000
-400000
-200000
0
200000
400000
600000
2000 2002 2004 2006 2008 2010Assets of priv ate sector (non-banks)Liabilities of priv ate sector (non-banks)Net foreign assets of priv ate sector (non-banks)
US$ mn
Source: Haver, UBS Source: Haver, UBS

Russian Economic Perspectives 19 October 2011
UBS 24
Fiscal policy We expect only small fiscal deficit of 0-1% of GDP in 2011. Our rule of thumb is that a US$10/bbl change in the price of oil will change Russia’s current account balance by 1.5% of GDP.
Chart 96: Budget balance and public sector debt, % of GDP Chart 97: Federal budget balance and oil price forecast
-6-4-202468
10
2001 2003 2005 2007 2009 2011F
0
10
20
30
40
Federal budget balance, % of GDP (lhs)Primary budget balance, % fo GDP (lhs)Public sector debt, % of GDP (rhs)
-6-4-20
2468
2001 2003 2005 2007 2009 2011F
20
40
60
80
100
120
Federal budget balance, % of GDP (lhs)
Oil price, brent, US$/bbl (rhs)
Source: Haver, UBS Source: Haver, UBS
Chart 98: Consolidated and federal budget balance, % of GDP Chart 99: Public sector external and domestic debt, % of GDP
-8-6-4-202468
10
Jan-07 Jan-08 Jan-09 Jan-10 Jan-11
Consolidated budget, % of GDP Federal budget, % of GDP
05
10152025303540
2001 2003 2005 2007 2009 2011FPublic debt: Ex ternal, % of GDP Public debt: Domestic, % of GDP
Source: Haver, UBS Source: Haver, UBS
Chart 100: Consolidated revenues and expenditures, % of GDP Chart 101: Consolidated govt revenue and expenditure, % y/y
30323436
38404244
Jan-07 Jan-08 Jan-09 Jan-10 Jan-11Consolidated rev enues, % of GDP
Consolidated ex penditures, % of GDP
-40-20
020
406080
100
Jan-07 Jan-08 Jan-09 Jan-10 Jan-11Consolidated rev enues, % y /y
Consolidated ex penditures, % y /y
% y /y , 3mma
Source: Haver, UBS Source: Haver, UBS

Russian Economic Perspectives 19 October 2011
UBS 25
Chart 102: Federal revenues and expenditures, % of GDP Chart 103: Federal government revenue and expenditure, % y/y
15
17
19
21
23
25
Jan-05 Jan-07 Jan-09 Jan-11Federal rev enues, % of GDP Federal ex penditures, % of GDP
-40
-20
0
20
40
60
Jan-07 Jan-08 Jan-09 Jan-10 Jan-11Federal rev enues, % y /y Federal ex penditures, % y /y
3mma
Source: Haver, UBS Source: Haver, UBS
Chart 104: Federal budget balance, incl. and ex. oil, RUB bn Chart 105: Federal budget balance, incl. and ex. oil, % of GDP
-6000
-4000
-2000
0
2000
4000
Jan-07 Jan-08 Jan-09 Jan-10 Jan-11Federal budget balance, ex cl. oil, RUB bn, 12mth rollingFederal budget balance, incl. Oil, RUB bn, 12mth rolling
-20
-15
-10
-5
0
5
10
Jan-07 Jan-08 Jan-09 Jan-10 Jan-11Federal budget balance, incl. Oil, % of GDP
Federal budget balance ex cl. oil, % of GDP
Source: Haver, UBS Source: Haver, UBS
Chart 106: Federal oil and non-oil revenues, % of GDP Chart 107: Federal oil and non-oil revenues, % of total
0
5
10
15
20
25
Jan-07 Jan-08 Jan-09 Jan-10 Jan-11Oil rev enues, % of GDP Non-oil rev enues, % of GDP
35
40
45
50
55
60
65
Jan-07 Jan-08 Jan-09 Jan-10 Jan-11Oil rev enues, % of total rev enuesNon-oil rev enues, % of total rev enues
Source: Haver, UBS Source: Haver, UBS

Russian Economic Perspectives 19 October 2011
UBS 26
Monetary policy Chart 108: Monetary policy and inflation outlook
0
2
4
6
8
10
12
Sep-09 Mar-10 Sep-10 Mar-11 Sep-11 Mar-12 Sep-12CPI, % y /y Ov ernight CBR deposit rate, % Refinancing rate, % 1 day repo, %
forecast
Source: Haver, CBR, UBS
Chart 109: CBR policy rates and interbank rates, %
0
2
4
6
8
10
12
Sep-09 Dec-09 Mar-10 Jun-10 Sep-10 Dec-10 Mar-11 Jun-11 Sep-11Mosprime 3mth Mosprime 1mthMosprime ov ernight CBR 1 day repo CBR ov ernight CBR deposit CBR refinancing rate
Policy corridor
%
Source: Haver, UBS
Chart 110: Banking liquidity, RUB bn
0
200
400
600
800
1000
1200
1400
1600
Jan-08 Jul-08 Jan-09 Jul-09 Jan-10 Jul-10 Jan-11 Jul-11Correspondent accounts w ith Bank of Russia Bank deposits w ith Bank of Russia
Source: CBR, UBS
CBR Refinancing rate at 8.25% CBR repo rate at 5.25% CBR deposit rate at 3.25%
Interbank rates have recently increased amid tighter liquidity and reduced confidence
Russian banks have reduced their voluntary deposits with the CBR in order to satisfy greater liquidity demands

Russian Economic Perspectives 19 October 2011
UBS 27
The Rouble
Chart 111: RUB against USD, EUR and USD-EUR basket Chart 112: RUB against USD, EUR and USD-EUR basket, index
22
26
30
34
38
42
46
Jan-07 Jan-08 Jan-09 Jan-10 Jan-11USD/RUB RUB v s basket EUR/RUB
90
95
100
105
110
Jan-11 Mar-11 May -11 Jul-11 Sep-11
USD/RUB RUB v s basket EUR/RUB
index , Jan11=100
Source: Haver, UBS Source: Haver, UBS
Chart 113: Nominal and real effective exchange rates Chart 114: Oil price and USD/RUB
80
90
100
110
120
130
140
Jan-07 Jan-08 Jan-09 Jan-10 Jan-11NEER REER
appreciation
40
60
80
100
120
140
Jan-07 Jan-08 Jan-09 Jan-10 Jan-11
22
24
26
28
30
32
34
36
Oil price, Urals, US$/bbl (lhs) USD/RUB, inv erted (rhs)
Source: Haver, UBS Source: Haver, UBS
Chart 115: USD/RUB and UBS Global FX risk indicator Chart 116: Oil price and UBS Global FX risk indicator
222426283032343638
Jan-07 Jan-08 Jan-09 Jan-10 Jan-11
-2
-1
0
1
2
3
4
USD/RUB (lhs) UBS' Global FX risk indicator (rhs)
40
60
80
100
120
140
Jan-07 Jan-08 Jan-09 Jan-10 Jan-11
-2
-1
0
1
2
3
4
Oil price, urals, US$/bbl (lhs)UBS' Global FX risk indicator (rhs)
Source: Haver, UBS Source: Haver, UBS
Russian Economic Perspectives 19 October 2011
UBS 28
Financial markets
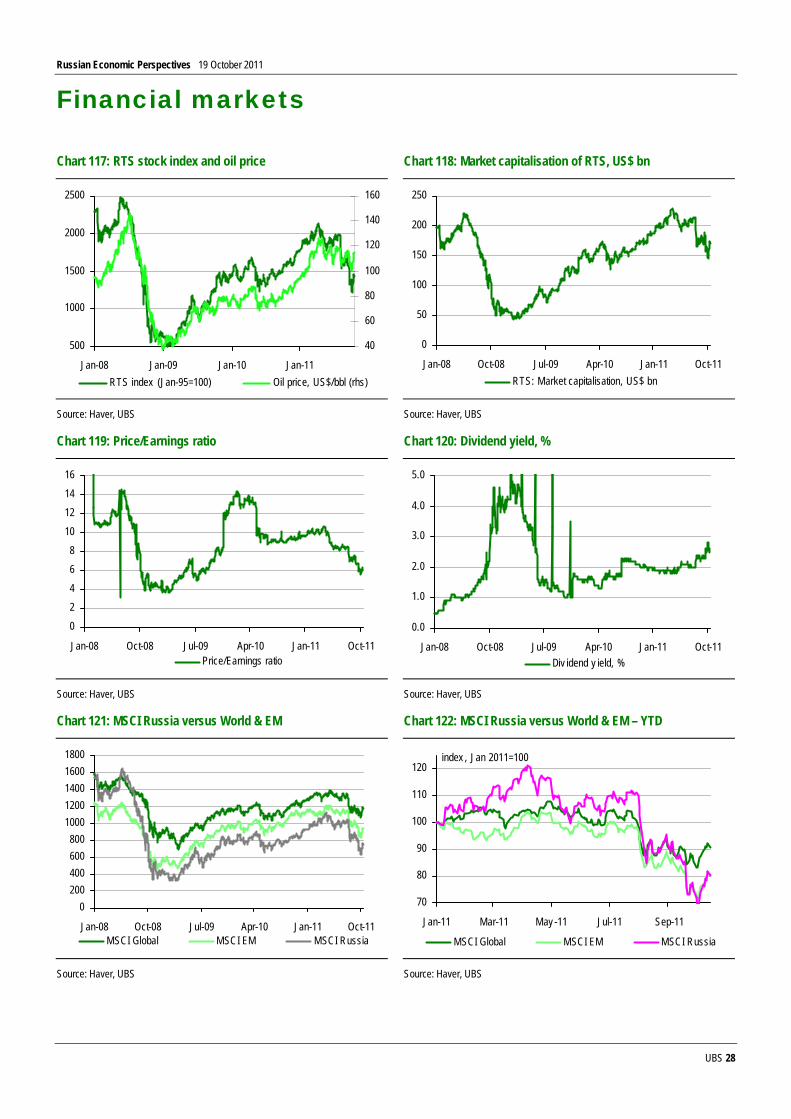
Chart 117: RTS stock index and oil price Chart 118: Market capitalisation of RTS, US$ bn
500
1000
1500
2000
2500
Jan-08 Jan-09 Jan-10 Jan-11
40
60
80
100
120
140
160
RTS index (Jan-95=100) Oil price, US$/bbl (rhs)
0
50
100
150
200
250
Jan-08 Oct-08 Jul-09 Apr-10 Jan-11 Oct-11RTS: Market capitalisation, US$ bn
Source: Haver, UBS Source: Haver, UBS
Chart 119: Price/Earnings ratio Chart 120: Dividend yield, %
02468
10121416
Jan-08 Oct-08 Jul-09 Apr-10 Jan-11 Oct-11Price/Earnings ratio
0.0
1.0
2.0
3.0
4.0
5.0
Jan-08 Oct-08 Jul-09 Apr-10 Jan-11 Oct-11Div idend y ield, %
Source: Haver, UBS Source: Haver, UBS
Chart 121: MSCI Russia versus World & EM Chart 122: MSCI Russia versus World & EM – YTD
0200400600800
10001200140016001800
Jan-08 Oct-08 Jul-09 Apr-10 Jan-11 Oct-11MSCI Global MSCI EM MSCI Russia
70
80
90
100
110
120
Jan-11 Mar-11 May -11 Jul-11 Sep-11
MSCI Global MSCI EM MSCI Russia
index , Jan 2011=100
Source: Haver, UBS Source: Haver, UBS

Russian Economic Perspectives 19 October 2011
UBS 29
Chart 123: Eurobond yields, % Chart 124: Eurobond spreads versus US Treasuries, bp
0
1
2
3
4
5
6
Apr-10 May -10 Jun-10 Jul-10 Aug-10 Sep-10
Apr-15 Jul-18 Apr-20
Eurobond y ields, %
100
150
200
250
300
350
400
Apr-10 Jul-10 Oct-10 Jan-11 Apr-11 Jul-11Apr-15 Jul-18 Apr-20
Eurobond spreads v s US, bp
Source: Bloomberg, UBS Source: Bloomberg, UBS
Chart 125: Local currency bond yields, % Chart 126: Local currency yield curve
0
2
4
68
10
12
14
Jan-08 Oct-08 Jul-09 Apr-10 Jan-11 Oct-111y r 2y r 5y r 10y r 15y r20y r 30y r
Local currency bond y ields, %
4
5
6
7
8
9
10
111y
r2y
r
5yr
10yr
15yr
20yr
30yr
17-Oct-11 03-Jan-11 01-Jan-10
Source: Haver, UBS. GKO and OFZ bond yields Source: Haver, UBS. GKO and OFZ bond yields
Chart 127: CDS spreads (5-yr) Chart 128: CDS spread (5-yr) and oil price
100
300
500
700
900
1100
Jan-08 Jul-08 Jan-09 Jul-09 Jan-10 Jul-10 Jan-11 Jul-11Russia CDS
0
200
400
600
800
1000
Jan-08 Jul-08 Jan-09 Jul-09 Jan-10 Jul-10 Jan-11 Jul-11
40
60
80
100
120
140
Russia CDS (lhs) Oil price, Urals, US$/bbl, inv erted (rhs)
Source: Reuters, UBS Source: Bloomberg, Haver, UBS

Russian Economic Perspectives 19 October 2011
UBS 30
Russia in a regional context Chart 129: EMEA real GDP, % y/y Chart 130: EMEA private sector credit, % y/y
-15
-10
-5
0
5
10
15
Q1-05 Q1-06 Q1-07 Q1-08 Q1-09 Q1-10 Q1-11Turkey Poland IsraelCzech Republic South Africa HungaryRussia
% y/y
-15-55
152535455565
Jan-2007 Jan-2008 Jan-2009 Jan-2010 Jan-2011Czech Republic Hungary PolandTurkey Israel South AfricaUkraine Kazakhstan EgyptRomania Russia
% y/y
Source: Haver, UBS Source: Haver, EMED, UBS
Chart 131: EMEA PMIs Chart 132: UBS Lead Economic Indicators
25
35
45
55
65
Jan-07 Oct-07 Jul-08 Apr-09 Jan-10 Oct-10 Jul-11Turkey Poland IsraelCzech Republic South Africa HungaryRussia EMEA Euro areaGermany US
-3.00-2.50-2.00-1.50-1.00-0.500.000.501.001.50
Jan-07 Jan-08 Jan-09 Jan-10 Jan-11Russia TurkeySouth Africa IsraelCzech Republic HungaryPoland EMEA
Source: Haver, UBS Source: Haver, UBS
Chart 133: EMEA CDS spreads (5-yr) Chart 134: EMEA exchange rates versus USD
0100200300400500600700800900
1000
Jun-10 Sep-10 Dec-10 Mar-11 Jun-11 Sep-11Russia Turkey Czech Republic EgyptHungary Israel Kazakhstan PolandSouth Africa Ukraine
80
90
100
110
120
130
Jan-11 Mar-11 May -11 Jul-11 Sep-11PLN/USD RON/USD HUF/USD CZK/USDILS/USD ZAR/USD EUR/USD GBP/USDTRY/USD RUB/USD
w eakness v s. US$
Source: Bloomberg, UBS Source: Thomson Reuters, UBS

Russian Economic Perspectives 19 October 2011
UBS 31
Chart 135: Share of food in CPI baskets, % Chart 136: Production of crude oil, mn barrels daily, June-11
15.4 11.7 10.6 9.5 10.1 6.6 5.9 5.1 3.9 4.6 4.8
37.8
39.927.1 24.4 23.6 16.6
14.8 14.9 12.2 12.6 11.1 10.5
15.7 15.316.617.420.821.426.8
33.235.038.839.9
53.3
0
10
2030
40
50
60
Uk Eg* Kz Rm Ru Tk Pl Hu Cz Is SA
EMU
Unprocessed food Processed food*Total food as no split for Egy pt
0
2
46
8
10
12
Saud
iRu
ssia US
China Ira
nCa
nada
UAE
Mex
icoBr
azil
Kuwa
itIra
qNi
geria
Vene
zuela
Alger
iaNo
rway
Kaza
khsta
Qatar
Oman
Libya UK
Bahr
ain
Source: Haver, Eurostat, National Statistical Offices, UBS Source: US energy information administration, UBS
Chart 137: BRIC population growth, % Chart 138: BRIC GDP per capita, US$
-1.0
-0.5
0.0
0.5
1.0
1.5
2.0
2.5
1993 1996 1999 2002 2005 2008 2011Brazil Russia India China
forecast
0
2000
4000
6000
8000
10000
12000
14000
2000 2002 2004 2006 2008 2010 2012Brazil Russia India China
forecast
Source: United Nations, Haver, UBS Source: Haver, UBS
Chart 139: Ease of doing business & Corruption index Chart 140: Budget break-even oil prices for 2011, US$
0
50
100
150
200
0 2 4 6 8 10
Ease of doing business, rank, 2010, World Bank
Corruption Perceptions index , 2010, Transparency InternationalCorrupt Clean
Less
More
Russia
0
20
40
60
80
100
120
Kuwa
it
Qata
r
Oman
UAE
Iran
Saud
i Ara
bia
Alge
ria
Bahr
ain Iraq
Russ
iaBrent oil price 2011 forecast,
Source: World Bank, Transparency International, UBS Source: IIF, UBS

Russian Economic Perspectives 19 October 2011
UBS 32
Russia, Ukraine and Kazakhstan Chart 141: Real GDP, % y/y Chart 142: Real GDP in index terms (seasonally adjusted)
-15
-10
-5
0
5
10
15
2005 2006 2007 2008 2009 2010 2011 2012Russia Kazakhstan Ukraine
forecast
100
120
140
160
180
200
220
Mar-02 Mar-04 Mar-06 Mar-08 Mar-10Russia Kazakhstan Ukraine
Source: Haver, UBS Source: Haver, UBS
Chart 143: Budget balances, % of GDP Chart 144: Public sector debt, % of GDP
-10-8-6-4-202468
10
2005 2006 2007 2008 2009 2010 2011 2012Russia Kazakhstan Ukraine
forecast
05
10152025303540
2005 2006 2007 2008 2009 2010 2011 2012
Russia Kazakhstan Ukraine
forecast
Source: Haver, UBS Source: Haver, UBS
Chart 145: Current account balances, % of GDP Chart 146: FX reserve levels, US$ mn
-8-6-4-202468
1012
2005 2006 2007 2008 2009 2010 2011 2012Russia Kazakhstan Ukraine
forecast
300,000350,000
400,000450,000500,000
550,000600,000
Jan-07 Jan-08 Jan-09 Jan-10 Jan-11
20,00030,000
40,00050,00060,000
70,00080,000
Russia (inc. Reserv e and national Welfare Fund) (lhs)Kazakhstan (inc. assets of National Oil Fund) (rhs)Ukraine (rhs)
Source: Haver, UBS Source: Haver, UBS

Russian Economic Perspectives 19 October 2011
UBS 33
Chart 147: Inflation, % Chart 148: M2 money supply growth, % y/y
0
5
10
15
20
25
2005 2006 2007 2008 2009 2010 2011 2012
Russia Kazakhstan Ukraine
forecast
-20
0
20
40
60
80
100
Jan-07 Jan-08 Jan-09 Jan-10 Jan-11Russia Kazakhstan Ukraine
Source: Haver, UBS Source: Haver, UBS
Chart 149: Credit growth, % y/y Chart 150: NPLs as % of total loans
-100
1020304050607080
Jan-2002 Oct-2003 Jul-2005 Apr-2007 Jan-2009 Oct-2010Russia Kazakhstan Ukraine
% y/y
05
1015202530354045
2005 2006 2007 2008 2009 2010Russia Kazakhstan Ukraine
Source: Haver, UBS Source: IMF Global Financial Stability Report, UBS
Chart 151: MSCI equity market performance - YTD Chart 152: CDS spreads
5060708090
100110120130
Jan-11 Mar-11 May -11 Jul-11 Sep-11
Hungary Poland Kazakhstan Ukraine
Russia Turkey S Africa
0100200300400500600700800900
1000
Jan-11 Apr-11 Jul-11 Oct-11Turkey Kazakhstan South AfricaUkraine Russia
Source: Thomson Reuters, UBS Source: Bloomberg, UBS

Russian Economic Perspectives 19 October 2011
UBS 34
Data and forecast tables Table 1: Macroeconomic monthly data
Dec-10 Jan-11 Feb-11 Mar-11 Apr-11 May-11 Jun-11 Jul-11 Aug-11 Sep-11Economy Activity Indicators Real GDP growth, % y/y 4.5 4.1 3.4 IP, % y/y 6.3 6.7 5.8 5.3 4.5 4.1 5.7 5.2 6.2 3.9 Capacity utilization, % 61.0 60.0 60.0 61.0 62.0 62.0 62.0 62.0 63.0 63.0 Retail sales, % y/y 6.9 3.9 6.0 5.1 5.8 5.8 5.9 5.7 7.8 Investment and construction Fixed capital investment, RUB bn, ytd 1,625 346 461 536 590 753 900 802 920 Fixed capital investment, % y/y 19.4 2.1 9.4 6.7 13.2 19.1 18.8 17.9 13.1 Fixed capital investment, real, % y/y 10.1 -4.7 -0.4 -0.3 2.2 7.4 4.7 7.9 6.5 Construction: Value of work performed, RUB bn 645 184 198 282 308 330 426 480 480 Construction: Value of work performed, % y/y 22.4 8.9 11.5 15.4 8.1 12.3 12.0 29.1 24.0 Business surveys Business confidence: Manufacturing -6.0 -4.0 -1.0 0.0 -1.0 -1.0 0.0 0.0 -1.0 -1.0 PMI: Manufacturing 53.5 53.5 55.2 55.6 52.1 50.7 50.6 49.8 49.9 50.0 PMI: Services 56.1 54.9 54.2 54.4 55.5 57.3 55.9 56.0 53.2 52.6 Foreign trade and balance of payments Trade balance, US$ mn 15,570 14,738 17,743 16,881 19,337 16,239 17,320 15,163 14,671 Imports, US$ mn 27,082 16,308 21,670 26,897 26,908 27,914 27,461 27,473 29,921 Exports,US$ mn 42,652 31,046 39,413 43,778 46,245 44,153 44,781 42,636 44,592 Imports, % y/y 26.7 30.0 34.1 41.9 41.0 42.5 41.5 38.0 31.6 Exports,% y/y 18.1 17.7 22.3 23.8 32.0 35.1 38.4 37.6 38.1 Trade balance, 12mth rolling sum, US$ mn 36,422 41,106 48,051 49,362 53,961 52,457 52,896 48,722 47,154 Imports, 12mth rolling sum, US$ mn -76,455 -68,096 -65,060 -64,875 -75,475 -81,719 -82,283 -82,848 -84,855 Exports, 12mth rolling sum, US$ mn 112,877 109,202 113,111 114,237 129,436 134,176 135,179 131,570 132,009 Current account, monthly, US$ mn 6.4 9.7 12.6 10.1 12.9 9.6 1.3 Current account, 12mth cumulative, US$ mn 70.4 67.7 69.4 69.2 72.4 75.1 74.4 Current account, 12mth cumulative, % of GDP 4.8 4.5 4.5 4.5 4.6 4.7 4.6 Foreign reserves Total foreign reserves incl. Gold, IMF, SDRs, US$ mn 479,379 484,158 493,835 502,460 523,950 521,092 524,527 533,905 545,012 516,848 Foreign exchange reserves, US$ mn 432,948 439,969 447,175 454,223 471,725 468,072 471,942 477,855 483,885 459,753 o/w Reserve fund, US$ mn 25,440 25,960 26,120 26,330 27,110 26,570 26,600 26,550 26,760 25,850 o/w National welfare fund, US$ mn 88,440 90,150 90,940 91,800 94,340 92,540 92,610 92,700 92,630 88,690 Total foreign reserves, % of GDP 32.4 32.2 32.4 32.4 33.3 32.6 32.4 32.5 32.7 30.6 Fiscal accounts Federal budget, RUB bn -920.1 147.5 -69.0 99.6 -15.0 222.1 318.3 52.7 32.5 300.7 Federal revenues, RUB bn 872.1 804.9 700.7 887.2 946.9 860.3 1,106.4 927.4 986.4 990.9 Federal expenditures, RUB bn 1,792.2 657.4 769.7 787.6 961.9 638.2 788.1 874.7 953.9 690.2 Federal revenues, % y/y -2.1 9.1 22.8 37.2 42.7 49.0 37.9 40.4 53.6 39.9 Federal expenditures, % y/y 22.9 1.1 -7.0 9.1 15.8 1.5 8.4 11.4 26.8 -11.2 Federal budget, 12mth cumulative, RUB bn -1,812 -1,751 -1,564 -1,389 -1,237 -963 -720 -543 -400 -30 Federal budget, 12mth cumulative, % of GDP -4.0 -3.9 -3.4 -3.0 -2.6 -2.0 -1.5 -1.1 -0.8 -0.1 Consolidated budget, RUB bn -1,485.0 468.9 -13.0 361.1 355.3 270.3 303.8 336.9 273.8 Consolidated revenues, RUB bn 1,650.9 1,115.9 1,289.1 1,987.5 1,933.5 1,666.0 1,893.1 1,863.6 1,747.4 Consolidated expenditures, RUB bn 3,135.9 647.0 1,302.1 1,626.4 1,578.2 1,395.7 1,589.3 1,526.7 1,473.6 Consolidated revenues, % y/y 6.6 14.7 25.3 36.0 25.9 40.7 33.3 32.5 42.6 Consolidated expenditures, % y/y 9.9 12.2 10.3 11.2 7.4 15.9 10.6 10.2 15.9 Consolidated budget, 12mth cumulative, RUB bn -1,585 -1,512 -1,373 -1,011 -722 -431 -111 205 525 662 Consolidated budget, 12mth cumulative, % of GDP -3.5 -3.3 -3.0 -2.2 -1.5 -0.9 -0.2 0.4 1.1

Russian Economic Perspectives 19 October 2011
UBS 35
Dec-10 Jan-11 Feb-11 Mar-11 Apr-11 May-11 Jun-11 Jul-11 Aug-11 Sep-11Labour market and income Employment, nsa, mn 70.0 70.1 71.3 70.9 70.3 70.9 70.8 70.5 70.6 Employment, % y/y 0.6 2.0 2.4 2.2 1.2 1.1 0.6 0.9 1.0 Unemployment rate, ILO, % 7.2 7.8 7.6 7.1 7.2 6.4 6.1 6.5 6.1 Real wages, % y/y 6.3 1.3 0.7 2.4 2.4 3.5 2.4 2.4 3.9 Nominal wages, % y/y 15.6 11.0 10.2 12.1 12.2 13.4 12.0 11.6 12.4 Real disposable income, % y/y 2.1 2.0 0.0 -2.2 -3.1 -5.6 2.1 0.4 1.4 Pensions, % y/y 23.0 6.7 15.3 15.3 9.0 8.9 8.8 Prices CPI, % y/y (NSA) 8.8 9.6 9.5 9.5 9.6 9.6 9.4 9.0 8.2 7.2 CPI, % m/m (NSA) 1.1 2.4 0.8 0.6 0.4 0.5 0.2 0.0 -0.2 0.0 Core CPI, % y/y (NSA) 6.6 7.2 7.4 7.7 8.0 8.3 8.4 8.4 8.1 7.4 Core CPI, % m/m (NSA) 0.7 1.1 0.7 0.7 0.5 0.4 0.3 0.4 0.4 0.5 Food CPI, % y/y 12.9 14.2 14.2 14.1 14.1 13.4 12.5 11.3 8.8 6.4 Non-food goods CPI, % y/y 5.0 5.6 5.6 5.8 5.9 6.3 6.6 6.6 6.8 6.8 Services, % y/y 8.1 8.2 7.9 7.9 8.2 8.6 8.8 8.9 9.0 8.8 PPI, % y/y 16.7 19.4 21.4 20.9 20.2 19.2 18.6 16.1 18.5 Oil price, Urals, US$/bbl 90.4 95.5 101.2 111.5 118.7 110.9 112.0 115.1 110.5 110.0 Exchange and interest rates USD/RUB, average 30.9 30.1 29.3 28.4 28.1 27.9 28.0 27.9 28.8 30.5 RUB vs basket, average (55%USD/ 45%EUR) 35.3 34.7 34.1 33.5 33.7 33.4 33.5 33.3 34.4 35.8 CBR 1 day repo, end period, % 5.00 5.00 5.25 5.25 5.25 5.50 5.50 5.50 5.50 5.25 CBR overnight deposit, end period, % 2.75 2.75 3.00 3.00 3.00 3.50 3.50 3.50 3.50 3.75 CBR refinancing rate, end period, % 7.75 7.75 8.00 8.00 8.00 8.25 8.25 8.25 8.25 8.25 Mosprime 3mth, end period, % 4.06 4.00 4.01 3.96 3.85 4.25 4.25 4.31 4.83 6.54 Mosprime 1mth, end period, % 3.78 3.51 3.51 3.46 3.70 4.16 4.09 4.18 4.58 6.22 Mosprime overnight, end period, % 1.75 2.87 3.31 3.16 4.51 4.36 3.83 5.03 4.32 5.31 Money and credit M2, RUB bn 20,012 19,303 19,531 19,817 20,047 20,191 20,743 20,848 21,080 M2, % y/y 31.1 29.5 28.2 26.7 24.5 22.6 22.7 22.2 20.9 Private sector credit, % y/y 12.3 13.2 14.5 16.1 17.3 18.0 17.8 19.3 o/w household credit, % y/y 14.3 15.1 16.4 18.6 20.7 22.9 24.0 26.5 o/w corporate credit, % y/y 11.7 12.7 14.1 15.5 16.4 16.6 16.1 17.4
Source: Haver, UBS

Russian Economic Perspectives 19 October 2011
UBS 36
Macro economic forecast table
2004 2005 2006 2007 2008 2009 2010 2011F 2012FEconomic ActivitiesGDP (USDbn) 591 764 990 1300 1661 1222 1480 1760 1841GDP (Rub bn) 17027 21610 26917 33248 41277 38786 44939 50852 56156GDP per capita (USD) 4095 5311 6898 9070 11602 8541 10352 12319 12902Real GDP growth* (%) 7.2 6.4 8.2 8.5 5.2 -7.8 4.0 4.1 3.4 Private consumption (%) 11.8 11.6 11.9 14.2 10.4 -4.8 3.0 6.0 3.5 Government consumption (%) 2.1 1.4 2.3 2.7 3.4 0.2 1.4 1.0 2.0 Gross Fixed Capital formation (%) 12.6 10.6 18.0 21.0 10.6 -14.4 6.1 4.0 6.0 Exports (%) 11.8 6.5 7.3 6.3 0.6 -4.7 7.1 4.5 3.0 Imports (%) 23.3 16.6 21.3 26.2 14.8 -30.4 25.6 18.0 6.0Unemployment rate (year-end, ILO 8.2 7.6 7.2 6.1 6.4 8.4 7.5 6.5 6.4Industrial production (%) 8.0 5.1 7.9 6.8 0.6 -9.3 8.3 5.5 5.0Prices, Interest Rate and Money CPI (average, %) 10.9 12.7 9.7 9.0 14.1 11.6 6.8 8.7 6.8CPI (year-end, %) 11.7 10.9 9.0 11.9 13.3 8.8 8.8 7.1 7.2Broad money (%) 35.8 38.5 48.7 43.5 0.8 17.7 31.1 20.0 17.01 day repo rate (year-end) 6.0 6.0 6.0 6.0 9.0 6.0 5.0 5.25 5.25Exchange Rates USD/RUB (average) 28.8 28.3 27.2 25.6 24.9 31.7 30.4 28.9 30.5USD/RUB (year-end) 27.8 28.8 26.3 24.6 29.4 30.2 30.5 31.5 30.0Rub vs 55USD/45Euro basket (average) 32.0 31.4 30.3 29.8 30.1 37.3 34.8 33.7 33.9Rub vs 55USD/45Euro basket (year-end) 32.3 31.2 30.1 29.7 34.8 36.2 34.9 34.3 34.1Balance of Payments Brent (USD/bbl) 38.1 54.6 65.2 72.4 99.0 60.9 80.4 111.5 100.0Exports, merchandise (USDbn) 183.2 243.8 303.6 354.4 471.6 303.4 400.4 510.0 515.0Imports, merchandise, (USDbn) 97.4 125.4 164.3 223.5 291.9 191.8 248.7 315.0 355.0Trade balance (USDbn) 85.8 118.4 139.3 130.9 179.7 111.6 151.7 195.0 160.0Current account balance (USDbn) 59.5 84.6 94.7 77.8 103.5 48.6 70.3 100.0 75.0 as a % of GDP 10.1 11.1 9.6 6.0 6.2 4.0 4.7 5.7 4.1FDI, net (USDbn) 1.7 0.1 6.6 9.2 19.4 -7.2 -9.6 4.0 6.0Foreign exchange reserves, excl. gold 120.8 175.9 295.6 466.8 411.7 416.7 443.6 500.0 550.0Import cover (reserves/months of imports) 14.9 16.8 21.6 25.1 16.9 26.1 21.4 19.0 18.6Fiscal Accounts Federal budget balance (RUBbn) 730 1613 1994 1795 1709 -2300 -1812 -509 -1123Federal budget balance (% GDP) 4.3 7.5 7.4 5.4 4.1 -5.9 -4.0 -1.0 -2.0 Primary balance (% GDP) 5.5 8.4 9.7 5.8 4.4 -4.9 -3.6 -0.6 -1.6Public sector debt, (% GDP) 20.9 13.2 8.3 6.6 5.2 7.3 7.8 8.0 9.0 Domestic debt (% GDP) 4.4 3.9 3.8 3.8 3.4 4.7 5.5 5.4 6.7 External debt (% GDP) 16.4 9.3 4.5 2.9 1.8 2.6 2.3 2.6 2.3External Debt and Debt Service Total foreign debt (USDbn) 214 257 313 464 481 467 489 480 500 as a % of GDP (%) 36.1 33.7 31.6 35.7 28.9 38.2 33.0 27.3 27.2Short-term foreign debt (USDbn) 35.7 43.5 56.6 99.7 73.6 52.7 60.2 67.0 75.0Total debt service (USDbn) 46.6 63.1 67.4 54.6 64.9 78.1 85.4 77.1 84.0 as a % of foreign export receipt 25.4 25.9 22.2 15.4 13.8 25.7 21.3 15.1 16.3 Interest payments (USDbn) 11.1 12.4 16.1 21.7 26.2 22.2 22.9 24.5 18.0 Amortization (USDbn) 35.4 50.7 51.2 32.9 38.8 55.9 62.5 52.6 66.0Credit Ratings (year-end & latest) Moody's Baa3 Baa2 Baa2 Baa2 Baa1 Baa1 Baa1 Baa1 (sta) n/aS&P BB+ BBB BBB+ BBB+ BBB+ BBB BBB BBB (sta) n/aFitch BBB- BBB BBB+ BBB+ BBB+ BBB BBB BBB (pos) n/a
Source: Central Bank of the Russian Federation, EMED, IIF, UBS estimates

Russian Economic Perspectives 19 October 2011
UBS 37
Analyst Certification
Each research analyst primarily responsible for the content of this research report, in whole or in part, certifies that with respect to each security or issuer that the analyst covered in this report: (1) all of the views expressed accurately reflect his or her personal views about those securities or issuers and were prepared in an independent manner, including with respect to UBS, and (2) no part of his or her compensation was, is, or will be, directly or indirectly, related to the specific recommendations or views expressed by that research analyst in the research report.

Russian Economic Perspectives 19 October 2011
UBS 38
Required Disclosures This report has been prepared by UBS Limited, an affiliate of UBS AG. UBS AG, its subsidiaries, branches and affiliates are referred to herein as UBS.
For information on the ways in which UBS manages conflicts and maintains independence of its research product; historical performance information; and certain additional disclosures concerning UBS research recommendations, please visit www.ubs.com/disclosures. The figures contained in performance charts refer to the past; past performance is not a reliable indicator of future results. Additional information will be made available upon request. UBS Securities Co. Limited is licensed to conduct securities investment consultancy businesses by the China Securities Regulatory Commission. Company Disclosures
Issuer Name Russia
Source: UBS; as of 19 Oct 2011.

Russian Economic Perspectives 19 October 2011
UBS 39
Global Disclaimer This report has been prepared by UBS Limited, an affiliate of UBS AG. UBS AG, its subsidiaries, branches and affiliates are referred to herein as UBS. In certain countries, UBS AG is referred to as UBS SA. This report is for distribution only under such circumstances as may be permitted by applicable law. Nothing in this report constitutes a representation that any investment strategy or recommendation contained herein is suitable or appropriate to a recipient’s individual circumstances or otherwise constitutes a personal recommendation. It is published solely for information purposes, it does not constitute an advertisement and is not to be construed as a solicitation or an offer to buy or sell any securities or related financial instruments in any jurisdiction. No representation or warranty, either express or implied, is provided in relation to the accuracy, completeness or reliability of the information contained herein, except with respect to information concerning UBS AG, its subsidiaries and affiliates, nor is it intended to be a complete statement or summary of the securities, markets or developments referred to in the report. UBS does not undertake that investors will obtain profits, nor will it share with investors any investment profits nor accept any liability for any investment losses. Investments involve risks and investors should exercise prudence in making their investment decisions. The report should not be regarded by recipients as a substitute for the exercise of their own judgement. Past performance is not necessarily a guide to future performance. The value of any investment or income may go down as well as up and you may not get back the full amount invested. Any opinions expressed in this report are subject to change without notice and may differ or be contrary to opinions expressed by other business areas or groups of UBS as a result of using different assumptions and criteria. Research will initiate, update and cease coverage solely at the discretion of UBS Investment Bank Research Management. The analysis contained herein is based on numerous assumptions. Different assumptions could result in materially different results. The analyst(s) responsible for the preparation of this report may interact with trading desk personnel, sales personnel and other constituencies for the purpose of gathering, synthesizing and interpreting market information. UBS is under no obligation to update or keep current the information contained herein. UBS relies on information barriers to control the flow of information contained in one or more areas within UBS, into other areas, units, groups or affiliates of UBS. The compensation of the analyst who prepared this report is determined exclusively by research management and senior management (not including investment banking). Analyst compensation is not based on investment banking revenues, however, compensation may relate to the revenues of UBS Investment Bank as a whole, of which investment banking, sales and trading are a part. The securities described herein may not be eligible for sale in all jurisdictions or to certain categories of investors. Options, derivative products and futures are not suitable for all investors, and trading in these instruments is considered risky. Mortgage and asset-backed securities may involve a high degree of risk and may be highly volatile in response to fluctuations in interest rates and other market conditions. Past performance is not necessarily indicative of future results. Foreign currency rates of exchange may adversely affect the value, price or income of any security or related instrument mentioned in this report. For investment advice, trade execution or other enquiries, clients should contact their local sales representative. Neither UBS nor any of its affiliates, nor any of UBS' or any of its affiliates, directors, employees or agents accepts any liability for any loss or damage arising out of the use of all or any part of this report. For financial instruments admitted to trading on an EU regulated market: UBS AG, its affiliates or subsidiaries (excluding UBS Securities LLC and/or UBS Capital Markets LP) acts as a market maker or liquidity provider (in accordance with the interpretation of these terms in the UK) in the financial instruments of the issuer save that where the activity of liquidity provider is carried out in accordance with the definition given to it by the laws and regulations of any other EU jurisdictions, such information is separately disclosed in this research report. UBS and its affiliates and employees may have long or short positions, trade as principal and buy and sell in instruments or derivatives identified herein. Any prices stated in this report are for information purposes only and do not represent valuations for individual securities or other instruments. There is no representation that any transaction can or could have been effected at those prices and any prices do not necessarily reflect UBS's internal books and records or theoretical model-based valuations and may be based on certain assumptions. Different assumptions, by UBS or any other source, may yield substantially different results. United Kingdom and the rest of Europe: Except as otherwise specified herein, this material is communicated by UBS Limited, a subsidiary of UBS AG, to persons who are eligible counterparties or professional clients and is only available to such persons. The information contained herein does not apply to, and should not be relied upon by, retail clients. UBS Limited is authorised and regulated by the Financial Services Authority (FSA). UBS research complies with all the FSA requirements and laws concerning disclosures and these are indicated on the research where applicable. France: Prepared by UBS Limited and distributed by UBS Limited and UBS Securities France SA. UBS Securities France S.A. is regulated by the Autorité des Marchés Financiers (AMF). Where an analyst of UBS Securities France S.A. has contributed to this report, the report is also deemed to have been prepared by UBS Securities France S.A. Germany: Prepared by UBS Limited and distributed by UBS Limited and UBS Deutschland AG. UBS Deutschland AG is regulated by the Bundesanstalt fur Finanzdienstleistungsaufsicht (BaFin). Spain: Prepared by UBS Limited and distributed by UBS Limited and UBS Securities España SV, SA. UBS Securities España SV, SA is regulated by the Comisión Nacional del Mercado de Valores (CNMV). Turkey: Prepared by UBS Menkul Degerler AS on behalf of and distributed by UBS Limited. Russia: Prepared and distributed by UBS Securities CJSC. Switzerland: Distributed by UBS AG to persons who are institutional investors only. Italy: Prepared by UBS Limited and distributed by UBS Limited and UBS Italia Sim S.p.A.. UBS Italia Sim S.p.A. is regulated by the Bank of Italy and by the Commissione Nazionale per le Società e la Borsa (CONSOB). Where an analyst of UBS Italia Sim S.p.A. has contributed to this report, the report is also deemed to have been prepared by UBS Italia Sim S.p.A.. South Africa: UBS South Africa (Pty) Limited (Registration No. 1995/011140/07) is a member of the JSE Limited, the South African Futures Exchange and the Bond Exchange of South Africa. UBS South Africa (Pty) Limited is an authorised Financial Services Provider. Details of its postal and physical address and a list of its directors are available on request or may be accessed at http:www.ubs.co.za. United States: Distributed to US persons by either UBS Securities LLC or by UBS Financial Services Inc., subsidiaries of UBS AG; or by a group, subsidiary or affiliate of UBS AG that is not registered as a US broker-dealer (a 'non-US affiliate'), to major US institutional investors only. UBS Securities LLC or UBS Financial Services Inc. accepts responsibility for the content of a report prepared by another non-US affiliate when distributed to US persons by UBS Securities LLC or UBS Financial Services Inc. All transactions by a US person in the securities mentioned in this report must be effected through UBS Securities LLC or UBS Financial Services Inc., and not through a non-US affiliate. Canada: Distributed by UBS Securities Canada Inc., a subsidiary of UBS AG and a member of the principal Canadian stock exchanges & CIPF. A statement of its financial condition and a list of its directors and senior officers will be provided upon request. Hong Kong: Distributed by UBS Securities Asia Limited. Singapore: Distributed by UBS Securities Pte. Ltd [mica (p) 039/11/2009 and Co. Reg. No.: 198500648C] or UBS AG, Singapore Branch. Please contact UBS Securities Pte Ltd, an exempt financial advisor under the Singapore Financial Advisers Act (Cap. 110); or UBS AG Singapore branch, an exempt financial adviser under the Singapore Financial Advisers Act (Cap. 110) and a wholesale bank licensed under the Singapore Banking Act (Cap. 19) regulated by the Monetary Authority of Singapore, in respect of any matters arising from, or in connection with, the analysis or report. The recipient of this report represent and warrant that they are accredited and institutional investors as defined in the Securities and Futures Act (Cap. 289). Japan: Distributed by UBS Securities Japan Ltd to institutional investors only. Where this report has been prepared by UBS Securities Japan Ltd, UBS Securities Japan Ltd is the author, publisher and distributor of the report. Australia: Distributed by UBS AG (Holder of Australian Financial Services License No. 231087) and UBS Securities Australia Ltd (Holder of Australian Financial Services License No. 231098) only to 'Wholesale' clients as defined by s761G of the Corporations Act 2001. New Zealand: Distributed by UBS New Zealand Ltd. An investment adviser and investment broker disclosure statement is available on request and free of charge by writing to PO Box 45, Auckland, NZ. Dubai: The research prepared and distributed by UBS AG Dubai Branch, is intended for Professional Clients only and is not for further distribution within the United Arab Emirates. Korea: Distributed in Korea by UBS Securities Pte. Ltd., Seoul Branch. This report may have been edited or contributed to from time to time by affiliates of UBS Securities Pte. Ltd., Seoul Branch. Malaysia: This material is authorized to be distributed in Malaysia by UBS Securities Malaysia Sdn. Bhd (253825-x).India : Prepared by UBS Securities India Private Ltd. 2/F,2 North Avenue, Maker Maxity, Bandra Kurla Complex, Bandra (East), Mumbai (India) 400051. Phone: +912261556000 SEBI Registration Numbers: NSE (Capital Market Segment): INB230951431 , NSE (F&O Segment) INF230951431, BSE (Capital Market Segment) INB010951437. The disclosures contained in research reports produced by UBS Limited shall be governed by and construed in accordance with English law. UBS specifically prohibits the redistribution of this material in whole or in part without the written permission of UBS and UBS accepts no liability whatsoever for the actions of third parties in this respect. Images may depict objects or elements which are protected by third party copyright, trademarks and other intellectual property rights. © UBS 2011. The key symbol and UBS are among the registered and unregistered trademarks of UBS. All rights reserved.
ab