Embed Size (px)
Citation preview

Company Presentation

1
Contents
General information
- RWE Trading as an operating companywithin the RWE Group
- RWE Trading is RWE’s interface with the market- The trading floor as the central
information platform for wholesale market issues- RWE’s power sales portfolio- Best in class – our history and our future- RWE Trading – key figures (I)- RWE Trading – key figures (II)- RWE Trading – organisation
Power trading- Facts and figures for RWE Trading
Gas trading- Cooperation between RWE Trading and
RWE Gas Midstream
Oil trading
Coal trading- RWE Trading’s role in the world of
coal trading- Main drivers of the coal trading
market and the respective challenges for RWE’s coal trading business
Emissions trading
Our risk management- Commodity Risk Governance
Structure- Risk philosophy- Backup
16
1819
20
21
2324
2526
2
34
56789
1011
1315
Page Page
2
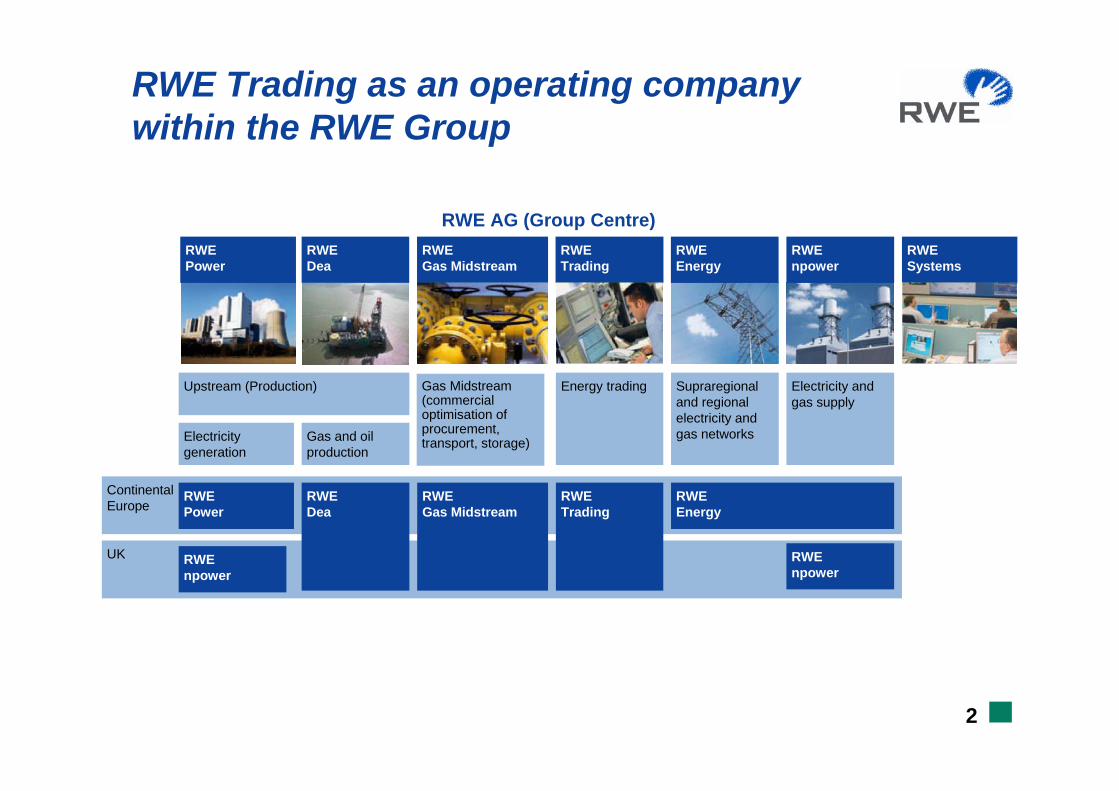
RWE Trading as an operating company within the RWE Group
RWE AG (Group Centre)
Upstream (Production)
Electricitygeneration
Gas and oilproduction
Supraregionaland regional electricity and gas networks
Gas Midstream(commercial optimisation of procurement, transport, storage)
Continental Europe
UK
RWEPower
RWEDea
RWEGas Midstream
RWETrading
Energy trading Electricity and gas supply
RWEEnergy
RWEnpower
RWEPower
RWEGas Midstream
RWEEnergy
RWEnpower
RWESystems
RWEDea
RWETrading
RWEnpower

3
RWE Trading is RWE‘s interface with theenergy wholesale markets
RWE Trading implements the market-defined benchmarks for the RWE Group’s generation and supply activities.RWE traders not only deal with commodities such as power, gas, coal and oil, they also actively trade physical and financial derivatives as well as environmental certificates.The asset the based commodity positions of RWE Group are sold to or bought from RWE Trading at wholesale market prices. We consolidate these positions through proprietary trading. This hedging helps us to manage the risks of having very large open positions in each of the physical commodity markets.This business model unites the natural focus on obtaining the best potential value from the RWE Group’s physical assets with the benefits of financial (proprietary) trading.
* STPM = Short-term position management
RWE Energy/ npower
STPM*
RWE Power/ RWE npower
RWE Trading
Retail customers/industrial customers
Market
buy/sell
Trading customers
sell
buy sell
Proprietary trading
4
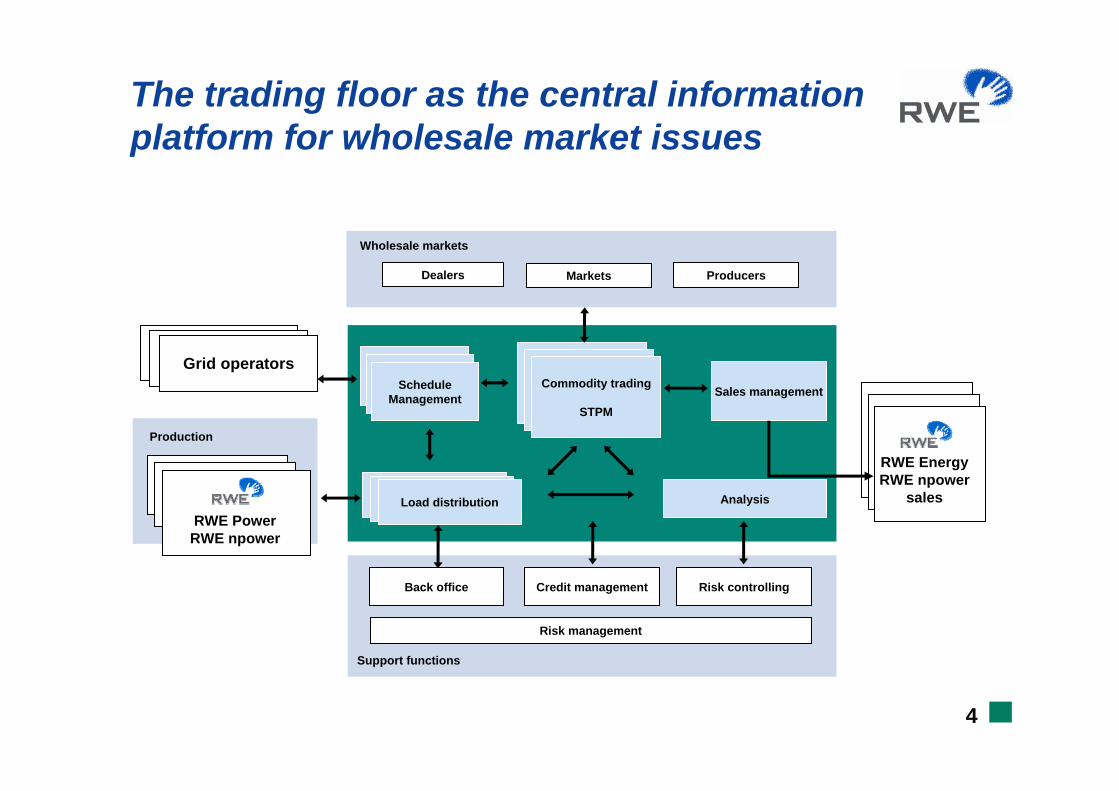
The trading floor as the central information platform for wholesale market issues
Sales management
Analysis
Risk management
Dealers Markets Producers
Commodity trading
STPM
Load distribution
Risk controlling
Grid operatorsSchedule
Management
Wholesale markets
Production
Support functions
RWE PowerRWE npower
RWE EnergyRWE npower
sales
Credit managementBack office

5
RWE’s power sales portfolio
The wholesale markets set the benchmark
RWE places its trust in the liquidity and reliability of the wholesale markets and sells a large part of its production directly into this pan-European market.
Of the 164.3 TWh produced by its own power plants in 2006, the RWE Groupsold 92.8 TWh on the wholesale markets and 71.5 TWh through sales organisations.
Salesorganisations
43.5%
Wholesale markets56.5%
71.5 TWh
92.8 TWh

6
Best in class – our history and our future
We contribute to the commercial success of the RWE Group by applying our combined knowledge and skills in the best interests of the Group’s assets.We continue to expand our proprietary trading activities based on fundamental analysis of the drivers of supply and demand, and therefore prices.
We continue to be a driver of liquidity in the power, gas, coal, oil and CO2 markets.
We continue to be the preferred long-term partner for sustainable success in European energy markets, capable of delivering innovative energy commodity risk management solutions.
2000 2002 2003
Joint short-term trading and asset dispatch
function –STPM*2005 ff.1898 1998
Purely speculative
trading
Best practiceblueprint for risk control
Providerof market
information/ route to the wholesale markets
Integratedwholesale risk pool
and portfolio manager
* Short-term position management
Hugo Stinnes

7
RWE Trading – key figures (I)
RWE Trading is one of the largest and most important European energy commodity traders.With a workforce of over 500 employees, RWE Trading operates trading floors in Essen, Swindon and London, as well as representative and agency offices across Europe.RWE Trading is active on leading international exchanges. Besides our activities in Europe, RWE Trading actively trades on the NYMEX and the global commodity markets.Oil: USA, Europe, Asia, Middle EastCoal: ARA, Newcastle, Richards Bay RWE Trading currently forms the backbone of the European OTC power and gas trading business.
RWE Trading in Europe
Oslo
Essen
Amsterdam
Paris
Madrid
Leipzig
London
SwindonWarsaw
Trading floor
Representative/agency office
Traded markets
Energy exchange
PragueKosice
Graz
Brussels
Ljubljana Bucharest

8
RWE Trading – key figures (II)
RWE Trading employees at year end**
* Figures for 2004 incorporate Innogy’s trading and assetmanagement team after RWE takeover.
**Year-end figures for RWE Trading GmbH, including apprentices.
Management accounts of RWE Trading 2006
Performance gross margin € 875.3 m
Performance EBITDA € 690.3 mRisk capital € 438.8 mRORAC 98.2 %
Since 2005, RWE Trading profits have been reported externally, together with the figures from the RWE Power generation business, to reflect a higher degree of integration with the asset business of the RWE Group.RWE Trading measures its performance on a pure mark-to-market basis, whereas RWE discloses these results following the legal structure and according to the applicant rules of IAS/IFRIC.
0
100
200
300
400
500
600
2002 2003 2004 2005 2006
192
176
483*
504 53
4

9
RWE Trading – organisation
Finance & Reporting (Global)
Project Controlling & Valuation
Back Office, IT & Business Change Management (Global)
Integration & Organisation
Managing Director and Chief Commercial Officer (CCO)
Dr Peter Kreuzberg
Managing Director and Chief Financial Officer (CFO)
Dr Bernhard Günther
Chief Executive Officer and Member of the Group Business CommitteePeter Terium
Power Trading (Continental Europe)Short-Term Position Management (Continental Europe)Power Trading (UK)Short-Term Position Management (UK)Gas Trading (all Europe)Global Commodities TradingGlobal Commodities Marketing & LogisticsCarbon TradingAnalysis for Global & Pan-European CommoditiesStructure & Valuation (Global)
Lobbying and Regulations (Global)
Legal & Communications (Global)
Strategy Application & Asset Interface (Global)
Risk (Global)
Human Resources (Global)

Power trading

11
RWE Trading – facts and figures
Our power trading volumes have seen consistent growth in recent years. This is just one indication of RWE Trading’s successful market approach. The slight decline in 2006 was due to politically influenced market distortions in France and Spain.
Where we trade powerRWE Trading: power trading volumes
TWh
Trend
Power trading CE and power trading UK
799
1,05
5
1,31
6
1,31
5
1,25
0
0
200
400
600
800
1,000
1,200
1,400
2002 2003 2004 2005 2006
12
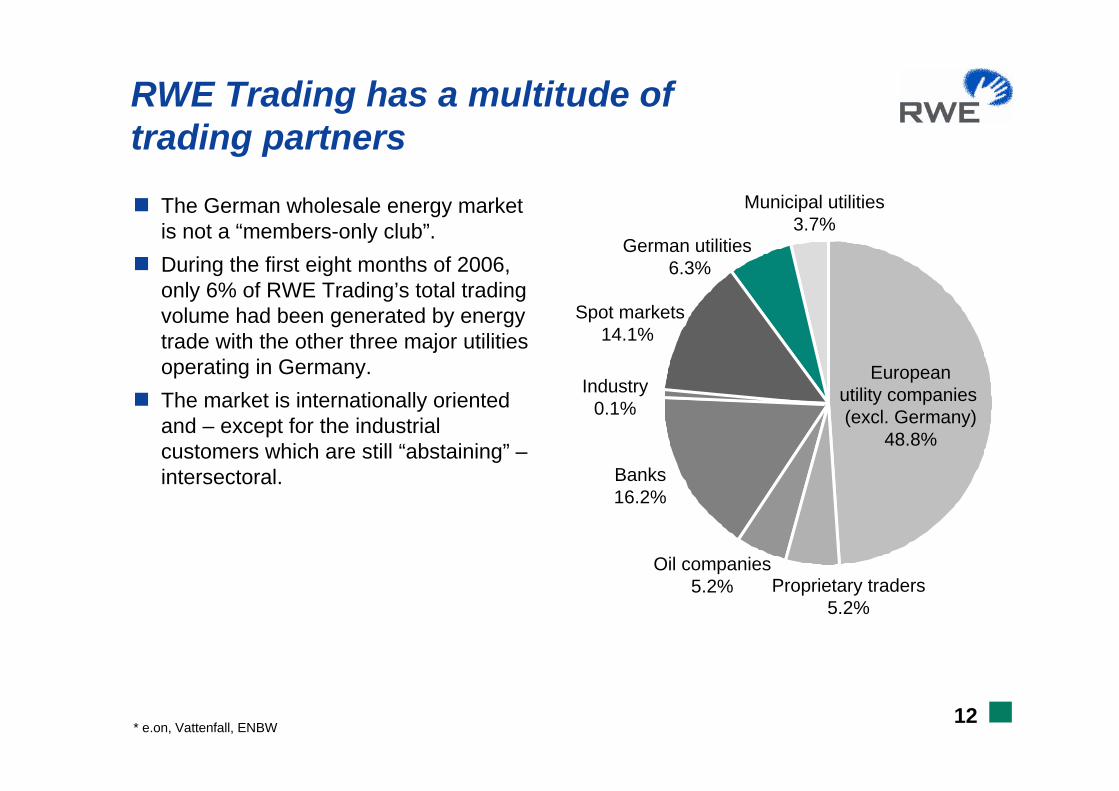
RWE Trading has a multitude of trading partners
The German wholesale energy market is not a “members-only club”. During the first eight months of 2006, only 6% of RWE Trading’s total trading volume had been generated by energy trade with the other three major utilities operating in Germany.The market is internationally oriented and – except for the industrial customers which are still “abstaining” –intersectoral.
* e.on, Vattenfall, ENBW
Proprietary traders5.2%
Oil companies5.2%
Industry0.1%
Municipal utilities3.7%
German utilities 6.3%
Banks16.2%
Europeanutility companies (excl. Germany)
48.8%
Spot markets14.1%

Gas trading
14
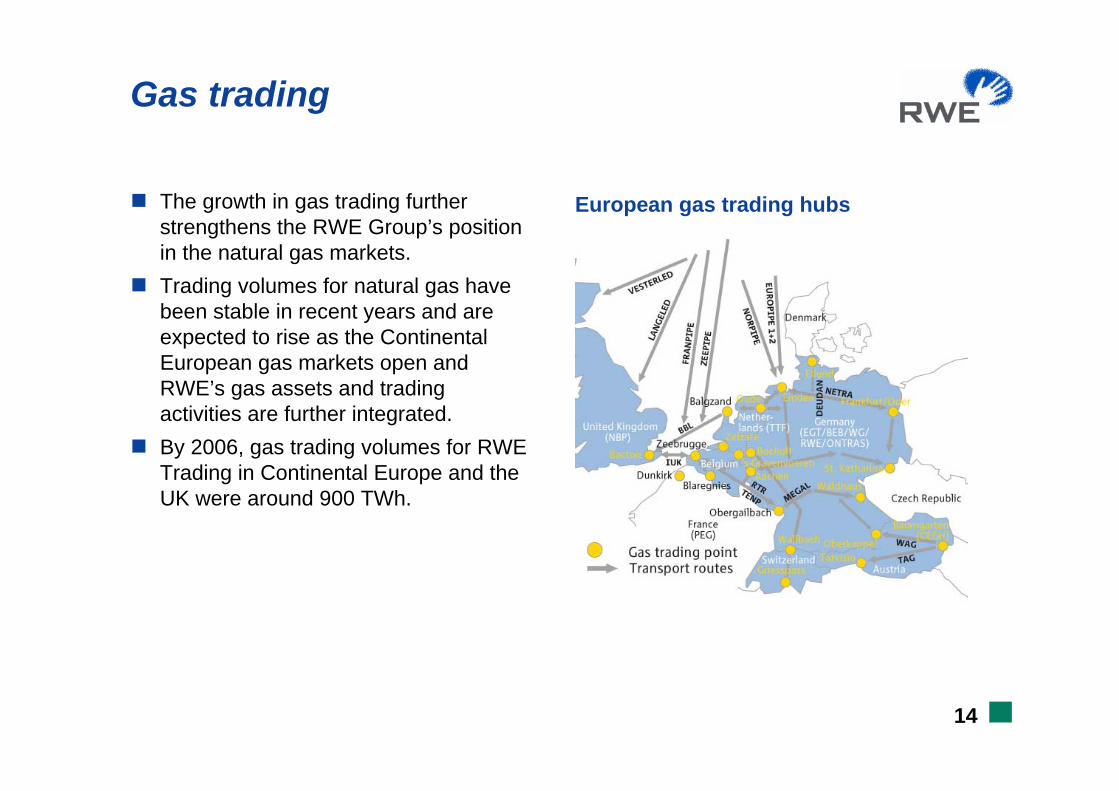
Gas trading
The growth in gas trading further strengthens the RWE Group’s position in the natural gas markets.Trading volumes for natural gas have been stable in recent years and are expected to rise as the Continental European gas markets open andRWE’s gas assets and tradingactivities are further integrated. By 2006, gas trading volumes for RWE Trading in Continental Europe and the UK were around 900 TWh.
European gas trading hubs

15
Cooperation between RWE Tradingand RWE Gas Midstream
RWE Gas Midstream will further strengthen RWE Group’s competitiveness in the increasingly liberalised European gas market. RWE Gas Midstream bundles the non-regulated areas of the RWE Group’s gas business (purchase, transportand storage capacity rights).RWE Trading and RWE Gas Midstream cooperate closely with each other in the gas business. RWE Trading will continue to be an active trader at liquid gas trading points. This business is being integrated by RWE Gas Midstream as part of the commercial optimisation of the entire gas portfolio of the RWE Group, ranging from short-to long-term procurement and supply commitments.

Oil trading

17
Oil trading
RWE Trading’s business model for oil covers global physical commodities and derivatives trading as well as risk management.Group-wide synergies include:– Marketing of RWE Dea equity crude (among others North Sea, Dubai, Egypt)– Risk management and hedging of RWE Dea’s physical upstream position– Procurement of fuel oil for RWE power plants– Global derivative expertise for hedging strategies of oil-indexed fuels (e.g. gas)RWE Trading carries out spread transactions between oil products and locations based on price differentials.

Coal trading
19
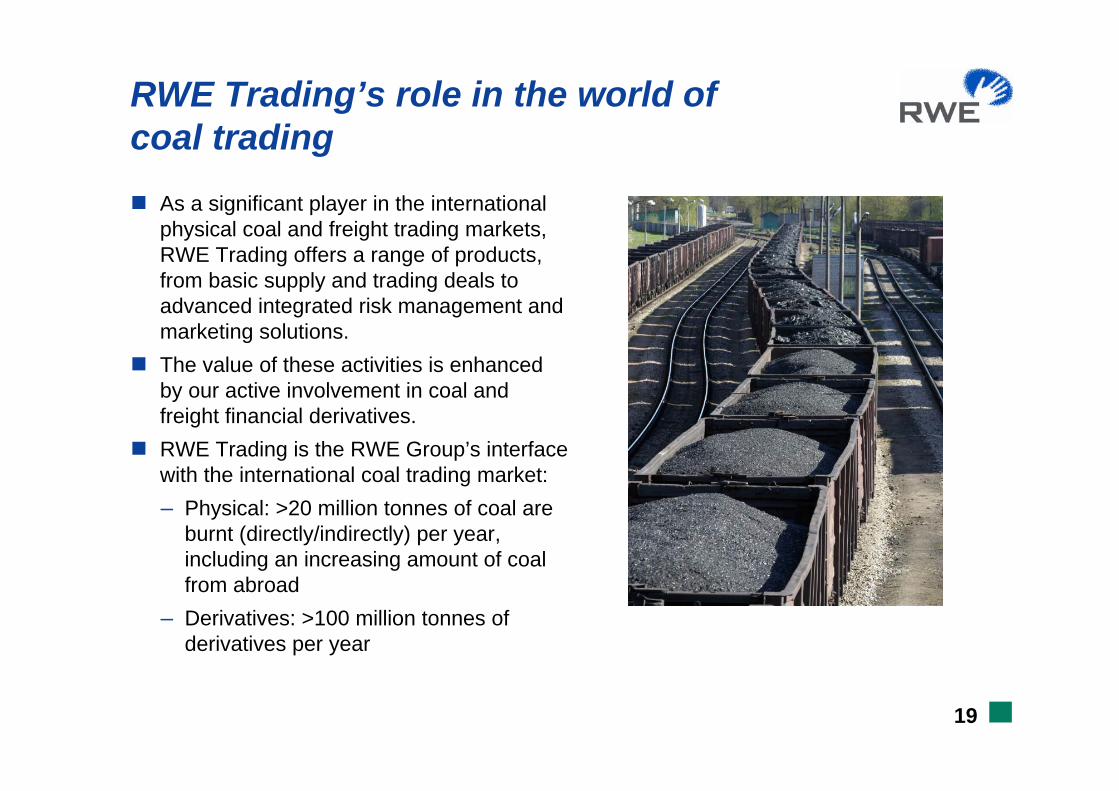
RWE Trading’s role in the world of coal trading
As a significant player in the international physical coal and freight trading markets, RWE Trading offers a range of products, from basic supply and trading deals to advanced integrated risk management and marketing solutions.The value of these activities is enhanced by our active involvement in coal and freight financial derivatives.RWE Trading is the RWE Group’s interface with the international coal trading market:– Physical: >20 million tonnes of coal are
burnt (directly/indirectly) per year, including an increasing amount of coal from abroad
– Derivatives: >100 million tonnes of derivatives per year

20
Main drivers of coal trading market and the challenges for RWE’s coal trading business
Rising demand from China and India and the renaissance of coal-fired power generation in Europe.Significant increases in ocean freight rates and coal export prices.Larger trade flows and higher price volatility, creating a vibrant market with a very strong international orientation.Thanks to extensive market knowledge and its team of dedicated experts, RWE Trading is well positioned to manage the risks presented by a changing market and to offer made-to-measure supply solutions to our customers.We source from and supply to a number of different countries and suppliers globally, including long-term basis contracts.We will also play an active role as a market maker for new and attractive products.

Emissions trading

22
Emissions trading
Optimisation of power, gas and other fuel positions via emissions trading is a necessary part of European energy markets.The European Trading System (ETS) combines market forces with politically imposed caps on emissions. RWE Trading has been a successful participant from the very beginning and is a leading contributor to the rapid development of this market. We are ready to meet the complex challenges of the ETS market, by handling day-to-day fluctuations, and by having the tools and experience to hedge long-term risks. For example, we actively support the further development of trading master agreements.The ETS will continue to be an important futures market. Although there is a high degree of volatility in daily trading, there is a also strong long-term element. The CO2 market provides decision makers with valuable input when it comes to planning long-term investments in generation assets/power plants.

Our risk management

24
Commodity risk governance structure
RWE Group Center
RWE AG Executive Board Group Risk Management
RWE Energy RWE Power RWE Trading RWE npower
Portfolio management
Risk control Risk control Risk control Risk control
Short-term position management (UK)
Short-term position management (continent)
Asset management Trading desks
Asset interface
Portfolio management
Asset management
RWE Gas Midstream
Risk control
Portfolio management
Market Committee
New Product Team
Risk Committee
Asset BookCommitteeGas & Oil
Asset BookCommitteeContinent
Asset BookCommittee
UK
CarbonWorking Group
Group Business Committee
Market Assessment Team

25
Risk philosophy
The Chairman of the Board is the chief risk controller.Professional risk management forms the basis of our successful energy trading business.Our strict risk management philosophy is implemented through the following structures and measures:– Best-in-class processes for trading, risk controlling and
back office/operations based on banking industry standards– Integrated management of all trading activities, and independent
evaluation and supervision of market and credit risks using aninter-organisational state-of-the-art trading and risk management system
– Organisational separation of front office and support and control functions (dual control principle)
– Transactions on the basis of international master agreements (ISDA, EFET, etc.)

Backup

27
Contents of Backup
Power trading- RWE Trading = the Group’s wholesale risk
pool and portfolio manager in Germany, Continental Europe …
- … and the UK- Major fundamental factors influencing
power prices on the wholesale market- Forward price development in Europe- Power trading volumes in Continental
Europe: increasing liquidity- Wholesale markets work: development of
trading volumes in Germany as of 2002
Coal trading- Coal prices (US$/t)- Coal prices and freight prices (US$/t)
Emissions trading- Environmental trading- Environmental trading
Price development (EUA 06)- Environmental trading
Price development (EUA 07)- Environmental trading
Price development (EUA 08)
2831
3233
3540
41
Page
474849
505152
53
54
Page
Power trading
29
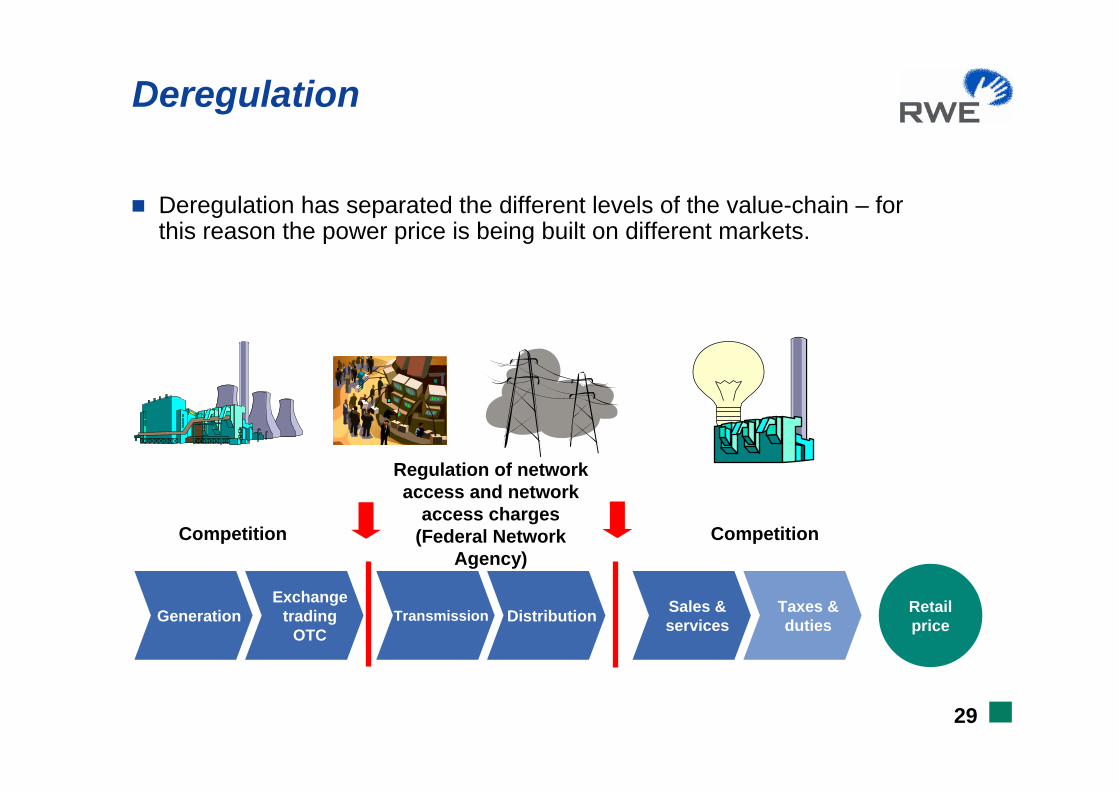
Deregulation
Competition Competition
Regulation of network access and network
access charges (Federal Network
Agency)
RetailpriceGeneration
Exchangetrading
OTCTransmission Distribution Sales &
servicesTaxes &duties
Deregulation has separated the different levels of the value-chain – for this reason the power price is being built on different markets.

30
The power wholesale market
Forwards/ options/
structured products
Settlement: physical and
financial
Physical
Futures/ options
Settlement: mainly
financialPhysical
Trading
Wholesale market
OTC market(e-OTC Germany 2006: 1,680 TWh)
Spot market Futures market
Exchange(EEX 2006: 1,133 TWh)
Spot market(EEX 2006: 88.7 TWh)
Future market(EEX 2006: 1,044 TWh)
OTCclearing
EEX 2006: 642 TWh
31
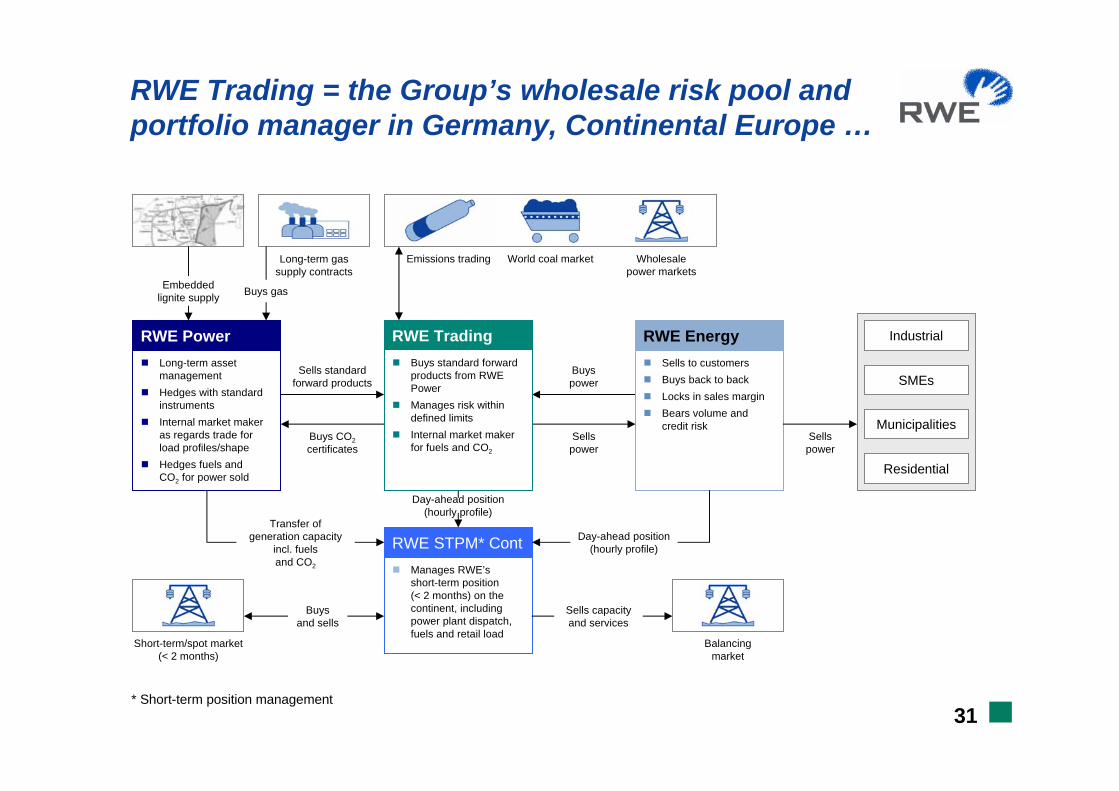
RWE Trading = the Group’s wholesale risk pool and portfolio manager in Germany, Continental Europe …
Sells standardforward products
Buys CO2certificates
Buyspower
Sellspower
RWE EnergySells to customersBuys back to backLocks in sales marginBears volume andcredit risk
Industrial
SMEs
Municipalities
Residential
Sellspower
RWE STPM* ContManages RWE’sshort-term position(< 2 months) on the continent, including power plant dispatch, fuels and retail load
Day-ahead position(hourly profile)
Day-ahead position(hourly profile)
Transfer of generation capacity
incl. fuelsand CO2
Sells capacityand services
Buysand sells
Short-term/spot market(< 2 months)
Balancingmarket
RWE PowerLong-term asset managementHedges with standard instrumentsInternal market maker as regards trade forload profiles/shapeHedges fuels andCO2 for power sold
Long-term gassupply contracts
Embeddedlignite supply Buys gas
RWE TradingBuys standard forward products from RWE PowerManages risk within defined limitsInternal market maker for fuels and CO2
Emissions trading World coal market Wholesalepower markets
* Short-term position management

32
… and the UK
RWE npower Generation
Long-term asset managementHedges CO2 for capability not yet transferred to Trading
Buyspower
Sellspower
RWE npower Retail
Sells to customersBuys back to backLocks in sales marginBears volume andcredit risk
Industrial
SMEs
Residential
Sellspower
RWE STPM* UK
When an option is exercised, STPM* manages generation capability until production (< 1 week)Manages optionality of plants (dispatch including fuels) andretail load
Option exercise
Loadprofile
Sells capacityand services
Buysand sells
Spot market(< 1 week)
Balancingmarket
RWE TradingBuys capabilityfrom RWE npowerManages the spread option within defined limitsInternal marketmaker for power,fuels and CO2
Emissions trading World coal market Wholesale gas market
Buysand sells
Wholesalepower market
Transfer ofcapabilityincl. CO2
Buys CO2certificates
* Short-term position management

33
Major fundamental factors influencing power prices on the wholesale market
Power price
Rainfall CO2 price Gas price Oil price Coal price Uranium price
RevisionsThermic power plant
Technicalfailures
Power plants/ networks
school holidays
WindturbinesWind
Temperature
Public holidays
Illumination
Brightness
Climatisation/ electric heating
Time of dayCloudsLong-term influences:• Changes on basis of
market changes• Political decisions• Capacity changes
Storage and riverpower plant
Futures markets reflect traders’ expectations in terms of future
fundamental influence factors

34
“Marginal power plant” principle: decisive for price formation on the wholesale market
The daily demand on the EEX is countered by a multitude of offers for electricity from different generation sources. Each power plant type (nuclear, gas, coal, etc.) has marginal costs for its utilisation.
Marginal costs are mainly determined by “variable costs” for fuels (incl. CO2) and operating resources - costs that are incurred during power plant operation and have to be earned as a minimum.
Starting with the most favourable offer, power plants are successively called up on the EEX until demand is met.
The offer price of the last power plant needed to meet this demand (“marginal power plant”) determines the market price for all other power plants.
The power price thus results from the intersection of supply and demand. That is why in case of high demand prices will rather be determined by power plants with relatively high marginal costs whereas in case of low demand they will rather be determined by lower marginal cost power plants.
€/MWh
Power supply in MW (graded by offer prices)
Offer price
Market price
Power demand
K2 K3 K4 K5
Full costs
K1
variable costs + capital costs
Short-term variable costs per power plant type (fuel + operating resources) + CO2

35
Forward price development in Europe
Marked price increase throughout Europe in 2005 and 2006. Since mid-2006, stable price level for Germany at around € 55/MWh.
25
30
35
40
45
50
55
60
65
70
01.0
1.05
01.0
3.05
01.0
5.05
01.0
7.05
01.0
9.05
01.1
1.05
01.0
1.06
01.0
3.06
01.0
5.06
01.0
7.06
01.0
9.06
01.1
1.06
01.0
1.07
01.0
3.07
01.0
5.07
01.0
7.07
€/M
Wh
DeutschlandFrankreichNiederlandeSkandinavien
Germany
Netherlands
France
Scandinavia

36
Price increase for 2008 since 2005
Germany shows the lowest price increase by European comparison at 48%.
90%
100%
110%
120%
130%
140%
150%
160%
170%
180%
190%
01.0
1.05
01.0
3.05
01.0
5.05
01.0
7.05
01.0
9.05
01.1
1.05
01.0
1.06
01.0
3.06
01.0
5.06
01.0
7.06
01.0
9.06
01.1
1.06
01.0
1.07
01.0
3.07
01.0
5.07
01.0
7.07
€/M
Wh
DeutschlandFrankreichNiederlandeSkandinavien
Germany
Netherlands
France
Scandinavia

37
Spot market volume at important european markets 2003 - 2007
02468
1012141618202224262830
Jan
03
Apr
03
Jul 0
3
Okt
03
Jan
04
Apr
04
Jul 0
4
Okt
04
Jan
05
Apr
05
Jul 0
5
Okt
05
Jan
06
Apr
06
Jul 0
6
Okt
06
Jan
07
Apr
07
Jul 0
7
Month
TWh
EEXEXAAPowernextAPXNordpool

38
Futures market volume at important europeanmarkets 2003 - 2007
0
10
20
30
40
50
60
70
80
90
100
110
120Ja
n 03
Apr 0
3
Jul 0
3
Okt
03
Jan
04
Apr 0
4
Jul 0
4
Okt
04
Jan
05
Apr 0
5
Jul 0
5
Okt
05
Jan
06
Apr 0
6
Jul 0
6
Okt
06
Jan
07
Apr 0
7
Jul 0
7
.
Month
TWh
EEX
Powernext
Endex
Nordpool

39
EEX market volume 2004 - 2007
0
20
40
60
80
100
120
140
160
Jan 04
Apr 04
Jul 0
4
Okt 04
Jan 05
Apr 05
Jul 0
5Okt
05
Jan 06
Apr 06
Jul 0
6Okt
06
Jan 07
Apr 07
Jul 0
7
Month
Volu
me
(TW
h)
EEX ClearingEEX FuturesEEX Spot

40
Power trading volumes in Continental Europe: increasing liquidity*
2002 2003 2004 2005 20061,000,000,000
2,000,000,000
3,000,000,000
4,000,000,000
5,000,000,000
6,000,000,000
2001
Scandinavia
Netherlands OTC
Netherlands
France OTC
France
Germany OTC
Germany
Spain
* In bn kWh; measurable trading volume at exchanges and via electronic broker platforms OTC

41
Wholesale markets work: development of trading volumes in Germany as of 2002
2002 2003 2004 2005 20060
500
1.000
1.500
2.000
2.500
Source: EEX, RWE Trading data, 2006e = “estimate”/based on data available up to October 2006.
Since deregulation there has been a continual increase in the volumes traded on the German wholesale market.
Note: this graph is based on measurable trading volumes and does not include bilateral “voice OTC” trading. Market analysts estimate the total trading volume including non-measurable, anonymous OTC trading to be around double the volumes shown here.
3.000
e-OTC Forwards
Clearing
Futures
Spot
TWh

42
European network effectively limits the market position of individual producersRelevant production for Germany is 192 GW.
Conclusion of the “
EU sector inquiry regarding networking*:
“Pivotal Supplier Index (PSI) for Germany is small”
Share of the“big four”:
43%
30% Cross-border
capacities(58 GW)
17%Others (33 GW)
10%Inst. windpower plants(20 GW)
17%RWE
(32 GW)
12%e.on
(23 GW)
7%EnBW
(13 GW)
7%Vattenfall(13 GW)
0.0%UK
0.0%DE
0.0%NL
8.2%E
97.2%BE
100.0 %F
* Sources: EU Sector Inquiry 2005/2006, study by London Economics and Global Energy Decisions

43
Europe’s power market is connected
Price level often higher than in GermanyPrice level often lower than in Germany
Northern EuropeStrongly dependent on hydropower and thus largely influenced by other fundamental factors than other European regionsPresently “normal” water levels
Southern EuropeIncreased use of air conditioning and electric heatingFailing hydropower productionGenerally increasing demand due to economic development
Eastern EuropePartly subsidised cheaper electricityNo open wholesale marketsCO2 not as fungible as in open energy markets
Rising exports are a sign of healthy competition: electric power, too, tries to find the highest available price. If a trader can sell electricity at a higher price in a neighbouring European country than at home, he will try to use this opportunity. Different production structures and different fundamental influences result in growing cross-border trading (but not necessarily in growing physical electricity flows)

44
Power wholesale markets and market deregulation -status quo regarding cross-border network capacities
Germany already complies with all requirements for cross-border network capacities.
Compliant
Compliant with most requirements
Non-compliant
Long-term agreements are available (no publicly accessible information)
Status: April 2006

45
Four core statements by RWE Trading on power wholesale markets
Functioning wholesale markets are the prerequisite for competition and the ensuing economic benefits for the European industry.The European wholesale market for power has shown a very positive development: just look at the growth rate for traded volumes or the increasing number of market participants.RWE Trading is one of the leading market participants in Europe and plays an active part in shaping the wholesale markets.Markets require a framework and regulation, but overregulation stifles trust in the markets! Regulation should always focus on promoting competition.

46
European power markets showing outstanding development
More than sufficient liquidity in the core markets
Diversified and numerous market participants
Convergence of power prices in Europe
Price peaks are also a European phenomenon
Market position of individual producers effectively limited in the European market

Coal trading

48
Coal prices (US$/t)
20
40
60
80
100
120Ja
n 03
Mar
03
May
03
Jul 0
3
Sep
03
Nov
03
Jan
04
Mar
04
May
04
Jul 0
4
Sep
04
Nov
04
Jan
05
Mar
05
May
05
Jul 0
5
Sep
05
Nov
05
Jan
06
Mar
06
May
06
Jul 0
6
Sep
06
Nov
06
Jan
07
Mar
07
May
07
Jul 0
7
Sep
07
Nov
07
Monat
Prei
s in
$/t
API#2 API#4
Pric
e in
US$
Month
API#2 API#4

49
Coal prices and freight prices (US$/t)Pr
ice
in U
S$/t
5
10
15
20
25
30
35
40
45Ja
n 03
Apr
03
Jul 0
3
Oct
03
Jan
04
Apr
04
Jul 0
4
Oct
04
Jan
05
Apr
05
Jul 0
5
Oct
05
Jan
06
Apr
06
Jul 0
6
Oct
06
Jan
07
Apr
07
Jul 0
7
Oct
07
C4 ausschließlich Frachtrate (API#2 - API#4)Month
C4 Implied freight

Emissions trading

51
CO2 emissions trading
The CO2 market is characterised by fast-growing liquidity
0
20.000
40.000
60.000
80.000
100.000
120.000
140.000
160.000
180.000
Jan 0
4Apr
04Ju
l 04
Okt 04
Jan 0
5Apr
05Ju
l 05
Okt 05
Jan 0
6Apr
06Ju
l 06
Okt 06
Jan 0
7Apr
07Ju
l 07
Okt 07
Han
dels
volu
men
[100
0 EU
A]
Trad
edvo
lum
esin
1,0
00 E
UA
52
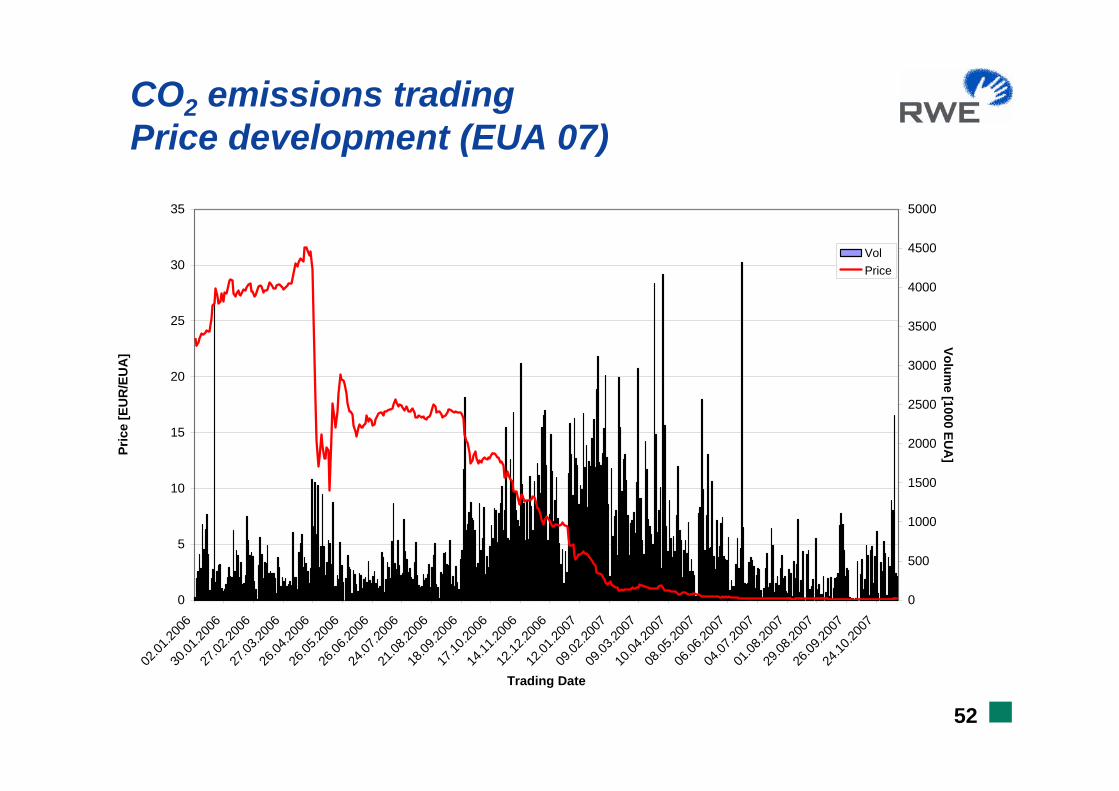
CO2 emissions trading Price development (EUA 07)
0
5
10
15
20
25
30
35
02.01
.2006
30.01
.2006
27.02
.2006
27.03
.2006
26.04
.2006
26.05
.2006
26.06
.2006
24.07
.2006
21.08
.2006
18.09
.2006
17.10
.2006
14.11
.2006
12.12
.2006
12.01
.2007
09.02
.2007
09.03
.2007
10.04
.2007
08.05
.2007
06.06
.2007
04.07
.2007
01.08
.2007
29.08
.2007
26.09
.2007
24.10
.2007
Trading Date
Pric
e [E
UR
/EU
A]
0
500
1000
1500
2000
2500
3000
3500
4000
4500
5000
Volume [1000 EU
A]
VolPrice

53
CO2 emissions trading Price Development (EUA 08)
0
5
10
15
20
25
30
35
02.01
.2006
30.01
.2006
27.02
.2006
27.03
.2006
26.04
.2006
26.05
.2006
26.06
.2006
24.07
.2006
21.08
.2006
18.09
.2006
17.10
.2006
14.11
.2006
12.12
.2006
12.01
.2007
09.02
.2007
09.03
.2007
10.04
.2007
08.05
.2007
06.06
.2007
Trading Date
Pric
e [E
UR
/EU
A]
0
2000
4000
6000
8000
10000
12000Volum
e [1000 EUA
]
VolPrice