Embed Size (px)
Citation preview

S-72.124 PRODUCT DEVELOPMENTOF TELECOMMUNICATION
SYSTEMS
I Elements of TelecommunicationProduct Development Process
II Tools for Generating and Cultivating Ideas

2 Helsinki University of Technology,Communications Laboratory, Timo O. Korhonen
Product Development ofTelecommunication Systems
■ Objectives: To understand modern, high-tech productdevelopment process by theory and practice
■ Course divides into lectures and yearly Workshop■ Lectures pinpoint dominant elements of success factors in
product development process■ Workshop deals with practical cases, takes full-day work for 4-5
days■ Course requirements: Exam and Workshop report■ Workshop reports are generated in groups■ Group tutoring by joint effort of HUT & industry partner(s). (Often
industry partner employs some students)■ Earlier Workshops arranged by Elisa, Telia, Ericsson etc.■ Remember to join to listen the lectures, also because all the
lecture material is not available at homepage:www.comlab.hut.fi/opetus/124

3 Helsinki University of Technology,Communications Laboratory, Timo O. Korhonen
Topics Today
■ Telecommunications product development elements– Developing telecommunication processes
• Elements and options• Case: Internet access
■ Tools for idea cultivation and project timing– How to produce ideas– How to select applicable ideas– How to sketch a project plan and recognize time
critical events

4 Helsinki University of Technology,Communications Laboratory, Timo O. Korhonen
Technology Politics, legislationregulation
Rapidly evolving applications
New lifestyles
GLOBAL NETWORKING ECONOMY
- Immediate, personalized, mobile access to services -
Information SocietyForce Field

5 Helsinki University of Technology,Communications Laboratory, Timo O. Korhonen
Research networking
Future & emerging technologies
Systems & services for the citizen
Multimediacontent & tools
Essential technologies& infrastructure
New methods of working & Electronic Commerce

6 Helsinki University of Technology,Communications Laboratory, Timo O. Korhonen
Home Access
TV/MOVIESGAMES
SERVICES
INTERNET PAY-PER-VIEW Copper
(2 way)
UTILITIESmonitoring
rate data
DVB-S
PHYSICALENERGY
DVB-Terrestial
DVB-C, Cable TV
ISDNADSL
GSM, GPRSUMTS
Mobile

7 Helsinki University of Technology,Communications Laboratory, Timo O. Korhonen
Product Development Process in TimeTheoretical functionality?
What about in practice?
Sub-unit functionality?
Functionality ofthe whole process?
Firstdemo
Practical proto
Mass production proto
Mass product

8 Helsinki University of Technology,Communications Laboratory, Timo O. Korhonen
Modern Product DevelopmentProcess Modules
Financing
Products
Production Process
Usability
Quality
Leadership
Project management
Strategic management
Innovations Patenting
Commercialization
Productdesign
Marketing
Business Plan

9 Helsinki University of Technology,Communications Laboratory, Timo O. Korhonen
■ Thursday 15.3, 2-4 PM, hall S4:Product Development Process andIdea CultivationProf. Timo O. Korhonen, Communications Laboratory, HUT
■ Friday 16.3, 10-12 AM, hall S4:Systematic Project ManagementProf. Karlos Artto, Institute of Strategy and InternationalBusiness, HUT
■ Wednesday 21.3, 10-12 AM, hall G:Operational and Strategic ManagementProf. Antti Ainamo, Institute of Business Economics, TampereUniversity
LecturingSchedule

10 Helsinki University of Technology,Communications Laboratory, Timo O. Korhonen
■ Thursday 22.3, 2-4 PM, hall S4:Leadership in New EconomyDirector Risto Koivula, Satama Interactive
■ Friday 23.3, 10-12 AM, hall S4:Nokia Success Factors in Global MarketsDirector Antti Koivula, Nokia Mobile Phones
■ Thursday 29.3, 2-4 PM, hall S4:High-Tech MarketingProf. Arto Rajala: Helsinki School of Economics and BusinessAdministration
■ Friday 30.3, 10-12 AM:, hall S4:User-Centered Design I:Product Concept CreationResearch Scientist Maria Köykkä, Usability Group,Communications Laboratory, HUT

11 Helsinki University of Technology,Communications Laboratory, Timo O. Korhonen
■ Thursday 5.4, 2-4 PM, hall S4:Financing New High-Tech EnterprisesProf. Peter Kelly, Institute of Strategy and InternationalBusiness, HUT
■ Friday 6.4, 10-12 AM, hall S4:B2B @-Market PlacesProf. Hannele Wallenius, Institute of Strategy and InternationalBusiness, HUT
■ Thursday 19.4, 2-4 PM, hall S4:User-Centered Design II: Ensuring UsabilityResearch Scientist Sanna Belitz, Usability Group,Communications Laboratory, HUT

12 Helsinki University of Technology,Communications Laboratory, Timo O. Korhonen
■ Friday 20.4, 10-12 AM, hall S4:Portal Service DevelopmentDirector Kari Penttilä, IOBOX Group
■ Thursday 26.4, 2-4 PM, hall S4:Patenting, Innovations and CopyrightInnovation Manager Panu Kuosmanen,Otaniemi International Innovation Center
■ Friday 27.4, 10-12 AM, hall S4:Quality in High-Tech Product DevelopmentSenior Research Scientist Pekka Järvinen, HUT

13 Helsinki University of Technology,Communications Laboratory, Timo O. Korhonen
What is the Point in Telecomm’s ProductDevelopment
■ Everything must work swiftly!■ Thus special requirements especially for
– leadership– project management– project workers– project work– networking– technology management– financial management– innovation cultivation– product launch

14 Helsinki University of Technology,Communications Laboratory, Timo O. Korhonen
Business Plan*
*Business Plan Pro by Palo Alto Software

15 Helsinki University of Technology,Communications Laboratory, Timo O. Korhonen
Plan Associated Tasks

16 Helsinki University of Technology,Communications Laboratory, Timo O. Korhonen
Producing and Cultivating Ideas
■ Innovation process is cultivated by decision makingand analysis tools:
– SWOT- and PMI- analysis
– Brainstorming
– Benchmarking
– Force Field Analysis
– Decision Tree
– Critical Path Analysis
– Mind Mapping

17 Helsinki University of Technology,Communications Laboratory, Timo O. Korhonen
Example of Idea Cultivation *:Developing Communicator
*S-72.124 in Spring ‘99
■ London is a basic model with all the essential properties. Ithas large target markets including both young adults as wellas basic business users. It comes with a compact LondonBridgeTM display that enables small size and high usability.
– Compact High Color Display– Hi-Fi Wide Stereo FM radio– VOD enabled– Wireless Phones by BlueToothTM
Technology– PictureTelTM Phone– Speech Control

18 Helsinki University of Technology,Communications Laboratory, Timo O. Korhonen
■ Monaco is the new fashionable communication tool designedespecially for Ladies. It carries a comfortable pearled shelloutlook with changeable fashion styled colors ensuring fitting forevery evening out-and-go. This model comes with fully equippedwith
– Speech control– Touch sensitive display– Ultra ergonomic usability– PictureTelTM Technology

19 Helsinki University of Technology,Communications Laboratory, Timo O. Korhonen
■ Florida is the state-of-the-art model for the elderly people. Youare ensured to be monitored while being at home or office andhelp can be immediately sent when required. This modelincorporates a mass of functionality to enable life long enjoyment:
– Health monitoring: Pulse, blood pressure, blood glucose– Velocity and acceleration sensors to detect possible fall-outs– Voice recognition
20 Helsinki University of Technology,Communications Laboratory, Timo O. Korhonen
■ Implant. This is model is scheduled to be marketed early2010. It consists of distributed components implanted nearto the target sensory organs. The communicator enablesreal-time, 3D interactions with one or several persons invirtual reality.
– Earphone is connected directly to ear-nerve ortransmitted via NMR technology
– Tooth or brain implanted microphone– Visual cortex or contact lens display

21 Helsinki University of Technology,Communications Laboratory, Timo O. Korhonen
Example of Idea Cultivation :Desired Net-Music Deliverance Cash Flow

22 Helsinki University of Technology,Communications Laboratory, Timo O. Korhonen
How to select the cultivation method?■ An analysis tool is applicable when there is enough information
for its usage!■ Some methods are primarily targeted for mapping the current
status (SWOT), other for decision making (PMI) and some aregeneral purpose tools to assist project management (CriticalPath Analysis).
■ Methods work well when they are used simultaneously in-seriesor in-parallel, as for instance SWOT+brainstorming
■ Successful product development requires that one should havesufficient information about– customer requirements– competitors’ product launches– markets in general– latest technology
■ Also vision of future trends is important!
Customers
Markets Technology
Competitors
Future visions

23 Helsinki University of Technology,Communications Laboratory, Timo O. Korhonen
SWOT analysis■ SWOT is applicable for sorting unorganized knowledge bases
and analyzing current status■ Successful SWOT yields structured mapping of the problem at
hand■ For instance in product analysis
– identify strength and weaknesses of the product– search through possibilities and threats (for instance for
product launch)■ Realization: List all the relevant properties and sort them into
SWOT boxes!
Strength Weakness
Opportunity Threats
inside
outside

24 Helsinki University of Technology,Communications Laboratory, Timo O. Korhonen
The SWOT questions: Strengths andWeaknesses
■ Strengths:– What are the advantages?– What is well-done?
■ Consider this from differentpoint-of-views: As Competitors,Customers, Technology
■ Weaknesses:– What could be improved?– What is done badly?– What should be avoided?
■ Can other interest groups note the weaknesses that you see?Could this give you a competitive edge?
■ Weaknesses are best to realize as early as possible
Strength Weakness
Opportunity Threats

25 Helsinki University of Technology,Communications Laboratory, Timo O. Korhonen
The SWOT questions: Opportunities
■ Opportunities (directed moreoutwards from the product than the strengths):– Where are the good chances facing the product?– What are the interesting trends?
■ Useful opportunities can come from things like:– Changes in technology and markets on both in broad and
narrow scale– Changes in government policy related to your field– Changes in social patterns, population profiles, lifestyle
changes, etc.
Strength Weakness
Opportunity Threats

26 Helsinki University of Technology,Communications Laboratory, Timo O. Korhonen
The SWOT questions:Threats
■ Threats: (directed more outside than the weaknesses)■ What obstacles are to be faced?■ What competitors are doing?■ Are the required specifications for tasks, products or services
changing?■ Is changing technology threatening the product or process?
How?■ Is there some general ‘ climate change ’ going on?■ Does you your process have bad debt or cash-flow problems?
Strength Weakness
Opportunity Threats

27 Helsinki University of Technology,Communications Laboratory, Timo O. Korhonen
The SWOT analysis; a case study:WAP-based Knowledge Base*
Strength Expandable, flexible, easy to use, dynamic, easy to personalize,
bypassing of telephone exchange, more
effective graphics, utilization of location information
WeaknessNeed for WAP terminal
managing, search routines require
dedication
OpportunityIf first at the market may
be a killer-kind app.Due to usage of immediate
location info by GPS or GSM location technology
ThreatsNo popularity,
one applies terminal specificcatalogs, competitive
techniques may hit markets
*S-72.124 spring ‘99

28 Helsinki University of Technology,Communications Laboratory, Timo O. Korhonen
Brainstorming*
■ Objectives: Bring about creative solutions (even forunidentified!) problems
■ Take solution candidates one after another until very unusualsolutions are also generated
■ For a start take a word or words, from “a dictionary at hand” tofeed the process and apply associations
■ Generate ideas without critics! Thus
– many potential solution candidates are generated
– whole problem dilemma may change!
■ For concluding the session
– analyze results for instance by SWOT, PMI and/or MindMapping
– Condensed and classified ideas can be used to support newsessions or they can be used to support conventionalsolutions
*Edward de Bono, Serious Creativity, HarperBusiness, New York, US, 1992

29 Helsinki University of Technology,Communications Laboratory, Timo O. Korhonen
Brainstorming - leader and group tasks
■ Session leader (The leader must be selected!):– definition of the start-up point– gives limits to the problem– gives limits to discussions (These limits must be very broad)– minute amount of critics– encouraging and enthusiastic– follows (the fixed) session time table!– Takes care that ‘idea jamming’ is only temporary!
■ Session participants:– have diverged orientations related to the problem at hand– their background is as different as possible

30 Helsinki University of Technology,Communications Laboratory, Timo O. Korhonen
Individual vs. Group Brainstorming
■ Individual BS– many ideas– tendency to jam into fixed trails– easy to find unresolved questions
■ Group BS– ideas develop themselves into more elaborated form– ideas develop more efficiently– there might be less ideas (group follows the group laws!)
■ One may mix individual and group barnstorming: For instanceeach member might first BS of his own and then one may havea meeting based on each individual’s BS sessions
31 Helsinki University of Technology,Communications Laboratory, Timo O. Korhonen

32 Helsinki University of Technology,Communications Laboratory, Timo O. Korhonen
Mind Mapping
■ Mind Mapping is a technique organizing information in its naturalassociative way, that is multidimensional.
■ Procedure:– List the main topic, subtopics and facts. Search short
expressions for them all.– Identify the main connections between themes– Set the main theme in the middle of the paper and arrange
the sub-themes to surround the main theme– Connect the themes– Use colors to separate different idea groups– Indicate interdependencies as the cause and consequence
by arrows– Use symbols and figures and even sub-maps to give to total
picture

33 Helsinki University of Technology,Communications Laboratory, Timo O. Korhonen
A Mind Mapping of Time Management

34 Helsinki University of Technology,Communications Laboratory, Timo O. Korhonen
Mind Mapping Summarized– A mindmap is an associative structure. Therefore its
topology contains a lot of information.– Mindmap allows to identify the essential features and links of
the problem at glance.– Mindmaps can be an extremely compact way to present
information.– A problem of mind mapping is that the chart may up to be so
messy that it can even hide the main themes. Thereforemindmap can, and should be cultivated after it is formed bypruning less important branches
– Mindmaps can be created by a computer program (asMindManager® or eMindMaps®) or by using simpledetachable notes in a blackboard.
35 Helsinki University of Technology,Communications Laboratory, Timo O. Korhonen
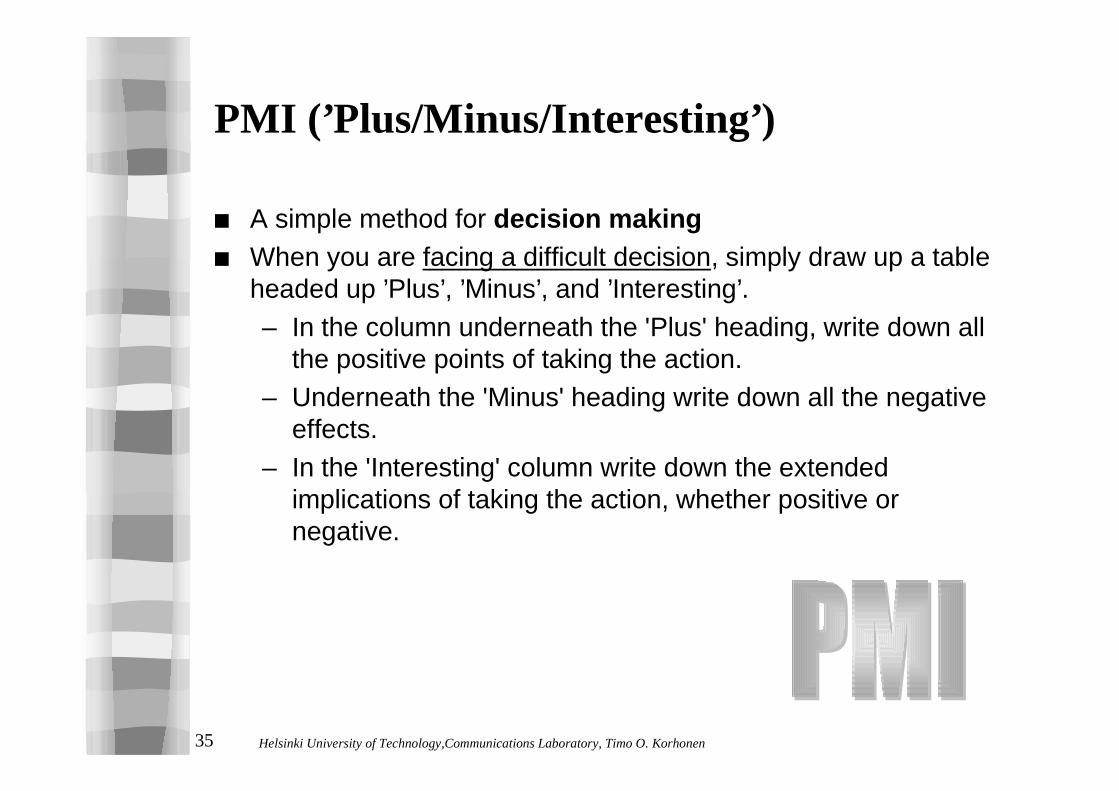
PMI (’Plus/Minus/Interesting’)
■ A simple method for decision making■ When you are facing a difficult decision, simply draw up a table
headed up ’Plus’, ’Minus’, and ’Interesting’.– In the column underneath the 'Plus' heading, write down all
the positive points of taking the action.– Underneath the 'Minus' heading write down all the negative
effects.– In the 'Interesting' column write down the extended
implications of taking the action, whether positive ornegative.

36 Helsinki University of Technology,Communications Laboratory, Timo O. Korhonen
Scoring your PMI table
■ You may be able to make a decision just from the table youhave drawn up
■ Alternatively, consider each of the points you have written downand assign a positive or negative score to each appropriately
■ The scores you assign can be entirely subjective. Once youhave done this, add up the score
■ A strongly positive score indicated that an action should betaken, a strongly negative score that it should be avoided

37 Helsinki University of Technology,Communications Laboratory, Timo O. Korhonen
A PMI Example

38 Helsinki University of Technology,Communications Laboratory, Timo O. Korhonen
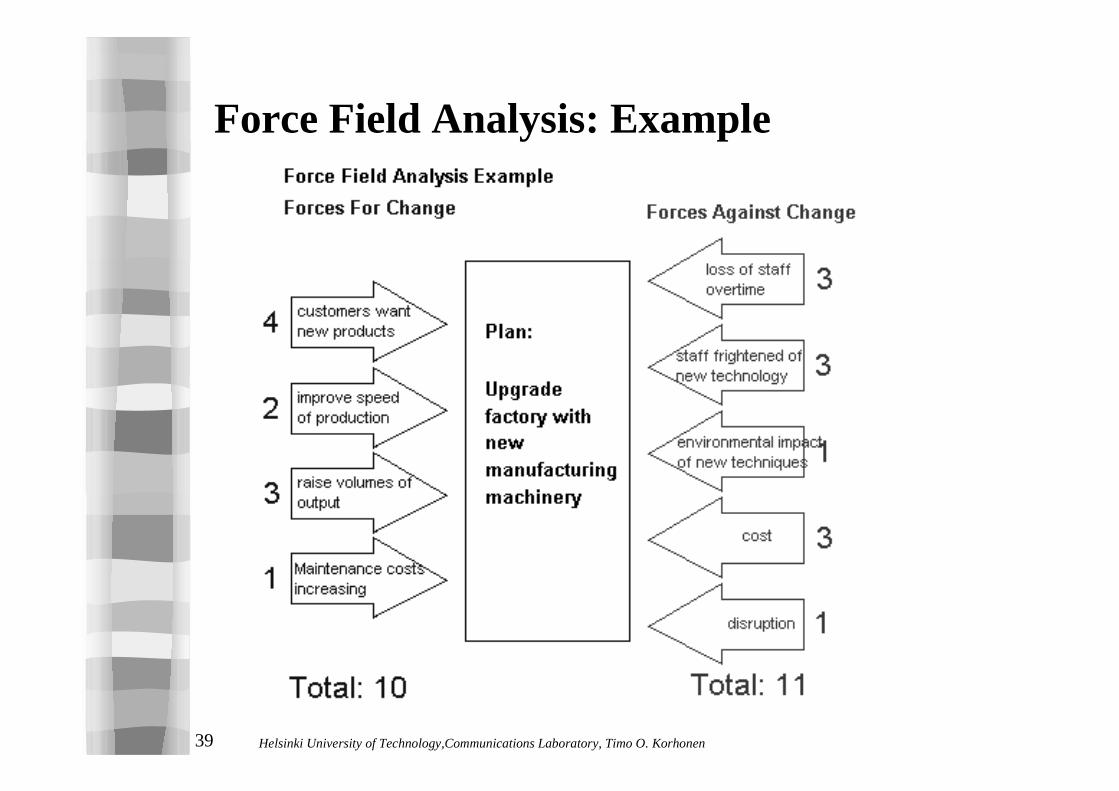
Force Field Analysis
■ Objective: To create an unified description of the factors formingthe problem. This is used to alter the process state to thewanted direction!
■ FFA is a weighted PMI method■ Benefits
– Describes all the relevant forces– Allows to plan
• contra strategies for negative forces• supporting strategies for positive forces
■ The FFA method: Identify, Sort and Grade the different forcesand illustrate the problem by a diagram including the forces!
■ The first result of this method describes the current state■ Alteration of forces can change the current state to the
objective state!
39 Helsinki University of Technology,Communications Laboratory, Timo O. Korhonen
Force Field Analysis: Example

40 Helsinki University of Technology,Communications Laboratory, Timo O. Korhonen
Benchmarking
■ Benchmarking is based on using key-figures and measurementsto rank alternatives (often near to reverse engineering orlearning by copying)
■ Can be applied to compare multidimensional alternatives ascompanies, products etc
■ Example: Analysis of competitors and partners to find out– Could the company be improved– Could the products be improved– How to get ourselves competitive!
■ Often benchmark some company within own industry■ Often want to learn how competitors survive …
but what if the competition is worse than your company ???What’s the use then?
■ Benchmark a company that is well known for being a goodmodel!!!

41 Helsinki University of Technology,Communications Laboratory, Timo O. Korhonen
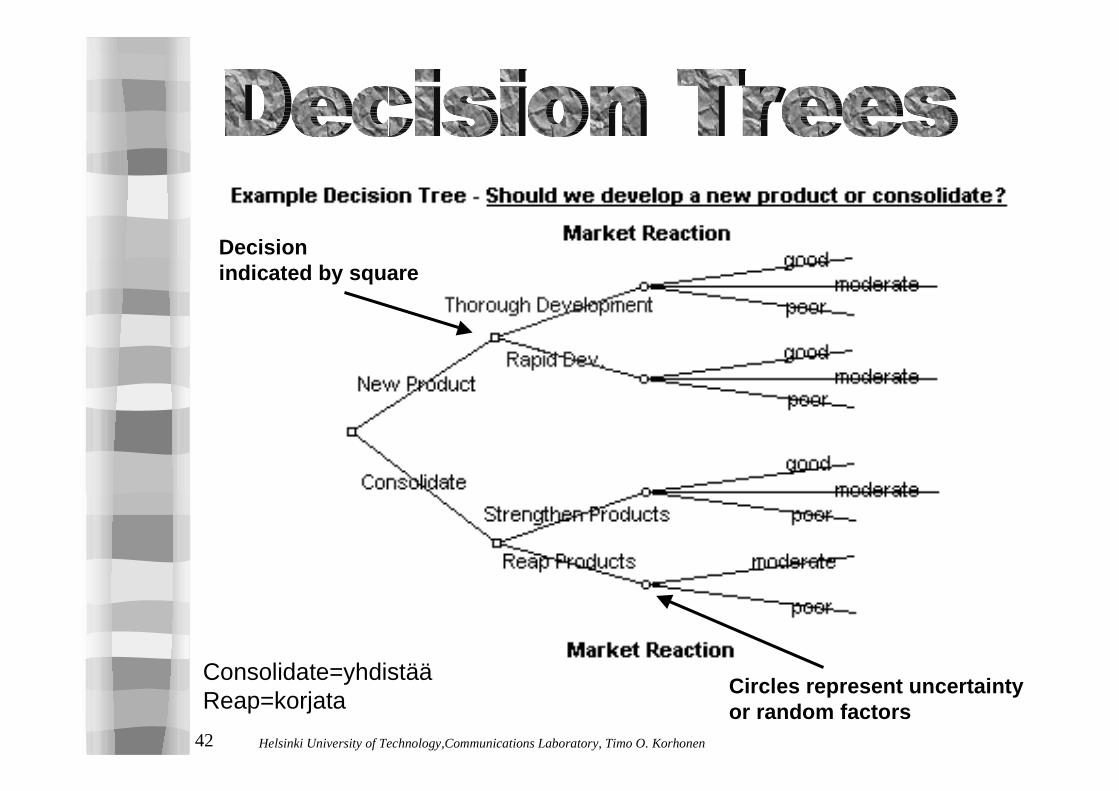
Decision Trees■ Usage: To analyze especially strictly economical and
numerical decisions■ Applicable when a lot of complicated information is associated
to the decision making process■ The analysis results in a system model that gives arguments to
– make a justified ’best decision’– consider decision alternatives– understand effects of the decisions already undertaken– understand risks involved
■ Tree building stages:– tree skeleton– decision probability and net income evaluation– solution path weighting– cost evaluation– final inspection of the tree
42 Helsinki University of Technology,Communications Laboratory, Timo O. Korhonen
Consolidate=yhdistääReap=korjata
Decisionindicated by square
Circles represent uncertainty or random factors
43 Helsinki University of Technology,Communications Laboratory, Timo O. Korhonen
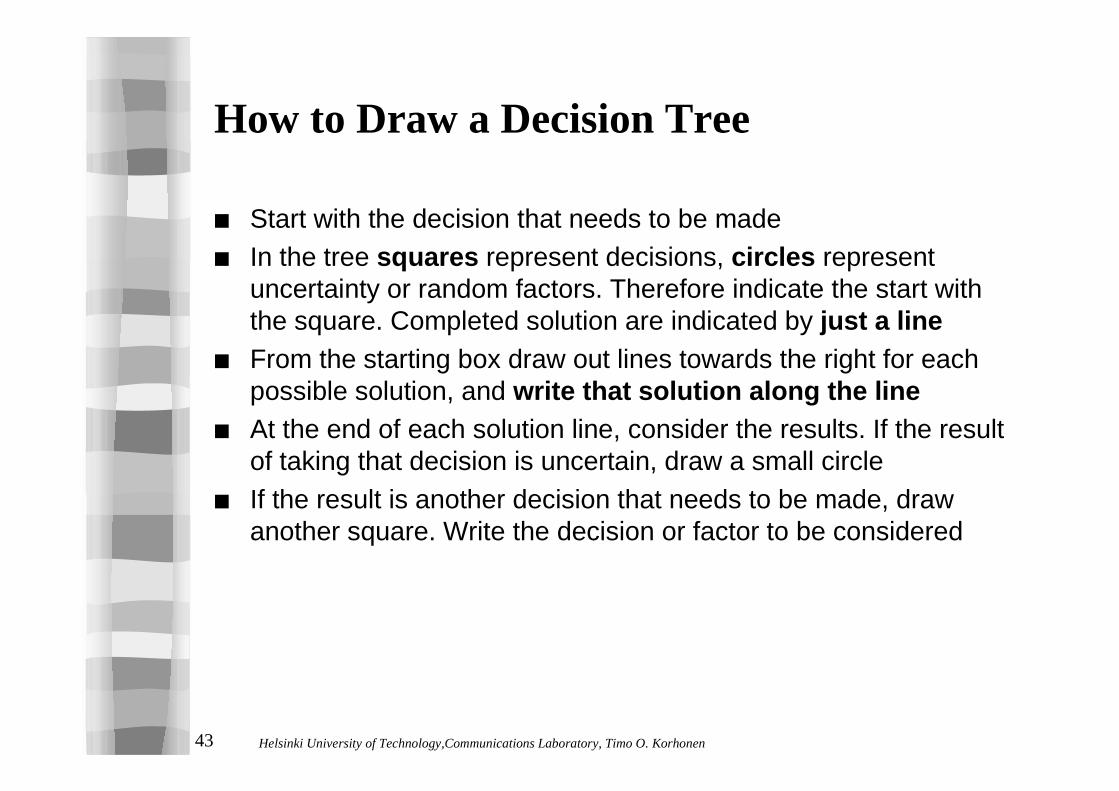
How to Draw a Decision Tree
■ Start with the decision that needs to be made■ In the tree squares represent decisions, circles represent
uncertainty or random factors. Therefore indicate the start withthe square. Completed solution are indicated by just a line
■ From the starting box draw out lines towards the right for eachpossible solution, and write that solution along the line
■ At the end of each solution line, consider the results. If the resultof taking that decision is uncertain, draw a small circle
■ If the result is another decision that needs to be made, drawanother square. Write the decision or factor to be considered
44 Helsinki University of Technology,Communications Laboratory, Timo O. Korhonen
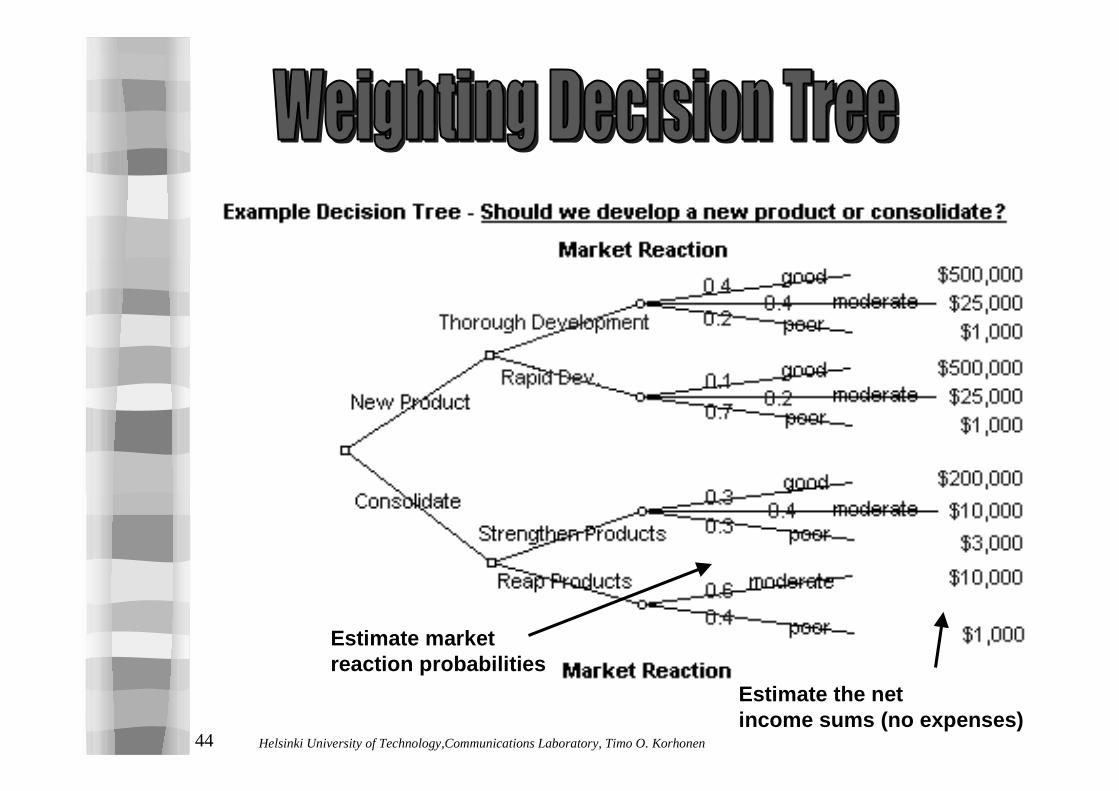
Estimate the net income sums (no expenses)
Estimate marketreaction probabilities

45 Helsinki University of Technology,Communications Laboratory, Timo O. Korhonen
■ Now you are ready to evaluate the decision tree. This is whereyou can calculate the decision that has the greatest worth toyou.
■ Start by assigning a cash or numeric value to each possibleoutcome - how much you think it would be worth to you. Youshould neglect the costs at this time.
■ Next look at each circle (representing an uncertainty point) andestimate the probability of each outcome.
■ If you use percentages, the total must come to 100% at eachcircle. If you use fractions, these must add up to 1. If you havedata on past events you may be able to make rigorousestimates of the probabilities.Otherwise write down your bestguess.
■ If you do not have statistical info apply civilized guesses!
Weighting Decision Tree

46 Helsinki University of Technology,Communications Laboratory, Timo O. Korhonen
Evaluating Net Cash Flow for Paths

47 Helsinki University of Technology,Communications Laboratory, Timo O. Korhonen
Net Cash Outcome from all Paths

48 Helsinki University of Technology,Communications Laboratory, Timo O. Korhonen
Net Cash Flow for Paths
■ Review of what has happed so far:– Net outcome of the potential solution are determined– branching alternative probabilities are evaluated
■ Next determine the true net outcome order of potentialalternatives
■ Start from the right edge of the tree and indicate the trueoutcome of the each solution path as demonstrate on the nextslide
■ The end result is an evaluation of the true net outcomeassociate to the each alternative

49 Helsinki University of Technology,Communications Laboratory, Timo O. Korhonen
Profitwithoutexpenses
Maximumprofit whiletaking thispath
Resulting totalprofit for thispath
Subtracting the Costs

50 Helsinki University of Technology,Communications Laboratory, Timo O. Korhonen
Decision Trees Summarized
■ Decision trees provide an effective method for decision makingbecause they:
• clearly lay out the problem so that all the choicescan be viewed, discussed and challenged
• provides a framework to quantify the outcome andthe associated probability
• help us to make the best decisions on the basis ofour existing information (or the best guesses)
■ Result accuracy comparable to accuracy of statisticalknowledge
■ Often many factor must be evaluated by experience andcommon sense: this is a point to apply group work also here

51 Helsinki University of Technology,Communications Laboratory, Timo O. Korhonen
Critical Path Analysis
■ A method for project analysis and management that points outthe critical phases of the project
■ Enables to define– minimum time span to complete the project– prioritization of tasks
■ Therefore it allows to focus on central project activities thatrequire concentration of usable resources and activities
■ CPA is a foundation for project– planning– scheduling– monitoring

52 Helsinki University of Technology,Communications Laboratory, Timo O. Korhonen
Critical Path Analysis Stages
■ List your processes stages and estimate their– duration– interdependencies
■ Draw a draft of CPA chart■ Schedule the chart in order recognizing
– parallel– serial activities

53 Helsinki University of Technology,Communications Laboratory, Timo O. Korhonen
Cus
tom
writ
ten
com
pute
r in
stal
latio
n
Critical Path Analysis:Listing the Project Phases

54 Helsinki University of Technology,Communications Laboratory, Timo O. Korhonen
Cus
tom
writ
ten
com
pute
r in
stal
latio
n

55 Helsinki University of Technology,Communications Laboratory, Timo O. Korhonen
Critical Path Analysis:Listing the Project Phases
■ 1. Give tittles for all the phases■ 2. Indicate for the each phase
– earliest possible starting time– estimated duration– estimate if the phase is of the serial type or the parallel type
■ Indicate interdependencies■ Try to make as complete listing as possible to reduce later
editing (=Get the required facts!)

56 Helsinki University of Technology,Communications Laboratory, Timo O. Korhonen
Series- and Parallel Activities
■ Analysis is based on identification of interdependent andindependent project activities: For instance one can not put upthe walls in a house before laying down the bases! However,much of the gardening planning can be done before the houseis build up.
■ Series activities are interdependent: they must be processed ina certain order
■ Parallel activities can be processes relatively independently■ Series and parallel activities might be temporal, e.g. they are
defined for a certain project phase only.

57 Helsinki University of Technology,Communications Laboratory, Timo O. Korhonen
How to Estimate the Time Taken toAchieve Project Goals
■ Time evaluation is difficult for new tasks■ Typically time is underestimated due to
– Influence of the unexpected changes– Unscheduled high priority work is forgotten– Accidents and emergencies– Meetings– Breakdowns in equipment– Quality control rejections
■ If the accuracy of time estimates is critical, you may find iteffective to develop a systematic approach to including thesefactors
■ Typically realistic time estimation is done based on pastexperience

58 Helsinki University of Technology,Communications Laboratory, Timo O. Korhonen
Plot the Tasks on a Graph Paper
■ Head up graph paper with the days or weeks through to taskcompletion
■ Start on the earliest start dates, and mark on the duration
■ Show the tasks as arrows, and the ends of tasks with dots
■ Above the task arrows, mark the time taken to complete thetask. Do not worry about task scheduling yet - all we are doingis setting up the first draft of the analysis
■ Once you have plotted the tasks, plot in lines to showdependencies

59 Helsinki University of Technology,Communications Laboratory, Timo O. Korhonen
Tasks indicated by thick arrows
Circles show completion dates
Thin lines show interdependencies

60 Helsinki University of Technology,Communications Laboratory, Timo O. Korhonen
Scheduling Activities
■ Take the draft analysis, and use it to schedule the actions in theplan, in such a way that sequential actions are carried out in therequired sequence.
■ Parallel actions should be scheduled so that they do notinterfere with sequential actions on the critical path, if possible.
■ While scheduling, bear in mind the resources you haveavailable, and allow some slack time in the schedule for hold-ups, over-runs, failures in delivery, etc.

61 Helsinki University of Technology,Communications Laboratory, Timo O. Korhonen
Critical pathindicated by blue
Non-critical pathsindicated by red
Duration in weeks
Gantt Chart Summarizes CPA:

62 Helsinki University of Technology,Communications Laboratory, Timo O. Korhonen
Presenting the Analysis by Gantt Chart
■ Here time is marked out in columns across the chart, withindividual tasks represented as arrows terminating at dots. Thelength and positions of the arrows show the start date andduration of the tasks
■ You may prefer to show tasks in pure Gantt format, as solid barsrather than arrows terminating in dots. Similarly you may prefernot to show the linkages between related tasks - this is a matterof personal taste and personal convention
■ The Critical Path is the longest sequence of dependentactivities that lead to the completion of the plan. Any delay of astage in the critical path will delay completion of the whole planunless future sequential activities are speeded up

63 Helsinki University of Technology,Communications Laboratory, Timo O. Korhonen
Summarizing Critical Path Analysis
■ Critical Path Analysis is an efficient project planning tool thatindicates– Project tasks– Parallel tasks– Serial tasks– Project time table– Required resources– Internal timing– The most important, interdependent tasks– Can be used to analyze risks when the critical path is
identified and secured

64 Helsinki University of Technology,Communications Laboratory, Timo O. Korhonen
In Conclusion...
■ We had an overview on Telecommunications ProductDevelopment Process
■ We discussed the following ”mind- and process mapping”techniques:
– SWOT and PMI analysis
– Brainstorming
– Mind Mapping
– Force Field Analysis
– Decision Tree
– Critical Path Analysis
■ The best way to learn these methods is to try them!