Embed Size (px)
Citation preview
So
ci
al
S
ci
en
ce
T
oo
lS
f
or
c
oa
ST
al
P
ro
gr
am
S
surveyI n t r o d u c t I o n t o
Design & Delivery
Social Science tools for coastal Programs
Introduction to Survey design and delivery
About This PublicationSome of the most challenging decisions in coastal management stem from the relationship between people and the environment. The National Oceanic and Atmospheric Administration’s Coastal Services Center provides technical assistance to coastal management professionals addressing complex human-based problems. “Introduction to Survey Design and Delivery” is the first in a series of publications developed to bring information to this audience about the use of social science tools in their field of work. For additional information about social science tools and applications, please visit www.csc.noaa.gov/cms/human_dimensions/focus_socialsci.html.
About the noAA coastal Services centerThe Coastal Services Center, an office within the federal government’s National Oceanic and Atmospheric Administration (NOAA), works with state and local programs devoted to the wise management of our nation’s coastal resources. The NOAA Coastal Services Center provides these programs with tools, training, and expertise that might otherwise be unavailable. To learn more about the products and services available from this agency, visit www.csc.noaa.gov.
table of contents
Introduction ................................................................................................................ 1
Population and Sample Size ........................................................................................ 1
Survey Delivery Mechanisms ...................................................................................... 3
Sampling Techniques .................................................................................................. 5
Constructing Survey Questionnaires .......................................................................... 7
The Report .................................................................................................................. 12
Appendix A: Guide to Survey Sampling and Analysis Terms ...................................... 13
Appendix B: Guide to Survey Types ............................................................................ 15

�
IntroductionOften, the public’s attitudes, perceptions, and beliefs strongly influence management decision making. Social science tools, such as a survey instrument, can help identify the relationship between the community and natural resources. Surveys are a method of collecting data via telephone, mail, or the Internet, as well as in person, using an ordered list of questions to gather important information in a systematic fashion. This technique allows for the collection of information and opinions from a representative sample of individuals related to specific natural resource management issues. This document provides insight into the various types and methods of survey research.
The most important component of any successful survey project is to have a strong study conceptualization. Conducting a survey is much more complex than just asking a group of people a series of questions to try to solve a problem or better understand an issue. Rather, a survey is a systematic examination of a population by means of a series of specific, targeted questions. These questions should possess direct application in solving an identified problem or issue. The development of a survey simply for the purpose of determining what people think (e.g., pleased, displeased, concerned, happy, etc.) often generates data that are of limited utility. As with any professional undertaking, the most successful projects are generally a result of professional knowledge and expertise. Survey research is no different. Research within any academic discipline must follow specific, methodic protocols. Once information has been collected, specific statistical data testing methods must be employed to produce usable information. The intent of this document is to provide insight into the various methodological components of survey research. The document serves as an overview of survey-related techniques and as a means for coastal managers to understand basic survey information and terminology (Appendix A) to strengthen awareness and understanding of such projects.
Population and Sample SizeDetermining an adequate sample size is critical in generating usable survey results; however, it is difficult to identify a specific population to study large-scale issues such as beach access. Beach visitors include local residents and people across a particular state, as well as people from other states and nations. In this instance, the number of potential visitors is indefinite and virtually impossible to quantify accurately.
The size of a sample, however, is not nearly as important as the sample design. If you are conducting a survey, it is more important to obtain a representative sample than a large sample. A sample size that is larger than necessary will in no way compromise the results
Conducting a survey i s much more complex
than just asking a group of people a series
of questions to try to solve a problem.
�
of your study, but it will misuse time, effort, and financial resources. It is more useful to identify the population of interest and make efforts to achieve a high response rate rather than administer vast numbers of surveys.
For the most rigorous approach to a sampling, it is important to consider such items such as the margin of error, degree of accuracy, and the most practical sampling strategy to use. These and other terms are described in Appendix A. With pilot data in hand, an experienced individual can help you work out the total sample size you need for the degree of accuracy you choose. Information on pilot testing is highlighted in Appendix B.
Fortunately, you do not need to be concerned about knowing the size of an exceptionally large population (e.g., a community, township, or user group such as recreational fishermen of the Chesapeake Bay). Laws of mathematical probability tell us in such instances that population size is of much less concern than the sample size, though there are links between the size of your sample and the level of analysis that can be performed following the survey. Statistical analysis can be categorized into two types: descriptive and inferential. Descriptive statistics (e.g., mean, median, standard deviation) are used to summarize or describe the survey results, such as the average number of males and females, the number of people over the age of 45, etc. Inferential statistics are a bit more complex. Inferential statistics allow the researcher to arrive at a certain conclusion that is based on probability. For example, a survey of sea kayakers may suggest that females over the age of 45 exhibit greater pro-environmental behaviors than males under the same conditions. Inferential statistics reveal the degree to which different variables are related. In the previous example, pro-environmental behavior is related to both gender and age.
The following is a general example to show how sampling works with a large population. If you survey 500 people, stastically your results are equally significant whether the total population is 10,000 or 100,000. For this example, where a large population whose exact number is unknown, an appropriate minimum sample size is 384.
By sampling this number of people (with a 100 percent response rate) you are ensuring a 95 percent confidence level with a confidence interval or margin of error of 5. This confidence level and margin of error is the standard desired level of significance for most survey research. The confidence level reflects how certain you can be that the survey results are accurate. In this instance, the results would prove to be 95 percent accurate, and the 5 percent margin of error is commonly sought. You could therefore state that results of your survey are 95 percent accurate, plus or minus 5 percent of people surveyed. Please remember that this sampling scenario is a general example and is not
applicable to all situations.
�
Main Points:
• There is much greater benefit in obtaining a representative sample than in obtaining an exceedingly large sample.
• If you have the time, contacts, and resources to be more rigorous about a sampling scheme, try to ensure that your responses possess a 95 percent confidence level.
• Determining an adequate sample size is best determined by someone professionally trained in survey techniques.
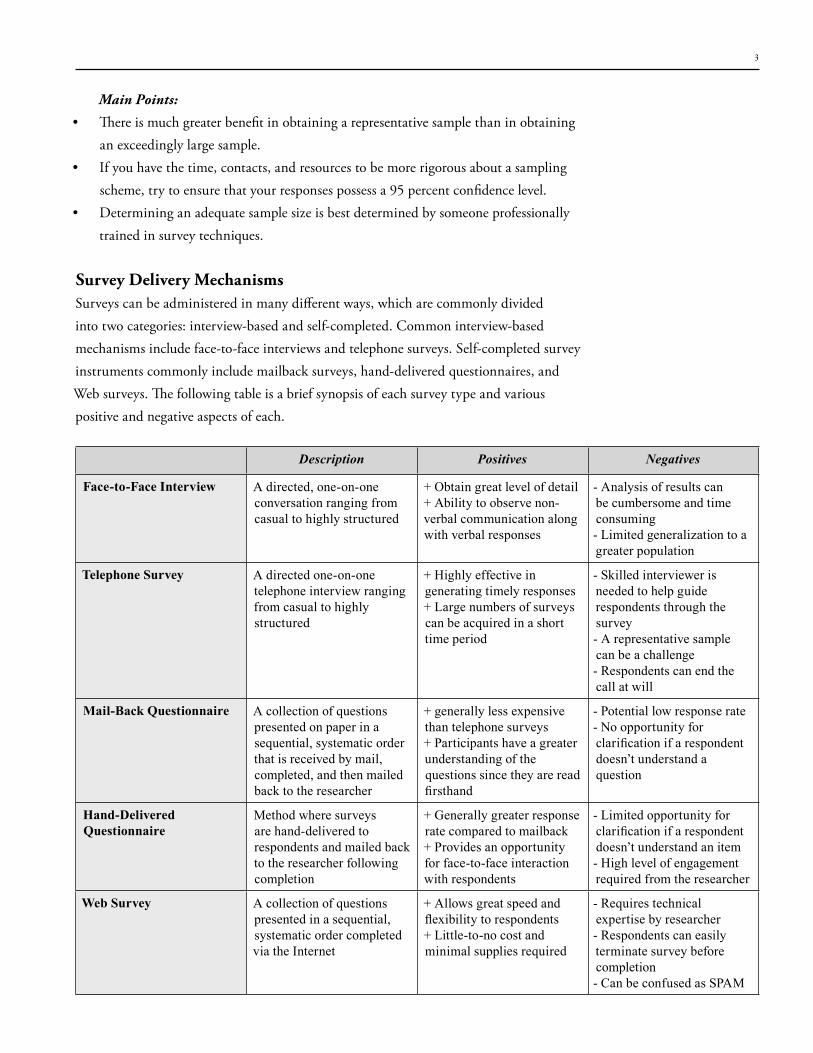
Survey delivery MechanismsSurveys can be administered in many different ways, which are commonly divided into two categories: interview-based and self-completed. Common interview-based mechanisms include face-to-face interviews and telephone surveys. Self-completed survey instruments commonly include mailback surveys, hand-delivered questionnaires, and Web surveys. The following table is a brief synopsis of each survey type and various positive and negative aspects of each.
Description Positives Negatives
Face-to-Face Interview Adirected,one-on-oneconversationrangingfromcasualtohighlystructured
+Obtaingreatlevelofdetail+Abilitytoobservenon-verbalcommunicationalongwithverbalresponses
-Analysisofresultscanbecumbersomeandtimeconsuming-Limitedgeneralizationtoagreaterpopulation
Telephone Survey Adirectedone-on-onetelephoneinterviewrangingfromcasualtohighlystructured
+Highlyeffectiveingeneratingtimelyresponses+Largenumbersofsurveyscanbeacquiredinashorttimeperiod
-Skilledinterviewerisneededtohelpguiderespondentsthroughthesurvey-Arepresentativesamplecanbeachallenge-Respondentscanendthecallatwill
Mail-Back Questionnaire Acollectionofquestionspresentedonpaperinasequential,systematicorderthatisreceivedbymail,completed,andthenmailedbacktotheresearcher
+generallylessexpensivethantelephonesurveys+Participantshaveagreaterunderstandingofthequestionssincetheyarereadfirsthand
-Potentiallowresponserate-Noopportunityforclarification if a respondent doesn’tunderstandaquestion
Hand-Delivered Questionnaire
Methodwheresurveysarehand-deliveredtorespondentsandmailedbacktotheresearcherfollowingcompletion
+Generallygreaterresponseratecomparedtomailback+Providesanopportunityforface-to-faceinteractionwithrespondents
-Limitedopportunityforclarification if a respondent doesn’tunderstandanitem-Highlevelofengagementrequiredfromtheresearcher
Web Survey Acollectionofquestionspresentedinasequential,systematicordercompletedviatheInternet
+Allowsgreatspeedandflexibility to respondents+Little-to-nocostandminimalsuppliesrequired
-Requirestechnicalexpertisebyresearcher-Respondentscaneasilyterminatesurveybeforecompletion-CanbeconfusedasSPAM
�
Face-to-Face Interview/Survey
Face-to-face interviews and surveys involve verbal exchange between the interviewer and a single individual. The general distinction between an interview and a survey is question structure.
• Interviews generally use open-ended questions to obtain in-depth information about a topic, or qualitative information.
• Surveys generally use numeric and categorical responses leading to more general and concise responses, or quantitative information.
Questions in both methods are highly structured so that results can be compiled and compared. If conducted properly, a face-to-face interview results in a generally high response rate and high-quality data. Availability of respondents is another consideration. Face-to-face interviews require respondents to participate immediately or to schedule a time to convene. Appendix B provides additional information on the benefits and limitations of interviews and other topical survey areas.
Telephone Survey
Telephone surveys are highly effective in generating timely responses. This method is quicker than the face-to-face method. Large numbers of surveys can be acquired in a relatively short time period. As with other verbal techniques, a skilled interviewer is needed to help respondents understand the purpose, time requirements, and survey items. Acquiring a representative sample can be a limiting factor. Partial data are another limitation of telephone surveys, and respondents can terminate an interview at any point by simply hanging up the telephone.
Mail-Back Questionnaire
Mail-back questionnaires provide an opportunity to reach a much broader audience than many other survey methods. A greater portion of the general population possesses a mailing address than a telephone or Internet access. Cost, printing and postage, is relatively inexpensive compared to travel expenses. Though mail-back questionnaires are convenient for respondents, the researcher must wait a longer time for results and take measures to maximize response rates by sending additional surveys and reminder mailings. Current names and addresses are also necessary for adequate participation and response.
Hand-Delivered Questionnaire
This type of questionnaire is essentially the same as other versions except in the way it is administered to respondents. This type of questionnaire is provided to respondents in person, where they are informed of the purpose of the project. Questionnaires are then completed by respondents and returned by mail or picked up at a central location
If conducted properly, a face-to-face interview results in a generally high response rate and high-quality data.
�
by the surveyor. This method generally receives a greater response rate than the typical mail survey. Hand-delivering the questionnaire presents the opportunity for personal interaction. Respondents may feel more compelled to complete the survey if a positive interaction takes place with the researcher.
Web Survey
Web surveys gather respondent information via the Internet. Information is generally collected by e-mailing respondents a link to an on-line survey. Many research and consulting companies possess their own electronic collection program. On-line surveying can also be independently conducted by means of many Web sites. A few popular Web survey sites are Zoomerang, Insiteful Surveys, and Survey Monkey. These sites, as well as others, offer a variety of free and pay-service options. An advantage of Web surveys is that responses are automatically compiled and outputs are automatically generated. Besides time efficiency, other advantages to Web surveys include reduction in paper and printing costs, and convenience for respondents, who can complete the survey at their convenience.
The greatest detriments to Web surveys are that respondents must possess basic typing and information technology skills, obtain access to a computer with Web access, and, in most cases, have an e-mail account. Additionally, creation of the survey instrument must comply with the constraints of the electronic system used to deliver the instrument.
Sampling techniquesA sample is a relatively small group of individuals selected to represent one or more specific attributes of a greater population. Survey-related research must use a truly representative sample for questioning, and there are many strategies for acquiring a representative sample. Applying the appropriate sampling technique to a particular issue or research question will strengthen the validity of acquired information. Several commonly used sampling techniques relevant to broad coastal issues are discussed below.
Simple Random Sampling
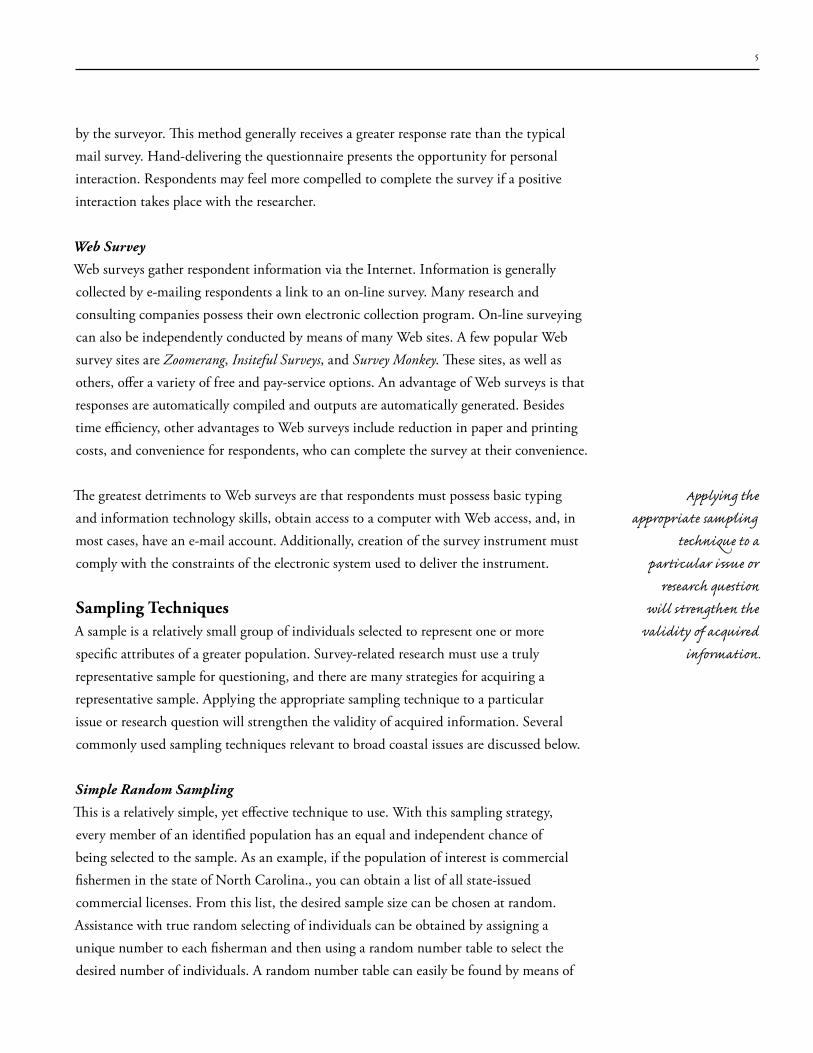
This is a relatively simple, yet effective technique to use. With this sampling strategy, every member of an identified population has an equal and independent chance of being selected to the sample. As an example, if the population of interest is commercial fishermen in the state of North Carolina., you can obtain a list of all state-issued commercial licenses. From this list, the desired sample size can be chosen at random. Assistance with true random selecting of individuals can be obtained by assigning a unique number to each fisherman and then using a random number table to select the desired number of individuals. A random number table can easily be found by means of
Applying the appropriate sampling
technique to a particular issue or
research question will strengthen the
validity of acquired information.
�
a quick on-line search or in print in nearly any introductory statistics textbook. Many software programs are useful in generating random numbers as well. One such number-generating tool is located on the GraphPad Software Web site at the following Web address: www.graphpad.com/quickcalcs/randomN1.cfm . Diagram A models the concept of random sampling.
Diagram A – Simple Random Sampling
Population
Population
Population
Sample
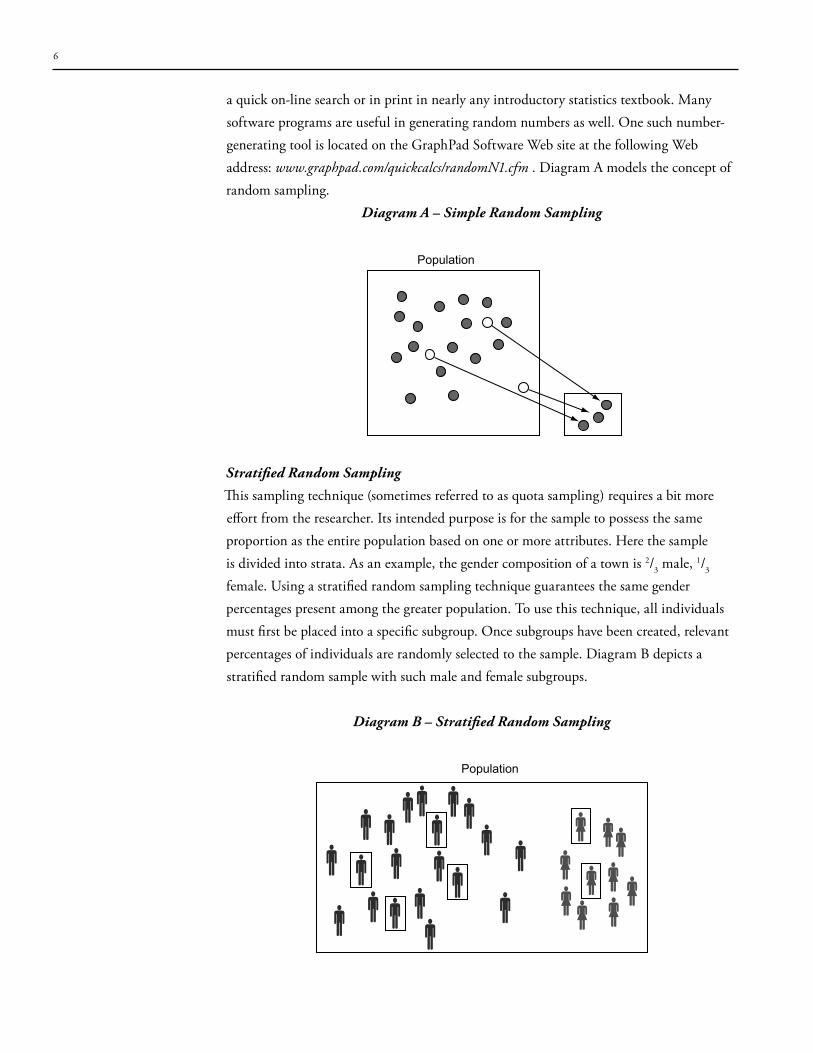
Stratified Random Sampling
This sampling technique (sometimes referred to as quota sampling) requires a bit more effort from the researcher. Its intended purpose is for the sample to possess the same proportion as the entire population based on one or more attributes. Here the sample is divided into strata. As an example, the gender composition of a town is 2/3 male, 1/3 female. Using a stratified random sampling technique guarantees the same gender percentages present among the greater population. To use this technique, all individuals must first be placed into a specific subgroup. Once subgroups have been created, relevant percentages of individuals are randomly selected to the sample. Diagram B depicts a stratified random sample with such male and female subgroups.
Diagram B – Stratified Random Sampling
Population
Population
Population
Sample
�
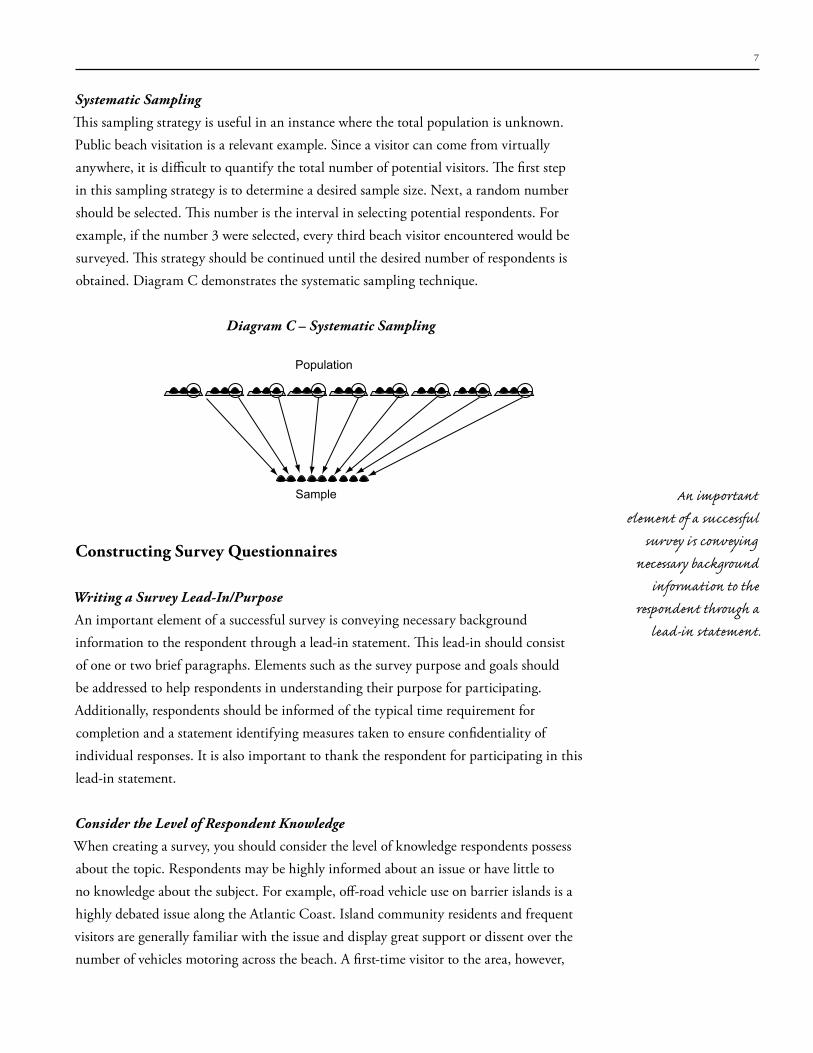
Systematic Sampling
This sampling strategy is useful in an instance where the total population is unknown. Public beach visitation is a relevant example. Since a visitor can come from virtually anywhere, it is difficult to quantify the total number of potential visitors. The first step in this sampling strategy is to determine a desired sample size. Next, a random number should be selected. This number is the interval in selecting potential respondents. For example, if the number 3 were selected, every third beach visitor encountered would be surveyed. This strategy should be continued until the desired number of respondents is obtained. Diagram C demonstrates the systematic sampling technique.
Diagram C – Systematic Sampling
Population
Population
Population
Sample
constructing Survey Questionnaires
Writing a Survey Lead-In/Purpose
An important element of a successful survey is conveying necessary background information to the respondent through a lead-in statement. This lead-in should consist of one or two brief paragraphs. Elements such as the survey purpose and goals should be addressed to help respondents in understanding their purpose for participating. Additionally, respondents should be informed of the typical time requirement for completion and a statement identifying measures taken to ensure confidentiality of individual responses. It is also important to thank the respondent for participating in this lead-in statement.
Consider the Level of Respondent Knowledge
When creating a survey, you should consider the level of knowledge respondents possess about the topic. Respondents may be highly informed about an issue or have little to no knowledge about the subject. For example, off-road vehicle use on barrier islands is a highly debated issue along the Atlantic Coast. Island community residents and frequent visitors are generally familiar with the issue and display great support or dissent over the number of vehicles motoring across the beach. A first-time visitor to the area, however,
An important element of a successful
survey i s conveying necessary background
information to the respondent through a
lead-in statement.
�
may have no prior knowledge of the issue. Being aware of potential knowledge gaps will assist in constructing questions to accommodate a broad range of respondents and aid in interpretation of study findings.
Simple Wording
Construct survey questions as simply as possible. Select vocabulary and sentence structure that will maximize the understanding of what is being asked. The greater a respondent understands what is being asked, the greater the chance that a confident response will be made. Consider the following question: what is the relative annual frequency of your utilization of RV parks when visiting areas along the South Carolina coast? This question is very wordy and contains ambiguous terminology that can easily confuse a respondent. A simpler and more effective way of constructing this question would be this: approximately how many times per year do you stay in an RV park when visiting the South Carolina coast?
Minimize Questions
Consider the amount of time it will take a respondent to complete a survey. Generally, the shorter the survey, the more accurate and complete the resulting information. Also consider the following question for each survey item: what will this question tell us? If you are unable to specifically determine how a question will further your knowledge of the issue at hand, you may want to consider modification or omission.
Sequential Questioning
All survey questions should follow a logical and sequential order. For example, a local community is trying to create a plan to minimize recreational conflicts between surf fishermen and surfers. The local town board is interested in receiving input from local residents on strategies to address the issue. The local town board has also identified several strategies on its own to potentially minimize conflict and would like to receive public feedback. In this situation, it would be best to ask the public for their suggestions before asking them to evaluate the ones proposed by the town board. By soliciting public ideas first, respondents are not biased toward the ideas of others and have a greater ability to think freely.
Write Neutral, Non-leading Questions
Consider the language used to construct questions. For example, if there are perceived managerial problems in an organization, the following would be a leading question: What is the cause of current managerial problems in your workplace? A more appropriate and neutral line of questioning would be this: Do you feel there are current managerial problems in your workplace? If yes, please explain. While the purpose of the survey may be to gather information on identifying and improving managerial issues within the workplace, the respondent should have the role of actually determining which specific problems (if any) are present and need to be addressed.
Construct survey questions as simply as possible.
Consider the amount of time it will take a respondent to complete a survey.
�
Determine Appropriate Question Format
There are two basic types of questions: open-ended and close-ended. Open-ended responses are referred to as qualitative information and provide in-depth information and explore subject matter in an extensive manner not limited by specific answer choices.
Questions that are answered by selecting a numeric, categorical, or other preconstructed response could be thought of as close-ended. Consider the following two questions:
1. What action(s) will you take (if any) to help reduce water consumption along the Florida Gulf Coast?
2. Which of the following best describes what you will do to reduce water consumption along the Florida Gulf Coast?a. Limit personal consumption and inform others of the value of this practiceb. Limit personal consumptionc. Inform others of the value of limiting water consumptiond. Take no actione. Not suref. Other (please explain) _________________________________ ________________
Both of the questions have certain advantages. The results of question one will likely provide a variety of responses much broader that the choices outlined in question two.
Information acquired through open-ended questions can be cumbersome to analyze and difficult to measure. Question two has a limited number of possible actions to reduce water consumption. However, in asking this question the researcher has the ability to report results in more specific, definitive terms such as 20 percent of Florida Gulf Coast residents reported that they will limit personal water consumption, while 45 percent will take no action at all, etc.
When using a multiple-choice question format, it is useful to have a choice for No Opinion or Not Sure, as well as an Other category in which the respondent can identify an area outside of the menu choices. Overall, it is important to consider the format of a question (open-ended or closed-ended) according to the type of response it will produce.
�0
Using Rating Scales
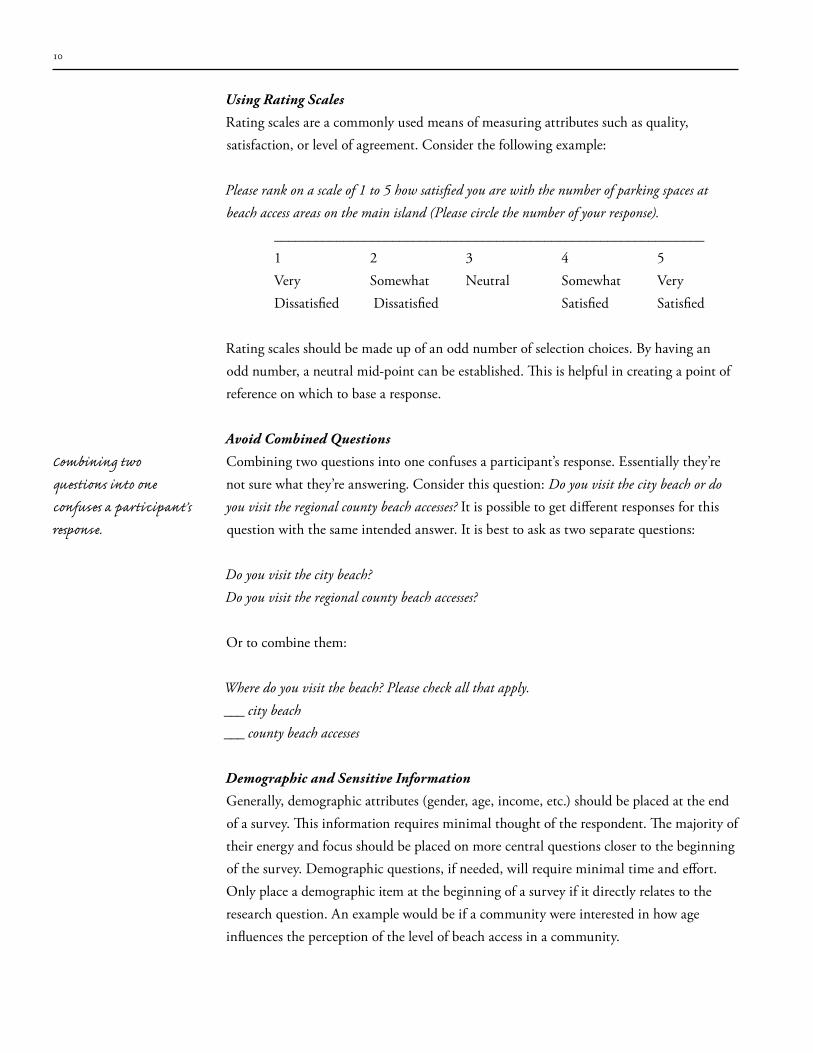
Rating scales are a commonly used means of measuring attributes such as quality, satisfaction, or level of agreement. Consider the following example:
Please rank on a scale of 1 to 5 how satisfied you are with the number of parking spaces at beach access areas on the main island (Please circle the number of your response). ______________________________________________________________ 1 2 3 4 5 Very Somewhat Neutral Somewhat Very Dissatisfied Dissatisfied Satisfied Satisfied
Rating scales should be made up of an odd number of selection choices. By having an odd number, a neutral mid-point can be established. This is helpful in creating a point of reference on which to base a response.
Avoid Combined Questions
Combining two questions into one confuses a participant’s response. Essentially they’re not sure what they’re answering. Consider this question: Do you visit the city beach or do you visit the regional county beach accesses? It is possible to get different responses for this question with the same intended answer. It is best to ask as two separate questions:
Do you visit the city beach?Do you visit the regional county beach accesses? Or to combine them:
Where do you visit the beach? Please check all that apply.___ city beach___ county beach accesses
Demographic and Sensitive Information
Generally, demographic attributes (gender, age, income, etc.) should be placed at the end of a survey. This information requires minimal thought of the respondent. The majority of their energy and focus should be placed on more central questions closer to the beginning of the survey. Demographic questions, if needed, will require minimal time and effort. Only place a demographic item at the beginning of a survey if it directly relates to the research question. An example would be if a community were interested in how age influences the perception of the level of beach access in a community.
Combining two questions into one confuses a participant’s response.
��
Avoid requesting any information that could be considered sensitive unless absolutely necessary. Examples of potentially sensitive information are identified below:AgeRaceGenderIncomePhysical or mental limitationsTaboo topics such as frequency of drug use or sexual orientation
As previously mentioned, these items should be kept to a minimum, asked only when necessary, placed at the end of the survey, and respondents should be provided with a written statement informing them that all responses are voluntary and measures have been put in place to ensure confidentiality and anonymity.
Pilot Testing
It is of great benefit to pilot or pre-test a survey before initiating a full study. The pilot test should be administered to a small group of individuals who are as similar as possible to those being sampled. The purpose of this is twofold. First, it allows the researcher to gauge the types of responses being received for each question. It may be found that respondents do not understand the directions or are misinterpreting a question. Secondly, it serves as a means of quality assurance for grammar, sentence structure, and clarity. A survey should be clear, concise, and understandable. A pilot test is an additional measure that can be taken to maximize the effectiveness of a survey.
��
The reportIt is critical for a final technical report to be as comprehensive as possible while maintaining clarity and order. Reports composed of several specific sections often provide the greatest utility. Common sections in a technical report should include the following:
• Executive summary – The executive summary should describe the essence of the entire document in a single page. The language should be interesting and friendly to encourage further reading of the report contents.
• Study purpose – The study purpose section describes the research question or problem trying to be solved by the study. Specific documentation of the issue, as well as initial assumptions, should be identified here.
• Methods – This section should be a comprehensive description of the intended research process from beginning to end. This section should identify the population of interest, desired sample size, sampling strategy, data collection methods, and steps to be taken to ensure an adequate response rate. This section should also identify proposed data analysis methods.
• Results – The results section should present the study outcomes or findings. Tables and graphs are particularly useful in conjunction with narrative text. Commonly, the study questionnaire will serve as an outline to this section, presenting each item sequentially.
• Discussion and management implications – The researcher should take great care in interpreting results and discussing the possible implications of the newly acquired knowledge.
��
Appendix A
Guide to Survey Sampling and Analysis terms
degree of accuracy
This refers to the level to which a sample mirrors or represents the population of interest.
f statistic
The f statistic is identical to the t statistic, but it is used when there are two or more groups to compare.
Margin of error
The margin of error is an estimate of the degree to which the responses to a survey would vary if conducted multiple times.
Mean
The mean is the average or intermediate response to a survey question. The mean is calculated by adding all the responses to a question and dividing by the n.
Median
The median is the number dividing the higher half of a sample from the lower half of the sample (the middle number).
n (total population)
The capital N refers to the total number of individuals in a population.
n (Sample population)
The lower-case n refers to the number of individuals within a sample population. The response n refers to the number of respondents providing a specific response to a question.
P (Significance)
The significance statistic can be thought of in terms of the power of the relationship between two variables (i.e., comparison between two or more groups). This number (commonly three-digit) is the probability that the relationship between variables occurred purely by chance. For example, when comparing the ages between males and females, a significance level of .600 means there is a 60 percent probability that any differences between ages of males and females occurs merely by chance. Generally, a significance or probability level of 95 percent (less than .050) is required for a statistical relationship to be significant or accepted as not occurring by chance.
��
Percentage
Percentages commonly refer to the portion of the sample (n) that provided a specific response to a survey question.
Population
A group of people to which researchers would like their survey results to be generalizable.
Qualitative
The collection of narrative data to address a research question.
Quantitative
The collection of numeric data to address a research question.
respondent
An individual who has answered or replied to a series of questions.
Sample
A careful selection of individuals from a population to be studied or surveyed who are representative of this larger population.
t statistic
The t statistic is a measurement of how two groups of respondents compare to one another on a specific response. For example, a t-test would be used to compare the mean age of males to the mean age of females in a sample. The greater the t statistic, the greater the two groups differ.
Standard deviation
The standard deviation is a measure of the degree to which the responses to a specific question vary from the mean. Large standard deviations signify that responses varied considerably. Small standard deviations signify that responses were close to the mean. In a normal response distribution, 65 percent of responses lie within one standard deviation of the mean, and 95 percent of responses lie within two standard deviations of the mean.
��
Appendix B
Guide to Survey types
Questionnaire
A survey instrument through which individuals respond to printed questions
Benefits
• Easy to quantify the data • Time-effective for use with geographically dispersed or large numbers of people • Relatively inexpensive • Data easily summarized and reported • Opportunity for expression without fear of embarrassment (anonymity) • Relatively bias free • Permit people time to think about answers • Questions can be used or modified from other instruments
Limitations
• Limited provision for unanticipated responses • Time and high level of skill needed to develop • Low return rates which can skew data • Difficult to get at root causes or possible solutions • Can be impersonal • Questions may miss true issues • Questions and answers can be interpreted differently • People have been negatively conditioned to the value of surveys • May heighten expectations • Language or vocabulary may be an issue • In general people can express themselves better orally than in writing
Techniques and Tips
• Questionnaires can be either open- or closed-ended • Open-ended can be easier to construct but more difficult to quantify and interpret • Closed-ended can be more difficult to construct but easier to interpret • Use closed-ended if there will be 25 or more questionnaires • Follow-up phone calls or reminders can increase return rate • Setting the stage is very important to get high return rates
��
• Questions must be very easy to read • If questionnaire is to be mailed, ensure correct and complete mailing list • Personal contact is best way to motivate people to complete questionnaire • Mailed questionnaires take about two months to complete • Consider computer-based questionnaires, which can follow more complex question patterns
than paper and pencil • Develop or use question banks • Ensure that responses are kept confidential • Always pilot the questionnaire • For all survey types, incentives may prove beneficial in increasing participation. Incentives
could include a drawing for a gift certificate or other prize, or an award following the completion of the survey. Be sure the emphasis stays on the survey and not the incentive! If random drawings are used, be sure not to compromise the anonymity of the respondents.
oral Survey
Interview using a closed question technique
Benefits
• Reach a large number of people in a relatively short time• Relatively inexpensive (can be done with trained volunteers)• Data easy to summarize and report• High level of return• Does not depend on reading proficiency• Good for information that requires sequencing (they can’t read ahead)• Interviewers can clarify questions• Can indicate strength to which something is felt • Easily adaptable to a wide variety of environments
Limitations
• Little provision for free expression or unanticipated responses• Requires substantial time and technical skill to develop• People tend to want to get the “right” answers• People will use opportunity to vent or describe their issues• The interviewer can influence the respondents• People will hurry through answers without thinking about them
��
Techniques and Tips
• Train volunteers to be nonjudgmental and follow sampling scheme• Keep questions basic and conversational• Can involve phone interviews• Let people know how and when data will be used• Separate data from names
Interview
Active interchanges between people either face to face or via technology
Benefits
• Inexpensive to conduct• Variety of perspectives can be elicited• Can be very useful way to build rapport with audience or participants• Can generate broad and deep data about system• Interviewer can clarify questions• Interviewer can clarify answers from the interviewee• Interviewer can receive additional information in the form of nonverbal clues
Limitations
• Bias due to data collector’s interest• Partial picture of training needs due to the typically small number• Time intensive• Data can be difficult to organize and quantify from open-ended interviews• Self-reporting of participants may bias data• Discussion can wander from purpose of interview• Unskilled interviewers can make clients feel self-conscious
Techniques and Tips
• Can be used to generate “buy-in” from participants• Good method for increasing the breadth of understanding of a situation• Good method for refining initial perspective on a situation• Can be used for initial input in association with survey, which would then validate information• Rich discussions lead to proportionally larger amount of time analyzing data• Planned, focused discussion will take more time to create and less time to analyze• Skilled interviewers can help keep the discussion productive• Plan for a comfortable private environment free of interruptions• Do homework before the interview, come prepared
��
• Avoid counseling the interviewee• If the interviewee asks for a comment to be “off record,” accommodate that wish• Never betray your client’s trust• Know how to use active listening• Plan a consistent preamble, including who the interviewer is, who they are working for, what
kind of questions will be asked, time that will be needed, what will be done with the data
Additional techniques and tips
Active Listening
Communicate your understanding and show nonjudgmental acceptance
• Ask non-leading questions: “can you tell me more about that?”• Rephrase what the speaker said in your own words• Reflect underlying feelings: “when that happens to me, I feel really bad”• Avoid analyzing what was described• Use personal disclosure: “I’m not sure I fully understand what you are saying”• Face the speaker• Watch the speaker and listen• Keep your mind on what the speaker is saying
Avoid Repetition
• Can make respondents angry• They become irritated when they think you are playing games with them• At a minimum, change the wording (most folks will catch on)
Use Sensitivity
• Word things tactfully• Sensitive items best placed middle to end of questionnaire• More sensitive questions usually best done face to face
Clarity
• Less than 20 words• Grammatically correct and spelled correctly• No jargon• Highlight important words• Never use more than one variable

��

2234 South Hobson AvenueCharleston, SC 29405-2413
www.csc.noaa.gov
NOAA/CSC/20717-PUB
2007

![(a) · The Architecture of Oceanic Plateaus Revealed by the Volcanic Stratigraphy of the Accreted Wrangellia Oceanic Plateau [Geosphere]. Andrew R. Greene, James S. Scoates, Dominique](https://img.pdfslide.net/doc/110x75/5e7053ea5f83bd746135402a/a-the-architecture-of-oceanic-plateaus-revealed-by-the-volcanic-stratigraphy-of.jpg)