Embed Size (px)
Citation preview

lyondellbasell.com
S E I Z E T H E M O M E N T S E C U R I N G T H E F U T U R E
Morgan Stanley Conference Tim Roberts EVP – O&P - Americas

lyondellbasell.com
Cautionary Statement
2
The statements in this presentation relating to matters that are not historical facts are forward-looking statements. These forward-looking statements are based upon assumptions of management which are believed to be reasonable at the time made and are subject to significant risks and uncertainties. Actual results could differ materially based on factors including, but not limited to, the business cyclicality of the chemical, polymers and refining industries; the availability, cost and price volatility of raw materials and utilities, particularly the cost of oil, natural gas, and associated natural gas liquids; competitive product and pricing pressures; labor conditions; our ability to attract and retain key personnel; operating interruptions (including leaks, explosions, fires, weather-related incidents, mechanical failure, unscheduled downtime, supplier disruptions, labor shortages, strikes, work stoppages or other labor difficulties, transportation interruptions, spills and releases and other environmental risks); the supply/demand balances for our and our joint ventures’ products, and the related effects of industry production capacities and operating rates; our ability to achieve expected cost savings and other synergies; legal and environmental proceedings; tax rulings, consequences or proceedings; technological developments, and our ability to develop new products and process technologies; potential governmental regulatory actions; political unrest and terrorist acts; risks and uncertainties posed by international operations, including foreign currency fluctuations; and our ability to comply with debt covenants and service our debt. Additional factors that could cause results to differ materially from those described in the forward-looking statements can be found in the “Risk Factors” section of our Form 10-K for the year ended December 31, 2012, which can be found at www.lyondellbasell.com on the Investor Relations page and on the Securities and Exchange Commission’s website at www.sec.gov. The illustrative results or returns of growth projects are not in any way intended to be, nor should they be taken as, indicators or guarantees of performance. The assumptions on which they are based are not projections and do not necessarily represent the Company’s expectations and future performance. You should not rely on illustrated results or returns or these assumptions as being indicative of our future results or returns. This presentation contains time sensitive information that is accurate only as of the date hereof. Information contained in this presentation is unaudited and is subject to change. We undertake no obligation to update the information presented herein except as required by law.
lyondellbasell.com
Information Related to Financial Measures
3
We have included EBITDA in this presentation, which is a non-GAAP measure, as we believe that EBITDA is a measure commonly used by investors. However, EBITDA, as presented herein, may not be comparable to a similarly titled measure reported by other companies due to differences in the way the measure is calculated. For purposes of this presentation, EBITDA means income from continuing operations plus interest expense (net), provision for (benefit from) income taxes, and depreciation & amortization. EBITDA should not be considered an alternative to profit or operating profit for any period as an indicator of our performance, or as an alternative to operating cash flows as a measure of our liquidity. See slide # 26 for reconciliations of EBITDA to net income. While we also believe that free cash flow (FCF) is a measure commonly used by investors, free cash flow, as presented herein, may not be comparable to a similarly titled measure reported by other companies due to differences in the way the measure is calculated. For purposes of this presentation, free cash flow means net cash provided by operating activities minus capital expenditures.

lyondellbasell.com
LYB Highlights
EBITDA(1)
LTM September 2013 EPS Growth vs. 2012: 17% vs. 2011: 34%
($ in millions)
4
Income from Continuing Operations(1)
($ in millions, except per share data) LTM Sept 2013 FY 2012 FY 2011EBITDA(1) $6,033 $5,808 $5,469Income from Continuing Operations(1) $3,328 $2,858 $2,472Diluted Earnings ($ / share) from Continuing Operations $5.80 $4.96 $4.32
(1) EBITDA and Income from continuing operations include a pre-tax lower of cost or market inventory valuation adjustment of $71 million in the third quarter which reversed a charge in the second quarter of 2012, due to a recovery in market price.

lyondellbasell.com
World-Class Scale, Leading Market Positions
September 2013 LTM EBITDA ($ in millions)
5
Chemicals Ethylene #5 Propylene #5 Propylene Oxide #2 Polymers Polyolefins (PE + PP) #1 Polypropylene #1 Polyethylene #4 Polypropylene Compounds #1 Fuels Oxyfuels #1 Technology and R&D Polyolefins Licensing #2
Products
Note: Positions based on LyondellBasell wholly owned capacity and pro rata share of JV capacities as of December 31, 2012.
Global Position
September 2013 LTM EBITDA
$6,033 million
September 2013 LTM Operating Income $4,797 million

lyondellbasell.com
500
1,000
1,500
2,000
2,500
$3,000
May - Dec 2010 2011 FY2012 2013 Q3 YTD
Dividends Share Repurchases
6
Sustained Cash Generation: Share Repurchases & Dividends
Corpus Christi NGL Fractionator
Cash From Operations Dividends & Share Repurchases
Snapshot at September 30, 2013 LTM FCF: $3.0 billion
LTM Capex: $1.5 billion Cash: $4.4 billion
Total Debt/LTM EBITDA: 1.0x Total Debt/Book Capital: 33%
Key Statistics
($ in millions)
1,000
2,000
3,000
4,000
5,000
$6,000
May - Dec 2010 2011 2012 LTM Sept 2013
Capex Free Cash Flow
($ in millions)
~ $1.3 billion invested in share repurchases since May 22, 2013 shareholders’ meeting through
September 30, 2013

lyondellbasell.com
• Commodities – naphtha based, with cyclical upside
• Differentiated positions in Catalloy, PP compounding, and JVs
• Large, heavy crude refinery
• Proprietary technologies
• Natural gas advantage
• NGL advantage
• Cyclical upside
Refining
Intermediates & Derivatives (I&D)
Olefins & Polyolefins – EAI
Olefins & Polyolefins – Americas
Optimizing Our Businesses
Technology • Strong technology position
• Maintain leadership
Segment LYB Market Position Portfolio Role
Invest
Restructure
Invest
Sustain
Optimize
7
lyondellbasell.com
30
60
90
120
$150
5
10
15
20
$25
2008 2009 2010 2011 2012
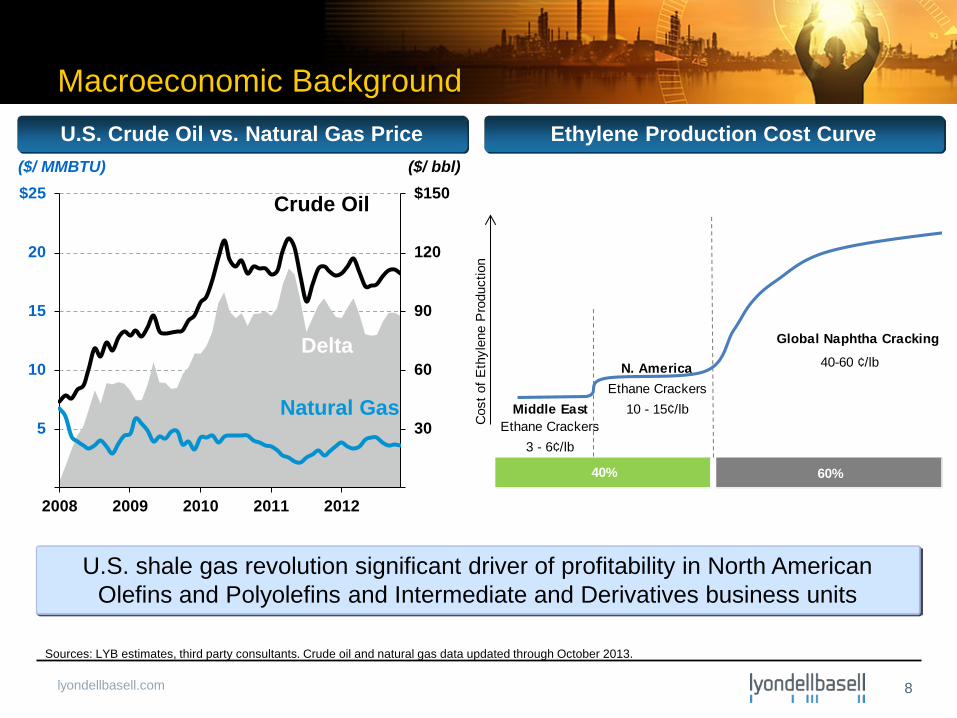
Macroeconomic Background
U.S. shale gas revolution significant driver of profitability in North American Olefins and Polyolefins and Intermediate and Derivatives business units
Sources: LYB estimates, third party consultants. Crude oil and natural gas data updated through October 2013.
8
U.S. Crude Oil vs. Natural Gas Price Ethylene Production Cost Curve
Crude Oil
Natural Gas
Delta
($/ MMBTU) ($/ bbl)
Global Naphtha Cracking
N. America 40-60 ¢/lb
Ethane CrackersMiddle East 10 - 15¢/lb
Ethane Crackers3 - 6¢/lb
60%40%C
ost o
f Eth
ylen
e P
rodu
ctio
n

lyondellbasell.com
20
40
¢60
2003 2004 2005 2006 2007 2008 2009 2010 2011 2012 2013 YTD
Ethylene Margin
(¢ / lb)
Midstream (Fractionation &
Pipelines)
Source: Third party consultants. 2013YTD as of October 2013.
Chemicals (Ethylene Crackers)
Upstream (Natural Gas E&P)
Evolution of Shale Gas Value Chain
9
(¢ / gal)
4
8
$12
2003 2004 2005 2006 2007 2008 2009 2010 2011 2012 2013 YTD
Natural Gas Price
($ / MMBTU)
20
40
¢60
2003 2004 2005 2006 2007 2008 2009 2010 2011 2012 2013 YTD
Ethane Premium to Fuel Value ("Frac Spread" )

lyondellbasell.com
20
40
60
80
100
120
Jan-12 Jul-12 Jan-13 Jul-13Brent Ethane Propane Butane
(Indexed to Jan 2012)
O&P – Americas: Fundamentals of Natural Gas / NGLs Have Defined the Environment
• U.S. NGL advantage has grown steadily • Cost of ethylene production from naphtha has been high but stable • LYB has increased NGL cracking capability from ~70% in 2010 to ~ 88% in the first nine
months of 2013 Source: Third party consultants. 2013 YTD as of October 2013.
10
U.S. NGL Prices vs. Brent Cost of Ethylene Production
15
30
45
60
NE AsiaNaphtha
U.S.Butane
U.S.Propane
U.S.Ethane
2010 2011 2012 2013 YTD
(¢ / lb)

lyondellbasell.com
0
300
600
900
1,200
1,500
1,800
2,100
2010 2011 2012 2013 2014 2015 2016 2017
(MBPD)
Forecast
Base Demand
Additional Demand
Supply
Favorable Supply/Demand Balances
11
U.S. Ethane Supply/Demand Ethylene Global Operating Rates
65%
70%
75%
80%
85%
90%
95%
100%
200
250
300
350
400
450
500
550
2008 2010 2012 2014E 2016E 2018E 2020E
Effective Operating R
ate (EOR
)
Cap
acity
/ D
eman
d (b
illio
ns o
f pou
nds)
Demand
Capacity
World Effective Operating Rate (LYB View)
Source: Third party consultants and LYB estimates.
• N. America effective ethylene industry operating rate ~ 95% in 2013 YTD
• Ethane production is expected to continue exceeding demand

lyondellbasell.com
Future
NGLs
LocalLiquids
2012
NGLs
ImportedLiquids
LocalLiquids
Pre-2009
NGLs
ImportedLiquids
LocalLiquids
O&P – Americas: Feedstock Flexibility Boosts Profitability
~ 88% of ethylene production in 2013 Q3 to date from NGLs
11.0 B lbs. ethylene capacity
12
LYB U.S. Ethylene Cracker Feedstock Flexibility
9.8 B lbs. ethylene capacity
11.6 B lbs. ethylene capacity
Source: LYB. Note: Percentages based on volume of feedstock consumed. Future feedstock mix is LYB estimate.

lyondellbasell.com
O&P – EAI: Our Recent Profits Were Primarily Generated from Our Differentiated Position
13
• O&P EAI portfolio is more than European olefins and commodity polyolefins – Global polypropylene compounds – Middle East and Asian JVs – Premium grades of polyolefins (Catalloy, Polybutene-1)
• Differentiated products typically can represent $350 - $550 million per year over the cycle
Indexed O&P EAI EBITDA Scenarios (1)
(1) O&P EAI trough, mid-cycle and peak EBITDA values are based on LYB estimates.
0.5
1.0
1.5
2.0
Trough Mid-Cycle Peak 2012 LTM Sept 2013
Differentiated / Stable Businesses Commodity / Cyclical Olefins & Polyolefins
(EBITDA Indexed, Mid-Cycle = 1.0)

lyondellbasell.com
O&P – EAI: Significant Progress Through Restructuring and Improved Operations
Focus business management processes
Previously announced
restructuring
Additional actions taken
Variable cost(includingsupply chain)
Feedstock &crackerimprovements
Portfolioimprovements
Reorganization
14
Estimated Efficiency Gains Thru December 2012
Segment markets and customers
Simplify supply chain processes
Improve feedstock purchasing
• Recent actions: Initiated closure of 100KT per year HDPE
unit in Germany
Increase ethylene from advantaged feedstocks from mid 20% in 2012 to mid 40% in Q3’2013
Butadiene expansion

lyondellbasell.com
I&D: Businesses Key Advantages
15
Proprietary TechnologyProprietary Technology + Natural gas opportunitiesNatural gas and NGL opportunitiesUndifferentiated
2012 Sales by End Use(1)
2012 Intermediates & Derivatives EBITDA
PO C4's / Oxyfuels Acetyls EO &
Derivatives
Proprietary Technology
Advantaged NGL / Crude Oil Price Ratio
(1) Estimated based on LYB 2012 Intermediates and Derivatives third party sales, and third party industry estimates of products end uses.

lyondellbasell.com
0
15
30
45
2009 2010 2011 2012 Q3 2013 todate
I&D: Profitability Drivers for Propylene Oxide
Key Drivers
• Propylene oxide demand growth
– 5% per year globally
– 9% per year in Asia
• High barrier to entry
16
Sources of LYB Competitive Advantage
• Large global system
• Proprietary low cost technology
Propylene Glycol Raw Material Margin
Economics of PO Technologies
Source: Third party consultants and LYB estimates.
(¢ / lb)

lyondellbasell.com
I&D Benefits from Shale Gas Development – Methanol & Oxyfuels
17
MTBE Spread Factors
Sources: Third party consultants.
Methanol Cash Margins
LYB capacity: 75,000 BBls/day 60% U.S. 40% EU
30
60
90
¢120
Pre Shale Post ShaleMTBE - GasolineGasoline - Raw Materials (Butane and Methanol)
(¢ / gallon)
100
200
300
$400
Pre-Shale Post Shale
($/MT)
Methanol Unit, Channelview, TX

lyondellbasell.com
Source: Bloomberg and Wall Street research. Notes: Maya 2-1-1 based on LLS pricing. WCS refers to west Canadian select vs. Gulf Coast products. 2013 YTD as of October 2013.
Refining: Profitability Has Been Driven by Geography and Complexity
Refining Spreads
Pipeline Capacity Increase
18
New Pipeline Capacity to Houston
Houston Eagle Ford
Port Arthur
WTI - Cushing
Heavy crude oils from Canada
LLS St James
$104 WTS
Midland
$97
$70
$101
Waterborne (FOB) Brent: $110 Maya: $93
October 2013 average crude oil price ($/bbl)
20
40
$60
Brent 3-2-1 LLS 3-2-1 WTI 3-2-1 Maya 2-1-1 WCS 2-1-1(Canadian)
2011 2012 2013 YTD
($ / bbl)
0
600
1,200
1,800
2012 2013 2014 2015
(MBPD)

lyondellbasell.com
Cash Deployment Hierarchy
Current Status Comments
$700 - $800 million/yr
Base Capex • First priorities for cash
~$750 million per year over next 2 years
Growth Capex • High-return in advantaged businesses
$0.50/share per quarter
Interim Dividend
• Fund through the cycle with cash flow from operations
Balance of cash generated
Share Repurchases /
Special Dividend /
Acquisitions
• Discretionary cash returned to shareholders
• M&A if strategic and meaningfully accretive
Foundation
Discretionary Opportunities
19
~$330 million/yr Interest
lyondellbasell.com
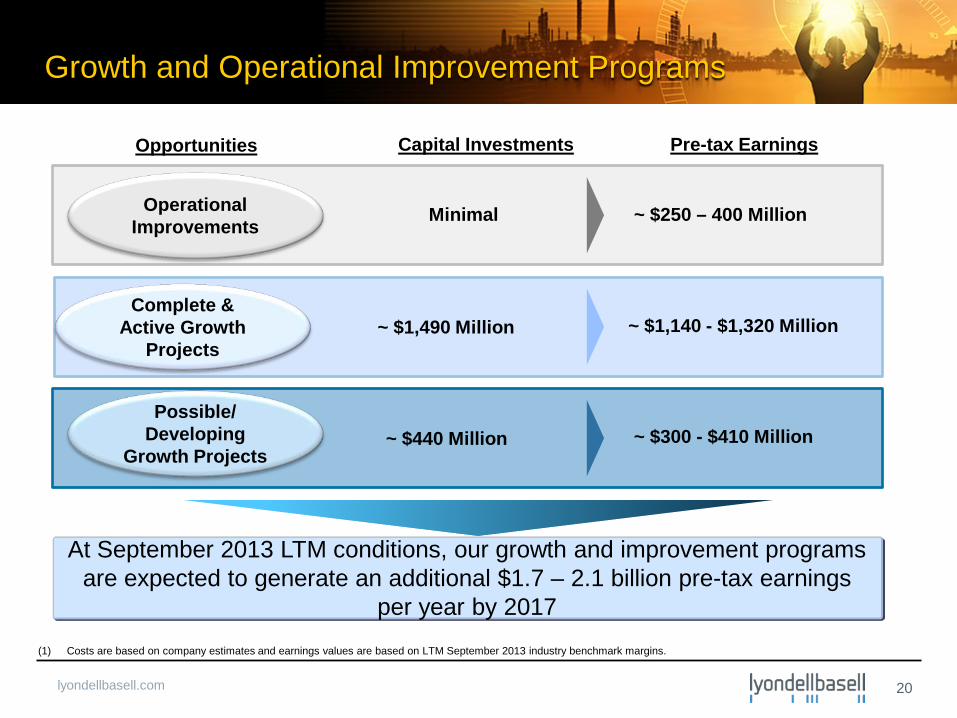
Growth and Operational Improvement Programs
At September 2013 LTM conditions, our growth and improvement programs are expected to generate an additional $1.7 – 2.1 billion pre-tax earnings
per year by 2017
20
Possible/ Developing
Growth Projects ~ $440 Million ~ $300 - $410 Million
Operational Improvements Minimal ~ $250 – 400 Million
Complete & Active Growth
Projects ~ $1,490 Million ~ $1,140 - $1,320 Million
Opportunities Capital Investments Pre-tax Earnings
(1) Costs are based on company estimates and earnings values are based on LTM September 2013 industry benchmark margins.

lyondellbasell.com
Projects Completed and Active
21
(1) Costs are based on company estimates and values are based on LTM September 2013 industry benchmark margins.
Complete In Construction Permit Pending
Project Cost ($Million) Start-up Potential Pre-Tax Earnings
($ Million/year)
Increase Ethane Capability ~$25 2012 $120 - $140
Midwest Debottlenecks ~$25 2012 $30 - $40
EU Butadiene Expansion ~$100 Mid 2013 $40 - $50
Methanol Restart ~$170 Late 2013 $250 - $260
PE Debottleneck ~$20 Early 2014 $10 - $20
La Porte Expansion ~$420 Mid 2014 $300 - $350
Channelview Expansion ~$200 Early 2015 $90 - $110
Corpus Christi Expansion ~$530 Late 2015 $300 - $350
Total ~ $1,490 ~ $1,140 - $1,320

lyondellbasell.com
Importance of Capital Project Selection
Fast Execution & High Returns
• Announced projects expected to be on line by 2016
• $1.9 billion of announced growth capital expenditures from 2013 to 2016
• Over $1.5 billion per year of additional EBITDA at LTM Sept 2013 margins by 2017
Capital project portfolio selected for optimum use of cash to maximize returns
22
(1) EBITDA estimates assume LTM September 2013 benchmark margins for future periods. Cash flow defined as EBITDA less depreciation, cash taxes and capital expenditures.
Annual Cash Flow from Announced Growth Projects(1)
($ in millions)
(500)
0
500
1,000
$1,500
2010 2012 2014E 2016E

lyondellbasell.com
Value from Both Growth and Cash Distributions
LyondellBasell Investor Day 2013 23
Annual Discretionary Cash Potential Growth Projects Value Potential
($ in billions)
Significant potential shareholder return from both growth investments and discretionary cash distributions
~ $2.0 - $3.5 billion discretionary cash
in addition to interim dividends(1)
Special dividend
Share repurchases
Potential Shareholder Distributions
Potential Discretionary
Cash
AND / OR
(1) Based on: Sep. 30 , 2013 market capitalization, growth projects potential values at constant LTM September 2013 industry benchmark margins, the increase in 2013 interim dividends and interest on new debt issuance.
15
30
45
60
9/30/13 Market Cap Potential Market Cap(@ 2012/2013 Multiple)
Sep. 30, 2013 Market Cap
Sep. 30, 2013Market Cap
Growth Projects Potential Value(1)

lyondellbasell.com
S E I Z E T H E M O M E N T S E C U R I N G T H E F U T U R E
Appendix

lyondellbasell.com
Reconciliation of Segment Information to Consolidated Financial Information
25
Reconciliation of Segment Information to Consolidated Financial Information 2012 2013 (Millions of U.S. dollars) Q1 Q2 Q3 Q4 Total Q1 Q2 Q3 YTD Sales and other operating revenues: Olefins & Polyolefins - Americas $ 3,349 $ 3,283 $ 3,217 $ 3,085 $ 12,934 $ 3,244 $ 3,251 $ 3,315 $ 9,810 Olefins & Polyolefins - Europe, Asia, International 3,898 3,575 3,448 3,600 14,521 3,800 3,708 3,594 11,102 Intermediates & Derivatives 2,485 2,285 2,637 2,251 9,658 2,282 2,217 2,452 6,951 Refining 3,203 3,496 3,272 3,320 13,291 2,468 3,077 3,177 8,722 Technology 119 115 124 140 498 134 132 124 390 Other (1,320) (1,506) (1,425) (1,299) (5,550) (1,259) (1,282) (1,510) (4,051) Continuing Operations $ 11,734 $ 11,248 $ 11,273 $ 11,097 $ 45,352 $ 10,669 $ 11,103 $ 11,152 $ 32,924 Operating income (loss): Olefins & Polyolefins - Americas $ 519 $ 700 $ 738 $ 693 $ 2,650 $ 821 $ 872 $ 759 $ 2,452 Olefins & Polyolefins - Europe, Asia, International 3 203 15 (94) 127 93 189 78 360 Intermediates & Derivatives 370 390 424 246 1,430 323 285 371 979 Refining 10 124 114 86 334 (17) (16) (37) (70) Technology 38 30 31 23 122 50 39 35 124 Other - - 2 6 5 13 (3) (5) 1 (7) Continuing Operations $ 940 $ 1,449 $ 1,328 $ 959 $ 4,676 $ 1,267 $ 1,364 $ 1,207 $ 3,838 Depreciation and amortization: Olefins & Polyolefins - Americas $ 65 $ 71 $ 69 $ 76 $ 281 $ 75 $ 69 $ 73 $ 217 Olefins & Polyolefins - Europe, Asia, International 69 69 63 84 285 77 76 78 231 Intermediates & Derivatives 47 48 49 50 194 48 50 50 148 Refining 38 37 36 37 148 36 37 45 118 Technology 18 19 18 18 73 17 20 16 53 Other - - - - 1 1 2 - - 2 - - 2 Continuing Operations $ 237 $ 244 $ 236 $ 266 $ 983 $ 253 $ 254 $ 262 $ 769 EBITDA: (a)
Olefins & Polyolefins - Americas $ 595 $ 781 $ 814 $ 778 $ 2,968 $ 898 $ 951 $ 841 $ 2,690 Olefins & Polyolefins - Europe, Asia, International 115 305 102 26 548 225 295 204 724 Intermediates & Derivatives 417 432 475 297 1,621 373 338 427 1,138 Refining 48 160 150 123 481 20 20 8 48 Technology 56 50 49 42 197 66 59 52 177 Other (4) (1) (1) (1) (7) 3 (11) (1) (9) Continuing Operations $ 1,227 $ 1,727 $ 1,589 $ 1,265 $ 5,808 $ 1,585 $ 1,652 $ 1,531 $ 4,768 Capital, turnarounds and IT deferred spending: Olefins & Polyolefins - Americas $ 102 $ 135 $ 126 $ 105 $ 468 $ 122 $ 122 $ 218 $ 462 Olefins & Polyolefins - Europe, Asia, International 60 39 60 95 254 63 46 44 153 Intermediates & Derivatives 18 24 44 73 159 106 141 119 366 Refining 38 27 24 47 136 93 67 36 196 Technology 9 8 12 14 43 7 6 7 20 Other 2 3 1 (1) 5 - - 5 (1) 4 Total 229 236 267 333 1,065 391 387 423 1,201 Deferred charges included above (1) (3) (1) - - (5) - - - - - - - - Continuing Operations $ 228 $ 233 $ 266 $ 333 $ 1,060 $ 391 $ 387 $ 423 $ 1,201 (a) See slide 26 for EBITDA calculation.

lyondellbasell.com
Reconciliation of EBITDA to Income from Continuing operations
26
$ 663 $ 804 $ 895 $ (215) $ 2,147
(3) (1) - (3) (7)
22 48 17 245 332
Income from continuing operations 682 851 912 27 2,472
263 388 506 (98) 1,059
215 224 237 255 931
156 163 146 542 1,007
$ 1,316 $ 1,626 $ 1,801 $ 726 $ 5,469 EBITDA
Depreciation and amortization
Interest expense, net
2011
Q1 Q2 Q3(Millions of U.S. dollars) Q4
Provision for (benefit from ) income taxes
Total
Net income (loss) attributable to the Company shareholder
Net loss attributable to non-controlling interests
Loss from discontinued operations, net of tax
2012 2013
(Millions of U.S. dollars) Q1 Q2 Q3 Q4 Total Q1 Q2 Q3 YTD
Net income attributable to the Company shareholders $ 600 $ 770 $ 846 $ 632 $ 2,848 $ 901 $ 929 $ 853 $ 2,683
Net income (loss) attributable to non-controlling interests (1) (2) (2) (9) (14) (1) (2) (2) (5)
(Income) loss from discontinued operations, net of tax (5) - - 7 22 24 6 (4) 3 5
Income from continuing operations 594 768 851 645 2,858 906 923 854 2,683
Provision for income taxes 301 306 435 285 1,327 357 410 339 1,106
Depreciation and amortization 237 244 236 266 983 253 254 262 769
Interest expense, net 95 409 67 69 640 69 65 76 210
EBITDA $ 1,227 $ 1,727 $ 1,589 $ 1,265 $ 5,808 $ 1,585 $ 1,652 $ 1,531 $ 4,768
![o o ] v ( } t ^ Á Z ] µ ] Z } rE o t E } Z u ] U / v X D } U D/ t } o ] v P & ] o … · 2019. 11. 2. · o ] v E u E o t E } Z u ] U / v X r D } U D/ t^ Z ( v E µ u t^ r ì í](https://img.pdfslide.net/doc/110x75/61260c438b9e9569f91f40cb/o-o-v-t-z-z-re-o-t-e-z-u-u-v-x-d-u-d-t-o-v-p-.jpg)