Embed Size (px)
Citation preview
ORI GIN AL PA PER
Alkali Induced High Temperature Corrosionof Stainless Steel: The Influence of NaCl, KCland CaCl2
S. Karlsson • J. Pettersson • L. -G. Johansson •
J. -E. Svensson
Received: 8 July 2011 / Revised: 9 March 2012 / Published online: 27 April 2012
� The Author(s) 2012. This article is published with open access at Springerlink.com
Abstract The influence of KCl, NaCl and CaCl2 on the oxidation of 304-type
(Fe18Cr10Ni) stainless steel at 600 �C in 5 %O2 ? 40 %H2O was investigated. Prior
to exposure, a small amount of the preferred salt (cation equivalent: 1.35 lmol/cm2)
was deposited on the samples. Exposure time was 1–168 h. The oxidized samples
were analyzed by SEM/EDX, XRD, FIB and IC. The presence of KCl and NaCl
strongly accelerates high temperature corrosion of 304L. Corrosion attack is initiated
by the formation of alkali chromate through the reaction of alkali with the protective
oxide. Chromate formation is a sink for chromium in the oxide and leads to a loss of its
protective properties. Subsequently a rapidly growing scale forms, consisting of an
outer hematite layer with chromate particles on top and an inner spinel oxide layer. In
contrast to NaCl and KCl, CaCl2 is not very corrosive. At temperature, CaCl2 is
rapidly converted to CaO. Small amounts of CaCrO4 form where CaO is in direct
contact with the scale. CaO also reacts with the scale to form Ca2Fe2O5.
Keywords Oxidation � Alkali � Breakaway corrosion � 304L � Chromate
S. Karlsson (&) � J. Pettersson � L.-G. Johansson � J.-E. Svensson
Department of Chemical and Biological Engineering, Energy and Materials,
Chalmers University of Technology, 412 96 Goteborg, Sweden
e-mail: [email protected]
J. Pettersson
e-mail: [email protected]
L.-G. Johansson
e-mail: [email protected]
J.-E. Svensson
e-mail: [email protected]
123
Oxid Met (2012) 78:83–102
DOI 10.1007/s11085-012-9293-7
Introduction
The production of electricity from biomass and waste-fired power plants is
increasing all over the world. Unfortunately, the combustion of biomass and waste
results in the formation of corrosive deposits and gases. Besides water vapor and
carbon dioxide, the flue gas contains high concentrations of alkali chlorides and
hydrogen chloride while the sulphur dioxide content is typically low [1, 2]. Hence,
the deposits formed on the superheater tubes are often rich in alkali chlorides which
are known to cause accelerated corrosion of the superheater tubes [1–7]. The
corrosivity of alkali chlorides in the presence of O2 is often explained by applying
‘‘the chlorine cycle’’ mechanism [3, 5–10] where Cl2(g) plays a seminal role, acting
as a catalyst for corrosion. Thus, the mechanism supposes that Cl2 forms in a
reaction between O2 and alkali chloride at the scale/metal interface. Cl2 then
penetrates the scale and generates volatile transition metal chlorides at the scale/
metal interface. The transition metal chlorides then diffuse back to the scale/gas
interface where they are oxidized by O2, precipitating metal oxide and releasing
Cl2(g) which enters the process again.
Recently, a new, electrochemical, mechanism has been proposed to explain the
alkali chloride-induced corrosion of low-alloyed steel. In the new mechanism,
chloride ion is the diffusing chlorine species rather than Cl2 [11]. Also, it has been
reported recently that the potassium ion plays an important role in the initiation of
KCl-induced corrosion of stainless steels [12–16]. Thus, it was shown that K2CO3 is
equally corrosive as KCl towards stainless steel 304L at 600 �C. The corrosiveness
of the potassium ion was attributed to the formation of potassium chromate(VI) by
reaction with the oxide scale. The reaction depletes the oxide in chromium and
destroys its protective properties [17].
The present study investigates the corrosion effects of three chloride salts (KCl,
NaCl and CaCl2) on the austenitic stainless steel 304L (Fe18Cr10Ni) in 5 %O2 and
40 % H2O at 600 �C. The emphasis is on the early stages of corrosion and on
elucidating the sequence of events that cause the corrosion attack.
Experimental Procedures
Sample Preparation
The material investigated is the austenitic stainless steel, 304L, for chemical
composition see Table 1. The geometrical area of the samples was 5.56 cm2,
(15 9 15 9 2 mm3). For handling, a hole (u = 1.5 mm) was drilled, 2 and 7.5 mm
from the edges. Before exposure the samples were grinded on 320 grit SiC with
Table 1 Chemical composition of alloy 304L in wt%
Fe Cr Ni Mn Si Mo N C
304L Balance 18.5 10.2 1.41 0.55 0.49 0.075 0.027
84 Oxid Met (2012) 78:83–102
123
deionized water. The samples were then polished with 9, 3 and 1 lm diamond
solution and lubricating liquid on a polish cloth until a mirror-like surface appeared.
After polishing, the samples were degreased and cleaned in acetone and ethanol
using an ultrasonic bath. The samples were coated with the preferred salt (NaCl,
KCl or CaCl2) to a cation equivalent of 1.35 lmol/cm2. The salts were applied by
spraying the samples with a saturated solution of the prefer salt in water/ethanol.
NaCl and KCl sprayed samples were weight in order to calibrate the amount.
Because of the hygroscopic nature of CaCl2, the amount was calibrated with ion
chromatography. The samples were dried with air and stored in a desiccator prior to
exposure. The mass change of the samples was measured prior to and after exposure
using a six decimal SartoriusTM balance.
Exposures
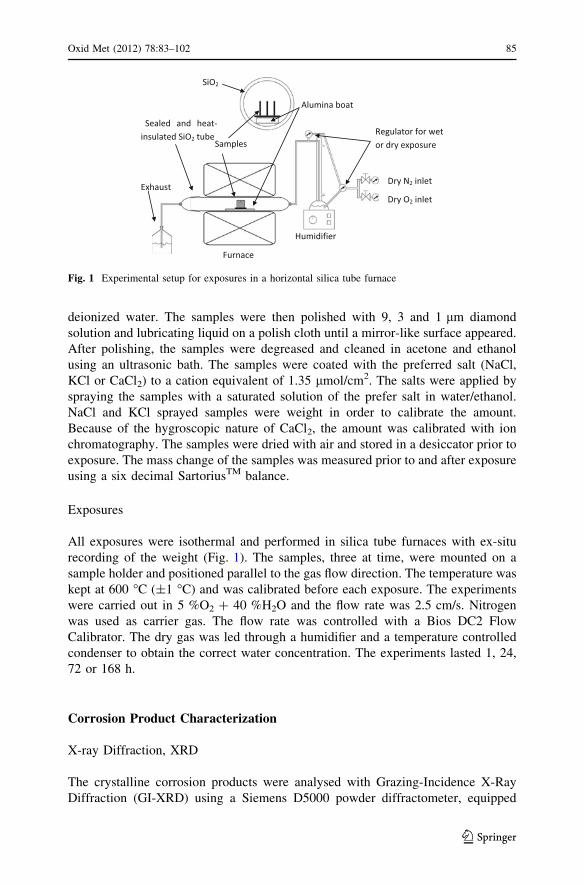
All exposures were isothermal and performed in silica tube furnaces with ex-situ
recording of the weight (Fig. 1). The samples, three at time, were mounted on a
sample holder and positioned parallel to the gas flow direction. The temperature was
kept at 600 �C (±1 �C) and was calibrated before each exposure. The experiments
were carried out in 5 %O2 ? 40 %H2O and the flow rate was 2.5 cm/s. Nitrogen
was used as carrier gas. The flow rate was controlled with a Bios DC2 Flow
Calibrator. The dry gas was led through a humidifier and a temperature controlled
condenser to obtain the correct water concentration. The experiments lasted 1, 24,
72 or 168 h.
Corrosion Product Characterization
X-ray Diffraction, XRD
The crystalline corrosion products were analysed with Grazing-Incidence X-Ray
Diffraction (GI-XRD) using a Siemens D5000 powder diffractometer, equipped
Fig. 1 Experimental setup for exposures in a horizontal silica tube furnace
Oxid Met (2012) 78:83–102 85
123
with grazing—incidence beam attachment and a Gobel mirror. Cu K. w radiation
was used and the angle of incidence was 2�–5�. The measurement range was
20� \ 2h\ 70�.
Scanning Electron Microscopy, SEM/EDX
SEM imaging was performed using an FEI Quanta 200 ESEM FEG. The EDX
detector is linked with the SEM and an Oxford Inca EDX system was used. The
microscope was operated at 15–20 kV.
Ion Chromatography, IC
To determine the amount of water-soluble anions (Cl- and CrO42-) a Dionex ICS-
90 system was used. The anions were analysed with an IonPac AS4A-SC analytic
column and 1.8 mM Na2CO3/1.7 mM NaHCO3 was used as eluent. To determine
the amount of water-soluble cations (K?, Na? and Ca2?) a Dionex ICS-900 system
was used. The anions were analysed with an IonPac CS12A analytic column and
20 mM sulfonic acid was used as eluent. The flow rate was 2 mL/min for both
anions and cations analyses.
Results
Gravimetry
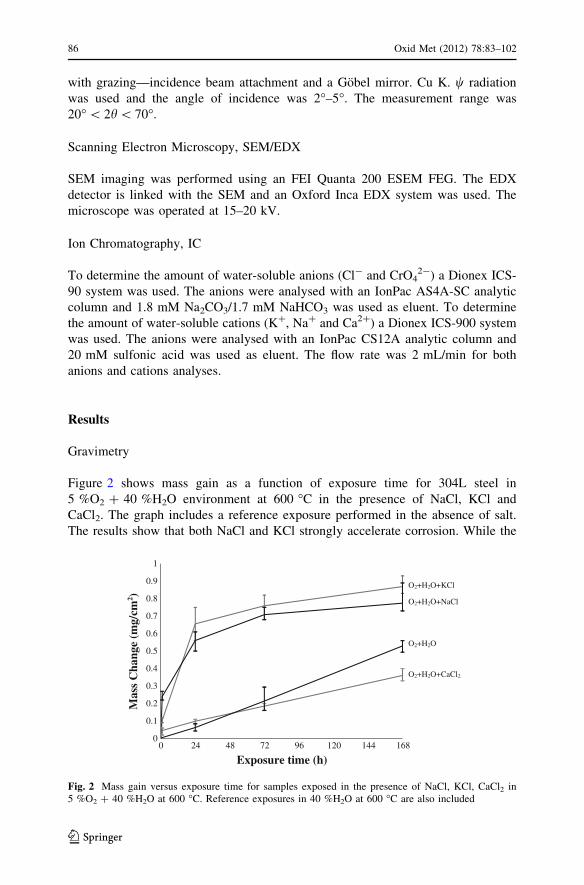
Figure 2 shows mass gain as a function of exposure time for 304L steel in
5 %O2 ? 40 %H2O environment at 600 �C in the presence of NaCl, KCl and
CaCl2. The graph includes a reference exposure performed in the absence of salt.
The results show that both NaCl and KCl strongly accelerate corrosion. While the
O2+H2O+KCl
O2+H2O
O2+H2O+CaCl2
O2+H2O+NaCl
0
0.1
0.2
0.3
0.4
0.5
0.6
0.7
0.8
0.9
1
0 24 48 72 96 120 144 168
Exposure time (h)
Mas
s C
hang
e (m
g/cm
2 )
Fig. 2 Mass gain versus exposure time for samples exposed in the presence of NaCl, KCl, CaCl2 in5 %O2 ? 40 %H2O at 600 �C. Reference exposures in 40 %H2O at 600 �C are also included
86 Oxid Met (2012) 78:83–102
123
two mass gain curves are similar during later stages of the exposures, NaCl initially
causes higher mass gain than KCl. In contrast, exposure in the presence of CaCl2does not result in a significantly increased mass gain.
Surface Morphology
The surface morphology was investigated by Scanning Electron Microscope (SEM).
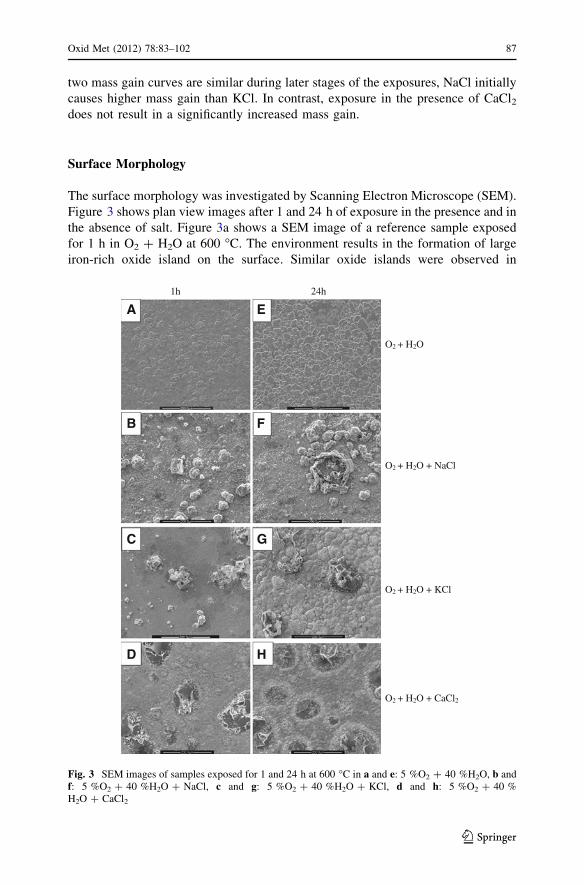
Figure 3 shows plan view images after 1 and 24 h of exposure in the presence and in
the absence of salt. Figure 3a shows a SEM image of a reference sample exposed
for 1 h in O2 ? H2O at 600 �C. The environment results in the formation of large
iron-rich oxide island on the surface. Similar oxide islands were observed in
24h1h
O2 + H2O + KCl
O2 + H2O
O2 + H2O + CaCl2
O2 + H2O + NaCl
A E
B F
C G
D H
Fig. 3 SEM images of samples exposed for 1 and 24 h at 600 �C in a and e: 5 %O2 ? 40 %H2O, b andf: 5 %O2 ? 40 %H2O ? NaCl, c and g: 5 %O2 ? 40 %H2O ? KCl, d and h: 5 %O2 ? 40 %H2O ? CaCl2
Oxid Met (2012) 78:83–102 87
123
previous investigations of the oxidation of 304L in O2 ? H2O environment at
600 �C. The earlier studies show that the oxide islands have formed in the middle of
the underlying steel grains while the areas close to the steel boundaries remain
protective. Figure 3b and c show samples exposed for 1 h in the presence of NaCl
and KCl, respectively. In both cases, the salt particles are partly reacted and have
started to become overgrown by oxide. At this stage the NaCl treated sample exhibit
considerably more corrosion between the salt particles than in the case of KCl.
Figure 3d shows a sample exposed for 1 h in the presence of CaCl2. The salt
agglomerates have a roughly circular form and at this stage CaCl2 is partially
decomposed (see XRD and IC analysis below). The surface between the salt
agglomerations is relatively even. Oxide islands have started to form, similar to the
ones observed in the reference run (compare Fig. 3a). Furthermore, there is no
tendency for the salt agglomerations to become overgrown by oxide.
Figure 3e shows the surface after 24 h exposure in the absence of salt (reference
sample). The oxide islands have increased both in number and size while the areas
near the steel borders remain protective. Figure 3f and g show samples after 24 h
exposure in the presence of NaCl and KCl, respectively. At this stage the surface is
covered by thick scale, the former salt crystals being replaced by irregularly shaped
oxide agglomerations. The surface between the oxide agglomerations is very
uneven. The KCl treated samples exhibits an island-like scale morphology that
reflects the substrate grain structure. In the case of NaCl, the corrosion affects the
entire surface and no preferential corrosion of the grain centers is observed.
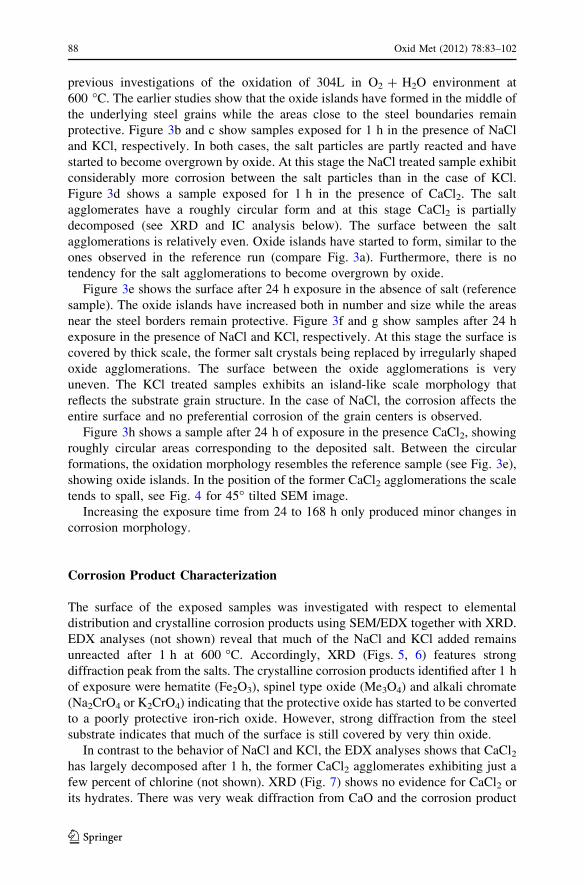
Figure 3h shows a sample after 24 h of exposure in the presence CaCl2, showing
roughly circular areas corresponding to the deposited salt. Between the circular
formations, the oxidation morphology resembles the reference sample (see Fig. 3e),
showing oxide islands. In the position of the former CaCl2 agglomerations the scale
tends to spall, see Fig. 4 for 45� tilted SEM image.
Increasing the exposure time from 24 to 168 h only produced minor changes in
corrosion morphology.
Corrosion Product Characterization
The surface of the exposed samples was investigated with respect to elemental
distribution and crystalline corrosion products using SEM/EDX together with XRD.
EDX analyses (not shown) reveal that much of the NaCl and KCl added remains
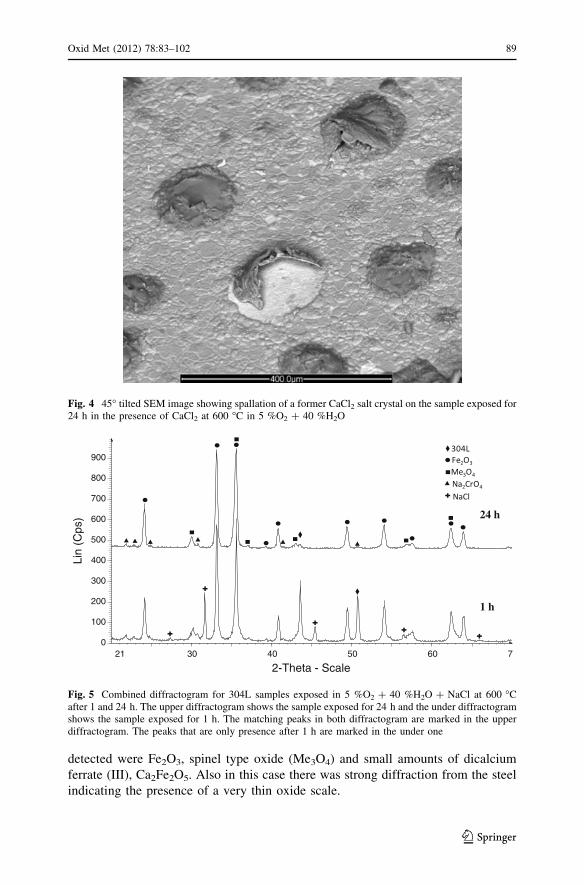
unreacted after 1 h at 600 �C. Accordingly, XRD (Figs. 5, 6) features strong
diffraction peak from the salts. The crystalline corrosion products identified after 1 h
of exposure were hematite (Fe2O3), spinel type oxide (Me3O4) and alkali chromate
(Na2CrO4 or K2CrO4) indicating that the protective oxide has started to be converted
to a poorly protective iron-rich oxide. However, strong diffraction from the steel
substrate indicates that much of the surface is still covered by very thin oxide.
In contrast to the behavior of NaCl and KCl, the EDX analyses shows that CaCl2has largely decomposed after 1 h, the former CaCl2 agglomerates exhibiting just a
few percent of chlorine (not shown). XRD (Fig. 7) shows no evidence for CaCl2 or
its hydrates. There was very weak diffraction from CaO and the corrosion product
88 Oxid Met (2012) 78:83–102
123
detected were Fe2O3, spinel type oxide (Me3O4) and small amounts of dicalcium
ferrate (III), Ca2Fe2O5. Also in this case there was strong diffraction from the steel
indicating the presence of a very thin oxide scale.
24 h
1 h
Lin
(Cps
)
0
100
200
300
400
500
600
700
800
900
2-Theta - Scale21 30 40 50 60 7
Fig. 5 Combined diffractogram for 304L samples exposed in 5 %O2 ? 40 %H2O ? NaCl at 600 �Cafter 1 and 24 h. The upper diffractogram shows the sample exposed for 24 h and the under diffractogramshows the sample exposed for 1 h. The matching peaks in both diffractogram are marked in the upperdiffractogram. The peaks that are only presence after 1 h are marked in the under one
Fig. 4 45� tilted SEM image showing spallation of a former CaCl2 salt crystal on the sample exposed for24 h in the presence of CaCl2 at 600 �C in 5 %O2 ? 40 %H2O
Oxid Met (2012) 78:83–102 89
123
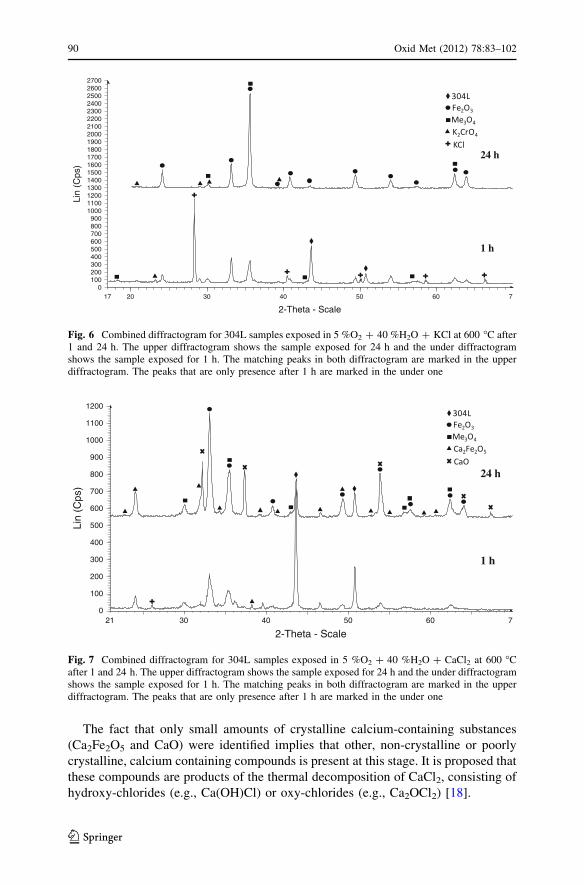
The fact that only small amounts of crystalline calcium-containing substances
(Ca2Fe2O5 and CaO) were identified implies that other, non-crystalline or poorly
crystalline, calcium containing compounds is present at this stage. It is proposed that
these compounds are products of the thermal decomposition of CaCl2, consisting of
hydroxy-chlorides (e.g., Ca(OH)Cl) or oxy-chlorides (e.g., Ca2OCl2) [18].
24 h
1 h
Lin
(Cps
)
0100200300400500600700800900
100011001200130014001500160017001800190020002100220023002400250026002700
2-Theta - Scale
17 20 30 40 50 60 7
Fig. 6 Combined diffractogram for 304L samples exposed in 5 %O2 ? 40 %H2O ? KCl at 600 �C after1 and 24 h. The upper diffractogram shows the sample exposed for 24 h and the under diffractogramshows the sample exposed for 1 h. The matching peaks in both diffractogram are marked in the upperdiffractogram. The peaks that are only presence after 1 h are marked in the under one
24 h
1 h
Lin
(Cps
)
0
100
200
300
400
500
600
700
800
900
1000
1100
1200
2-Theta - Scale21 30 40 50 60 7
Fig. 7 Combined diffractogram for 304L samples exposed in 5 %O2 ? 40 %H2O ? CaCl2 at 600 �Cafter 1 and 24 h. The upper diffractogram shows the sample exposed for 24 h and the under diffractogramshows the sample exposed for 1 h. The matching peaks in both diffractogram are marked in the upperdiffractogram. The peaks that are only presence after 1 h are marked in the under one
90 Oxid Met (2012) 78:83–102
123
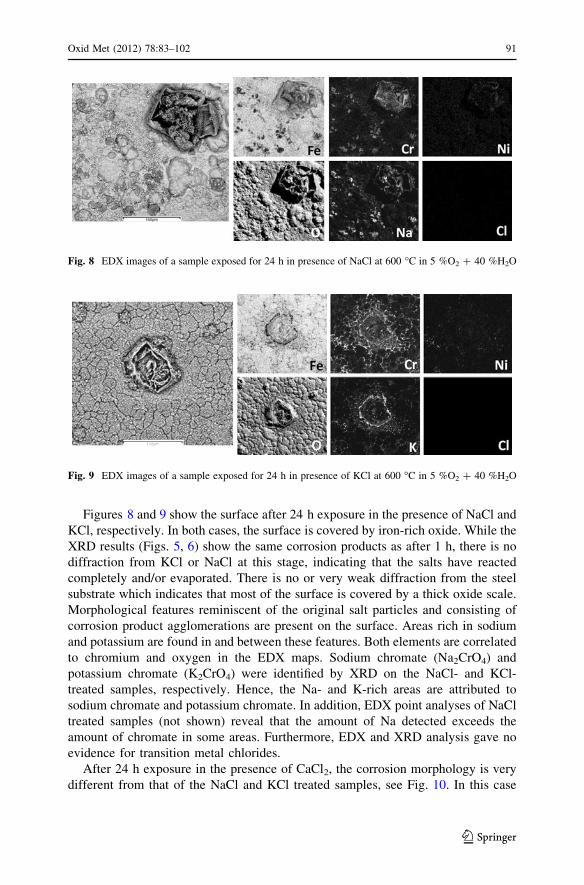
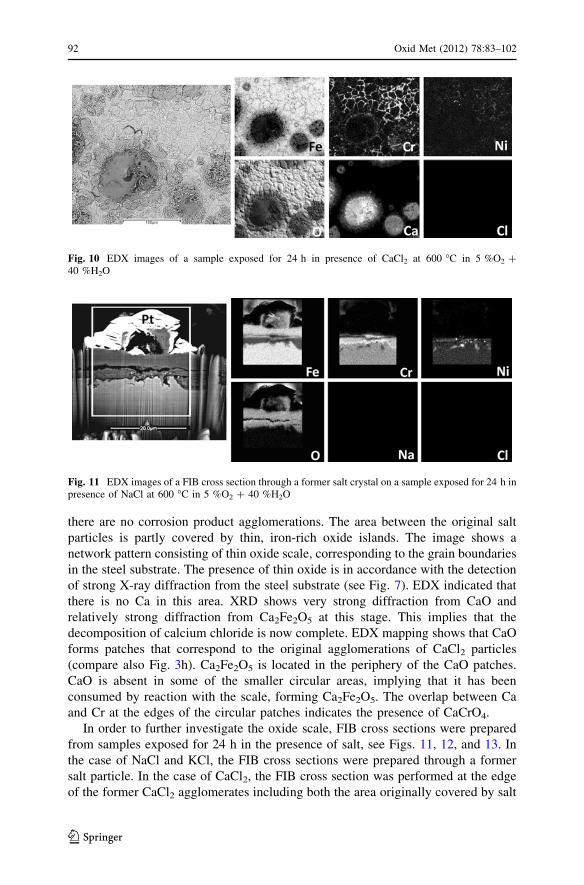
Figures 8 and 9 show the surface after 24 h exposure in the presence of NaCl and
KCl, respectively. In both cases, the surface is covered by iron-rich oxide. While the
XRD results (Figs. 5, 6) show the same corrosion products as after 1 h, there is no
diffraction from KCl or NaCl at this stage, indicating that the salts have reacted
completely and/or evaporated. There is no or very weak diffraction from the steel
substrate which indicates that most of the surface is covered by a thick oxide scale.
Morphological features reminiscent of the original salt particles and consisting of
corrosion product agglomerations are present on the surface. Areas rich in sodium
and potassium are found in and between these features. Both elements are correlated
to chromium and oxygen in the EDX maps. Sodium chromate (Na2CrO4) and
potassium chromate (K2CrO4) were identified by XRD on the NaCl- and KCl-
treated samples, respectively. Hence, the Na- and K-rich areas are attributed to
sodium chromate and potassium chromate. In addition, EDX point analyses of NaCl
treated samples (not shown) reveal that the amount of Na detected exceeds the
amount of chromate in some areas. Furthermore, EDX and XRD analysis gave no
evidence for transition metal chlorides.
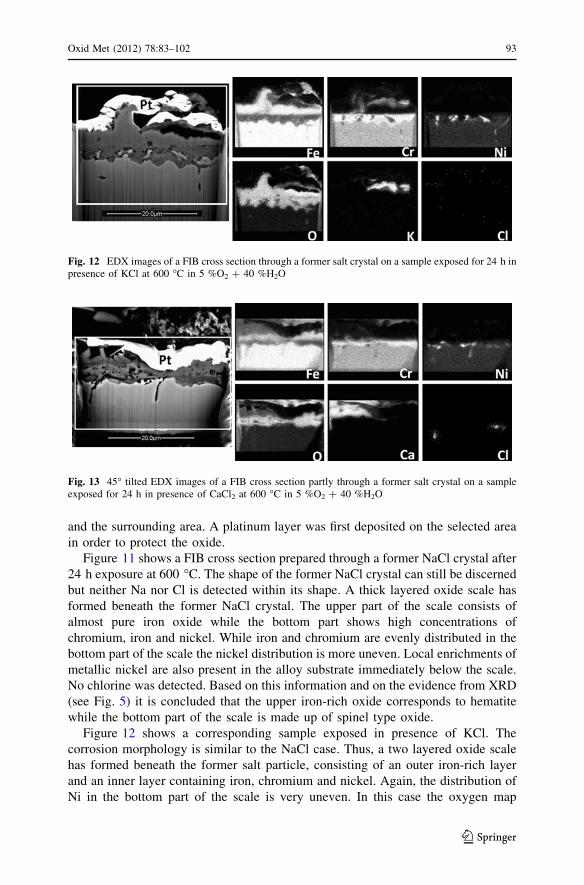
After 24 h exposure in the presence of CaCl2, the corrosion morphology is very
different from that of the NaCl and KCl treated samples, see Fig. 10. In this case
Fig. 8 EDX images of a sample exposed for 24 h in presence of NaCl at 600 �C in 5 %O2 ? 40 %H2O
Fig. 9 EDX images of a sample exposed for 24 h in presence of KCl at 600 �C in 5 %O2 ? 40 %H2O
Oxid Met (2012) 78:83–102 91
123
there are no corrosion product agglomerations. The area between the original salt
particles is partly covered by thin, iron-rich oxide islands. The image shows a
network pattern consisting of thin oxide scale, corresponding to the grain boundaries
in the steel substrate. The presence of thin oxide is in accordance with the detection
of strong X-ray diffraction from the steel substrate (see Fig. 7). EDX indicated that
there is no Ca in this area. XRD shows very strong diffraction from CaO and
relatively strong diffraction from Ca2Fe2O5 at this stage. This implies that the
decomposition of calcium chloride is now complete. EDX mapping shows that CaO
forms patches that correspond to the original agglomerations of CaCl2 particles
(compare also Fig. 3h). Ca2Fe2O5 is located in the periphery of the CaO patches.
CaO is absent in some of the smaller circular areas, implying that it has been
consumed by reaction with the scale, forming Ca2Fe2O5. The overlap between Ca
and Cr at the edges of the circular patches indicates the presence of CaCrO4.
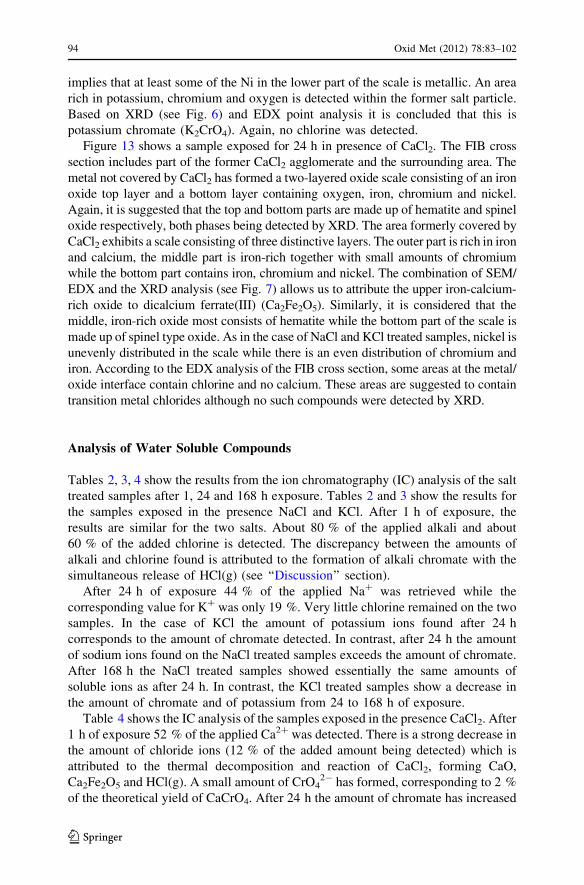
In order to further investigate the oxide scale, FIB cross sections were prepared
from samples exposed for 24 h in the presence of salt, see Figs. 11, 12, and 13. In
the case of NaCl and KCl, the FIB cross sections were prepared through a former
salt particle. In the case of CaCl2, the FIB cross section was performed at the edge
of the former CaCl2 agglomerates including both the area originally covered by salt
Fig. 10 EDX images of a sample exposed for 24 h in presence of CaCl2 at 600 �C in 5 %O2 ?40 %H2O
Fig. 11 EDX images of a FIB cross section through a former salt crystal on a sample exposed for 24 h inpresence of NaCl at 600 �C in 5 %O2 ? 40 %H2O
92 Oxid Met (2012) 78:83–102
123
and the surrounding area. A platinum layer was first deposited on the selected area
in order to protect the oxide.
Figure 11 shows a FIB cross section prepared through a former NaCl crystal after
24 h exposure at 600 �C. The shape of the former NaCl crystal can still be discerned
but neither Na nor Cl is detected within its shape. A thick layered oxide scale has
formed beneath the former NaCl crystal. The upper part of the scale consists of
almost pure iron oxide while the bottom part shows high concentrations of
chromium, iron and nickel. While iron and chromium are evenly distributed in the
bottom part of the scale the nickel distribution is more uneven. Local enrichments of
metallic nickel are also present in the alloy substrate immediately below the scale.
No chlorine was detected. Based on this information and on the evidence from XRD
(see Fig. 5) it is concluded that the upper iron-rich oxide corresponds to hematite
while the bottom part of the scale is made up of spinel type oxide.
Figure 12 shows a corresponding sample exposed in presence of KCl. The
corrosion morphology is similar to the NaCl case. Thus, a two layered oxide scale
has formed beneath the former salt particle, consisting of an outer iron-rich layer
and an inner layer containing iron, chromium and nickel. Again, the distribution of
Ni in the bottom part of the scale is very uneven. In this case the oxygen map
Fig. 12 EDX images of a FIB cross section through a former salt crystal on a sample exposed for 24 h inpresence of KCl at 600 �C in 5 %O2 ? 40 %H2O
Fig. 13 45� tilted EDX images of a FIB cross section partly through a former salt crystal on a sampleexposed for 24 h in presence of CaCl2 at 600 �C in 5 %O2 ? 40 %H2O
Oxid Met (2012) 78:83–102 93
123
implies that at least some of the Ni in the lower part of the scale is metallic. An area
rich in potassium, chromium and oxygen is detected within the former salt particle.
Based on XRD (see Fig. 6) and EDX point analysis it is concluded that this is
potassium chromate (K2CrO4). Again, no chlorine was detected.
Figure 13 shows a sample exposed for 24 h in presence of CaCl2. The FIB cross
section includes part of the former CaCl2 agglomerate and the surrounding area. The
metal not covered by CaCl2 has formed a two-layered oxide scale consisting of an iron
oxide top layer and a bottom layer containing oxygen, iron, chromium and nickel.
Again, it is suggested that the top and bottom parts are made up of hematite and spinel
oxide respectively, both phases being detected by XRD. The area formerly covered by
CaCl2 exhibits a scale consisting of three distinctive layers. The outer part is rich in iron
and calcium, the middle part is iron-rich together with small amounts of chromium
while the bottom part contains iron, chromium and nickel. The combination of SEM/
EDX and the XRD analysis (see Fig. 7) allows us to attribute the upper iron-calcium-
rich oxide to dicalcium ferrate(III) (Ca2Fe2O5). Similarly, it is considered that the
middle, iron-rich oxide most consists of hematite while the bottom part of the scale is
made up of spinel type oxide. As in the case of NaCl and KCl treated samples, nickel is
unevenly distributed in the scale while there is an even distribution of chromium and
iron. According to the EDX analysis of the FIB cross section, some areas at the metal/
oxide interface contain chlorine and no calcium. These areas are suggested to contain
transition metal chlorides although no such compounds were detected by XRD.
Analysis of Water Soluble Compounds
Tables 2, 3, 4 show the results from the ion chromatography (IC) analysis of the salt
treated samples after 1, 24 and 168 h exposure. Tables 2 and 3 show the results for
the samples exposed in the presence NaCl and KCl. After 1 h of exposure, the
results are similar for the two salts. About 80 % of the applied alkali and about
60 % of the added chlorine is detected. The discrepancy between the amounts of
alkali and chlorine found is attributed to the formation of alkali chromate with the
simultaneous release of HCl(g) (see ‘‘Discussion’’ section).
After 24 h of exposure 44 % of the applied Na? was retrieved while the
corresponding value for K? was only 19 %. Very little chlorine remained on the two
samples. In the case of KCl the amount of potassium ions found after 24 h
corresponds to the amount of chromate detected. In contrast, after 24 h the amount
of sodium ions found on the NaCl treated samples exceeds the amount of chromate.
After 168 h the NaCl treated samples showed essentially the same amounts of
soluble ions as after 24 h. In contrast, the KCl treated samples show a decrease in
the amount of chromate and of potassium from 24 to 168 h of exposure.
Table 4 shows the IC analysis of the samples exposed in the presence CaCl2. After
1 h of exposure 52 % of the applied Ca2? was detected. There is a strong decrease in
the amount of chloride ions (12 % of the added amount being detected) which is
attributed to the thermal decomposition and reaction of CaCl2, forming CaO,
Ca2Fe2O5 and HCl(g). A small amount of CrO42- has formed, corresponding to 2 %
of the theoretical yield of CaCrO4. After 24 h the amount of chromate has increased
94 Oxid Met (2012) 78:83–102
123
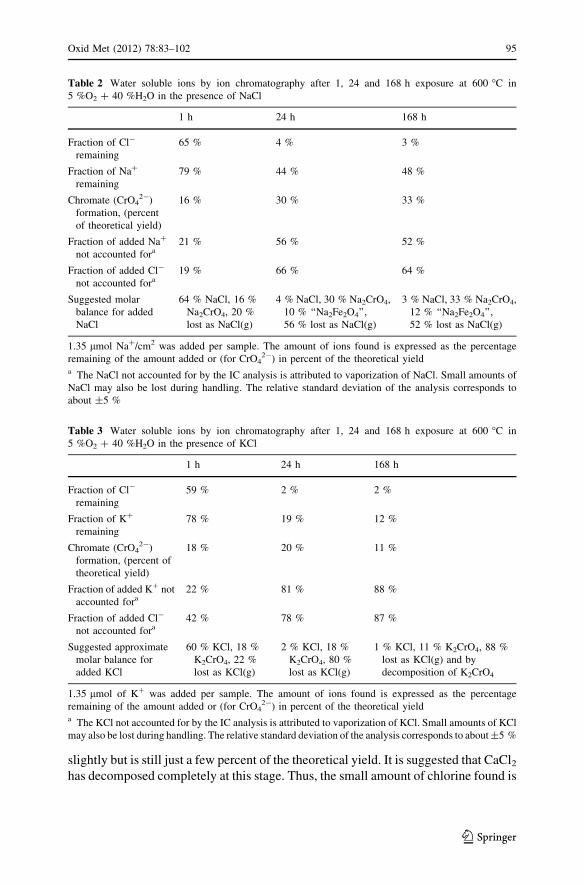
slightly but is still just a few percent of the theoretical yield. It is suggested that CaCl2has decomposed completely at this stage. Thus, the small amount of chlorine found is
Table 2 Water soluble ions by ion chromatography after 1, 24 and 168 h exposure at 600 �C in
5 %O2 ? 40 %H2O in the presence of NaCl
1 h 24 h 168 h
Fraction of Cl-
remaining
65 % 4 % 3 %
Fraction of Na?
remaining
79 % 44 % 48 %
Chromate (CrO42-)
formation, (percent
of theoretical yield)
16 % 30 % 33 %
Fraction of added Na?
not accounted fora21 % 56 % 52 %
Fraction of added Cl-
not accounted fora19 % 66 % 64 %
Suggested molar
balance for added
NaCl
64 % NaCl, 16 %
Na2CrO4, 20 %
lost as NaCl(g)
4 % NaCl, 30 % Na2CrO4,
10 % ‘‘Na2Fe2O4’’,
56 % lost as NaCl(g)
3 % NaCl, 33 % Na2CrO4,
12 % ‘‘Na2Fe2O4’’,
52 % lost as NaCl(g)
1.35 lmol Na?/cm2 was added per sample. The amount of ions found is expressed as the percentage
remaining of the amount added or (for CrO42-) in percent of the theoretical yield
a The NaCl not accounted for by the IC analysis is attributed to vaporization of NaCl. Small amounts of
NaCl may also be lost during handling. The relative standard deviation of the analysis corresponds to
about ±5 %
Table 3 Water soluble ions by ion chromatography after 1, 24 and 168 h exposure at 600 �C in
5 %O2 ? 40 %H2O in the presence of KCl
1 h 24 h 168 h
Fraction of Cl-
remaining
59 % 2 % 2 %
Fraction of K?
remaining
78 % 19 % 12 %
Chromate (CrO42-)
formation, (percent of
theoretical yield)
18 % 20 % 11 %
Fraction of added K? not
accounted fora22 % 81 % 88 %
Fraction of added Cl-
not accounted fora42 % 78 % 87 %
Suggested approximate
molar balance for
added KCl
60 % KCl, 18 %
K2CrO4, 22 %
lost as KCl(g)
2 % KCl, 18 %
K2CrO4, 80 %
lost as KCl(g)
1 % KCl, 11 % K2CrO4, 88 %
lost as KCl(g) and by
decomposition of K2CrO4
1.35 lmol of K? was added per sample. The amount of ions found is expressed as the percentage
remaining of the amount added or (for CrO42-) in percent of the theoretical yield
a The KCl not accounted for by the IC analysis is attributed to vaporization of KCl. Small amounts of KCl
may also be lost during handling. The relative standard deviation of the analysis corresponds to about ±5 %
Oxid Met (2012) 78:83–102 95
123
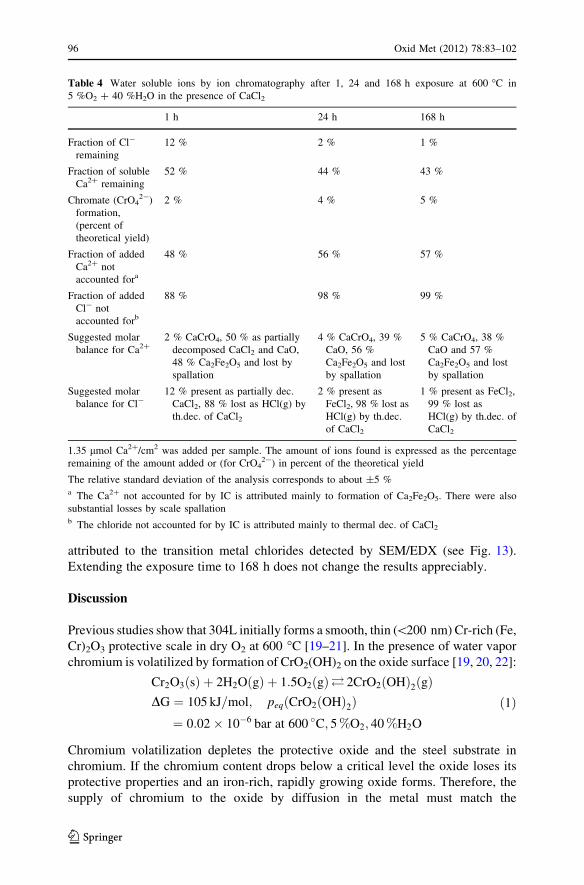
attributed to the transition metal chlorides detected by SEM/EDX (see Fig. 13).
Extending the exposure time to 168 h does not change the results appreciably.
Discussion
Previous studies show that 304L initially forms a smooth, thin (\200 nm) Cr-rich (Fe,
Cr)2O3 protective scale in dry O2 at 600 �C [19–21]. In the presence of water vapor
chromium is volatilized by formation of CrO2(OH)2 on the oxide surface [19, 20, 22]:
Cr2O3ðsÞ þ 2H2OðgÞ þ 1:5O2ðgÞ� 2CrO2ðOHÞ2ðgÞDG ¼ 105 kJ=mol; peqðCrO2ðOHÞ2Þ¼ 0:02� 10�6 bar at 600 �C; 5 %O2; 40 %H2O
ð1Þ
Chromium volatilization depletes the protective oxide and the steel substrate in
chromium. If the chromium content drops below a critical level the oxide loses its
protective properties and an iron-rich, rapidly growing oxide forms. Therefore, the
supply of chromium to the oxide by diffusion in the metal must match the
Table 4 Water soluble ions by ion chromatography after 1, 24 and 168 h exposure at 600 �C in
5 %O2 ? 40 %H2O in the presence of CaCl2
1 h 24 h 168 h
Fraction of Cl-
remaining
12 % 2 % 1 %
Fraction of soluble
Ca2? remaining
52 % 44 % 43 %
Chromate (CrO42-)
formation,
(percent of
theoretical yield)
2 % 4 % 5 %
Fraction of added
Ca2? not
accounted fora
48 % 56 % 57 %
Fraction of added
Cl- not
accounted forb
88 % 98 % 99 %
Suggested molar
balance for Ca2?2 % CaCrO4, 50 % as partially
decomposed CaCl2 and CaO,
48 % Ca2Fe2O5 and lost by
spallation
4 % CaCrO4, 39 %
CaO, 56 %
Ca2Fe2O5 and lost
by spallation
5 % CaCrO4, 38 %
CaO and 57 %
Ca2Fe2O5 and lost
by spallation
Suggested molar
balance for Cl-12 % present as partially dec.
CaCl2, 88 % lost as HCl(g) by
th.dec. of CaCl2
2 % present as
FeCl2, 98 % lost as
HCl(g) by th.dec.
of CaCl2
1 % present as FeCl2,
99 % lost as
HCl(g) by th.dec. of
CaCl2
1.35 lmol Ca2?/cm2 was added per sample. The amount of ions found is expressed as the percentage
remaining of the amount added or (for CrO42-) in percent of the theoretical yield
The relative standard deviation of the analysis corresponds to about ±5 %a The Ca2? not accounted for by IC is attributed mainly to formation of Ca2Fe2O5. There were also
substantial losses by scale spallationb The chloride not accounted for by IC is attributed mainly to thermal dec. of CaCl2
96 Oxid Met (2012) 78:83–102
123
evaporation rate to maintain the protective properties of the oxide. At the alloy grain
boundaries the diffusion is higher compared to the center of the steel grains. Hence,
the oxidation behavior of the steel surface depends on the distance to a grain
boundary. This explains why ‘‘islands’’ consisting of thick oxide form on central
parts of the underlying steel grains while the areas close to a grain boundary retain a
thin slow-growing oxide (see Fig. 3a, e). The oxide islands consist of an outer
hematite (Fe2O3) and inner spinel-type ((Fe, Cr, Ni)3O4) layer [23].
In general, any process that depletes the protective oxide and the steel substrate
in chromium is expected to make the stainless steel more vulnerable to high
temperature corrosion. The present study explores chromate formation as a
mechanism for chromium depletion, showing that both NaCl or KCl can trigger a
breakdown of the protective oxide on 304L by formation of Na2CrO4 and K2CrO4,
respectively (see Figs. 5, 6, 8, 9 and Tables 2, 3) [24]:
Cr2O3ðsÞ þ 4NaClðsÞ þ 2H2OðgÞ þ 3=2O2ðgÞ� 2Na2CrO4ðsÞ þ 4HClðgÞDG ¼ 163 kJ=mol; peqðHClÞ ¼ 740� 10�6 bar at 600 �C; 5 %O2; 40 %H2O
ð2Þ
Cr2O3ðsÞ þ 4KClðsÞ þ 2H2OðgÞ þ 3=2O2ðgÞ� 2K2CrO4ðsÞ þ 4HClðgÞDG ¼ 147 kJ=mol; peqðHClÞ ¼ 1303� 10�6 bar at 600 �C; 5 %O2; 40 %H2O
ð3Þ
The results show that chromate formation starts during the first exposure hour. After
24 h, chromates can be detected all over the surface which indicates that both KCl
and NaCl diffuses out from the salt particle and react with the protective oxide that
initially forms. It is proposed that chromium depletion of the protective oxide by
reactions (2) and (3) result in a breakdown of the protective properties of the oxide,
triggering the formation of a rapidly growing iron-rich scale. This is in accordance
with earlier reports on the influence of KCl on the high temperature corrosion of
304L [12–14]. The resulting thick scale consists of an outer hematite layer and an
underlying (Fe, Cr, Ni) spinel type oxide (see Figs. 11, 12) [16]. It is expected that
this two-layered scale is poorly protective and the formation appears to be much
faster compared to the breakdown triggered by chromium oxide hydroxide vola-
tilization in the absence of salt.
As shown in Tables 2 and 3, about 60 % of the salts is still unreacted after 1 h.
Furthermore, considerable amounts of alkali chromate have formed already during
this first hour. However, about 20 % of the salts are not accounted for by the IC
analysis and it is suggested that this is because of vaporization of the salts. The
equilibrium partial pressure of NaCl and KCl at 600 �C are 1.4 9 10-6 bar and
3.3 9 10-6 bar, respectively [24]. The results show that chromate formation and
volatilization of the salt continues during the first 24 h. It may be noted that the
amount of chromate on the surface is similar after 24 and 168 h in the case of NaCl.
In contrast, the amount of chromate decreases significantly with time in the case of
KCl, suggesting that K2CrO4 tends to decompose. The decomposition of potassium
chromate by reaction with water is not thermodynamically favoured: permeable for
oxide and chloride ions. Thus, the scale structure is similar to the oxide islands
Oxid Met (2012) 78:83–102 97
123
formed on 304L in O2 ? H2O environment in the absence of salt. The destruction of
the protective scale by chromate [24]
K2CrO4ðsÞ þ 2H2OðgÞ� 2KOHðlÞ þ CrO2ðOHÞ2ðgÞDG ¼ 348 kJ=mol; peqðCrO2ðOHÞ2Þ ¼ 8� 10�23 bar at 600 �C; 40 %H2O
ð4Þ
Decomposition to Cr2O3 by water is also not favoured [24]:
K2CrO4ðsÞ þ H2OðgÞ� 2KOHðlÞ þ 1=2Cr2O3ðsÞ þ 3=4O2ðgÞDG ¼ 231 kJ=mol; at 600 �C; 40 %H2O
ð5Þ
Instead, it is argued that potassium chromate decomposes electrochemically. The
oxidation of metals in oxygen gas at high temperature is usually described in terms
of a mechanism where molecular oxygen is reduced on the scale surface while metal
is being oxidized at the scale/metal interface, the two reactions being coupled by
electronic and ionic currents through the scale. In this scenario oxygen is thus
cathodically reduced at the scale surface. It is argued that in the present case the
reduction of alkali chromate provides an alternative cathodic process:
K2CrO4ðsÞ þ 3e� þ H2OðgÞ� 2KOHðlÞ þ 1=2Cr2O3ðsÞ ð6Þ
The cathodic current is provided by metal oxidation:
FeðsÞ� Fe2þ þ 2e� ð7Þ
CrðsÞ�Cr3þ þ 3e� ð8Þ
The potassium hydroxide formed in this way can either react with the surface oxide
or be volatilized [24]:
2KOHðlÞ þ Fe2O3ðsÞ�K2Fe2O4ðsÞ þ H2OðgÞDG ¼ �44:7 kJ at 600 �C
ð9Þ
KOHðlÞ�KOHðgÞDG ¼ 72 kJ; peqðKOHðgÞÞ ¼ 4:9� 10�5 bar at 600 �C
ð10Þ
Because of its high equilibrium vapour pressure, KOH is not likely to be present in
pure form at 600 �C.
Considering its similarity to K2CrO4 it is expected that Na2CrO4 would
decompose in a similar way (i.e. forming NaOH):
Na2CrO4ðsÞ þ 3e� þ H2OðgÞ� 2NaOHðlÞ þ 1=2Cr2O3ðsÞ ð11Þ
However, the results show that the amount of sodium chromate does not decrease
with time as in the case of potassium chromate. Another significant difference
between the effects of KCl and NaCl is that while the amount of K? corresponds to
the number of moles of chromate and chloride detected, the amount of Na? exceeds
the number of moles of chromate and chloride found, suggesting alkaline condition
on the surface. The disparity between Na and chromate ? chlorine was confirmed
by EDX point analysis. It is suggested that these differences are explained by the
98 Oxid Met (2012) 78:83–102
123
lower volatility of NaOH compared to KOH. Thus, the equilibrium vapour pressure
over the corresponding pure condensed phase at 600 �C is 5.3 9 10-7 and
4.9 9 10-5 bar for NaOH and KOH respectively. This means that while the
decomposition of K2CrO4 produces KOH, which is easily vaporized, the NaOH
formed by decomposition of Na2CrO4 is expected to accumulate on the surface, in
accordance with our observations. The alkaline environment created in this way is
suggested to slow down the decomposition of Na2CrO4 (11).
The sodium hydroxide accumulated on the surface may react with iron oxide,
forming sodium ferrate(III) [24]:
2NaOHðlÞ þ Fe2O3ðsÞ�Na2Fe2O4ðsÞ þ H2OðgÞDG ¼ �61 kJ at 600 �C
ð12Þ
Alkali ferrate(III) may also form by reaction of the applied salt with hematite [24]:
2NaClðsÞ þ Fe2O3ðsÞ þ H2OðgÞ�Na2Fe2O4ðsÞ þ 2HClðgÞDG ¼ 191 kJ=mol; pðHClÞ ¼ 1:2� 10�6 bar at 600 �C; 40 %H2O
ð13Þ
2KClðsÞ þ Fe2O3ðsÞ þ H2OðgÞ�K2Fe2O4ðsÞ þ 2HClðgÞDG ¼ 260 kJ=mol; pðHClÞ ¼ 1:03� 10�8 bar at 600 �C; 40 %H2O
ð14Þ
It may be noted that the formation of sodium ferrate is much more favoured
compared to potassium ferrate. It is therefore suggested that the greater stability of
sodium chromate in comparison to potassium chromate can be attributed to the
more alkaline conditions that prevail on the NaCl-treated samples.
In spite of these differences regarding corrosion chemistry, it is important to note
that the corrosion effect of NaCl and KCl are generally speaking quite similar in
these conditions.
In contrast to NaCl and KCl, CaCl2 is only slightly corrosive under the exposure
conditions. One explanation is that CaCl2 is readily converted to CaO [24]:
2CaCl2 þ H2O�CaOþ 2HClðgÞDG ¼ 119 kJ; pHCl ¼ 169� 10�6 bar at 600 �C; 40 %H2O:
ð15Þ
Accordingly, the quantitative analysis of the samples after oxidation (Table 4) show
that only 12 % of the added chloride remains on the surface after 1 h of oxidation.
This indicates that most of the CaCl2 has been converted to CaO at this stage.
However, XRD analysis gave only weak diffraction from CaO while no evidence
was found for CaCl2 or its hydrates. The thermal decomposition of CaCl2 to CaO is
known to proceed through intermediate steps and several calcium-hydroxychlorides
and -oxychlorides have been described (e.g. Ca(OH)Cl) [18]. These compounds are
metastable and tend to be poorly crystalline. Thus, the chloride remaining on the
surface after 1 h of exposure is mainly attributed to calcium-hydroxychlorides and
–oxychlorides. After 24 h only 2 % of the added chloride remains. At this stage
there is strong diffraction from CaO and Ca2Fe2O5. The latter compound corre-
sponds to the iron- and calcium-rich band seen in Fig. 10, encircling a former CaCl2agglomeration. Apparently, reaction (15) is now completed and parts of the CaO
Oxid Met (2012) 78:83–102 99
123
formed has reacted further with iron oxide at the scale/gas interface (reaction 16)
[24].
Fe2O3ðsÞ þ 2CaOðsÞ�Ca2Fe2O5ðsÞDG ¼ �63 kJ=mol at 600 �C
ð16Þ
Because of its rapid thermal decomposition, CaCl2 does not have the opportunity
to react extensively with the chromium-rich oxide as is the case for NaCl and KCl.
However, small amounts of calcium chromate are detected around the former CaCl2agglomerates (reaction 17).
Cr2O3ðsÞ þ 2CaCl2ðsÞ þ 2H2OðgÞ þ 3=2O2ðgÞ� 2CaCrO4ðsÞ þ 4HClðgÞDG ¼ 127 kJ=mol; pHCl : 2602� 10�6 bar at 600 �C; 5 %O2; 40 %H2O
ð17Þ
Calcium chromate can also form by reaction with CaO (reaction 18). Because of
the poor mobility of CaO, Ca does not spread over the surface and the reaction
between Ca and the protective oxide is limited [24].
Cr2O3ðsÞ þ CaOðsÞ þ 3=2O2ðgÞ� 2CaCrO4ðsÞDG ¼ �112 kJ=mol at 600 �C; 5 %O2
ð18Þ
Because of the small extent of chromate formation, the protective oxide is not
chromium depleted in a major way, explaining why exposure in the presence of
CaCl2 does not result in accelerated corrosion, compared to the reference exposure,
in the absence of salt. Accordingly, the oxidation morphology is similar to that
observed in 5 %O2 ? 40 %H2O environment in the absence of salt [23]. Thus,
Fig. 13 shows a two-layered oxide consisting of an outer iron-rich part and an inner
layer that contains iron, chromium and nickel. In the area previously covered by
CaCl2, three scale layers can be detected. The outer part is rich in Fe and Ca
(corresponding to Ca2Fe2O5). The middle and bottom parts correspond to the scale
formed away from the salt agglomeration. Thus, the middle part is iron-rich together
with small amounts of chromium (probably corresponding to Fe2O3) while the inner
part contains iron, chromium and nickel (spinel oxide, (Fe, Cr, Ni)3O4). Noticeable
is that the bottom spinel oxide layer is thinner than the corresponding oxide formed
adjacent to the former salt agglomerate. This may indicate that the top Ca2Fe2O5
layer acts as a barrier. The slightly lower mass gain of the CaCl2 exposed samples
compared to the salt free exposures is not considered to be significant because of the
occurrence of substantial scale spallation at the location of the former CaCl2agglomerations (see Fig. 4). Spallation is also suggested to explain why the Ca2?
content decreases with time, see Table 4. In addition, the thermal decomposition of
CaCl2 forming CaO and HCl(g) also contributes to a lower mass gain. All the
chlorine added corresponds to 0.09 mg/cm2.
Figure 13 also shows two small areas enriched in chlorine at the metal/oxide
interface. This corresponds to sub-scale transition metal chlorides formed by the
alloy. It is suggested that the small amounts of chloride detected by IC analysis can
be attributed to such sub-scale chlorides. It appears that the chloride accumulations
do not influence corrosion in a major way in the present case.
100 Oxid Met (2012) 78:83–102
123
Conclusions
The presence of KCl and NaCl strongly accelerates the high temperature corrosion
of 304L stainless steel in 5 %O2 ? 40 %H2O environment. The corrosion is
initiated by the formation of alkali chromate(VI) through the reaction of alkali with
the protective oxide. Chromate formation is a sink for chromium in the oxide and
leads to a loss of its protective properties. Subsequently a rapidly growing scale
forms, consisting of an outer hematite layer with chromate particles on top and an
inner layer consisting of spinel oxide, (Fe, Cr, Ni)3O4. While the extent of corrosion
attack is similar for samples exposed to NaCl and KCl, some differences are
observed. Thus, the amount of Na2CrO4 formed was higher compared to K2CrO4,
the latter compound decomposing with time. Furthermore, the samples exposed in
the presence of NaCl formed a corrosion product containing Na, Fe and O, possibly
Na2Fe2O4. In contrast, the only alkali-containing product forming on the KCl-
treated samples was K2CrO4. These differences are attributed to the greater
volatility of KOH compared to NaOH.
In contrast to NaCl and KCl, CaCl2 is not very corrosive. Under the exposure
conditions CaCl2 is rapidly converted to CaO. Because of the poor mobility of CaO,
only small amounts of CaCrO4 form where CaO is in direct contact with the scale.
CaO also reacts with the scale to form Ca2Fe2O5.
Acknowledgment This work was carried out within the High Temperature Corrosion Centre (HTC) at
Chalmers University of Technology.
Open Access This article is distributed under the terms of the Creative Commons Attribution License
which permits any use, distribution, and reproduction in any medium, provided the original author(s) and
the source are credited.
References
1. K. O. Davidsson, L. E. Amand, B. Leckner, B. Kovacevik, M. Svane, M. Hagstrom, J. B. C.
Pettersson, J. Pettersson, H. Asteman, J. E. Svensson, and L. G. Johansson, Energy & Fuels 21, 71
(2007).
2. J. Pettersson, C. Pettersson, N. Folkeson, L.-G. Johansson, E. Skog, and J.-E. Svensson, MaterialsScience Forum 522–523, 563 (2006).
3. H. P. Nielsen, F. J. Frandsen, K. Dam-Johansen, and L. L. Baxter, Progress in Energy andCombustion Science 26, 283 (2000).
4. N. Folkeson, J. Pettersson, C. Pettersson, L. G. Johansson, E. Skog, B. A. Andersson, S. Enestam,
J. Tuiremo, A. Jonasson, B. Heikne, and J. E. Svensson, Materials Science Forum 595–598, 289
(2008).
5. H. P. Michelsen, F. Frandsen, K. Dam-Johansen, and O. H. Larsen, Fuel Processing Technology 54,
95 (1998).
6. H. J. Grabke, E. Reese, and M. Spiegel, Corrosion Science 37, 1023 (1995).
7. M. Montgomery and A. Karlsson, Materials and Corrosion 50, 579 (1999).
8. H. P. Nielsen, F. J. Frandsen, and K. Dam-Johansen, Energy & Fuels 13, 1114 (1999).
9. C. J. Wang and T. T. He, Oxidation of Metals 58, 415 (2002).
10. M. Montgomery, A. Karlsson, and O. H. Larsen, Materials and Corrosion 53, 121 (2002).
11. N. Folkeson, T. Jonsson, M. Halvarsson, L.-G. Johansson, and J.-E. Svensson, Materials andCorrosion (2010). doi:10.1002/maco.201005942.
Oxid Met (2012) 78:83–102 101
123
12. C. Pettersson, L. G. Johansson, and J. E. Svensson, Oxidation of Metals 70, 241 (2008).
13. C. Pettersson, J. Pettersson, H. Asteman, J. E. Svensson, and L. G. Johansson, Corrosion Science 48,
1368 (2006).
14. J. Pettersson, H. Asteman, J.-E. Svensson, and L.-G. Johansson, Oxidation of Metals 64, 23 (2005).
15. C. Proff, T. J., C. Pettersson, J.-E. Svensson, L.-G. Johansson, and M. Halvarsson, Submitted to
Microscopy of Oxidation (2008).
16. T. Jonsson, et al., Oxidation of Metals 72, 213 (2009).
17. J. Pettersson, N. Folkeson, J.-E. Svensson, and L.-G. Johansson, Oxidation of Metals 76(1–2), 93
(2011).
18. L. Gmelin, Gmelins Handbuch der anorganischen Chemie (1924–1997).
19. H. Asteman, J. E. Svensson, L. G. Johansson, and M. Norell, Oxidation of Metals 52, 95 (1999).
20. H. Asteman, J. E. Svensson, M. Norell, and L. G. Johansson, Oxidation of Metals 54, 11 (2000).
21. J. E. Tang, et al., Micron 32, 799 (2001).
22. B. Pujilaksono, T. Jonsson, M. Halvarsson, I. Panas, J.-E. Svensson, and L.-G. Johansson, Oxidationof Metals 70, 163 (2008).
23. M. Halvarsson, J. E. Tang, H. Asteman, J.-E. Svensson, and L.-G. Johansson, Corrosion Science 48,
2014 (2006).
24. I. Barin, Thermodynamic Data of Pure Substances, 3rd edn. (1995).
102 Oxid Met (2012) 78:83–102
123