Embed Size (px)
Citation preview

GPO BOX 12
Sydney NSW 2001^^^ SOUTH' '
INDEPENDENT AUDITOR' S REPORT
Sydney West Area Health Service
To Members of the New South Wales Parliament
I have audited the accompanying financial statements of the Sydney West Area Health Service (theService), which comprises the statement of financial position as at 30 June 2010, the statement ofcomprehensive income, statement of changes in equity, statement of cash flows and service groupstatements for the year then ended, a summary of significant accounting policies and otherexplanatory notes for both the Service and the consolidated entity. The consolidated entitycomprises the Service and the entities it controlled at the year's end or from time to time duringthe financial year.
Auditor's Opinion
In my opinion, the financial statements:
n present fairly, in all material respects, the financial position of the Service and theconsolidated entity as at 30 June 2010, and of the financial performance for the year thenended in accordance with Australian Accounting Standards (including the AustralianAccounting Interpretations)
are in accordance with section 45E of the Public Finance and Audit Act 1983 (the PF&A Act)and the Public Finance and Audit Regulation 2010.
My opinion should be read in conjunction with the rest of this report.
Chief Executive's Responsibility for the Financial Statements
The Chief Executive is responsible for the preparation and fair presentation of the financialstatements in accordance with Australian Accounting Standards (including the Australian AccountingInterpretations) and the PF&A Act. This responsibility includes establishing and maintaining internalcontrols relevant to the preparation and fair presentation of the financial statements that are freefrom material misstatement, whether due to fraud or error; selecting and applying appropriateaccounting policies; and making accounting estimates that are reasonable in the circumstances.
Auditor' s Responsibility
My responsibility is to express an opinion on the financial statements based on my audit. Iconducted my audit in accordance with Australian Auditing Standards. These Auditing Standardsrequire that I comply with relevant ethical requirements relating to audit engagements and planand perform the audit to obtain reasonable assurance whether the financial statements are freefrom material misstatement.
An audit involves performing procedures to obtain audit evidence about the amounts anddisclosures in the financial statements. The procedures selected depend on the auditor'sjudgement, including the assessment of the risks of material misstatement of the financial
statements, whether due to fraud or error. In making those risk assessments, the auditor considersinternal controls relevant to the entity's preparation and fair presentation of the financialstatements in order to design audit procedures that are appropriate in the circumstances, but notfor the purpose of expressing an opinion on the effectiveness of the entity's internal controls. Anaudit also includes evaluating the appropriateness of accounting policies used and thereasonableness of accounting estimates made by the Chief Executive, as well as evaluating theoverall presentation of the financial statements.

I believe that the audit evidence I have obtained is sufficient and appropriate to provide a basis formy audit opinion.
My opinion does not provide assurance:
•
about the future viability of the Service or the consolidated entity•
that they have carried out their activities effectively, efficiently and economically•
about the effectiveness of their internal controls•
on the assumptions used in formulating the budget figures disclosed in the financial statements.
Independence.
In conducting this audit, the Audit Office of New South Wales has complied with the independencerequirements of the Australian Auditing Standards and other relevant ethical requirements. ThePFF&A Act further promotes independence by:
providing that only Parliament, and not the. executive government, can remove anAuditor-General
mandating the Auditor-General as auditor of public sector agencies but precluding the provisionof non-audit services, thus ensuring the Auditor-General and the Audit Office of New SouthWales are not compromised in their role by the possibility of losing clients or income.
A T Whitfield
Acting Auditor-General
7 October 2010SYDNEY

SYDNEY WEST NSW@HEALTHAREA HEALTH SERVICE
I
I
2009/10 Financial Statements
Pursuant to Section 45F of the Public Finance and Audit Act 1983, I state that to the best of my knowledge and belief:
1) the financial report has been prepared in accordance with:
• Australian Accounting Standards
• Public Finance and Audit Act 1983
• Public Finance and Audit Regulations 2010
• Health Services Act 1997 and its Regulations
• the Accounts and Audit Determination
2) the financial report exhibits a true and fair view of the financial position and financial performance of the Sydney West Area Health Service Special Purpose Service Entity.
3) there are no circumstances which would render any particulars included in the financial report to be misleading or inaccurate.
tzk)~ Heather Gray Chief Executive
Date: 30 September 2010
ABN 70667812600
PO Box 63 Penrith NSVV 2751
Providing health services to the communities of Auburn' Baulkham Hills' Blacklown
Holroyd' Parramatta • Hawkesbury' Penrith • Blue Mountains' Greater Lithgow

BEGINNING OF AUOrTEO FINANCIAL STATEMENT
Sydney Wesl Area Health Sel"'llce
Statement of Comprehen~lYe Income lor the year ended 30 June 2010
PARENT CONSOLIDATION
Actual
2010
$000
BUdget
2010
$000
Actual
'""$000
Notes Al;tual
2.010
$000
Budget
2010
SOOO
Al;tual
2009 $000
1,201,961 46,134
694,043 n,M5 18,392
"".........5.!..'~_
1,191,658 46,052
691,947 81,312 16,671 2,443
._.......•~.~.&3.6_
Expenses excluding losses
apamling Expllnaes Employee Ralated
1,166,182 PersonnEll Services 47,172 Visiting MedicElIOHicl)fs
663,192 Other Operating Expenses 76,460 necrecranco and AmorlisatiOil 17,599 Grants and Subsidies 2,346 noaree Coots
_~.Q_~?_~. Payments to AHiliatlld Health OrganisaliOlls
3 4
5 2{i),6 7 6
9
1,201,961
46,134 694,043
76,645 16,392
""_~.7,3.~.
1,191,656
46,052 691,947
81,312 16,871 2,443
______~~,_~:1..~
1,166,182
47,172 663,192 76,460 17,599 2,346
........~Q!.~,!..~ .
......... ~,~~~!.~~~_ .._..... _~,0~~,~~9 __~.~O_~,~::2..~.Q..Tl;)ta\Expenses elO:cludinglosses - --.-.~!~~'~.'.~~~- _2!_~_5_5!~~_~_ ........ ?~~!.~.~~~g
314,869 10,085 59,708
...... ------~~,~~?.
307,812 8,755
59,100
__~'?':1.6.. _
Revenue
277,439 Sille of Goods and Services 12,682 Investment Revenue 54,331 Grarrls and COillributiOils
!.!!:1.9.. Other Revenue
11 12 13 14
314,869 10,085 36,182
.~~,_~_~7
307,612 6,755
36,568 _____ A~~,~
277,439 12,682 32,271
..............•.__!,1_~~
___ 396,~~~ _____3_8_~_~4_~.~. ~51_,~~ Total Revenue . . . ....•. • _3?~})~_~_ .... ~,~,~~.1 ---~-~._~~
(1,669) (5,084)
(2,000) (4,717}
(13,064) Gain/(Loss) orl Disposal (3,426} Other Gainst(Losses)
rs 16
(1,669) (5,084)
(2,000) (4,717)
(13,O64) (3,428)
1,679,935 1,6n,233 1,679,131 NetCost of Services 34 1,701,461 1,699.745 1,700,191
1,611.926
42,BSI
1,611,307
42,574
Gl;)vemment Contrtbutlons
NSW Department 01Hli!IlIlh 1.534,142 RecutrentAllocelloes
NSW Department of Haelth 83,535 Capital Allocations
Acceptance by thaCrown Entity 01 Employee Benefits
2(d)
2(d)
2(a)(ii}
1,611.926
42,851
____2_1,~~~ ._
1,611,307
42,574
~!.s.].?
1,534,142
83,535
2~,g~Q
-~.~.~.~.~~?? ~:~.:I.~~~~.1. ___!o_~_~~,_~!7 Total Govemment Contributions ____!.~6,3.~~. . _~!_li!_~,~~ ~,~y_3.?
(25,158) (23.352) ~~~("6"O,"454",) RESULT FOR THE YEAR (25.158) (23,352) (60,4541
Other Comprehensive InCOl'l\ll
__ ~~!.~?6
29,576
4,418 __--'(2=3~,3~S2:c)
(1,814) Asset RllvEllua~orl Reserve ........... - --- -- Other Comprehensive Income
(1,614) for the year - ....·..···-·-..TOT AL COMPREHENSIVE tNCOME
(62,266) FOR THE YEAR
~-~'-~.?~-
...~.~.~~~.
4,418 (23,352)
______(~!_~~4}
..............J~.,~~4J
(62,269)
The accompanying notes form part of these financiEllstatements.

The accompanying notesform part of these financial statements.

Syd
ne
y W
est
Are
a H
ea
lth S
erv
ice
S
tate
me
nt o
f Ch
an
ge
s in
Eq
uit
y fo
r th
e ye
ar e
nd
ed
30
Jun
e 2
010
Acc
um
ula
ted
F
un
ds
N
ote
s
$000
Ba
lan
ce a
t 1
Ju
ly 2
009
Cha
nges
in
Acc
ount
ing
Pol
icy
Cor
rect
ion
of E
rror
s
883,
155
Re
sta
ted
To
tal
Eq
uit
y at
1 J
uly
200
9 R
esu
lt F
or T
he Y
ea
r O
the
r C
om
pre
he
ns
ive
Inco
me:
N
et I
ncre
ase/
(Dec
reas
e) in
Pro
perly
, P
lant
& E
quip
men
t A
ssel
s H
eld
for
Sal
e T
ota
l Oth
er
Co
mp
reh
en
sive
In
com
e
To
tal
Co
mp
reh
ensi
ve I
nco
me
Fo
r T
he
Yea
r
883,
155
(25,
158)
(1,2
74)
(1,2
74)
(26,
432)
Tra
nsa
ctio
ns
Wit
h O
wn
ers
In T
hei
r C
apac
ity
As
Ow
ner
s in
crea
se/(
Dec
reas
e) in
Net
Ass
ets
Fro
m E
quity
Tra
nsfe
rs
Ba
lan
ce a
t 30
Ju
ne
201
0 38
(2
0,33
6)
836,
387
Ba
lan
ce a
t 1
Ju
ly 2
008
Cha
nges
in
Acc
ounl
ing
Pol
ley
Cor
rect
ion
of E
rror
s
943,
935
Re
sta
ted
To
tal
Eq
uit
y at
1 J
uly
200
8 R
esu
lt F
or T
he Y
ear
Oth
er C
om
pre
hen
sive
Inco
me:
Net
Incr
ease
/(D
ecre
ase)
in P
rope
rly,
Pla
nt &
Equ
ipm
ent
Adm
inis
trat
ive
Res
truc
ture
T
ota
l Oth
er
Co
mp
reh
en
sive
In
com
e
To
tal
Co
mp
reh
ensi
ve I
nco
me
Fo
r T
he
Ye
ar
943,
935
(60,
454)
(326
) (3
26)
883,
155
Tra
nsa
ctio
ns
With
Ow
ne
rs I
n T
he
ir C
ap
aci
ty A
s O
wn
ers
In
crea
se/(
Dec
reas
e) in
Net
Ass
ets
Fro
m E
quity
Tra
nsfe
rs
Ba
lan
ce a
t 30
Ju
ne
200
9 38
88
3,15
5
Ass
et R
eval
uat
ion
S
urp
lus
$000
231,
020
231,
020
29,5
76
(3,2
94)
26,2
82
26,2
82
257,
302
232,
834
232,
834
(1,8
14)
(1,8
14)
231,
020
231,
020
Ava
ilab
le F
or
Sal
e R
eser
ve
To
tal
$000
$0
00
1,11
4,17
5
1,11
4,17
5 (2
5,15
8)
4,56
8 4,
568
4,56
8
29,5
76
29,5
76
4,41
8
4,56
8 (2
0,33
6)
1,09
8,25
7
1,17
6,76
9
1,17
6,76
9 (6
0,45
4)
(1,8
14)
(326
) (2
,140
) 1,
114,
175
1,11
4,17
5
The
acc
ompa
nyin
g no
les
form
par
t of
Ihes
e fin
anci
al s
late
men
ts.

Sydney West Area Health Service Statement of Cash Flows for the year ended 30 June 2010
PARENT CONSOLIDATION
Actual 2010 $000
BUdget 2010 $000
Actual 2009 $000
Notes
Actual 2010 $000
Budget 2010 $000
Actual 2009 $000
(1,163,803) (20,231) (3,588)
(803,089)
(1,121,358) (16,871) (2,443)
(766,119)
CASH FLOWS FROM OPERATING ACTIVITIES Payments
(1,137,474) Employee Related (17,599) Grants and Suhsidies
(2,346) Finance Costs (776,626) Other
(1,163,803) (20,231) (3,588)
(B03,069)
(1,121,358) (16,871)
(2,443) (766,119)
(1,137,474) (17,599)
(2,346) (776,628)
(1,990,6~ (1,906,791 ) (1,934,047) Total Payments (1,990,691) (1,906,791) (1,934,047)
374,203 11,093 55,153
310,205 5,829
49,304
Receipts 309,911 Sale of Goods and Services
13,023 interest Received 73,994 Olher
374,203 11,093 55,153
310,205 5,829
49,304
309,911 13,023 73,994
440,449 365,338 396,928 Total Recelpts 440,449 365,338 396,928
1,611,926 42,851
1,611,307 42,574
Cash Flows From Government 1,534,142 NSW Department or Health Recurrent Allocations
83,535 NSW Department of Health capuar Allocations 1,611,926
42,851 1,611,307
42,574 1,534,142
83,535
1,654,777 1,653,881 1,617,677 Net Cash Flows From Government 1,654,777 1,653,881 1,617,877
104,535 112,428 NET CASH FLOWS FROM OPERATING
80,558 ACTIVITIES 3. 104,535 112,426 80,558
573
(74,370)
(308)
(73,667)
(1,594)
CASH FLOWS FROM INVESTING ACTIVITIES Proceeds from Sale of Land and Buildings, Plant and Equipment
127 and tnrrasfructure Systems Purchases of Land and Buildings, Plan! and Equipment
(103,501) and tnrrasuucture Syslems Purchases of Investments
5,028 Other
573
(74,370)
(308)
(73,687)
(1,594)
127
(103,501)
5,Q28
(73,797) (75,5~ (98,346) NET CASH FLOWS FROM INVESTING ACTIVITIES (73,797) (75,589) (98,346)
16,054 (9,156) (3,259) (3,660)
17,177 (4,153)
CASH FLOWS FROM FINANCING ACTIVITIES 21,646 Proceeds from Borrowings and Advances (6,189) Repayment of Borrowings and Advances
Other FInancial Asset - Repayment of Finance Lease
16,054 (9,156) (3,259) (3,680)
17,177 (4,153)
21,648 (6,169)
1,959 13,024 15,479 NET CASH FLOWS FROM FINANCING ACTIVITIES 1,959 13,024 15,479
32,697 109,154
49,863 109,154
(2,309) NET INCREASE f (DECREASE) IN CASH 111,483 Opening Cash and Cash Equlvalents
32,697 109,154
49,863 109,154
(2,309) 111,463
-----
141,851 159,017 109,154 CLOSINq CASH AND CASH EQUIVALENTS 19 141,851 159,017 109,154
The accompanying notes form part of these financial statements.

Syd
ney
Wes
t Are
a H
ealth
Ser
vice
S
ervi
ce G
rou
pS
tate
me
nts
ro
r th
e Y
ear E
nded
30
June
201
0
SE
RV
ICE
'S E
XP
EN
SE
S A
ND
S
ervi
ce G
roup
se
rcte
e G
roup
S
ervI
ce G
roup
S
ervi
ce G
roup
se
rere
e G
roup
S
ervJ
ceG
roup
S
ervi
ce G
roup
se
rvic
e G
roup
S
ervi
ce G
roup
S
ervi
ce G
roup
T
otal
INC
OM
E
1.1
~
2.1
~
3.1
~
4.1
~1.
2 1.
3 2.
2 2.
3 5.
1 *
'.1
2010
20
09
2010
20
09
2010
20
09
2010
20
09
2010
20
09
2010
20
09
2010
20
09
2010
20
09
2010
20
09
2010
20
09
2010
20
09
$000
$0
00
$000
$0
00
$000
$0
00
$000
$0
00
$000
$0
00
$000
$0
00
$000
$0
00
$000
$0
00
$000
Exp
ense
s ex
ciud
in91
0Sse
S
$000
iii
"0
0 I"
SO
O:,
.,1. $0
00
Ope
ratin
gE
xpen
ses
L0~~•••~.I_••
••aM
.
Em
ploy
eeR
elat
ed
115.
461
118,
025
1,20
1 1,
166
107.
575
105,
096
83,3
75
86,8
29
490,
300
443,
987
52,4
78
69,8
66
113,
661
111,
857
101,
014
108,
298
55,8
93
56,9
37
81,0
04
84,1
01 1
,201
,961
1
,18
6,1
82
Vis
iting
Med
ical
omce
rs
1,17
6 53
8 0
14
1277
4,
736
1,85
0 1,
972
31,4
66
2926
1 6,
329
4,51
9 2,
012
2,16
0 1,
509
1,92
9 37
7 99
5 13
8 1,
046
46,1
34
47,1
72
Oth
erO
pera
llng
Exp
ense
s 35
,602
31
,378
64
4 36
9 50
,288
48
,151
33
,995
41
,882
40
1,38
8 36
0,52
5 62
,220
68
,132
26
,801
21
,479
33
,346
34
,058
18
,765
16
,082
28
,974
21
,116
69
4,04
3 66
3,19
2
Dep
reci
atio
nand
Am
ortis
etio
n 4,
073
7,95
2 26
30
8,
243
6,50
3 4,
509
5,07
7 37
,571
31
,479
3,
562
4,55
7 6,
861
5,11
5 8,
519
6,24
0 2,
198
2,98
2 3,
083
4,52
5 76
,645
76
,460
Gra
nts
and
Sub
sidi
es
9,91
3 9,
636
353
71B
36
11
3 1
51
32
459
3 67
4,
974
4.57
9 80
2 84
7 43
7 40
5 1,
841
724
18,3
62
17,5
99
Fin
ance
Cos
ts
337
198
1 16
7 72
42
7 12
1,
852
1,66
7 11
2 12
7 12
3 22
13
8 24
45
9
60
15
3,26
2 2,
346
Pay
men
ts10
AN
iliale
d H
ealth
Org
anis
atio
ns
17,3
89
12,8
87
665
841
9,11
0 6,
751
27,3
64
20,2
79
Oth
er E
xpen
ses
Tot
al E
xpen
ses
exci
u di
ng lo
sses
18
3,95
2 18
0,61
4 2,
225
2,33
7 16
7,58
5 16
6,67
1 12
4,15
7 13
5,82
3 96
2,60
9 88
7,57
6 12
4,70
3 14
7,26
6 15
7,29
6 14
5,85
3 15
4,43
8 15
8,14
7 77
,736
77
,410
11
5,09
9 11
1,52
9 2,
069,
801
2,01
3,23
0 .,.
Rev
enue
",
.;'
"if/#4
t?X
~Mg~q:;,~
£f"j
ij''4,¥
i£ Q
#?2-f
t'iti ~;W:f~
~Jf*$1
~(:-:J.;i~/i!.
~~F..}b:'W,i
~~'Qlli~
,r:~;.
::/:';
.:i
:' ,
t·>
Sal
e of
Goo
ds a
ndS
ervi
ces
5.16
7 3,
107
as
7,55
2 5,
355
10.6
09
9,51
6 20
1,16
7 19
1,04
5 23
,746
12
,956
2,
894
2,83
0 26
,158
16
,064
2,
860
1,38
7 34
,677
35
,179
31
4,86
8 27
7,43
9
Inve
stm
entR
even
ue
579
1291
3
1,02
3 1.
294
3"
651
5,17
1 2,
828
493
64
. 63
3 1,
314
765
1,19
3 25
2 31
9 61
3 2,
943
10,0
85
12,6
62•
Gra
nts
and
Con
tnbu
tions
1,
689
1,60
5 16
7
1,82
6 1,
497
94
29
2,98
1 96
5 '0
4
329
1,15
5 1,
936
'62
62'
361
1,07
4 28
,952
24
,200
38
,182
32
,271
O1h
lH R
even
ue
376
6,13
0 1,
088
565
263
750
907
490
296
1,06
4 96
5 2,
128
11,9
57
7,13
9
Tol
,,1R
even
ue
68.
662
7s
1,21
3 45
3 '1
6
40'
8,12
0 6,
865
70
19
11,6
14
8,59
9 11
,472
10
,574
21
5,44
9 19
5,92
6 25
,228
1
4,3
94
5A
32
6,48
4 28
,512
18
,376
3,
791
3,84
4 65
,407
64
.450
37
5,09
3 32
9,53
1
GCl
in { (
Loss
) on
Dis
posa
l (6
6)
(683
) (I
) (3
) (1
75)
(1,5
15)
(96)
(1
,028
) (7
97)
(6,5
31)
(76)
(i
,00
9)
(146
) (5
68)
(181
) (6
93)
(47)
(3
31)
(64)
(5
03)
{1,6
69>
(1
3,O
64)
oa
er
Gai
ns{ (
Loss
es)
Net
Cos
t of
Ser
vice
s
Gov
ernm
entc
cmrc
uso
ns
(165
)
176,
103
(322
)
174,
954
(1
2,15
7
(3)
2,32
4
(173
)
156,
319
(169
) (3
75)
159,
756
113,
156
(141
)
126,
418
{3,1
72}
751.
129
(1,1
85)
699,
368
[460
100,
Q11
(99)
133,
982
(148
)
152,
158
(152
)
140,
069
(417
)
126,
525
(183
)
140,
647
(51)
74,0
43
(398
)
74
29
5
(102
)
49,6
59
(776
(S
,084
1
48,3
58
1.70
1,46
1
1,6
76
,30
3
13,il
261
1,70
0.19
1
1,63
9,73
7
RE
SU
LT F
OR
TH
E Y
EA
R
125,
156J
16
0,45
4)
Ser
vice
Gro
upst
atem
ents
focu
son
the
keym
easu
res
Drs
ervi
cede
liver
yper
form
ance
.
• T
hena
me
and
purp
ose
ofea
chse
rvic
e9r
oup
issu
mm
aris
edin
Not
e18
.
The
SeM
CI:!
Gro
upS
tate
men
tuse
s sr
ansu
cer
data
1031
Dec
embe
r200
910
encc
are
the
curr
entp
erio
d'sfi
nill
1~ia
l m
form
atio
non
expe
nses
and
reve
nue
toea
chse
rvic
egr
oup.
No
chan
ges
have
occ
urre
ddu
ring
the
perio
d be
twee
n1
Janu
ary
201°a
nd 3
0 Ju
ne20
10 w
hich
WO
Uld
'mat
eria
llyIm
pacl
ltlis
enc
ceec
n.

Syd
ney
Wes
t A
rea
Hea
lth S
ervi
ce
Ser
vice
Gro
up S
tate
men
ts (
Con
tlnu
lldJ
fo
r th
e Y
ear
End
ed 3
0 Ju
ne 2
010
SER
VIC
E'S
ASS
ET
S A
ND
LIA
BIL
ITIE
S
Ser
vice
Gro
up
1.1
~
Ser
vice
Gro
up
1>
• S
ervi
ce G
roup
1.3
~
serv
ice
Gro
up
2.1
~
Ser
vice
Gro
up
2.2
Ser
vice
Gro
up
2.3
Ser
vice
Gro
up
3.1
~
Ser
vice
Gro
lolp
4.1
serv
ice
Gro
up
5.1
~
Ser
vice
Gro
up
'.1
Tot
al
ASS
ET
S
Cur
rent
Ass
ets
Cas
h an
d C
ash
Equ
ival
ents
Rec
eiva
bles
Inve
ntor
ies
Oth
er F
inan
cial
Ass
ets
Non
-Cur
rent
Ass
ets
Hel
d ro
r Sal
e
Tot
al C
urre
nt A
sset
s
Non
-Cur
rent
Ass
ets
gece
vaue
s
Oth
er F
inan
cial
Ass
ets
Prop
erty
, Pla
nt a
nd E
quip
men
l
. Lan
d an
d B
uild
ings
-Pl
ant a
nd E
quip
men
t
-lnt
rast
ruci
ure
Syst
ems
Inta
ngib
leA
sset
s
Tot
al N
on-C
urre
nt A
sset
s
TO
TA
LA
SSE
TS
LIA
BIL
ITIe
S
CU
rTen
tLia
bilit
ies
Pay
abie
s
Bor
row
ings
Prov
isio
ns
Oth
er
Tot
al C
urr
ent
Lia
bili
ties
Non
-Cur
rent
LIa
bili
ties
Bor
row
ings
Prov
isio
ns
Tot
al N
on-C
urre
nt L
labl
lilill
s
TO
TA
L L
1AB
ILrf
IES
NE
T A
SSE
TS
2010
20
09
2010
20
09
2010
20
09
2010
20
09
2010
20
09
2010
20
09
2010
20
09
2010
20
09
2010
20
09
2010
20
09
2010
20
09
$000
$0
00
5000
$0
00
$000
$0
00
$000
$0
00
$000
$0
00
$000
$0
00
$000
$0
00
$000
SO
OO
$000
$0
00
$000
$0
00
$000
$0
00
8,67
3 B
,010
10
5 19
7,
901
8,02
8 5,
853
4,03
9 45
,383
17
,545
5.
879
5,24
9 7,
416
8,15
2 7,
281
7,40
2 3,
665
1,97
9 49
,895
48
,731
14
1,B
51
109,
154
1,13
4 1,
349
10
4 1.
622
1,68
8 1,
603
2,06
9 30
,099
38
,330
3,
524
2,61
7 75
9 1,
275
3,98
3 3,
597
530
756
9,13
8 12
,695
52
,402
64
,580
925
658
17
6 1,
308
1,01
0 66
5 67
6 10
,444
7,
979
1.61
9 1,
428
749
450
666
714
469
337
754
445
18,0
58
13,9
07
35
32
24
165
24
30
30
ts
22
397
4,56
8 4,
568
10,7
67
10,0
17
132
31
10,8
63
10,7
26
8,36
5 6,
986
86,1
11
63,8
54
11,0
46
9,49
4 8,
954
9,87
7 16
,730
11
,713
4,
699
3,07
2 59
,609
61
,871
21
7,27
6 18
7,64
1
I(~::
M'~X1tJY~~~w'~;~~~~~~~~~~~~!f!W.2f~~~~'R~~~f~~[1~~~~:i.~~f~iH!i:~::F~
15
8 ',1
1 1
225
214
223
262
4,18
0 4,
659
489
357
105
162
553
456
74
96
1,26
9 1.
610
7,27
7 8,
187
255
3 23
2 17
2 1.
331
172
217
214
107
159
2,86
2
Ijj;"",,
","Rr~
""")~*,1iiF'@"
a...~~
~!fJiiil1t!i\i~~
~;iJ~@I
~lJtilliit"ii
iR,ijjI
Jl ikiJr~i!,';~
~~
ij~~1!i
~,k:1
65
,076
13
2,23
0 41
0 50
7 13
1,88
7 14
1,38
4 72
,028
84
,416
60
0,23
5 5Z
3,43
5 56
,910
75
,788
18
5,24
7 14
2,04
8 13
8,09
9 10
3,75
31
35,1
22
49,5
80
49,2
48
75,2
62
1,31
2,06
2 1,
328,
361
5,86
0 11
,351
37
44
11
,858
12
,137
6,
485
7,24
6 54
,041
44
,932
5,
124
6,50
4 9,
868
7,30
2 12
,253
8,
908
3,16
2 4,
256
4,43
4 8,
480
113,
120
109,
138
1,38
5 2,
661
9 10
2,
801
2,84
5 1,
532
1,89
9 12
,767
10
,532
1,
210
1,52
5 2,
331
1,71
2 2,
895
2,08
8 74
7 99
8 1,
047
1,51
2 26
,724
25
,582
451
462
3 2
913
494
499
295
4,16
2 1,
830
395
265
760
297
944
363
244
173
341
263
8,71
2 4,
444
73,1
85
146,
875
463
563
147,
714
157,
074
8(1,
939
93,9
18
676,
716
585,
588
64,3
00
84,4
19
178,
528
151,
519
152,
958
115,
566
39,4
56
55,1
03
56,4
98
85,1
07
1,47
0,75
7 1,
475,
732
83,9
52
156.
892
595
594
15
8,5
n
167,
800
89,3
04
100,
904
762,
827
649,
442
75,3
46
93,9
13
187,
482
161,
396
169,
688
127,
279
44,1
55
58,1
75
116,
107
146,
978
1,68
8,03
3 1,
663,
373
'1",
~"''
''·1
tjj'
i''~
i.l\
'l~i
IlI_
'' ~"~.~"~~~ml&'l_'ll~~~~~~~l
~.IW
~
~~~
~"IIIf!B~_~~~~~~
7,
323
6,48
2 13
2 80
10
,344
9,
947
8,99
2 8,
852
82,5
62
78,8
11
12,7
98
14,0
75
5,92
4 4,
437
8,65
9 7,
036
3,86
4 3,
322
5,98
0 4,
384
142,
758
137,
008
2,80
4 1,
457
34
19
2,55
4 1,
345
1,89
2 1,
095
14,6
72
7.15
2 1,
901
1,18
8 2,
398
1,17
5 2,
354
1,27
5 1,
185
624
1,75
4 89
8 31
,548
18
,226
34,5
76
33,2
62
360
334
32,2
15
29,8
16
24,9
68
24,4
70
146,
828
125,
125
15,7
15
19,8
90
34,0
38
31,5
24
30,2
50
30,5
2.
18,7
36
16,0
48
24,2
56
23,7
01
359,
948
334,
291
162
187
'2
'2
149
173
110
141
854
918
',11
152
140
151
137
164
69
80
102
115
1.83
6 2,
083
44,8
65
41,3
88
528
435
45,2
62
41,0
83
33,9
62
34,3
58
244,
916
211,
806
30,5
25
35,1
03
42,5
00
37,2
87
39,6
00
38,9
96
21,8
56
20,0
72
32,0
74
29,0
78
536,
088
489,
606
!f1i!f1
il S'R
_ ~
_1
I!i!i
!ilII
I_!!
iI!B
!!II
I!
-!!
!_!I
!!II
i!!lI!
i!lII
I!iI~
IIlII!
!lI!ll
IlI!II
IlIi _
~~
i!R~~
!ii\W
;;,?,
£'i
2,26
0 3,
208
26
42
2,07
5 2,
980
1,53
9 2,
412
11,9
31
15,7
64
1,54
8 2,
616
1,95
0 2,
590
1,91
4 2,
809
963
1,37
5 1,
427
1,98
1 25
,853
35
,757
2,69
3 2,
372
26
24
2,50
9 2,
112
1,94
5 1,
745
11,4
36
8,92
1 1,
224
1,40
4 2,
651
2,24
8 2,
356
2,17
6 1,
304
1,14
4 1,
889
1,68
9 28
.035
23
,835
4,97
3 5,
580
56
66
4,58
4 5,
072
3,48
4 4,
157
23,3
67
24,6
85
2,77
0 4,
020
4,60
1 4,
838
4,27
0 4,
985
2,26
7 2,
519
3,31
6 3,
670
53,6
88
59,5
92
49,8
38
46,9
68
584
501
49,5
46
46,1
55
37,4
46
38,5
15
268,
283
236,
491
33,2
95
39,1
23
47,1
01
42,1
25
43,8
70
43.9
81
24,1
23
22,5
91
35,3
90
32,7
48
589,
776
549,
198
34,1
14
109,
924
" 93
10
8,73
1 12
1,64
5 51
,858
62
,389
49
4,54
4 41
2,95
1 42
,051
54
,790
14
0,38
1 11
9,27
1 12
5,81
8 83
,298
20
,032
35
,584
80
,717
11
4,23
0 1,
098,
257
1,11
4.17
5
The
nar
ne a
nd p
urpo
se o
f eac
h se
race
gro
up I
ssum
mar
ised
In
Nol
e 18
Ass
ets
and
liabi
litie
s th
ai a
re s
pecl
tc t
o se
oce
gro
ups
are
aacc
arec
acc
ordi
ngly
,e.g
, N
on-C
urre
nt A
sset
s H
eld
for s
ale.
Rem
aini
ng a
sset
s an
d lia
bHW
es a
re a
ppor
tione
d 10
serv
ice
grou
ps I
n ac
cord
ance
with
lhe
met
hodo
logy
adv
ised
In
Nol
e 2{
ee),
ther
eby
enSI
Jrin
g th
allh
e be
nefi
t of e
ach
asse
t an
d th
e ua
ouue
e In
curr
ed In
th
e pr
ovis
ion
of se
rvic
es a
re d
uly
reco
gnks
ed in
eac
h se
rvic
e gr
oup.
2
Sydney West Area HealthService Notesto and forming part 01the FinancialStatements
for the Year Ended 30 June 2010
The Health Service Reporting Entity
The Sydney West Area Health Service was established under the provisions of the Health Ssrvlces Act with eHect from 1 January 2005.
The Health Service, as a reporting entny, comprises all the operating activities of the Hospital facilities and the Community Health Centres under its control. II also encompasses the Special Purposes and Trust Funds which, while containing assets which are restricted for specllled uses by the grantor or the donor, are nevertheless controlled by the Health Service. The Health Service is a not-for-profit entity (as profit is nol its principal objective).
The Sydney Wesl Area Health Service Special Purpose Service Entily was established as a Division of the Government Service on 17 March 2006 in accordance with the Public Sector Employment and Management Act 2002 and the Health Services Act 1997. These Divisions provide personnel services to enable a Health Service to exercise its functions.
As a consequence the values in the annual financial statements presented herein consist of the Health Service (as the parent entity), the financial statements of the special purpose entity division and the consolidated financial statements of the economic entity. Noles capture both Ihe parent and consolidated values with notes 3,4,13,29,31 and 36 being especially relevant.
In the process of preparing Ihe consolidated financial statements for the economic entity consisting of the controlling and controlled entities, all inter-entity transactions and balances have been eliminated.
The reporting entltyis consolidated as part of the financial statements prepared lor both the NSW Department of Health and the NSW Total State Sector Accounts.
These consolidated financial statements for the year ended 30 June 2010 have been authorised lor issue by the Chief Executive on 27 September 201O.
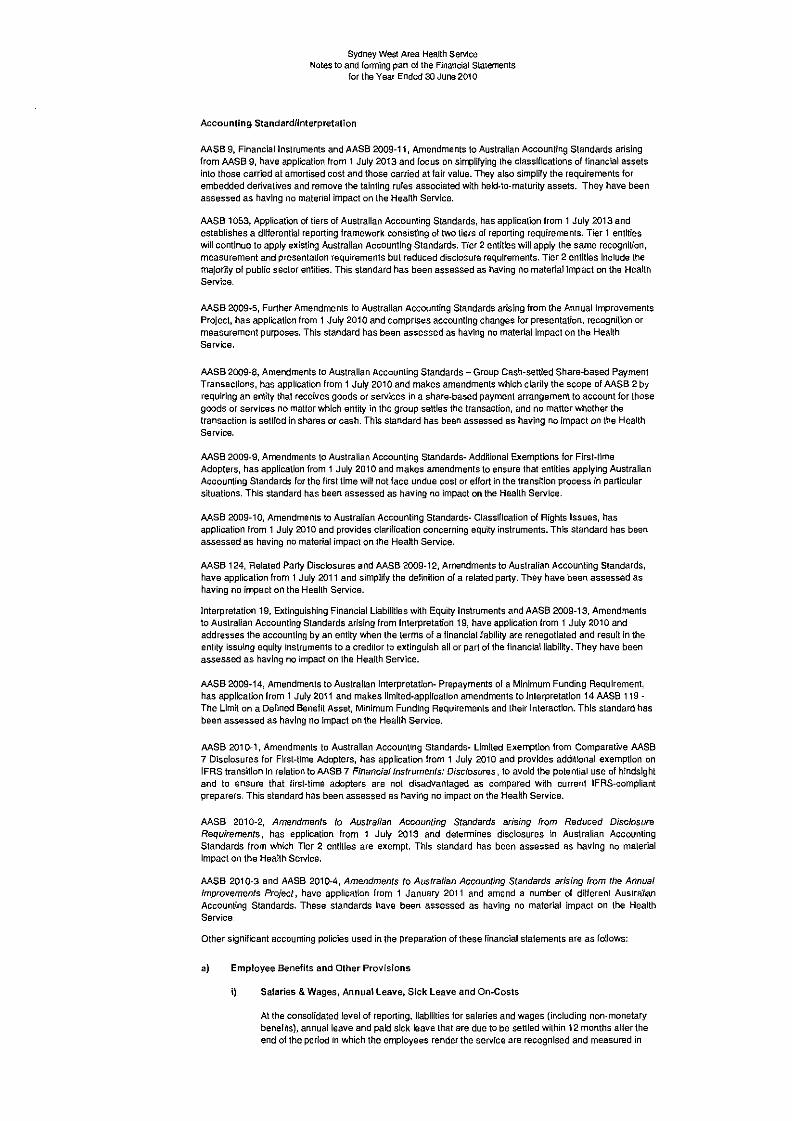
Summary of Significant Accounting Policies
The Health Service's financial statements are general purpose financial statements which have been prepared in accordance with applicable Australian Accounting S1andards (which include Australian Accounting Interpretations), the requirements of the Health Services Act 1997 and its regulations including observation of the Accounts and Audit Determination tor Area Health Services and Public Hospitals.
Property, plant and equipment, investment property, assets (or disposal groups) held for sale and financial assets at "fair value through prollt and loss" and available for sale are measured at Ialr value. Other financial statement items are prepared in accordance with the historical cost convention.
The consolidated entity has a deficiency of working capital of $318.812 million (2009 $301.965 million). Notwithstanding this deficiency the financial statements have been prepared on a going concern basis because the entny has the support of the New South Wales Department of Health.
All amounts are rounded to the nearest one thousand dollars and are expressed in Australian currency.
Judgments, key assumptions and estimations made by management are disclosed in the relevant notes to the financial statements.
Except when an Australian Accounting Standard permits or requires otherwise, comparative information is disclosed in respect of the previous period for all amounts reported in the financial statements.
No new or revised accounting standards or interpretations are adopted earlier than their prescribed date of application. Set out below are changes to be eHeeted, their date of application and the possible impact on the financial statements of the Sydney West Area Health Service.
SydneyWest Area HealthService Natesto and forming part of the Financialstatements
for the Year Ended 30 June 2010
Accounting Standard/Interpretation
AASB g, Financial Instruments and AASB 2009-11, Amendments to Australian Accounting Standards arising from AASB g, have application from 1 July 2013 and focus on simplifying the classifications of financial assets into those carried at amortised cost and those carried at fair value. They also simplify the requirements for embedded derivatives and remove the tainting rules associated with held-to-maturity assets. They have been assessed as having no matertal impact on Ihe Hearth Service.
AASB 1053, Application of tiers of Australian Accounting Standards, has appllcatlon from 1 July 2013 and establishes a diHerenl\al reporting framework consisting ot two tiers 01 reporting requirements. Tier 1 entities will continue to apply existing Australian Accounting Standards. Tier 2 entities will apply the same recognition, measurement and presentation requirements but reduced disclosure requirements. Tier 2 entities include the majority of public sector entities. This standard has been assessed as having no material impact on the Health Service.
AASB 2009·5, Further Amendments to Australian Accounting Standards arising from the Annual Improvements Project, has application from 1 July 2010 and comprises accounting changes lor presentation, recognition or measurement purposes. This standard has been assessed as having no material impact on the Health Service.
AASB 2009-8, Amendments to Australian Accounting Standards - Group Cash-settled Share-based Payment Transactions, has application from 1 July 2010 and makes amendments which clarity the scope of AASB 2 by requiring an enlity thaI receives goods or services in a share-based payment arrangement to account for those goods or services no matter which entity in the group settles the transaction, and no matter whether the transaction is settled in shares or cash. This standard has been assessed as having no impact on \he Health Service.
AASB 2009-9, Amendments to Australian Accounting Standards- Additional Exemptions for Flrst-tlme Adopters, has apollcatlon from 1 July 2010 and makes amendments to ensure that entitles applying Australian Accounting Standards for the first time will not face undue cost or effort in the transition process in particular situations. This standard has been assessed as having no impact on the Health Service.
AASB 2009-10, Amendments to Australian Accounting Standards- Classification of Rights Issues, has application from 1 July 2010 and provides c1aritication concerning equity instruments. This standard has been assessed as having no material Impact on the Health Service.
AASB 124, Belated Party Disclosures and AASB 2009·12, Amendments to Australian Accounting Standards, have application from 1July 2011 and simplify the de1inition of a related party. They have been assessed as having no impact on the Health Service.
Interpretation 19, Extinguishing Financial Liabilities with Equity Instruments and AASB 2009-13, Amendments to Australian Accounting Standards arising from Interpretation 19, have application from 1 JuLy 2010 and addresses the accounting by an entity when the terms of a financial liability are renegotiated and result in the entity issuing equity instruments to a creditor \0 extinguish all or part of the financial liability. They have been assessed as having no impact on the Health Service.
AASB 2009·14, Amendments to Australian Interpretation- Prepayments of a Minimum Funding Requirement, has application from 1 July 2011 and makes limited-application amendments to Intercretatlon 14 AASB 11g The Limit on a Defined Benefit Asset, Minimum Funding RequiremenLs and their Interaction. This standard has been assessed as having no impact on the Health Service.
AASB 2010-1, Amendments to Australian Accounting Standards- Limited Exemption from Comparative AASB 7 Disclosures for First-time Adopters, has application lrom 1 July 2010 and provides additional exemption on IFRS transition in relation to AASB 7 Financiallnstrumenfs: Disclosures, 10avoid the potential use of hindsight and to ensure that tlrst-Hrne adopters are not disadvantaged as compared with current IFRS-compliant preparers. This standard has been assessed as having no impact on the Health Service.
AASB 2010-2, Amendments 10 Australian Accounting Standards arising (rom Reduced Disclosure Requirements, has eppllcatlon from 1 July 2013 and determines disclosures in Australian Accounling Standards from which Tier 2 entities are exempt. This standard has been assessed as having no male rial impact on the Health Service.
AASB 2010-3 and AASB 2010-4, Amendments to Australian Accounting Standards arising (rom the Annual Improvements Project, have application from 1 January 2011 and amend a number of diHerenl Australian Accounling Standards. These standards have been assessed as havlnq no material impact on the Health Service
Other significant accounting policies used in Ihe preparation of these financial statements are as follows:
a) Employee Benefits and Other Provisions
i) Salaries & Wages, Annual Leave, Sick Leave and On-Costs
At the consolidated level of reporting, liabilities for salaries and wages (including non-monetary benefits), annual leave and paid sick leave that are due to be settled wlthln 12 months after the end of the period in which the employees render the service are recognised and measured in

Sydney Weffi Area Health Service Notes to and forming part of the Financial Statements
ror the Year Ended 30 June 2010
respect at employees' services up 10 the reporting date at undlsccunted amounts based on the amounts expected to be paid when the liabilities are settled.
All Annual Leave employee benefits are reported as "Current" as there is an unconditional right to payment. Ourrentllabuhles are then further classified as "Short Term" or "Long Term" based on past trends and known resignations and retirements. Anticipated payments to be made in the next twelve months are reported as "Short Term". On-costs 0117% are applied 10the value of leave payable at 30 June 2010, such on-costs being consistent with actuarial assessment (Comparable on-costs for 30 June 2009 were also 17%).
Unused non-vesting sick leave does not give rise to a liabilily as h is not considered probable that sick leave taken in the future will be greater than the benefits accrued in the future.
The outstanding amounts 01 workers' compensation insurance premiums and fringe benefits tax, which are consequential to employment, are recognised as liabilities and expenses where the employee benefits to which they relate have been recognised.

Sydney West Area Health Service Notes to and forming part of the Financialstatements
for the Year Ended 30 June 2010
ii) Long Service Leave and Superannuation
At the consolidated level of reporting, long service leave entitlements are dissected as "Current" if there is an unconditional right to payment and "Non-Current" if the entitlements are conditional. Current entitlements are further dissected between "Short Term" and "Long Term" on the basis of anticipated payments for the next twelve months. This in turn is based on past trends and known resignations and retirements.
Long service leave provisions are measured on a short hand basis at an escalated rate of 18.3% (9.8% at ac June 2009) for all employees with five or more years of service. The escalarlon applied is consistent with actuarial assessment and is affected in the main by the fall in the Commonwealth Government 10 year bond yield which is used as the discount rate.
The Health Service's liability for the closed superannuation pool schemes (State Authorities Superannuation Scheme and State Superannuation Scheme) is assumed by the Crown Entity. The Health Service accounts for the liability as having been extinguished resulting in the amount assumed being shown as part of the non-monetary revenue ilem described as "Acceptance by the Crown Entity of Employee Benefits". Any liability attached to Superannuation Guarantee Charge cover is reported in Note 21, "Payables".
The superannuation expense for the financial year is determined by using the formulae specified by the NSW Department of Health. The expense for certain superannuation schemes (e Basic Benefit and First State Super) is calculated as a percentage of the employees' salary. For other superannuation schemes (le State Superannuation Scheme and State Authorities Superannuation Scheme), the expense is calculaled as a multiple of the employees' superannuation contributions.
iii) Other Provisions
Other provisions exist when: the Health Service has a present legal or constructive obligation as a result of a past event; it is probable that an outflow of resources will be required to settle the obligation; and a reliable ostimate can be made of the amount of the obligation.
b) Insurance
The Health Service's insurance activities are conducted through the NSW Treasury Managed Fund Scheme of self insurance for Government Agencies. The expense (premium) is determined by the Fund Manager based on past claim experience.
c) Finance Costs
Finance costs are recognised as expenses in the period in which they are incurred, in accordance with the Department's Mandate to not-for-profit general government sector agencies.
d) Income Recognition
Income is measured at the fair value of the consideration or contribution received or receivable. Additional comments regarding the accounting policies for the recognition of revenue are discussed below.
Sale of Goods
Revenue from the sale of goods is recognised as revenue when the agency transfers the significant risks and rewards of ownership of the assets.
Rendering of Services
Revenue from the rendering of services is generally recognised as revenue when the service is provided.
Patient Fees
Patient Fees are derived from chargeable inpatients and non-inpatients on the basis of rates specified by the NSW Department of Health from lime to time.
Investment Revenue
Interest revenue is recognised using the effective interest method as set out in AASB139, Financial Instruments: Recognition and Measurement. Rental revenue is recognised in accordance wi\h AASB117 Leases on a straight line basis over the lease term. Dividend revenue is recognised in accordance with AASB118 Revenue when the Health Service's right to receive pay men! is established.
Royalty revenue is recognised in accordance with AASB118 on an accrual basis in accordance with the substance of the relevant agreement.
Debt Forgiveness

SydneyWest Area Health Service Notes to and forming part of the Finandal Statements
tor the Year Ended 30 June 2010
Debts are accounted for as extinguished when and only when settlement occurs through repayment or replacement by another liability.
Use of Hospital Facilities
Specialist doctors with rights of private practice are subject to an infrastruclure charge for the use of hospital tacuhles al rates determined by the NSW Department 01 Health. Charges consist of two components:
a monthly charge raised by the Health Service based on a percentage of receipts generaled the residue 01the Private Practice Trust Fund at Ihe end of each financial year, such sum being credited for Health Service use in the advancement ot the Health Service or individuals within it.
Use of Outside Facilities
The Health Service uses a number 01facilities owned and maintained by the local authoritlea in the area 10deliver community health services for which no charges are raised by (he authorities. It is not practical to estimate the related values.
Grants and Contributions
Grants and Contributions are generally recognised as revenues when the Health Service obtains control over the assets comprising the contributions. Control over contributions is normally obtained upon the receipt of cash.
NSW Department ofHealth Allocations
Payments are made by the NSW Department of Health on the basis of the allocation for the Health Service as adjusted for approved supplementations mostly for salary agreements, patient flows between Health Services and approved enhancement projects. This allocation is included in the Statement of Comprehensive Income before arrivlng at the "Result for the Year" on the basis that the allocation is earned in return for the health services provided on behalf of the Department. Allocations are normally recognised upon the receot of Cash.
General operating expenses/revenues of Lottie Stewart, SI Joseph's Hospital and Tresillian Family Care Centre Penrlth (Affiliated Health Organisations) have only been included in the Statement of Comprehensive Income prepared to the extent of the cash payments made to the Health Organisations concerned. The Health Service is not deemed to own or control the various assets/liabilities of the aforementioned Health Organisations and such amounts have been excluded from the Statement ot Financial Position. Any exceptions are specifically listed in the notes that follow.
e) Accounting forthe Goods & Services Tax (GST)
Income, expenses and assets are recognised net of the amount of GST, except that:
the amount of GST incurred by the Health Service as a purchaser that is not recoverable from the Australian Taxation Office is recognised as part of the cost ot acquisition of an asset or as part of an item of expense and
receivables and payables are stated with the amount of GST included.
Cash flows are included in the Statement of Cash Flows on a gross basis. However, (he GST components of cash flows arising from investing and financing activities which is recoverable from, or payable to, the Australian Taxaucn Office are classified as operating cash flows.
f) Inter Area and Interstate Patient Flows
Inter Area Patient Flows
Health Services recognise patient flows tor patients they have treated that live outside the Service's regional area. The flows recognised are for acute inpatients (other then Mental Health Services), emergency and rehabilitation and extended care.
Patient flows have been calculated using benchmarks for the cost of services for each 01 the categories identified and deducting estimated revenue, based on the payment category of the patient. The flow information is based on activity for the last completed calendar year. The NSW Department of Health accepts that category identification for various surgical and medical procedures is impacted by the complexities of the coding process and the interpretalion 01 the coding staff when coding a patient's medical records. The Department reviews the flow information extracted from Health Service records and once it has accepted it, requires each Health Service and the Children's Hospital at Westmead to bring 10account the value 01patient flows in accordance with the Departrrem's assessment.
The adjustments have no effect on equity values as the movement in Net Cost of Services is matched by a corresponding adjustment to the value of the NSW Department of Health Recurrent Allocation.
Inter State Patient Flows
Sydney West Area Health Service Noles 10 and forming part of the Financial Statements
for lhe Year Ended 30 June 2010
HealthServices recognise Ihe outflow of acute inpatients (hat are treated by other States and Territories within Australia who normally reside in the Service's residential area. The Health Services
also recognise the value of inflows for acute inpatient treatment provided to residents from other Slates and territories. The expense and revenue values reported within the financial statements have been based on 2008/09 activity data using standard cost weighted separation values to reflect estimated
costs in 2009/10 for acute weighted inpatient separations. Where treatment is obtained outside the home health service, the StatefTerritory provldlnq the service is reimbursed by the benefiting Area.
The reporting adopted for both lmerarea and interstate patient flows aims to provide a greater accuracy
of the cost of service provtetonto the Area's resident population and disclose the extent to which service is provided to non-residents.
The composition of patient flow expense/revenue is disclosed in Noles 5 and 11.
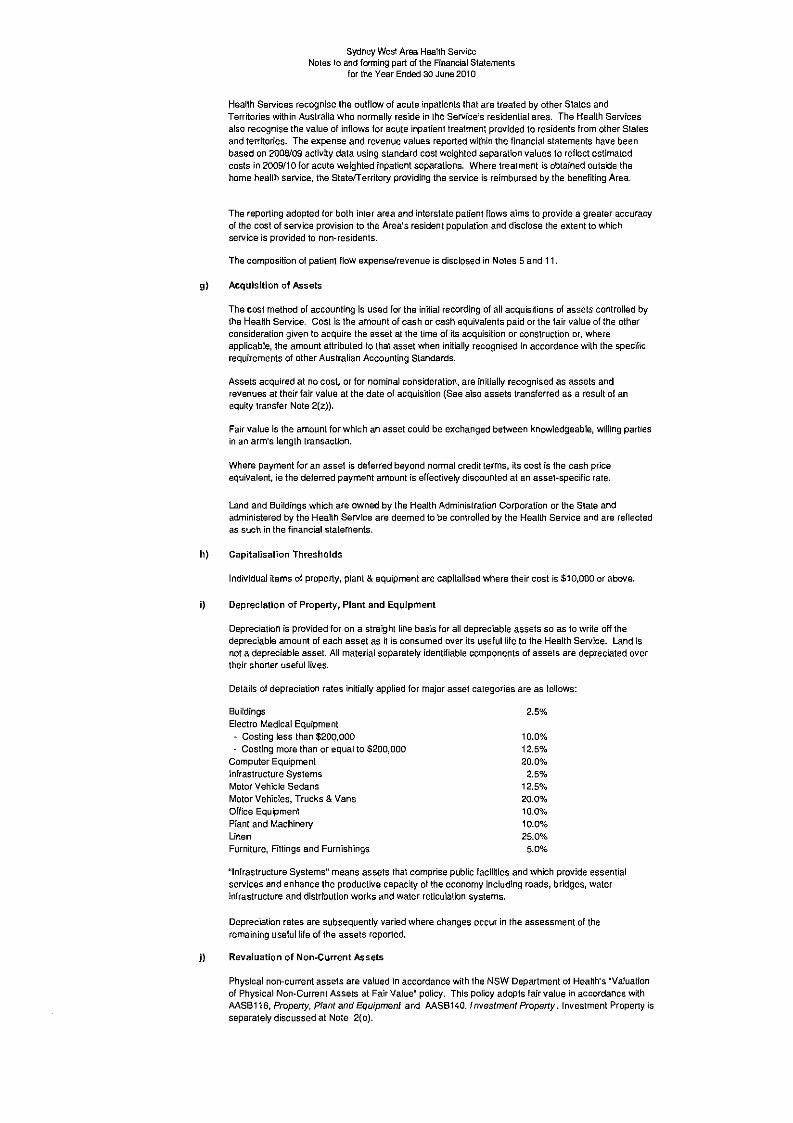
g) Acquisition of Assets
The cost method of accounting is used for the initial recording of all acquisitions of assets controlled by the Health Service. Cost is the amount of cash or cash equivalents paid or the fair value of the other consideration given to acquire the asset at the time of its acquisition or ccnstructon or, where
applicable, the amount attributed to that asset when initially recognised in accordance with the speclhc requirements of other Australian Accounting Standards.
Assets acquired at no cost, or for nominal consideration, are initially recognised as assets and revenues at their fair value at the date of acquisition (See also assets transferred as a result of an equity transfer Note 2(z)).
Fair value is the amount for which an asset could be exchanged between knowiedgeable, Willing parties in an arm's length transaction.
Where payment for an asset is deferred beyond normal credit terms, its cost is the cash price equivalent, ie the deferred payment amount is effectively discounted at an asset-specfflc rate.
Land and Buildings which are owned by the Health Administration Corporation or the State and administered by the Health Service are deemed to be controlled by the Health Service and are reflected as such in the financial statements.
h) Capitalisation Thresholds
Individual items of property, plant & equipment are capitalised where their cost is $10,000 or above.
i) Depreciation of Property, Plant and Equipment
Depreciation is provided for on a straight line basis for all depreciable assets so as to write off the
depreciable amount of eachasset as it is consumed over its useful life to the Health Service. Land is not a depreciable asset. All material separately identifiable components of assets are depreciated over their shorter useful lives.
Details of depreciation rates initially applied for major asset categories are as touows:
Buildings 2.5%
Electro Medical Equipment
- Costing less than $200,000 10.0% - Costing more than or equal to $200,000 12.5%
Computer Equipment 20.0% Infrastructure Systems 2.5% Motor Vehicle Sedans 12.5%.
Motor Vehicles, Trucks & Vans 20.0%
Office Equipment 10.0%
Plant and Machinery 10.0%
Linen 25.0%
Furniture, Fillings and Furnishings 5.0%
"Infrastructure Systems" means assets that comprise public facilities and which provide essential services and enhance the productive capacity 01 the economy including roads, bridges, water
infrastructure and distribution works and water retlculatlon systems.
Depreciation rates are subsequently varied where changes occur in the assessment of the
remaining uselullife of the assets reported.
j) Revaluation of Non-Current Assets
Physical non-current assets are valued in accordance with the NSW Department of Health's "Valuation of Physical Non-Current Assets at Fair Value" policy. This policy adopts fair value in accordance with AASB116, Property, Plant and Equipment and AASB140, f nvestment Property. Investment Property is
separately discussed at Note 2(0).
Sydney West Area Health Service Notes to and forming part of the FinancialStatements
for the Year Ended 30 June 2010
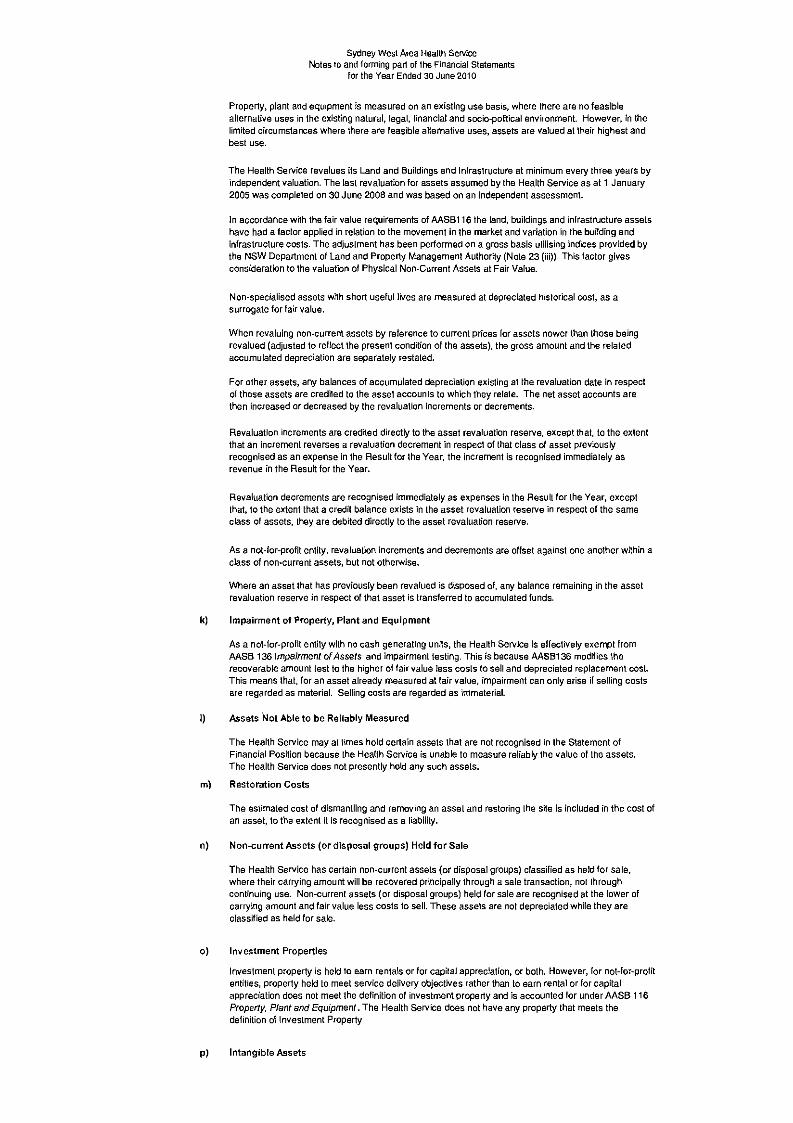
Property, plant and equipment is measured on an existing use basis, where there are no feasible alternative uses in the existing natural, legal, financial and soclo-pojtlcal environment. However, in the limited circumstances where there are feasible alternative uses, assets are valued at their highest and best use.
The Health Service revalues its Land and Buildings and Infrastructure at minimum every three years by independent valuation. The last revaluation for assets assumed by the Health Service as at 1 January 2005 was completed on 30 June 2008 and was based on an independent assessment
In accordance with the fair value requirements of AASB116 the land, buildings and mrrastructure assets have had a factor applied in relation to the movement in the market and variation in the building and infrastructure costs. The adjustment has been performed on a gross basis utilising indices provided by the NSW Department of Land and Property Management Authority (Note 23 (iii». This factor gives consideration to the valuation of Physical Non-Current Assets at Fair Value.
Non-specialised assets with short useful lives are measured at depreciated historical cost, as a surrogate for lair value.
When revaluing non-current assets by reference to current prices for assets newer than those being revalued (adjusted to reflect the present condition of the assets), the gross amount and the related accumulated depreciation are separately restated.
For other assets, any balances of accumulated deprecaucn existing at the revaluation date in respect 01 those assets are credited to the asset accounts to which they relate. The net asset accounts are then increased or decreased by the revaluation increments or decrements.
Revaluation increments are credited directly to the asset revaluation reserve, except that, to the extent that an increment reverses a revaluation decrement in respect of that class of asset previously recognised as an expense in the Result for the Year, the increment is recognised immediately as revenue in the Result for the Year.
Revaluation decrements are recognised immediately as expenses in the Result for the Year, except that, to the extent that a credit balance exists in the asset revaluation reserve in respect of the same class of assets, they are debited directly to the asset revaluation reserve.
As a not-lor-profit entity, revaluation increments and decrements are offset against one another w~hin a class of non-current assets, but not otberwtse.
Where an asset that has previously been revalued is disposed of, any balance remaining in the asset revaluation reserve in respect of that asset is transferred to accumulated funds.
k) Impairment of Property. Plant and Equipment
As a not-lor-profit entity with no cash generating units, the Health Service is effectively exempt from AASB 136 Impairment ofAssets and impairment testing. This is because AASB136 modifies \he recoverable amount test to the higher of fair value less costs to sell and depreciated replacement cost. This means that, for an asset already measured at fair value, impairment can only arise if selling costs are regarded as material. Selling costs are regarded as immaterial.
I) Assets Not Able to be Reliably Measured
The Health Service may at limes hold certain assets that are not recognised in the Statement of Financial Position because the HeaUhService is unable to measure reliably the value of the assets. The Health Service does not presently hold any such assets.
m) Restoration Costs
The estimated cost of dismantling and removing an asset and restoring the site is included in the cost of an asset, to the extent it is recognised as a liability.
n) Non-current Assets (or disposal groups) Held for Sale
The Health Service has certain non-current assets (or disposal groups) classified as held for sale, where their carrying amount will be recovered principally through a sale transaction, notlhrough continuing use. Non-current assets (or disposal groups) held for sale are recognised at the lower of carrying amount and fair value less costs to sell. These assets are not depreciated while they are classified as held for sale.
0) Investment Properties
Investment property is held to earn rentals or tor capital apprec'atron, or both. However, lor not-lor-profit entities, property held to meet service delivery objectives rather than to earn rental or for capital appreciation does not meet the definition of investment property and is accounted for under AASB 116 Property, Plant and Equipment. The Health Service does not have any property that meets the definition 01 Investment Property
p) Intangible Assets

Sydney West Area Health Service Notes to and forming part of the FinancialStatements
lor the Year Ended 30 June 2010
The Health Service recognises intangible assels only if it is probable that future economic benefits will flow to the Health Service and the cost ot the asset can be measured reliably. Inlangible assets are measured initially at cost. Where an asset is acquired at no or nominal cost, the cost is its fair value as at the dale of acquisition. All research costs are expensed. Development costs are only capitalised when certain criteria are met.
The useful lives of intangible assets are assessed to be finite.
Intangible assets are subsequently measured at fair value only if there is an active market. As there Is no active market for the Health Service's intangible assets, the assets are carried at cost less any accumulated amortisation.
Computer software developed or acquired by the Health Service are recognised as Intangible assels and are amortised over 5 years using the straight line method based on the useful life of the asset for both internally developed assets and direct acquisitions.
Intangible assets are tested for impairment where an indicator of Impairmenl exists. If the recoverable amount is less than its carrying amount the carrying amount is reduced to recoverable amount and the reduction is recognised as an impairment loss.
q} Maintenance
The costs of maintenance are charged as expenses as Incurred, except where they relate to the replacement 01a component of an asset in which case the costs are capitalised and depreciated.
r) Leased Assets
A distinction is made between finance leases whIch effectively transfer from tho lessor to the lessee substantially all the risks and benefits incidental to ownership of the leased assets, and operating leases under which the lessor effectively retains all such risks and benefits.
Where a non-current asset is acquired by means of a finance lease, Ihe asset is recognisod at its fair value at the commencement of the lease term. The corrospondlnq liability Is established at the same amount. Lease payments are allocated between the principal component and the interest expense.
Operating lease payments are charged to the Statement of Comprehensive Income in tho periods in which they are incurred.
s) Inventories
Inventories are stated at cost, adjusted when applicable for any loss of service potential. A loss of service potential is identified and measured based on the oxistence of a current replacement cost that is lower than Ihe carrying amount.
Obsolete items are disposed of in accordance with instructions Issued by the NSW Department of Health.

Sydney West Area Health Service Notes 10and forming part of the Financial Statements
for the Year Ended 30 June 2010
t) Loans and Receivables
Loans and receivables are non-derivative financial assets with fixed or determinable payments mat are not quoted in an active market. These financial assets are recognised initially at fair value, usually
based on the transaction cost or face value. Subsequent measurement is at amortised cost using the effective interest method, less an allowance for any impairment of receivables. Any changes are recognised in the Result lor the Year when impaired. derecognised or Ihrough the amortisation process.
Short-term receivables with no stated interest rate are measuroo atthe original invoice amount where the sttect of discounting is immaterial.
u) Investments
Investments are initially recognised at fair value plus, in the case of investments not al fair vatuo through profit or loss, transaction costs. The Sydney West Area Health Service determines the classification of its financial assets alter initial recognition and, when allowed and appropriate, reevaluates this at each financial year end.
Fair value through profit or loss - The Sydney West Area Health Service subsequently measures investments classified as "held for trading" or designated upon initial recognition "at fair value through profit or loss" at fair value. Financial assets are classified as "held lor trading" if they are acquired for the purpose of selling in the near tenn. Derivatives are also classified as held for trading. Gains or losses on these assets are recognised in the Result for the Year.
The Hour-Glass Investment facilities are designated at fair value through profit or loss using the second leg of the fairvalue option i.e. these financial assets are managed and their performance is evaluated on a fair value basis, in accordance with a documented risk management strategy, and lntcrmattcn about these assets Is provided intemauv on that basis to the agency's key management personnel.
The risk management strategy of the Health Service has been developed consistent with the investment powers granted under the provision of the Public Authorules (Financial Arrangements) Act. T Corp investments are made in an effort to improve interest returns on cash balances otherwise available whilst also providing secure investments guaranteed by the State market exposures.
The movement in the lair value of the Hour-Glass Investment facilities incorporates distributions received as well as unreanseo movements in fair value and is raported in the line item 'investment revenue'.
Held to maturity investments - Non-derivative financial assets with fixed or determinable payments and fixed maturity that the Sydney West Area Health Service has the positive intention and ability to hold to maturity are classified as "heto-to-matunty. These investments are measured at amortised cost using the effective interest method. Changes are recognised in the Result for the Year when Impaired, derecoqnlsed or through the amortisation process.
Available for Sale Investments - Any residual investments that do not fall into any other category are accounted For as Available for Sale Investments and measured at fair value in other comprehensive income until disposed or impaired. at which time the cumulative gain or loss previously recognised in other comprehensive income is recognised in the Result for the Year. However, interest calculated using the effective interest method and dividends are recognised in the Result for the Year.
Purchases or sales of investments under ccntracttbet require delivery of the asset wilhin the tlmeframe established by convention or regulation are recognised on the trade date; i.e. the date the Health Service commits to purchase or sell the asset.
The fair value of investments that are traded at fair value in an active market is deterrnmod by reference
to quoted current bid prices at the close of business on the Statement of Financial Position date.
v) Impairment offinancial assets
All financial assets, except those measured at fair value through profit and loss, are subloct to an annual review for impairment. An allowance for impairment is established when there is objective
evidence that the enlily will not be able to collect all amounts due.
For financial assets carried at amortised cost, the amount 01tho allowance is the difference between the asset's carrying amount and the present value ol estimated tuture cash flows, discounted at the effective interest rate. The amount of the impairment loss is recognised in the Result for the Year.
When an available for sale financial asset is impaired, the amount of the cumulative loss is removed from equity and recognised in lhe Result lor the Year, based on the difference between the acquisition cost (net of any principal repayment and amortisation) and current fair value, less any impairment loss
previously recognised in the Result for the Year.

Sydney West Area Health Service Notes [0 and forming part of the Financial Statements
for the Year Ended 30 June 201 0
Any reversals of impairment losses are reversed through the Result for the Year, where there is objective evidence, except reversals of impairment losses on an investment in an equity instrument classified as "available for sale" must be made Ihrough the reserve. Reversals of impairment losses of
financial assets carried at amortised cost cannot result in a carrying amount that exceeds what the carrying amount would have been had there not been an impairment loss.
w) De-recognition offinancial assets and financial liabilities
A financial asset is derecognised when the contractual rights to the cash flows from the financial assets expire; or it the Health Service transfers the financial asset
• where substantially all the risks and rewards have been transferred; or • where the Health Service has not transferred substantially all the risks and rewards, if the
entity has not retained control.
Where the Health Service has neither transferred nor retained substantially all Ihe risks and rewards or
transferred control, the asset is recognised to the extent of Ihe Health Service's continuing involvement In the asset.
A financial liability is derecognised when the obligation specified in the contract is disct1arged or
cancelled or expires.
x) Payebres
These amounts represent liabilities for goods and services provided to the Health Service and other amounts. Payables are recognised initially at fair value, usually based on the transaction cost or face value. Subsequent measurement is at amortised cost using the eltectlve interest method. Short-term payables with no stated interest rate are measured at tt1eoriginal invoice amount where the effect of
discounting is immaterial.
Payables are recognised for amounts to be paid in the future tor goods and services received, whether or not billed to the Health Service.
y) Borrowings
Loans are not held for trading or designated at lair value through profit or loss and are recognised at
amortised cost using the effective interest rate method. Gains or losses are recognised in ttte Result for the Year on derecognition.
The finance lease liability is determined in accordance with AASB 117, Leases.
z) Equity Transfers
The transfer of net assets between agencies as a result of an adminislraUve restructure, transfers of programs/functions and parts thereof between NSW public sector agencies is designated or required by
Accounting Standards to be treated as contributions by owners and is recognised as an adjustment to 'Accumulated Funds". This treatment is consistent wlth AASB1004, Contrib14ions and Australian Interpretation 1038 Contributions by Owners Made to Wholly-Owned Public Sector Entities.
Transfers arising from an administrative restructure lrwolvlnq not-for-profit entities and for-profit government departments are recognised at the amount at which the asset was recognised by the transferor immediately prior to the restructure. Subject to below, in most instances this will approximate
fair value.
All other equity transfers are recognised al fair value, except for intangibles. Where an intangible has
been recognised at (amortised) cost by the transferor because there is no active market. the agency recognises the asset at the transferor's carrying amount. Where the transferor is prohibited from recognising internally generaled intangibles, tile agency does not recognise that asset.

SydneyWest Area Health Service Notes to and forming part of the FinancialStatements
for the Year Ended 30 June 2010
aa) Equity and Reserves
(I) Asset Revaluation Reserve
The asset revaluation reserve is used to record increments and decrements on the revaluation of Non-Current Assets. This accords with the Health Service's policy on the revaluation of property, plant and equipment as discussed in Note 2m.
(ii) Accumulated Funds
The category "accumulated funds" includes all current and prior period retained funds.
(III) Separate Reserves
Separate reserve accounts are recognised in the financial statements only Ii such accounts are required by specific legislation or Australian Accounting Standards.
ab) Trust Funds
Tha Haalth Service receives monies in a trustee capacity for various trusts as set out in Note 32. As the Health Service performs only a custodial role in respect 01 these monies, and because lhe monies cannot be used for the achievement of the Health Service's own objectives, they are nol brought to account in the financial statements.
ac) Budgeted Amounts
The budgeted amounts are drawn from the budgets agreed with the NSW Health Department at the beginning of the financial reporting period and with any adjustments for the ettects of additional suoptamantatlcn provided.
ad) Service Group Statements Allocation Methodology
Expenses and revenues are assigned to service groups in accordance with statistical dala for the twelve months ended 31 December 2009 which is then applied to fhe current period's financial information. The same methodology is applied to attribute assets and liabilities to each service group.
In raspact of assets and liabilities the Department requires that all Health Services take action to identify those components that can be specifically identified and reported by service groups. Remaining values are attrbuted to service groups in accordance with values advised by the NSW Department 01Health, e.g. depreclatlorvamcrtlsatlon charges form the basis of apportioning the values for Intangibles and Property, Plant & Equipment.

2010
PARENT
$000
856,418
40,848
21,526 75,906
50,195
97,979 34-,140
10,586
_1~!?~~.
1,201,961
2:32,676
8,488 20,958
73,914
23,345
14,077
44,735 10,179
21,134
2,843
3,593
13,004 9,547
16,542
(2,379)
84,464
5,572
5,788
2,958
2,195
40,144
6,846
42,771
--_!q,~!-
694,043
2009
'5000
3.
4.
852,740 47,298
22,060
73,961
36,467
107,762
32,875
768
_1?,\~_~,!
1,186,182
5.
225,466
8,924 21,356 69,120
11,311
10,430
43,413
9,462 19,793
2,023 3,117
22,771
10,711 16,156
(1,559)
75,369
5,463
6,346
2,497
1,696
42,786
6.029
40,364
1q,_!_?~
663,192
Sydney West Area Health Service
Notes to and forming part of the Financial Statements
for the Year Ended 30 June 2010
Em ptcyee Related
Employee related expenses comprise the following:
Salaries and Wages
AwardS
Superannuation - Defined Benefit Plans
Superannuation - Delined ccououuco Plans
long Service leave
Annual leave Sick leave and Other leave
Redundancies
Workers Compensation Insurance
Personnel Services
Personnel Services comprise the purchase onne lollowing:
Salaries and Wages
Awards Superannuation- Defined Benelit Plans
Superannuation- Defined Contribution Plans
long Service leave
Annual leave
Sick leave and Other Leave
Redundancies
Workers' Compensation Insurance
Other oceraunn Expenses
Allocations towards Inter Area Patient Outflows, NSW (see (d) below)
Blood and Blood Producls
Domestic Supplies and Services
Drug Supplies Food Supplies
Fuel, light and Power
General Expenses (See (b) below)
Hospital Ambulance Transport Cools rorcrmauco Management Expenses
Insurance
lntersta'o Patient Outtlows (see (e) below)
Maintenance {See (cl below)
Maintenance Contracts
New/Replacement Equipment under 510,000
Repairs
Maintenance/Non Coot-act Other
Medical and Surgical Supplies
Postal and Telephone Cosls
Printing and Stationery
Rates and Charges
Rental
Speclal Service Dapanments
Staff Related Costs
Sundry Operating Expenses (See (a) below)
Travel Related Cosls
CONSOLIDATiON
2010
$ooa
858,416
40,846 21,526
75,906
50,195 97,979
34,140
10,586
.____1_~~~~ ________
1,201,961
232,678
6,4B8
20,956 73,914
23,345
14,077
44,735
10,179 21,134
2,843
3,593
13,004
9,547 16,542
(2,379)
84,464
5,572
5,788 2,958
2,195
40,144
6,846
42,771
~O,_~!
694,043
2009
'5000
852,740
47,298
22,060 73,961
36,467
107,782
32,875
768
.....1,?~?.5~
1,186,182
225,466
8,924
21,356
69,120 11,311
10,430 43,413
9,462 19,793
2,023
3,117
22,771
10,711
16,156
(1.559)
75,369
5,463
6,346 2,497
1,698
42,766
6,029
40,364
... ~.9.'~?~_
663,192

PA
RE
NT
2010
20
09
$000
$0
00
42,7
35
40.3
10
____
____
____
_5!l.
....
... ~
,~
42,7
71
40,3
64
,>5
1,61
51.
523
'" 1.
711
1,30
1
26
aa
1.57
0
1,65
4
",
act '"
'"20
"0
1,22
1'" '"
1,8B
7 5,
277
4,53
9 9.
082
""
26O "
" '"1,
459
'" '9
2 9.
959
10
.917
5.
44B
36,7
14
37,3
68
....
....~
.,.1
.3.1
. ..
....
....
....
...5.
?-'!
~
42,1
l45
43
,203
72.8
46
69,4
96
89.3
95
85.8
57
40.0
72
41.8
31
24,2
15
23.7
11
2.85
6 2.
3Bl
3,29
4 2.
590
232.
618
22
5,46
6
,6<
<0
, 1.
245
l,3
1B
26
',<7
'" '" ",
"st " ",
'" 3,
593
3.
117
Syd
ne
yWe
s.t
Are
a H
ea
lth
Se
rvlc
a
No
tes to
an
d fo
rmin
g p
art
of
the
Fin
an
cia
l S
tate
me
nts
fo
r th
e Y
ea
r E
nd
ed
30
Ju
ne
20
10
(a)
Sun
dry
Ope
ratin
g E
xpen
ses
wm
prl
se;
C
ontr
act
for
Pat
ient
Ser
vi~a
:>
Isol
ated
Pat
ient
Tra
vel a
nd A
talm
nlil
da
tio
n A
ssis
tanc
e S
Che
me
(b)
Gen
eral
Exp
ensa
:>In
clud
e:
Adv
enis
ing
B
ooks
, M
agaz
ines
and
Jou
rnal
s
cons
unar
eres
-
Ope
ratin
o A.
ctilo
'illa:
> -
Cap
ital
Wor
!\S
Cou
rier
and
Fre
ight
AUdito~s
Rem
uner
atio
n -
AU
dito
l F
inan
cial
Sta
tem
ents
A
udito
l's R
emun
erat
ion
-O
Iher
se
rvce
s na
ta R
econ
::lln
g an
d S
tora
ge
Lega
l se
rece
s Membershi~PrOIe5l5ionalF
ees
Mat
or V
ehic
le O
pere
ting
Leas
e c.
-pe
nse
· M
inim
um L
ease
Pay
men
ts
Oth
er O
pera
ting
Leas
e E
xpen
se -
MIn
imum
Lea
se P
aym
enLS
P
ayro
ll S
ervi
ces
Qua
lity
AS
iura
nce
/A=
ed
lta
tio
n
Sec
ority
51!
lV'c
es
Tra
nsla
tor
Ser
v\ca
:>
Hea
lth S
uPP
OrtC
harg
es·
Fin
anci
al s
ervi
ces
Goo
ds 8
. Se
rric
es-
Olh
er
(c)
Rec
onci
liatio
n T
otal
Mai
nten
ance
M
aint
enan
ce E
xpen
se -
Con
trac
ted
Labo
ur a
nd o
ner {
Non
-Em
ploy
ee
Rel
aled
), I
nclU
ded
in N
ote
5 E
mpl
oyee
Rel
aled
{Per
sonn
el S
ervi
ces
Mai
nlen
ance
exp
ense
lncl
uced
In
Not
es 3
and
4
Tot
ai M
aint
enan
ce E
xpen
sa:>
Incl
uded
In
uo
tes
3. 4
and
5
CO
NS
OLI
DA
TIO
N
2010
SOOO
42.7
35
---~-~
42,7
71
a-s
1.52
9
1.71
1 26
1.57
0 26
7 20
95
' '6
<
1,22
1 5.
277
9,
082
,eo " '"
9.95
9
36,7
14
._..._.
.~,.~~.~
42,8
45
2009
$000
40.3
10
_~.4_
40,3
64
'"1,
615
1,30
1 -ta
1,6-
54
HO
20
7 '" '"1.
881
4,53
9 8,
325
tat "
1,45
9
10,9
17
5,44
B
'"
31,3
68
____
~_&3_5_
43,2
03
(d)
Del
alls
ofm
ean
ocat
rons
appl
ied
(0In
ter
Are
aP
atre
ntO
ulF
low
s,N
SW
onan
Are
aba
sis
asac
cept
ed b
ylM
NS
WD
ep
an
me
ntO
fHea
lth a
reas
rollo
ws:
Syd
ney
SO
uth
Wes
l Are
a H
ealth
se
race
C
hild
ren'
S H
ospi
tal W
eSlm
ead
Non
hem
Syd
ney
cenu
er C
Oas
t Are
a H
ealth
Ser
vice
S
oulh
Eas
t Syd
ney
lIIaw
arra
Are
a H
eallh
se
ree
e
ere
ate
we
se
m A
rea
Hea
llh S
ervi
ce
Oth
el A
rea
Hea
lth S
ervi
ces
(e)
Exp
ense
s lo
r In
ters
tate
Pat
ient
Flo
ws
are
as lo
llow
s:
Aus
tral
ian
Cap
ital T
errit
ory
Que
ensl
and
SO
uth
Aus
tral
ia
Vic
toria
T
asm
ania
N
orth
em T
enito
ry
we
ste
rn A
ustr
alia
72,8
46
89,3
95
40,0
72
24.2
15
2,85
6
""
232,
678
,6<
1,
245
30
',<7
"at 12'
3,59
3
69,4
96
85,6
-57
41,6
31
23.7
11
2.3!
J1
2.59
0
225,
466
403
1,31
B
'" '" 12' " '"
3,11
7

PARENT
2010 2009
$000 $000 6.
50,979 50,248 1,883 1,883
23,097 22,518 1,580 1,571 1,106 240
--- .-_....
78,645 76,460
7.
10,062 8,446 430 432
7,900 8,721
18,392 17,599
8.
470 1,168 2,792
1,178
3,262 2,346
9.
5,068 1,419 19,025 15,444 3,271 3,416
27,364 20,279
Sydney West Area Health Service Notes to and forming part of the Financial Statements
for the Year Ended 30 June 2010
Depreciation and Amortisation
Depreciation - Buildings Amorteeton . Leased Buildings Depreciation - Plantand Equipment Depreciation - Infrastructure Systems Amortisation - Intangible Assets
Grants and Subsidies
Non-Government Voluntary Organisations Research Organisations Other
Finance Costs
Finance Lease Interest Charges Intereston Bank Overdrafts and Loans OtherInterestCharges
Total FinanceCosts
Payments to Affiliated Health Organisations
(a) Recurrent Sourced Lottie Stewart Hospital St Joseph'sHospital Tresillian Family Care Centre
CONSOLIDATION
2010 2009 $000 $000
50,979 50,248 1,883 1,883
23,097 22,518 1,580 1,571 1,106 240
78,645 76,460
10,062 8,446 430 432
7,900 8,721
18,392 17,599
470 1,168 2,792
1,178
3,262 2,346
5,068 1,419 19,025 15,444 3,271 3,416
......"----_. --- ------
27,364 20,279

Sydney West Area Health Service Notes to and forming part of the Financial Statements
for the Year Ended 3DJune 2010
PARENT CONSOLIDATION
2010
$000
2009
'00' 10. Other Expenses
2010
$000
2009
$000
11. Sale of Goods and services
(a) Sale of Goods comprise the lollowing:
6,606 449 905
24,733
6,700 1,130
777
Sale of Prosthesis Olher Pharmacy Sales High coer Drugs •
8,608 449 905
26,641
6,700 1,130
777
(b) Rendering 01Services comprises the following:
67,197 276
33,298 11,444
101,800 1,324 3,199 3,125 2,482 9,271
28,473 6
346 41
35 5,670
634
5,942
65,527
'"34,150 12,498
103,179 1,018 5,211
2,944 2,353 6,120
20,421
10
30' 20 7
(19) se
2,7Ol 700 11
5,270
Patient Fees [see note 2(d)] Stall-Meals and Accommodation mrrastrucivre Fees - Monlhly Facilily Charge [see note 2(d)]
• Annual Charge Allocation from Inler Area Patientlnllows, NSW [see nee (c) below] sevcee Provided 10Non NSW Health Orpanisations CaleterialKiosk Car Parking Child Care Fees Clinical Services (exclUding ainical Drug Trials) Commercial Actlvilies Enteral Nutrition Income Fees for Medical Records Information Retrieval Llnen serves Revenues - Non Heallh Services Linen serves Revenues - Olher Health Services PADP Patient Copayments Patlentlnllcws from Interstate [see note (d) below)] Salary Packaging Fee Shared Corporate Services Use of Ambulance Facilities
67,197 276
33,298 11,444
101,800 1,324
3,199 3,125 2,482 9,271
28,473
6 346 41
35 5,670
634
5,942
65,527 sa
34,150 12,496
103,179 1,018 5,211 2,944 2,353 6,120
20,421 10
303 20 7
(19} ss
2,767
706 11
5,270
7,533 5,867 Qlher 5,625 5,8Ol
314,869 277,439 314,869 277,439
• The Commonwealth Highly Spl:!Cialised Drug program was varied Irom
1 July 2009. The State now claims on a recovery basis the cost of highly
specialised drugs through Medicare (Ccmmonwaalth).
In previous veers these lunds were received wilhin the annual
Government Allocation from the NSW Department of Health
(c) Details 01the Allocalions received for Inter Area Patient Flows,
NSWon an Area basis as accepted by the NSW Department 01Health
are as f~lows:
46,158 19,257
8,006 14,330 8,459 5,590
46,663 18,656
9,052 13,729
7,541 6,93f1
Sydney South West Area Heallh Service Northern Sydney/Central Coast Araa Health servces South East Sydney/lIlawarra Area Health seoce Greater westernArea Health serelce Hunter New England Area Heatlh Services Olher Area Health Services
46,158 19,257
8,006 14,330
8,459 5,590
46,663 18,656 9,052
13,729 7,541
6,938
101,800 103,179 101,800 103,179
(d) Revenues from Palientlnflows from Interstate are as follows:
1,700 122
1,927
199
'''' 729 799
597 47
1,019 276 273
'"106
Australian Capital Territory Northern Territory Queensland South Australia Tasmenia Victoria westemAustralia
1,700 122
1,927 199
'''' 729 799
597 47
1.019 278 273 369 160
5,670 2,767 5,670 2,767
12. Investment Revenue
6,496
3~~8~
9,273
~._~_99
interest - outer Lease and Rental Income
6,496
3,58~
9,273
-~,~~
10,085 12,682 10,085 12,682

Sydney West Area Health Service Notes to and forming part of the Financial Statements
for the Year Ended 30 June 2010 PARENT CONSOLIDATION
2010 2009 2010 2009 $000 $000 $000 $000
13. Grants and Contributions
4,165 2,741 Clinical Drug Trials 4,165 2,741 3,141 3,767 Commonwealth Government Grants 3,141 3,767 3,893 2,969 Industry Contributions/Donations 3,893 2,969 6,596 3,238 CancerInstitute Grants 6,596 3,238 2,239 5,648 NSW Government Grants 2,239 5,648
21,526 22,060 Personnel Services - Superannuation Defined Benefit Plans 13,780 12,825 Research Grants 13,780 12,825 4,36§ .....1,.083 OtherGrants 4,368 .... 1.,0.83
59,708 54,331 38,182 32,271
14. Other Revenue
Other Revenue comprises thefolJowing:
23 6 Bad Debts Recovered 23 6 457 640 Commissions 457 640 799 1,042 Conference andTraining Fees 799 1,042
1 Discounts 1 27 30 Sale of Merchandise, Old Waresand Books 27 30
5 45 Sponsorship Income 5 45 877 Treasury Managed Fund Hindsight Adjustment 877 925 917 Kings Parking Annual Fee 925 917
6,843 """--
4,459 Other ...8.,.84;) 4,459
11,957 7,139 11,957 7,139
15. Gain/(Loss) on Disposal
17,935 118,828 Property, Plant and Equipment 17,935 118,828 15,694 .......1()5,~3! LessAccumulated Depreciation 15,694 ... 105,637
2,241 13,191 Written Down Value 2,241 13,191 572 127 Less Proceeds from Disposal 572 127
Gain/(Loss)on Disposal of (1,669L (13,064) Property, Plant and Equipment (1,669) (13,064)
16. Other Gainsl(Losses)
(5,084) (3,428) Impairment of Receivables (5.,g84) (3,428)
(5,084) (3,428) (5,084) (3,428)

Sydney West Area Health Service Notes to and forming part of the Financial Statements
for the Year Ended 30 June 2010 PARENT AND CONSOLIDATION
17. Conditions on Contributions
Contributions recognised as revenues during the current reporting period for which expenditure inthe manner specified had notoccurred as at balance date
Contributions recognised in amalgamated balance as at 30 June2009 which were notexpended in thecurrent reporting period
Totalamount of unexpended contributions as at balance date
Comment on restricted assets appears in Note 26
Purchase of
Assets
$000
Health Promotion,
Education and
Research
$000
Other
$000
Total
$000
1,325 5,299 6,624
________________??'!!?L !_~!,§.Q~ 1~~,~_~?_
29,202 116,807 146,009

Sydney West Area Health Service Notes to and forming part of the Financial Statements
for the Year Ended 30 June 2010
18 Service Groups of the Health Service
Service Group 1.1 - Primary and Community Based Services
Service Description: This service group covers the provision of health services to persons attending community health centres or in the home, including health promotion acllvities, community based women's health, dental, drug and alcohol and HIV/AIDS services. It also covers the provision of grants to non-Government organisations for community health purposes.
Objective' This service group contributes to making prevention everybody's business and strengthening primary health and continuing care in the community by working towards a range of intermediate results that include the following: • improved access to early intervention, assessment, therapy and treatment services for claims in a home or community setting • reduced rate of avoidable hospital admissions for conditions identified in the State Plan that can be appropriately treated in the community and • reduced rate of hospitalisation from fall-related injury for people aged 65 years and over.
Service Group 1.2 - Aboriginal Health Services
Service Description: This service group covers the provision of supplementary health services to Aboriginal people, particularly in the areas of health promotion, health education and disease prevention. (Note: This Service Group excludes most services for Aboriginal people provided directly by Area Health Services and other general health services which are used by all members of the community).
Objective: This service group contributes to ensuring a fair and sustainable health system by working towards a range of intermediate results that include the following: • the building of regional partnerships for the provision of health services • raising the health status of Aboriginal people and • promoting a healthy lifestyle.
Service Group 1.3 • Outpatient Services
Service Description: This service group covers the provision of services provided in outpatient clinics including low level emergency care, diagnostic and pharmacy services and radiotherapy treatment.
Oblec;tive: This service group contributes 10 creating better experiences for people using health services and ensuring a fair and sustainable heallh system by working towards a range of intermediate results including improving, maintaining or restoring the health of ambulant patients in a hospital setting through diagnosis, therapy, education and treatment services.
Service Group 2.1 - Emergency Services
Service Description: This service group covers the provision of emergency ambulance services and treatment of patients in designated emergency departments of public hospitals.
Objective: This service group contributes to creating better experiences for people using the health system by working towards a range of intermediate results including reduced risk of premature death or disability by providing timely emergency diagnostic treatment and transport services.
Service Group 2.2 - Overnight Acute Inpatient Services
Service Description: This service group covers the provision of health care to patients admitted to public hospitals with the intention that their stay will be overnight, including elective surgery and maternity services.

Sydney West Area Health Service Notes to and forming part of the Financial Statements
for the Year Ended 30 June 2010
Objective: This service group contributes to creating better experiences for people using the health system by working towards a range of intermediate results that include the following: • timely treatment of booked surgical patients, resulting in improved clinical outcomes, quality of life and patient satisfaction and • reduced rate of unplanned and unexpected hospital readmissions.
Service Group 2.3 - Same Day Acute Inpatient Services
Service Description: This service group covers the provision of health care to patients who are admitted to public hospitals with the intention that they will be admitted, treated and discharged on the same day.
Objective: This service group contributes to creating better experiences for people using the health system by working towards a range of intermediate results that include the following: • timely treatment of booked surgical patients resulting in improved clinical outcomes, quality of life and patient satisfaction and • reduced rate of unplanned and unexpected hospital readmissions.
Service Group 3.1 - Mental Health Services
ServiceDescrlottcn. This service group covers the provision of an integrated and comprehensive network of services by Area Heallh Services and community based organisations tor people seriously affected by mental illness and mental health problems. It also includes the development of preventative programs which meet the needs of specific client groups.
Objective: This service group contributes to strengthening primary health and continuing care in the community by working towards a range of intermediate results that include the following: • improving the health, wellbeing and social functioning at people with disabling mental disorders and • reducing the incidence of SUicide, mental health problems and mental disorders in the community.
Service Group 4.1 - Rehabilitation and Extended Care Services
Service Description: This service group covers the provision of appropriate health care services tor persons with tong-term physical and psycho-physical disabilities and for the trail-aged. It also includes the coordination of the Department's services for the aged and disabled, with those provided by other agencies and individuals.
Objective: This service group contributes to strengthening primary health and continuing care in the community and creating better experiences for people using the health system by working towards a range of intermediate results including improving or maintaining the wellbeing and independent functioning of people with disabilities or chronic conditions, the frail and terminally ill.
Service Group 5.1 • Population Health Services
Service Description: This service group covers the provision of health services targeted at broad population groups including environmental health protection, food and poisons regulation and monitoring of communicable diseases.
Objective: This service group contributes to making prevention everybody's business by working towards a range of intermediate results that include the following: • reduced incidence of preventable disease and disability and • improved access to opportunities and prerequisites tor good health.
Service Group 6.1 - Teaching and Research
ServiceDescription: This service group covers the provision of professional training for the needs of the New South Wales health system. It also includes strategic investment in research and development to improve the health and wellbeing of the people of New South Wales.
Sydney West Area Health Service Notes to and forming part of the Financial Statements
for the Year Ended 30 June 2010
Objective: This service group contributes to ensuring a fair and sustainable health system by working towards a range of intermediate results Ihat include the following: • developing the skills and knowledge of the health workforce to support patient care and population health and • extendlnq knowledge through scientific enquiry and applied research aimed at improving the health and wellbeing of the people of New South Wales.

Syd
ney
Wes
t A
rea
Hea
lth
Ser
vice
N
ote
s to
an
d f
orm
ing
par
t o
f th
e F
inan
cial
Sta
tem
ents
fo
r th
e Y
ear
En
de
d 3
0 Ju
ne
20
10
PA
RE
NT
C
ON
SO
LID
AT
ION
2010
20
09
2010
20
09
$000
$0
00
$000
$0
00
19.
Cas
h a
nd
Cas
h E
qu
ival
ents
29.5
60
7.05
4 C
ash
at b
ank
and
on
han
d
29.5
60
7.05
4 n
2.2
91
1Q
?,lQ
O
Sh
ort
Ter
m D
epos
its
........
........
...1..1
..2.• 2
91.
.10.
2,10
0
141.
851
109.
154
141,
851
109,
154
141.
851
141.
851
_~.9
~.!.
1.?,
~"
109,
154
Cas
h &
cas
h e
quiv
alen
t as
sets
reco
gnis
ed i
nth
e S
tate
men
t of F
inan
cial
Pos
ition
are
reco
ncile
d at
the
end
of t
he
finan
cial
yea
r to
th
e S
tate
men
t o
fCas
h F
low
s as
follo
ws:
Cas
h a
nd
cas
h e
quiv
alen
ts (
per
Sta
tem
ent
of F
inan
cial
Pos
ition
)
Clo
sing
Cas
h a
nd
Cas
h E
quiv
alen
ts (
per
Sta
tem
ent o
f Cas
h F
low
s)
141.
8.51
141,
851
109.
154
109,
154
Ref
er t
o N
ote
39
for
det
ails
reg
ard
ing
cre
dit
risk
, li
qu
idit
y ri
sk a
nd
mar
ket
risk
ari
sin
g f
rom
fin
anci
al in
stru
men
ts.
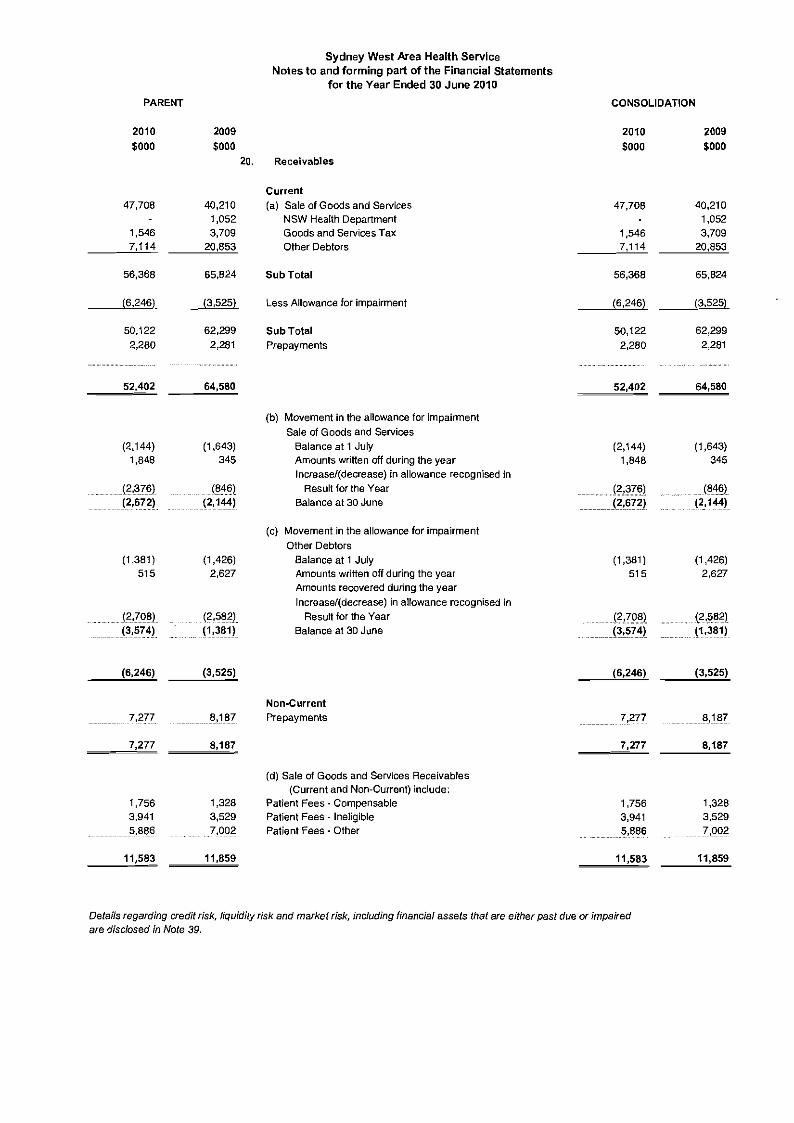
Sydney West Area Health Service Notes to and forming part of the Financial Statements
for the Year Ended 30 June 2010
PARENT CONSOLIDATION
2010 2009
$000 $000 20. Receivables
47,708
1,546 7,114
40,210 1,052 3,709
20,853
56,368 65,824
(6,246)
50,122 2,280
(3,525)
62,299 2,281
52,402 64,580
(2,144) 1,848
(1,643) 345
J2,3X6) [2,672)
J~~6)
...J2,1~)
(1,381) 515
(1,426) 2,627
(2,70 8) (3,574)
(2,582) (1,3111)
(6,246) (3,525)
7,277
7,277
_____f!~_~ __~!
8,187
1,756 3,941
..........5,886
11,583
1,328 3,529 7,002
11,859
Current
(a) Sale of Goodsand Services NSW HealthDepartment Goodsand Services Tax Other Debtors
Sub Total
Less Allowance for impairment
Sub Total
Prepayments
(b) Movementin the allowance for impairment Sale of Goodsand Services
Balance at 1 July Amounts written offduring the year Increase/(decrease) in allowance recognised in
Resultfor the Year Balance at 30 June
(c) Movementinthe allowance for impairment Other Debtors
Balanceat 1 July Amounts written offduring the year Amounts recovered during the year Increasel(decrease) inallowance recognised in
Resultforthe Year Balance at 30 June
Non-Current Prepayments
(d) Sale of Goodsand Services Receivables (Currentand Non-Current) include:
Patient Fees - Compensable PatientFees - Ineligible PatientFees· Other
2010
$000
2009 $000
47,708
1,546
~
56,368
(6,246)
50,122 2,280
40,210 1,052 3,709
20,853
65,824
(3,525)
62,299 2,281
52,402 64,580
(2,144) 1,848
(1,643) 345
(?,~76) (2,672)
(84~i)
J2c144'
(1,381 ) 515
(1,426) 2,627
(2,798)
...... J3,S741 (2,582) (1,381)
(6,246) (3,525)
..... 7,277
7,277
.. 8,187
8,187
1,756 3,941 5,886
11,583
1,328 3,529 7,002
11,859
Details regarding credit risk, liquidily risk and marketrisk, including financial assetsthatare eitherpastdueor impaired are disclosed inNote 39.

Sydney West Area Health Service Notes to and forming part of the Financial Statements
for the Year Ended 30 June 2010 PARENT CONSOLIDATION
2010 2009 2010 2009 $000 $000 $000 $000
21. Inventories
current- Held for Distribution
9,630 7,578 Drugs 9,630 7,578 8,343 6,032 Medical and Surgical Supplies 8,343 6,032
6 128 Foodand HotelSupplies 6 128 1 Engineering Supplies 1
1.~8 Other Including Goodsin Transit 79 168
18.058 13.907 18,058 13,907
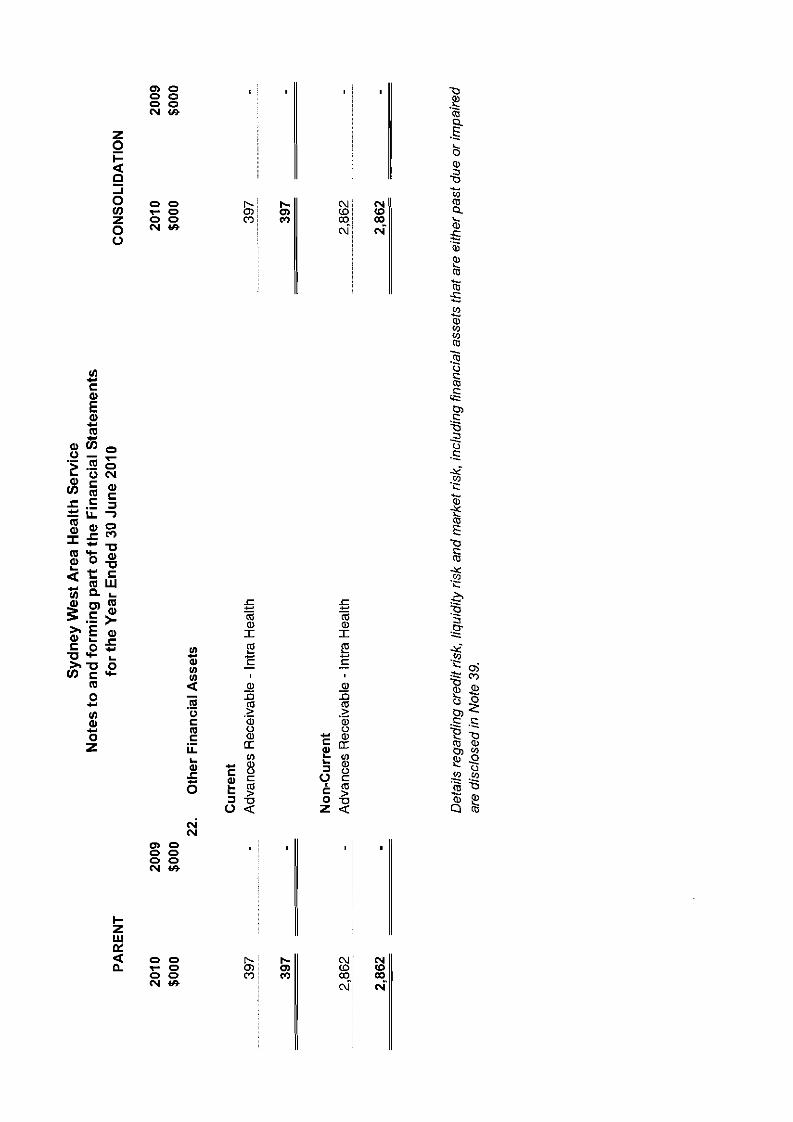
Syd
ney
Wes
t A
rea
Hea
lth
Ser
vice
N
ote
s to
an
d f
orm
ing
par
t o
f th
e F
inan
cial
Sta
tem
ents
PA
RE
NT
fo
r th
e Y
ea
r E
nd
ed 3
0 Ju
ne
2010
C
ON
SO
LID
ATI
ON
2010
20
09
2010
20
09
$000
$0
00
$000
$0
00
22.
Oth
er F
inan
cial
Ass
ets
Cu
rren
t 39
7 A
dva
nce
s R
ecei
vabl
e -
Intr
a H
ealth
39
7
397
397
Non
-Cur
rent
2
,86
2
Ad
van
ces
Rec
eiva
ble
-In
tra
Hea
lth
2,8
62
-
--
----
--_
._
2,86
2 2,
862
Det
ails
reg
ardi
ng c
redi
t ris
k, l
iqui
dity
risk
and
mar
ket r
isk,
inc
ludi
ng f
inan
cial
ass
ets
that
are
eith
er p
ast
due
or
imp
air
ed
ar
e d
iscl
ose
d in
Not
e 39
.
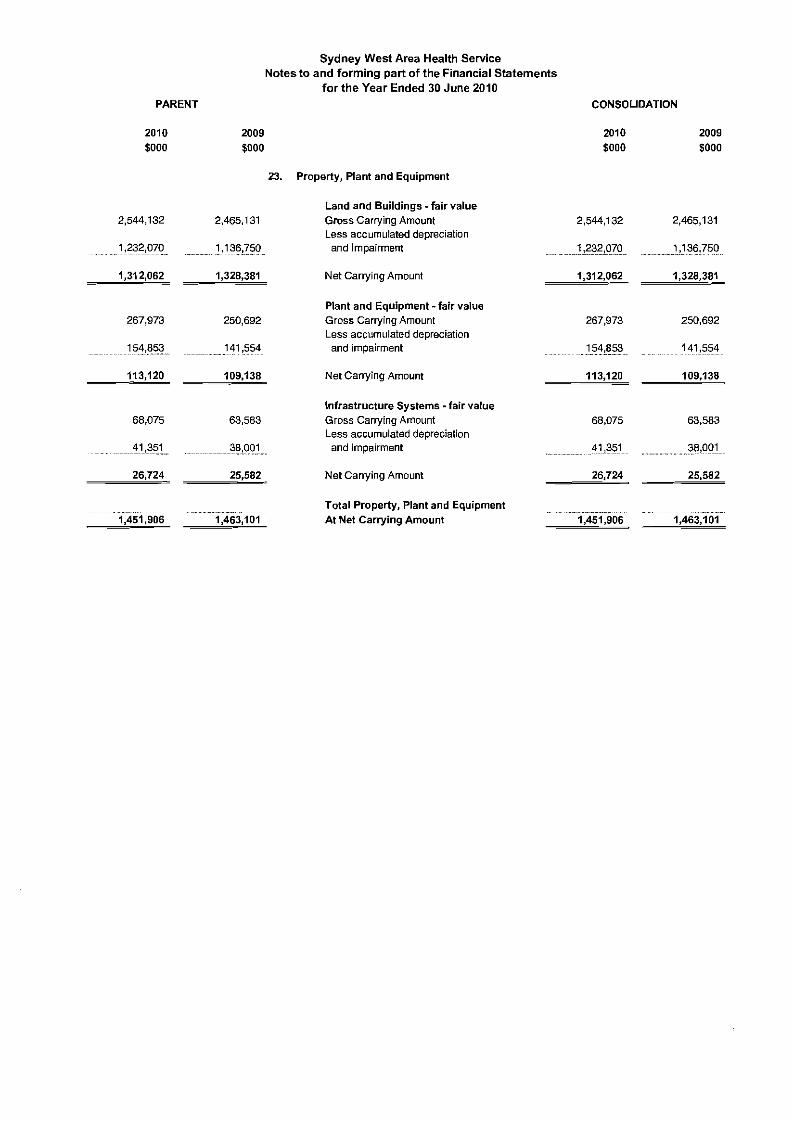
Sydney West Area Health Service Notes to and forming part of the Financial Statements
for the Year Ended 3D June 2010
PARENT CONSOUOATION
2010 2009 $000 $000
23.
2,544,132 2,465,131
1,232,079 1,136,7!jO
1.312,062 1,328,381
267,973 250,692
154,859141,554
113.120 109,138
68,075 63,583
41,35.1..... .. .. ._3~,991
_~~2;;6~,7:.:2;;;4~ 25,582
1.451,906 1,463,101
Property, Plant and Equipment
Land and Buildings· fair value GrossCarrying Amount Less accumulated depreciation
and Impairment
Net CarryingAmount
Plantand Equipment « fairvalue Gross Carrying Amount Less accumulated depreciation
and impairment
Net CarryingAmount
Infrastructure Systems· fair value Gross Carrying Amount Less accumulated depreciation
and impairment
Net CarryingAmount
Total Property, Plant and Equipment
At Net Carrying Amount
2010 $000
2009 $000
2,544,132
.1,232,070
1,312,062
2,465,131
..1,136,750
1,328.38.1
267,973
.1!j4&59 .
113,120
250,692
. ... 141,554
109,138
68,075
41,351
~~~,;;26~.7:.:24~
63,583
}8,0(j1
25.582
1,451,906 1,463.101

Sydney West Area Health Service Notes to and forming part of the Financial Statements
for the Year Ended 30 June 2010
PARENT AND CONSOLIDATION
23. Property, Plant and Equipment - Reconciliations
Land Buildings Work in
Progress
Leased
Buildings
Plant and
Equipment
Infrastructure
Systems
Total
$000 $000 $000 $000 $000 $000 $000
2010
Net Carrying amount at start of year Additions
Recognition 01Assets Held for Sale
Disposals
Administrative Restructures - transfers
in/(out)
Net Revaluation Increment Less
Revaluation Decrements Recognised in
Reserves
Depreciation expense
Reclassifications
Net Carrying Amount at End of Year
321,505
481 (2,522)
(20,240)
(22,556) --
276,668
946,808
(2,033) (1,138)
-
48,096 (50,979)
13,753
954,507
10,544 33,819
--
-
--
(13,753) 30,610
49,524 ---
-
2,636
(1,883)
-50,277
109,138
28,133 -
(1,103)
(242)
-(23,097)
291 113,120
25,582 1,335
(13)
-
-
1,400
(1,580)
-26,724
1,463,101
63,768 (4,568) (2,241)
(20,482)
29,576 (77,539)
291 1,451,906
Land Buildings Work in
Progress Leased
Buildings
Plant and
Equipment
Infrastructure
Systems
Total
I $000 $000 $000 $000 $000 $000 $000
2009
Net Carrying amount at start of year
Additions
Disposals
Administrative Restructures - transfers in/(out)
Net Revaluation Increment Less
321,505 3,309
(1,809)
875,231
(10,820)
(326)
80,037 63,792
-
51,407 -
-
108,593
23,527
(464)
-
27,251
(98)
1,464,024 90,628
(13,191)
(326)
Revaluation Decrements Recognised in
Reserves
Depreciation expense
Reclassifications
Net Carrying Amount at End of Year
(1,500)
-321,505
(314) (50,248) 133,285
946,808
--
(133,285) 10,544
-(1,883)
-49,524
-(22,518)
-109.138
-(1,571)
-25,582
(1,814) (76,220)
. 1,463,101
(i) Land and Buildings include land owned by the Health Administration Corporation and administered by the Health Service [see note 2(g)].
(ii) Land and Buildings were valued by AON Valuation Services on 30 June 2008
(see note 2U)]. AON Valualion Services is not an employee of the Health Service.
(iii) In acccordance with the fair value requirements of AASB 116 the land, buildings and lntraetructure assets have had a factor applied in relation to the movement in the market and variation in the building and infrastructure costs. The adjustment has been performed on a gross basis in accordance with note 2 U). This factor gives consideration to the valuation of Physical Non-Current Assets at Fair Value. The follOWing table details the indlce applied to Non Current Assets as determined by the NSW Department of Land and Property Management Authority:
Year Land Buil~ Infrastructure 93% 102% 102%
105% 103% 103%~:~~~I I I I (iv) Land Administrative Restructure ($20.24 Million), being transfer of land to the NSW Department of Land and Property Management Authority,
is offset by a minor addition being recognition of an additional portion of land assigned to the Health Service. The net 01these two events is represented as equity transfer ($20.336 Million) in the Statement of Changes in Equity.

PARENT
Sydney West Area Health Service Notes to and forming part of the Financial Stat
for the Year Ended 30 June 2010 ements
CONSOLIDATION
2010 SOOO
2009 $DOD
24. Intangible Assets
2010 SOOO
2009 SOOO
10,058 1,348
Software
4,684 Cost (GrossCarrying Amount) 240 LessAccumulated Amortisation and Impairment
10,058
......... 1,346 ....
4,684 240 ........." .....""."-~""
6,712 ~~=~4~',;444~ Net Carrying Amount 6,712 4,444

Sydney West Area Health Service Notes to and forming part of the Financial Statements
for the Year Ended 30 June 2010
PARENT AND CONSOLIDATION
24. Intangibles· Reconciliation
Software
$000
Other
$000
----
Total
$000
2010 Net carrying amountat startof year Additions (frominternal development or acquired separately) Amortisation (recognised in depreciation and amortisation) Reclassification to Plant& Equipment
4,444 5,665
(1,106) (291)
4,444
5,665 (1,106)
(291) Net Carrying Amount at End of Year 8,712 - 8,712
I I Software
I$000
Other
$000 I Total
I$000
2009 Net carrying amountat startof year - - -Additions (tram internal developmentor acquired separately) 4,684 - 4,684 Amortisation (recognised in depreciation and amortisation) (240)
4,444 --
(240) Net Carrying Amount at End of Year 4,444

PAR
EN
T
Syd
ne
y W
est
Are
a H
ea
lth
Se
rvic
e
No
tes to
an
d f
orm
ing
pa
rt o
f th
e F
ina
nci
al
Sta
tem
en
ts
for
the
Ye
ar
En
de
d 3
0 Ju
ne
20
10
C
ON
SO
LID
AT
ION
2010
$0
00
2009
$0
00 25
. N
on
-Cu
rre
nt A
sse
ts H
eld
for
Sal
e (o
r D
isp
osa
l G
rou
ps)
2010
$0
00
2009
$0
00
4,55
6 12
Ass
ets
Hel
d fo
r S
ale
Land
and
Bui
ldin
gs
Infr
astr
uctu
re S
yste
ms
4,55
6 12
4,56
8 4,
568
4,56
8 A
mo
un
ts r
eco
gn
ise
d in
eq
uit
y re
latin
g t
o a
sse
ts h
eld
for
sale
P
rope
rty,
pla
nt a
nd e
quip
men
t ass
et r
evai
uatio
n In
crem
ents
/Dec
rem
ents
4,
568
_
4,56
8 4,
568
Gov
erno
r P
hilll
ip N
ursi
ng H
ome
as p
art o
f the
Sta
te N
ursi
ng H
ome
Tra
nsfe
r P
roje
ct is
bei
ng
prog
ress
ed e
xciu
sive
ly th
roug
h H
ealth
Infr
astr
uctu
re a
nd 6
1.5%
of t
he p
rope
rty
is m
arke
d fo
r sa
le.

PA
RE
NT
Syd
ney
Wes
t A
rea
Hea
lth
Ser
vice
N
ote
s to
an
d f
orm
ing
par
t o
f th
e F
inan
cial
Sta
tem
ents
fo
r th
e Y
ear
En
ded
30
Jun
e 20
10
CO
NS
OL
IDA
TIO
N
2010
$0
00
2009
$0
00 26
. R
estr
icte
d A
sset
s
2010
$0
00
2009
$0
00
The
Hea
lth S
ervi
ce's
fin
anci
al s
tate
men
ts i
nclu
de th
e fo
llow
ing
asse
ts w
hich
are
res
tric
ted
by e
xter
nally
impo
sed
cond
ition
s, e
go
do
no
r re
quire
men
ts.
The
ass
ets
are
only
ava
ilabl
e fo
r ap
plic
atio
n in
acc
ord
an
ce w
ith t
he t
erm
s of
the
do
no
r re
stri
ctio
ns.
Cat
ego
ry
Bri
ef D
etai
ls o
f E
xter
nal
ly I
mp
ose
d
Co
nd
itio
ns
incl
ud
ing
Ass
et
Cat
ego
ry a
ffec
ted
96,2
66
79,3
19 S
peci
fic P
urpo
ses
Hea
lth P
rom
otio
n 96
,266
7
9,3
19
49,7
43
47,2
66 P
rivat
e P
ract
ice
Fun
ds
49,7
43
47,2
66
146,
009
126,
585
146,
009
126,
585

Syd
ne
y W
est
Are
a H
ea
lth S
erv
ice
N
otes
to
and
form
ing
par
t of
the
Fin
an
cia
l S
tate
me
nts
fo
r th
e Y
ear
End
ed 3
0 Ju
ne
201
0
PA
RE
NT
C
ON
SO
LIO
AT
ION
27.
Pay
able
s 20
10
2009
20
10
2009
$000
SO
OO
$000
$0
00
Cu
rre
nt
Acc
ruad
sal
arie
s w
ages
and
co-
cost
s 17
,858
34
,279
T
axat
ion
and
Pay
roll
Ded
uctio
ns
23,9
29
8.87
7
41.7
87
43
,15
6
Acc
rued
Uab
ility
-P
urch
ase
or P
erso
nnel
Ser
vice
s 34
,195
4
3,2
56
C
redi
tors
34
,195
43
,256
OIh
er C
redi
tors
3,26
8 3,
948
-C
apila
l W
orks
3,
286
3,94
8
6,62
7 3,
764
-In
tra
Hea
llh U
abili
ty
6,62
7 3,
764
7,51
4 6,
970
-VM
OS
7,
514
6,97
0
5,74
4 5,
428
-A
ffili
ala
d O
rgan
isat
ions
5,
744
5,42
8
40,4
61
27,3
84
-A
ccru
ad C
radi
lors
40
,461
27
,384
.3,1_~
....
..~.!,1,QQ.
-M
ise
erec
tors
_._~,"1_fi?_
__
___ .
.......3.
:.~.'?
9.
142,
758
137,
006
1-42
,758
13
7,00
6
De/
ails
reg
ardi
ng c
mdi
/ ris
k, l
iqu
idity
n's
k an
d m
arlle
t ris
k, i
ncl
ud
ing
a m
alfJ
rily
anal
ysis
of t
he a
bove
pa
yab
les
are
disc
lose
d in
Nol
e 39
.
28.
Bo
rro
win
gs
Cu
rre
nt
27,0
71
12,5
23
Oth
er L
oans
and
oep
cene
27
,071
12
.523
4,4
n
_3-,_!
Q~
Fin
ance
Lea
ses
[see
not
e 2(
r)]
4,1:??
_ __
~l~
..
31,5
48
16,2
26
31,5
48
16,2
28
No
n-c
urr
en
t
14,9
65
20,6
14
Oth
er L
Q81
\5 a
nd D
epos
its
14,9
65
20,6
14
____
____
1_Q,~,.
_l
_~J_
~~
Fin
ance
Lea
ses
[see
not
e 2{
rlJ
___1Q,~_.
.1
~:_!
_~3
25,8
53
35,7
57
25,6
53
35,7
57
Oth
er l
oans
stil
l to
be e
xtin
guis
hed
repr
esen
t m
onie
s 10
be r
epai
d to
the
NS
W H
sau
t D
epar
tmen
t!
NS
W T
re85
\Jr"
(. F
inal
He
pa
yrn
en
tls s
ched
uled
for
30
June
201
4.
Re
pily
me
nt
of B
orr
ow
ing
s
(exc
lUdi
ng F
inan
ce L
ease
s)
27,0
71
12,5
23
Not
e la
ter
than
one
yea
r 27
,071
12
,523
14,0
42
20,6
14
Bet
wee
n on
e en
d liv
e y
ears
14
,042
20
,614
tete
r th
an f
ive
year
s ""
"" T
Ola
l Bor
row
ing
at fa
ce v
alue
42,0
36
33,1
37
(exc
ludi
ng F
inan
ce L
ease
s)
42,0
36
33,1
37
Det
ails
rega
rdin
g cr
eo
t ris
k, l
it1lJ
idity
ris
k an
d m
ark
el
risk,
inc
ludi
ng e
mat
urity
ana
lysi
s of
the
abo
ve p
ayab
ies
are
disc
lose
d in
Nol
e 39
.

PAR
EN
T
2010
$0
00
..3
59
,94
6
359,
946
....
....
....
.?8
,03
5
28,0
35
359,
946
28,0
35
.. ..
.~1,
.7B.
7
429,
768
2009
$0
00 29
.
........
~.~~,.?91.
334,
291
23,8~5
23,8
35
334,
291
23,8
35
43,1
56
401,
282
Sy
dn
ey W
est
Are
a H
ealt
h S
erv
ice
No
tes
to a
nd
fo
rmin
g p
art
of
the
Fin
anci
al S
tate
men
ts
for
the Y
ear
En
ded
30
Jun
e 2
01
0
Pro
visi
on
s
Cu
rren
t E
mp
loy
ee
ben
efit
s an
d r
elat
ed o
n-c
ost
s A
nnua
l L
eave
-S
ho
rtT
erm
Ben
efit
Ann
ual
Lea
ve -
Long
Ter
m B
enef
it Lo
ng S
ervi
ceL
eave
-S
ho
rtT
erm
Ben
efit
Long
Ser
vice
Lea
ve -
Long
Ter
m B
enef
it P
rovi
sion
fo
rPer
sonn
el S
ervi
ces
Liab
ility
To
tal
Cu
rren
t P
rovi
sio
ns
No
n-C
urr
en
t E
mp
loy
ee
ben
efit
s an
d r
elat
ed o
n-c
ost
s
Long
Ser
vice
Lea
ve -
Con
ditio
nal
Pro
visi
on f
orP
erso
nnel
Ser
vice
sLi
abili
ty
To
tal
No
n-c
urr
en
t Pro
visi
on
s
Ag
gre
gat
e E
mp
loy
ee
ben
efit
s an
d r
elat
ed o
n-c
ost
s P
rovl
slon
s .
Cu
rren
t Pr
ovis
ions
-N
on-c
urre
nt
Acc
rued
Sal
arie
s, W
ages
an
d o
n-co
sts
(No
te 2
7)
Taxa
tion
&P
ayro
ll D
educ
tions
A
ccru
ed L
iabi
lity
~ P
urch
ase
of P
erso
nnel
Ser
vice
s (N
ote
27)
CO
NSO
LID
AT
ION
2010
20
09
$000
$0
00
100,
869
96,8
79
55,2
17
56,6
86
9,65
7 11
,792
19
4,20
3 16
8,93
4
359,
946
334,
291
28,0
35
23,8
35
28,0
35
23,8
35
359,
946
334,
291
28,0
35
23,8
35
17,8
58
34,2
79
23,9
29
8,87
7
429,
768
401,
282

PA
RE
NT
Syd
ne
y W
est
Are
a H
ea
lth
Se
rvic
e
No
tes to
an
d f
orm
ing
pa
rt o
f th
e F
ina
ncia
l S
tate
me
nts
fo
r th
e Y
ea
r E
nd
ed
30
Ju
ne
20
10
C
ON
SO
LID
AT
ION
2010
$0
00
2009
$0
00
2010
$0
00
2009
$0
00
30.
Oth
er
Lia
bili
ties
1,79
8 38
2,
045 38
Cu
rre
nt
Inco
me
in A
dvan
ce
Oth
er
1,79
8 38
2,
045 38
1,83
6 2,
083
1,83
6 2,
083
In J
une
2010
, $0
.7 m
illio
n re
pres
ents
ni
ne m
onth
s lic
ence
fee
from
S &
K C
ar P
ark
Man
agem
ent
Ltd
unde
r th
e te
rms
of a
con
trac
t to
prov
ide
and
oper
ate
car
park
faci
lity
at N
epea
n C
ampu
s of
the
Are
a H
ealth
Ser
vice
. P
atie
nt fe
es a
nd o
ther
rep
rese
nt $
1.13
6 m
illio
n of
the
tota
l sum
.
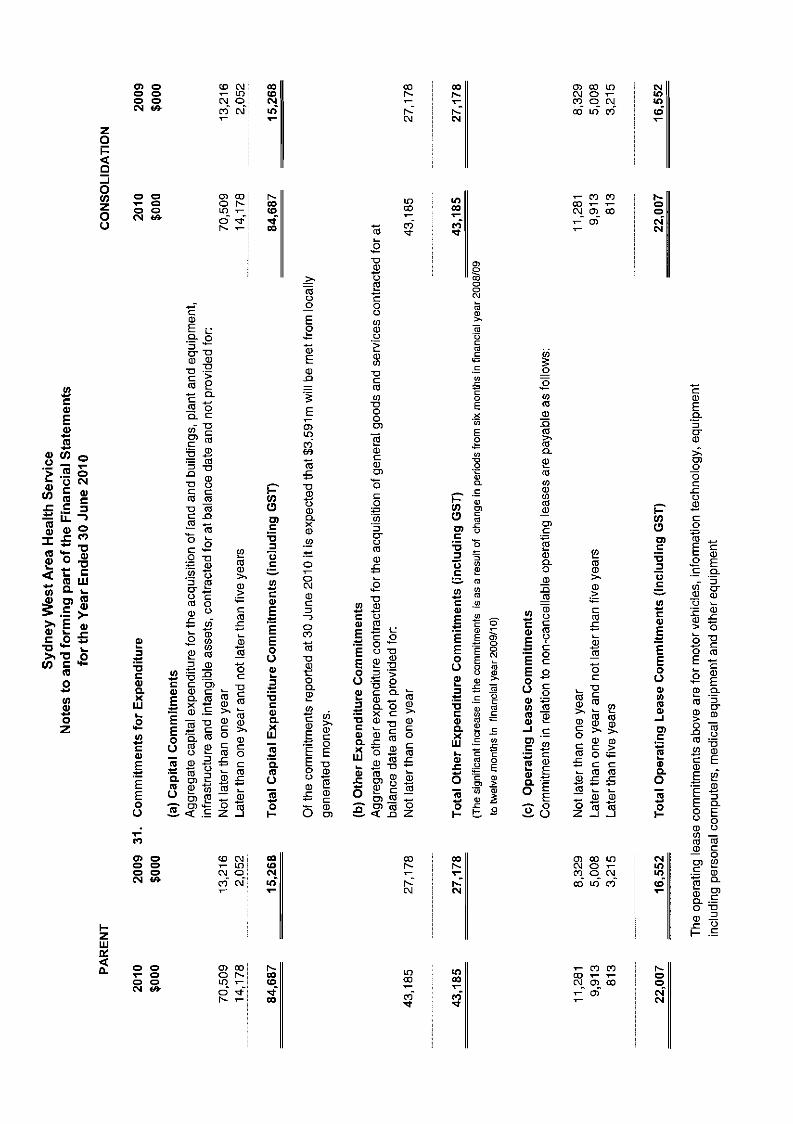
Syd
ne
y W
est
Are
a H
ea
lth
Se
rvic
e
No
tes
to a
nd
fo
rmin
g p
art
of th
e F
ina
ncia
l S
tate
me
nts
fo
r th
e Y
ea
r E
nd
ed
30
Ju
ne
20
10
PA
RE
NT
C
ON
SO
LID
AT
ION
2010
2
00
9
31.
Co
mm
itm
en
ts f
or
Exp
en
dit
ure
20
10
20
09
$0
00
$000
$0
00
$000
70,5
09
1 78
13
,216
2,
052
(a)
Ca
pita
l C
om
mit
me
nts
Agg
rega
te c
apita
l exp
endi
ture
for
the
acqu
isiti
on o
f la
nd a
nd b
uild
ings
, pl
ant
and
equi
pmen
t, in
fras
truc
ture
and
inta
ngib
le a
sset
s, c
ontr
acte
d fo
r at
bal
ance
dat
e an
d no
t pro
vide
d fo
r:
Not
late
r th
an o
ne y
ear
Late
r tha
n on
e ye
ar a
nd n
ot la
ter
than
five
yea
rs
70,5
09
1 78
13
,216
2,
052
84,6
87
15,2
68
Tot
al C
ap
ital E
xpe
nd
itu
re C
om
mit
me
nts
(in
clu
din
g G
ST
) 84
,687
15
,268
Of t
he c
omm
itmen
ts r
epor
ted
at 3
0 Ju
ne 2
010
it is
exp
ecte
d th
at $
3.59
1 m
will
be
met
from
loca
lly
gene
rate
d m
oney
s.
43,1
85
27,1
78
(b)
Oth
er
Exp
en
ditu
re C
om
mit
me
nts
A
ggre
gate
oth
er e
xpen
ditu
re c
ontr
acte
d fo
r th
e ac
quis
ition
of g
ener
al g
oods
and
ser
vice
s co
ntra
cted
for
at
bala
nce
date
and
not
pro
vide
d fo
r:
Not
late
r th
an o
ne y
ear
43,1
85
27,1
78
43,1
85
27,1
78
Tot
al O
the
r E
xpe
nd
itu
re C
om
mit
me
nts
(in
clu
din
g G
ST
)
(The
sig
nific
ant
incr
ease
in
the
com
mitm
en
ts
is a
s a
resu
lt of
ch
an
ge
in p
erio
ds f
rom
six
mon
ths
in fi
nanc
ial y
ear
20
08
/09
to t
wel
ve m
onth
s in
fin
anci
al y
ear
2009
/1 0
)
43,1
85
27,1
78
(c)
Op
era
ting
Lea
se C
om
mit
me
nts
C
omm
itmen
ts in
rel
atio
n to
non
-can
cella
ble
oper
atin
g le
ases
are
pay
able
as
follo
ws:
11,2
81
9,91
3 8
13
8,32
9 5,
008
3,21
5
Not
late
r tha
n on
e ye
ar
Late
r tha
n on
e ye
ar a
nd n
ot la
ter
than
five
yea
rs
Late
r tha
n fiv
e ye
ars
11,2
81
9,91
3 8
13
8,32
9 5,
008
3,21
5
22,0
07
16,5
52
Tot
al O
pe
ratin
g L
ease
Co
mm
itm
en
ts (
incl
ud
ing
GS
T)
22,0
07
16,5
52
The
ope
ratin
g le
ase
com
mitm
ents
abo
ve a
re fo
r m
otor
veh
icle
s, in
form
atio
n te
chno
logy
, eq
uipm
ent
incl
udin
g pe
rson
al c
ompu
ters
, m
edic
al e
quip
men
t and
oth
er e
quip
men
t

PA
RE
NT
2010
$0
00
4,91
3 15
,556
26
5
20,7
34
3,68
4 .
1,88
5
15,1
65
4,47
7 10
,475
21
3
15,1
65
4,47
7 10
,688
15,1
65
Syd
ne
y W
est
Are
a H
ea
lth
Se
rvic
e
No
tes t
o a
nd
fo
rmin
g p
art
of
the
Fin
an
cia
l S
tate
me
nts
fo
r th
e Y
ea
r E
nd
ed
30
Ju
ne
20
10
CO
NS
OLI
DA
TIO
N
2009
$0
00
31.
Co
mm
itm
en
ts f
or
Exp
en
dit
ure
(C
ontin
ued)
(d)
Fin
an
ce L
ease
Co
mm
itm
en
ts
Min
imum
leas
e pa
ymen
t com
mitm
ents
in r
eiat
ion
to fi
nanc
e le
ases
are
pay
able
as
foiio
ws:
2010
$0
00
2009
$0
00
4,83
5 14
,268
6,
442
Not
late
r th
an o
ne y
ear
Late
r tha
n on
e ye
ar a
nd n
ot la
ter
than
five
yea
rs
Late
r tha
n fiv
e ye
ars
4,91
3 15
,556
26
5
4,83
5 14
,268
6,
442
. ----
--
---
---
25,5
45
Min
imu
m L
ease
Pa
yme
nts
(in
clu
din
g G
ST
) 20
,734
25
,545
4,37
7
.. ?,~??
Less
: F
utur
e F
inan
ce C
harg
es
Less
: G
ST
....
........
........
.....
3,68
4
1,88
5
4,37
7
............
....... ?
,}??
18,8
46
Pre
sen
t V
alue
of
min
imu
m le
ase
pa
yme
nts
(e
xclu
din
g G
ST
) 15
,165
18
,846
3,70
3 12
,521
2,
622
18,8
46
3,70
3 15
,143
18,8
46
The
pre
sen
t va
lue
of f
ina
nce
lea
se c
om
mit
me
nts
is a
s fo
llow
s:
Not
late
r th
an o
ne y
ear
Late
r th
an o
ne y
ear
and
not l
ater
than
fiv
e ye
ars
Late
r th
an f
ive
year
s
Pre
sen
t V
alue
of
min
imu
m le
ase
pa
yme
nts
(e
xclu
din
g G
ST
)
Cla
ssif
ied
as:
(a
) C
urre
nt
(Not
e 28
) (b
) N
on-C
urre
nt
(Not
e 28
)
4,47
7 10
,475
21
3
3,70
3 12
,521
2,
622
15,1
65
18,8
46
4,47
7 10
,688
3,
703
15,1
43
15,1
65
18,8
46
Fin
ance
Lea
se c
omm
itmen
t is
in r
espe
ct o
f H
awke
sbur
y P
rivat
e H
ospi
tal c
omm
ence
d in
Aug
ust
1996
. The
te
rm o
f the
leas
e is
twen
ty y
ears
at
whi
ch ti
me
the
owne
rshi
p of
the
butld
lnqs
tr
ansf
ers
to th
e N
SW
Sta
te G
over
nmen
t
(e)
Co
nti
ng
en
t Ass
et
Rel
ated
to
Co
mm
itm
en
ts f
or
Exp
en
dit
ure
T
he t
otal
of
"Com
mitm
ents
for
Exp
endi
ture
" ab
ove,
i.e.
$16
5.04
4 m
illio
n as
at 3
0 Ju
ne 2
010
13,6
25
5,36
3 in
clud
es i
nput
tax
cred
its o
f $13
.625
M t
hat
are
expe
cted
to
be r
ecov
erab
le f
rom
13
,625
5,
363
the
Aus
tral
ian
Tax
atio
n O
ffice
.

Syd
ne
y W
est
Are
a H
ea
lth S
erv
ice
N
ote
s to
an
d f
orm
ing
par
t o
f th
e F
inan
cial
Sta
tem
ents
fo
r th
e V
ea
r E
nd
ed
30
Jun
e 2
010
PA
RE
NT
AN
D C
ON
SO
LID
AT
ION
32
Tru
st F
un
ds
The
Hea
lth S
ervi
ce h
olds
tru
st f
und
mon
eys
of $
18.1
73 m
illio
n w
hich
are
use
d to
r th
e sa
fe k
eepi
ng o
f pa
tient
s' m
onie
s,
depo
sits
on
hire
d ite
ms
of e
quip
men
t an
d P
rivat
e P
ract
ice
Trus
ts.
Th
ese
mon
ies
are
excl
uded
from
th
e fin
anci
al s
tate
men
ts a
s th
e H
ealth
Ser
vice
ca
nn
ot
use
them
for
the
achi
evem
ent o
f its
obj
ectiv
es.
The
fol
low
ing
is a
sum
mar
y of
the
tran
sact
ions
in
the
trus
t acc
ount
:
Pat
ien
t T
rus
t R
efu
nd
ab
le
Dep
osi
ts
Pri
vate
Pra
ctic
e T
rust
Fu
nd
s T
ota
l
2010
$0
00
2009
$0
00
2010
$000
2009
$0
00
2010
$0
00
2009
$0
00
2010
$000
2009
$0
00
Cas
h B
alan
ce a
t the
beg
inni
ng
of th
e fin
anci
al r
epor
ting
perio
d 1,
076
1,20
1 1,
886
1,05
1 13
,700
14
,009
16
,662
16
,261
Rec
eipt
s 11
53
7 37
2 1,
191
71,8
28
68,5
51
72,2
11
70,2
79
Exp
endi
ture
(9
27)
(662
) (2
54)
(356
) (6
9,51
9)
(68,
860)
(7
0,70
0)
(69,
878)
Cas
h B
alan
ce a
t the
end
of
the
finan
cial
rep
ortin
g pe
riod
160
1,07
6 2,
004
1,88
6 16
,009
13
,700
18
,173
16
,662

33
Sydney West Area Health Service
Notes to and forming part of the Financial Statements for the Year Ended 30 June 2010
PARENT AND CONSOLIDATED
Contingent Liabilities
a) Claims on Managed Fund
Since 1 July 1989, the Health Service has been a member of the NSW Treasury Managed Fund. The Fund will pay to or on behalf of the Health Service all sums which it shall become legally liable to pay by way of compensation or legal liability if sued except for employment related, discrimination and harassment claims that do not have statewide implications. The costs relating to such exceptions are to be absorbed by the Health Service. As such, since 1 July 1989, apart from the exceptions noted above no contingent liabilities exist in respect of liability claims against the Health Service. A Solvency Fund (now called Pre-Managed Fund Reserve) was established to deal with the insurance matters incurred before 1 July 1989 that were above the limit of insurance held or for matters that were incurred prior to 1 July 1989 that would have become verdicts against the State. That Solvency Fund will likewise respond to all claims against the Health Service.
b) Workers Compensation Hindsight Adjustment
Treasury Managed Fund normally calculates hindsight premiums each year. However, in regard to workers compensation the final hindsight adjustment for the 2003/04 fund year and an interim adjustment for the 2005/06 fund year were not calculated until 2009/10. As a result, the 2004/05 final and 2006/07 interim hindsight calculations will be paid in 2010/11. It is not possible for the Health Service to reliably quantify the benefit to be received.
c) Affiliated Health Organisations
Based on the definition of control in Australian Accounting Standard AASB127, Consolidated and Separate Financial Statements, Affiliated Health Organisations listed in Schedule 3 of the Health Services Act, 1997 are only recognised in the Health Service's consolidated financial statements to the extent of cash payments made.
However, it is accepted that a contingent liability exists which may be realised in the event of cessation of health service activities by any Affiliated Health Organisation. In this event the determination of assets and liabilities would be dependent on any contractual relationship which may exist or be formulated between the administering bodies of the organisation, the Health Service and the NSW Department of Health.

Syd
ne
y W
est
Are
a H
ea
lth
Se
rvic
e
No
tes to
an
d f
orm
ing
pa
rt o
f th
e F
ina
ncia
l S
tate
me
nts
fo
r th
e Y
ea
r E
nd
ed
30
Ju
ne
20
10
PA
RE
NT
C
ON
SO
LID
AT
ION
2010
$0
00
2009
$0
00
2010
$0
00
2009
$0
00
34.
Re
con
cilia
tio
n o
f N
et C
ash
Flo
ws
fro
m O
pe
ratin
g A
ctiv
itie
s T
o N
et C
ost
of S
erv
ice
s
(104
,535
) 78
,645
5,
084
29,8
56
8,93
6 5,
503
1,66
9 1,
611,
926
42,8
51
(80,
558)
76
,460
3,
428
33,8
80
22,6
81
(8,5
01)
13,0
64
1,53
4,14
2 83
,535
Net
Cas
h F
low
s fr
om O
pera
ting
Act
iviti
es
Dep
reci
atio
n P
rovi
sion
for
Dou
btfu
l Deb
ts
Acc
epta
nce
by th
e C
row
n E
ntity
of
Em
ploy
ee S
uper
annu
atio
n B
enef
its
Dec
reas
e/(I
ncre
ase)
in P
rovi
sion
s In
crea
se /
(Dec
reas
e) i
n P
repa
ymen
ts a
nd O
ther
Ass
ets
(Inc
reas
e)/
Dec
reas
e in
Cre
dito
rs
Net
Gai
n/ (
Loss
) on
Sal
e of
Pro
pert
y, P
lant
and
Equ
ipm
ent
NS
W H
ealth
Dep
artm
ent
Rec
urre
nt A
lloca
tions
N
SW
Hea
lth D
epar
tmen
t C
apita
l Allo
catio
ns
(104
,535
) 78
,645
5,
084
21,5
26
29,8
56
8,93
6 5,
503
1,66
9 1,
611,
926
42,8
51
(80,
558)
76
,460
3,
428
22,0
60
33,8
80
22,6
81
(8,5
01)
13,0
64
1,53
4,14
2 83
,535
1,67
9,93
5 1,
678,
131
Net
Co
st o
f Se
rvic
es
1,70
1,46
1 1,
700,
191
35.
2009
/10
Vo
lun
tary
Se
rvic
es
It is
con
side
red
impr
actic
able
to
quan
tify
the
mon
etar
y va
lue
of v
olun
tary
ser
vice
s pr
ovid
ed to
the
Hea
lth S
ervi
ce.
Ser
vice
s pr
ovid
ed in
clud
e:
Cha
plai
ncie
s an
d P
asto
ral C
are
. P
ink
Ladi
es/H
ospi
tal A
uxili
arie
s P
atie
nt S
uppo
rt G
roup
s
Com
mun
ity O
rgan
isat
ions
-
Pat
ient
& F
amily
Sup
port
P
atie
nt S
ervi
ces,
Fun
d R
aisi
ng
Pra
ctic
al S
uppo
rt to
P
atie
nts
and
Rel
ativ
e C
ouns
ellin
g, H
ealth
Edu
catio
n, T
rans
port
, H
ome
Hel
p &
Pat
ient
Act
iviti
es

Sydney West Area Health Service Notes to and forming part of the Financial Statements
for the Year Ended 30 June 2010
PARENT AND CONSOLIDATED
36 Unclaimed Moneys
Unclaimed salaries and wages are paid to the credit of the NSW Treasury in accordancewith the provisions 01 the IndusfrialRelationsAct,1996.
All money andpersonaleffects01 patientswhich are lell in the custodyof HealthServices by any patientwho is dischargedor dies in the hospitaland which are not claimed by the person lawfullyentitled theretowithin a period 01 twelve months are recognisedas the property01 healthservices.
All such money and the proceedsat the realisation01any personaleffectsare lodgedto the creon 01 theSamaritan Fundwhich is usedspecifically for the benelit 01 necessitouspatientsor necessitousoutgoingpatients.
37 Budget Review· Parent and Consolidated
Net Cost of Services
The actual Net cost of Services result reflects the ongoinghigh level of patientactivity and the increaseddemandpressuretor services lhroughout2009,!10. The total expenditurevarianceto budqetwas impactedby lho increaseddemand evident in the high levels of operatingexpenditurefor lhe year. particularly in patient care expenditures inclUding payments to visiting medical officers,medicaland surgical supplies as well as specialservices type payments. The increased demandpressure lor services also continued10exceedthe allowance lor cost escalation receivedduring lhe year. The total positive revenuevariance10 budgel rellected the increasesevidenl in palienllees and user charges throughouttheyear which continue10 rellect the ongoinghigh prioritystill being assigned to ensuringme maximumgenerationof revenue throughoutall local units olthe Area HealthService. The Revenueresult continues10onsetsomewhat the ever-increasingdemandpressures evident in expenditureeach year.
Result for the Year
The result for theyear has significantly improved when comparedto the result for the financial year ended30 June 2009. The NCQSyear-end result revealed the ongoingpressure01increaseddemand on expenditureincludingincreases in operatingcosts lor theyear. This was partly offset by lhe level 01 revenue favourabilitytobudgel wilh the levels of revenuecontinuingto grow eachyear. The expenditureresult was again impactedupon by activity noting the levels 01 acute admissionsand emergency attendancesprevalentduringthe year.
Assets and Liabilities
The variation to budgetfor current assets was impactedby the (radlngresult for theyear and notably evident in the cash resultwith the receivablesvariance due to the increasedfocus on debtors lollow-up throughthe year. Currentessets wero affectedby a reclassification of propertyheld for sale from being a non current to a current assetwith the non current assets result in line with budqet. The variation to budget for currentliabililies also reueceo the trading result being impactedby thehigh level of expenditureassociatedwith the increasedlevels of activity with the provisionsvariations impactedby the eclusunent of leave enlitlementslor award increases. The non current liabilities result was impactedby valuation adjustmentsin compliancewith the accountingstandards requirements.
Cash Flows
Movements in the level of lhe NSW Departmentof Heallh RecurrentAllocation thathave occurredsince the time of the initial allocationon 16June 2009 are as renews:
'$000
Initial Allocation, 16June 2009 1,363,912 Award Increases B27 Special Projects
Severe Chronic DiseaseProgram 1,538 Caring TogetherInitiatives 3,010 KeepThem Sale Funding 1,106 CQAG NationalPartnershipsSub Acute Care Reform 1,789 Various Mental HealthProjects 4,059 AIDS andRelated ProjectEnhancements 1,080 Drug & AlcoholServices 1,638 Commonwealltl YouthHealth 843 Organ & Tissue Donation Funding 510
Treasury ManagedFundsBudgetAdjustment 2,113 17,686 Other
2009,!1 0 Voluntary Redundancy 16,731 Planned Surgery 6,000 Aubum Satelllle Dialysis Unit 842 Home Dialysis Fluid Funding 596 2009,!10 NationalSpecialtyCentre - Pancreas Transplants 2,658 Nurse/Midwile Strategy 2,458 CerebrovascularEmbolisation(CVE) of Cerebral AneurysmServices 1,750 Positron EmissionTomography(PET) Services, Westmead Hospital 1,400 Matemity Enhancement Funding 952 Adult VDO andChild HomeVentilationFunding 599 nuerstareArea PatientFlows 130.878 MiscellaneousNCOS Funding 63,930 228,882
Balanceas per Statementof ComprehensiveIncome 1,811,307

Syd
ney
Wes
t A
rea
Hea
lth S
ervi
ce
No
tes
toan
dfo
rmin
g p
arto
fth
e Fi
nanc
ialS
tate
men
ts
for
the
Yea
r E
nded
30
June
201
0
38 I
ncr
ease
/(D
ecre
ase)
in
Net
As
se
ts f
rom
Eq
uit
y T
ran
sfe
rs
Net
Ass
ets
of $
(20.
336)
Mill
ion
tran
sfer
red
from
Syd
ney
Wes
t A
rea
Hea
lth S
ervi
ce a
s a
resu
lt of
th
e tr
ansf
er o
f F
ood
and
War
ehou
se S
erv
ice
s to
Hea
lfh S
uppo
rt
and
the
tran
sfer
o
fPat
holo
gyS
ervi
ces
from
Gre
ater
Wes
tern
Are
aH
ealth
Ser
vice
and
Gre
ater
Sou
ther
n A
rea
Hea
lthS
ervi
ceas
wel
las
the
tran
sfer
ofL
and
toO
ther
G
over
nmen
tA
genc
ies
atw
hich
tim
eS
ydne
y W
estA
rea
Hea
lthS
ervi
cere
cogn
ised
aba
lanc
e o
f$(2
0.33
6) M
illio
n. A
sset
s an
dlia
bilit
ies
tran
sfer
red
are
as fo
llow
s:
$000
A
sset
s
Inve
ntor
y 34
P
lant
&
Equ
ipm
ent
(371
) La
nd
(20,
227)
P
repa
ymen
t 57
Lia
bil
itie
s
Ann
ual
Lea
ve P
rovi
sion
75
L
.S. L
Lea
ve P
rovi
sion
96
Incr
ease
/(D
ecre
ase)
in
Net
As
se
ts F
rom
Eq
uit
y T
ran
sfe
rs
(20,
336)

Sydney West Area Health Service Notes to and forming part of the Financial Statements
for the Year Ended 30 June 2010
39 Financial Instruments
The Health Service's principal financial instruments are outlined below. These financial instruments arise directly from the Health Service's operations or are required to finance its operations. The Health Service does not enter into or trade financial 'Instruments, including derivative financial instruments, for speculative purposes.
The Health Service's main risks arising from financial instruments are outlined below, together with the Health Service's objectives, policies and processes for measuring and managing risk. Further quantitative and qualitative disclosures are included throughout these financial statements.
The Chief Executive has overall responsibility for the establishment and oversight of risk management and reviews and agrees policies for managing each of these risks. Risk management policies are established to identify and analyse the risk faced by the Health Service, to set risk limits and controls and monitor risks. Compliance with policies is reviewed by the Audit Committee/lnternal auditors on a continous basis.
(a) Financial Instrument Categories
PARENT AND CONSOLIDATION
Financial Assets Carrying Carrying Class: Category Amount Amount
2010 2009 $000 $000
Cash and Cash Equivalents (note 19) N/A 141,851 109,154 Receivables (note 20)1 Loans and receivables 38,159 55,067
(at amortised cost)
Other Financial Assets (note 22) Loans and receivables 3,259 (at amortised cost)
Total Financial Assets 183,269 164,221
Financial Liabilities
Financial liabilities Borrowings (note 28) 57,201 51,983measured at
Payables (note 27)2 amortised cost 122,300 128,296
Total Financial Liabilities 179,501 180,279
Notes 1. Excludes statutory receivables andprepayments (le notwithin scopeofAASB 7)
2. Excludes statutory payables andunearned revenue (ie not within scopeofAASB 7)
(b) Credit Risk Credit risk arises when there is the possibility of the Health Service's debtors defaulting on their contractual obligations, resulting in a financial loss to the Health Service. The maximum exposure to credit risk is generally represented by the carrying amount of the financial assets (net of any allowance for impairment).

Sydney West Area Health Service
Notes to and forming part of the Financial Statements
for the Year Ended 30 June 2010
Credit risk arises from financial assets of the Health Service, including cash, receivables and authority deposits. ND collateral is held by the Health Service. The Health Service has not granted any financial guarantees.
Credit risk associated with the Health Services's financial assets, other than receivables, is managed through the selection of counterparfies and establishment of minimum credit rating standards. Authority deposits held with NSW TCDrp are guaranteed by the State.
Cash Cash comprises cash on hand and bank balances deposited in accordance with Public Authorities (Financial Arrangements) Act approvals. Interest is earned on daily bank balances at rates of approximateiy 4.82% in 2009110 compared to 6.78% in the previous year.
Receivables· trade debtors Ail trade debtors are recognised as amounts receivable at balance date. Couectability of trade debtors is reviewed on an onqolnq basis. Procedures as established in the NSW Department of Health Accounting Manual and Fee Procedures Manual are followed to recover outstanding amounts, including letters of demand. Debts which are known to be uncollectable are written off, An allowance for impairment is raised when there is objective evidence that the Heaith Service will not be able to collect ail amounts due. This evidence includes past experience and current and expected changes in economic conditions and debtor credit ratings. ND interest is earned on trade debtors,
The Heaith Service is not materially exposed to concentratlons of credit risk to a single trade debtor Dr group of debtors, Of the tota! trade debtors at year end, $21.211 M (2009: $11.964M) related tD debtors that were not past due and not considered impaired and debtors of $5.137M (2009:$13.707M) were past due but not considered impaired. Toqethsr these represent 69.04% (2009: 46.64%) of the totai trade debtors. The Receivables include Patient Fees Compensables which are frequently nDt settled within 6 months of the date of the service provision due tD the length of time it takes to settle legal claims. Most of the Health Services' debtors are Health Insurance Companies Dr Compensation Insurers settling claims in respect of inpatient treatments. There are no debtors which are currently not past due Dr or impaired whose terms have been renegotiated.
The only financial assets that are past due or impaired could be either 'sales of gDDdsand services' Dr other debtors' in the 'receivables' catsqory of the Statement of Financial Posltlon, Patient Fees Ineligibles may represent the majority of financial assets that are past due or impaired.
$000 2010 Total 1.2 Past due but not impaired 1.2 Considered impaired 1,2
<3 months overdue 5,137 5,137
3 months - 6 months overdue 4,492 4,492
> 6 months overdue 7,319 1,073 6,246
2009 <3 months overdue 13,707 13,707
3 months - 6 months overdue 19,451 19,451
> 6 months overdue 9,945 6,420 3,525
Notes
1. Each column in the table reports "gross receivables".
2. The ageing analysis excludes statutory receivables, as these are not within the scope of AASB 7 and excludes receivables that are not past due and not impaired. Therefore, the "total" wiil not reconcile to the receivables total recoqnised in the statement of financial position.
Sydney West Area Health Service Notes to and forming part of the Financial Statements
forthe Year Ended 30 June 2010 (c) Liquidity Risk
Liquidity risk is the risk that the Health Service will be unable to meet its payment obligations when they fall due. The Health Service continuously manages risk through monitoring future cash flows and maturities planning to ensure adequate holding of high quality liquid assets. The objective is to maintain a balance between continuity of funding and flexibility through effective management of cash, investments and liquid assets and liabilities.
The Health Service has negotiated no loan outside of arrangements with the NSW Department of Health or the Sustainable Energy Deveiopment Authority.
During the current and prior years, there were no defauits or breaches on any loans payable. No assets have been pledged as collateral. The Health Service's exposure to liquidity risk is considered significant. However, the risk is minimised as the NSW Department of Health has indicated its ongoing financial support for the Sydney West Area Health Service (refer Note 2).
The liabilities are recognised for amounts due to be paid in the future for goods or services received, whether or not invoiced. Amounts owing to suppliers (which are unsecured) are settled in accordance with the policy set by the NSW Department of Health. If trade terms are not specified, payment is made no later than the end of the month following the month in which an invoice or a statement is received.
In those instances where settlement cannot be effected in accordance with the above, eg due to short term liquidity constraints, terms of payment are negotiated with creditors.
The table below summarises the maturity profile of the Health Service's financial liabilities together with the interest rate exposure.
/ I

Syd
ney
Wes
t A
rea
Hea
lth S
ervi
ce
Not
es t
o an
d fo
rmin
g pa
rt o
f the
Fin
anci
al S
tate
men
ts
for
the
Yea
r E
nded
30
June
201
0
Mat
urity
Ana
/ysi
s an
d in
tere
st ra
te e
xpos
ure
of f
inan
cia/
liabi
litie
s
$'00
0 In
tere
st R
ate
Exp
osu
re
Mat
uri
ty D
ates
W
eig
hte
d
Ave
rag
e F
ixed
V
aria
ble
N
on
-E
ffec
tive
In
t.
No
min
al
Inte
rest
In
tere
st
Inte
rest
R
ate
Am
ou
nt
1 R
ate
Rat
e B
eari
ng
<
1 Y
r 1·
5 Y
r >
5Y
r
%
$000
$0
00
$000
$0
00
$000
$0
00
$000
20
10
Pay
able
s:
Acc
rued
Sal
arie
s 17
,858
17
,858
17
,858
W
ages
, O
n-C
osts
and
Pay
roll
Ded
uctio
ns
3,47
1 3,
471
3,47
1 C
redi
tors
10
0,97
1 10
0,97
1 10
0,97
1 B
orro
win
gs:
Non
Int
eres
t Lo
ans
23,3
07
23,3
07
18,0
98
4,23
2 97
7 O
ther
Loa
ns a
nd D
epos
its
5.50
%
21,8
40
21,8
40
8,97
3 12
,689
17
8 F
inan
ce L
ease
s 6.
60%
18
,849
18
,849
4,
467
14,1
42
240
186,
296
21,8
40
18,8
49
145,
607
153,
838
31,0
63
1,39
5 20
09
Pay
able
s:
Acc
rued
Sal
arie
s 34
,279
34
,279
34
,279
W
ages
, O
n-C
osts
and
Pay
roll
Ded
uctio
ns
167
167
167
Cre
dito
rs
93,8
50
93,8
50
93,8
50
Bor
row
ings
: N
on-I
nter
est
Loan
s 5,
383
5,38
3 3,
091
2,29
2 O
ther
Loa
ns a
nd D
epos
its
6.30
%
30,9
95
30,9
95
9,15
5 21
,816
24
F
inan
ce L
ease
s 6.
70%
23
,245
23
,245
4,
396
12,9
71
5,87
8 18
7,91
9 30
,995
23
,245
13
3,67
9 14
4,93
8 37
,079
5,
902
Not
es:
1 T
he
amou
nts
disc
lose
d ar
eth
e co
ntra
ctua
l un
disc
ount
ect c
ash
flO'N
S o
f eac
h c
lass
of f
inan
cial
lia
bilit
ies
base
d o
nth
e ea
rlies
t d
ate
on
whi
ch t
he
Hea
lth S
ervi
ce c
an b
ere
quire
d to
pay.
Th
e ta
bles
inc
lude
bot
h in
tere
st a
nd
prin
cipa
l cas
h flo
ws
and
ther
efor
e w
ill n
ot r
econ
cile
toth
eS
tate
men
t O
f Fin
anci
al P
ositi
on.
2.O
fth
e$1
1,10
8 di
sclo
sed
inth
e20
10 'o
ther
loan
san
dde
posi
ts't
ime
band
1-5
yrs
, th
eH
ealth
Ser
vice
has
no
inte
ntto
effe
ctpa
ymen
tsin
adva
nce
ofm
atur
ityda
tes
ono
rprio
rto

Sydney West Area Health Service Notes to and forming part of the Financial Statements
for the Year Ended 30 June 2010 d) Markel Risk
Market risk is the risk that the fair value of future cash flows of a financial instrumentwill fluctuate because of changes in market prices. The Health Service's exposure to market risk are primarily through interest rate risk on the Health Service's borrowings. The Health has no exposure to foreign currency risk and does not enter into commoditycontracts.
The effect on profit and equity due to a reasonably possible change in risk variable is outlined in the information below,for interest rate risk and other price risk. A reasonably possiblechange in risk variable has been determined after taking into account the economic environment in which the Health Service operates and the time frame for the assessment (l.e. until the end of the next annual reporting period). The sensitivityanalysis is based on risk exposures in existence at the Statement of Financial Position date. The analysis is performed on the samebasis for 2009. The analysis assumes that all other variables remainconstant.
e) Interest rate risk
Exposure to interest rate risk arises primarily through the Health Service's interest bearing liabilities.
However, Health Services are not permittedto borrow external to the NSW Department of Health (Sustainable Energy DevelopmentAuthority loans which are negotiatedthrough Treasury excepted). Both SEDA and NSW Department of Health loans are set at fixed rates and therefore are generallynot alJectedby fluctuations in market rates.The Health Service does not account for any fixed rate financial instruments at fair value through profit or loss or as available-far-sale. Therefore, for these financial instruments, a change of interest rates 'NOu\d not affect profit or loss or equity. A reasonably possiblechange of +1-1 % is used consistent with current trends in interest rates. The basis will be reviewed annually and amendedINhere there is a structural change in the level of interest rate volatility. The Health Service's exposure to interest rate risk is set out below.
$'000
2010 Financial assets
Cash and cash equivalents
Other financial assets
Financial liabilities
Finance Lease
2009 Financial assets
Cash and cash equivalents
Financial liabilities
Finance Lease
-1% +1% Carrying Amount
Profit Equity Profit Equity
141,651
3,259
18,849 188 188 - 188 - 188
109,154
23,245 232 232 - 232 - 232
, / / "

Sydney West Area Health Service Notes to and forming part of the Financial Statements
for the Year Ended 30 June 2010
(f) Fair Value recognised in the Statement of Financial Position
Financial instrumenls are generally recognised at cost. The amortised cost of financial instruments recognised in the balancesheet approximates the fair value because of the short term nature of many of the financial instruments.
40 Post Balance Date Events
On 20 April 2010 the State of NSW and the Commonwealth agreed on national health reforms to establish Local Health Networks in NSW and to introduce national standards for timelyaccess to emergencycare and elective surgery.
Under the Agreement. NSW will remain responsible for system-wideplanning, performanceand purchasingof public hospital services and supporting the transition process for the CommonwealUl to assume full funding and policy responsibility for general practice, primaryhealth care and Ule nationalaged care system.
This agreement \Nil! result in structural and corporate changes including the establishmentof these Local Health Networks in 2010-11. A professional GoverningCouncil \Nil! be constituted for each Local Health Network. It is expected that these reforms will significantly change this reportingentity.
END OF AUDITED FINANCIAL STATEMENTS
.,r l