Embed Size (px)
Citation preview
STATE OF THE U.S.AUTOMOTIVE INDUSTRY
2017
INVESTMENT, INNOVATION, JOBS, EXPORTS, AND AMERICA’S ECONOMIC COMPETITIVENESS
OCTOBER 2017
TABLE OF CONTENTS
3 ACKNOWLEDGEMENTS
4 INTRODUCTION
5 EXECUTIVE SUMMARY
5 Automakers drive the U.S. economy.
5 FCA US, Ford, and General Motors are in the driver’s seat.
5 Automakers are investing to make America more competitive.
6 Every state is an “auto state.”
6 Automakers’ investments are contributing to the revival of manufacturing in America.
6 In a globally competitive auto industry, public policy matters.
7 AUTOMAKERS CONTRIBUTE A GREAT DEAL TO AMERICA’S ECONOMY, BUT FCA US, FORD, AND
GENERAL MOTORS CONTRIBUTE MORE THAN OTHERS
7 Scale of the auto industry
8 Automakers as job multipliers
9 FCA US, Ford, and General Motors production rate
10 The difference: Eight new U.S. assembly plants producing a line of new cars 6,700 miles long
11 America’s biggest exporters
12 AUTOMAKERS ARE INVESTING TO MAKE AMERICA MORE COMPETITIVE
12 Capital investment, global
13 FCA US, Ford, and General Motors capital investments in the U.S.
14 Research & development
16 Automaker jobs
17 EVERY STATE IS AN “AUTO STATE”
17 The auto supply chain
18 A steep curve on “domestic content”
19 The difference: Dozens of new U.S. supplier plants producing 1.5 million cars’-worth-of-parts
20 OUR INVESTMENTS ARE CONTRIBUTING TO THE REVIVAL OF MANUFACTURING ACROSS AMERICA
20 Auto sales, production, and employment rebound
21 Production shifting to U.S.
22 IN AN INDUSTRY AS COMPETITIVE AND CAPITAL-INTENSIVE AS AUTOS, PUBLIC POLICY MATTERS
23 International safety standards
24 Currency manipulation
2
CASE STUDY
CASE STUDY
ACKNOWLEDGEMENTS
This report, the fourth of its kind from the American Automotive Policy Council, is meant to serve as a resource for policymakers, researchers, and media interested in the state of automotive manufacturing in America and what leadership in this industry means for our nation’s economic competitiveness.
The bulk of figures presented here are derived from simple comparisons of each automaker’s production,
sales, employment, and parts purchases in the U.S. and abroad. These figures are obtained from each
automaker’s respective annual reports and corporate websites, as well as reports produced by several
of the industry’s trade groups. For more information about how automakers contribute to America’s
economy and our global competitiveness, visit our website at www.americanautocouncil.org or the
website of the Alliance of Automotive Manufacturers at www.autoalliance.org. For information on
America’s automotive parts suppliers and their contribution to America’s economy, we rely on analysis
produced by the Motor & Equipment Manufacturers Association (www.mema.org).
Most of the critical analysis cited in the report has been produced by the Center for Automotive Research
(CAR), a nonprofit organization focused on a wide variety of important trends related to the automobile
industry and society at the international, federal, state, and local levels. CAR’s Sustainability & Economic
Development Strategies (SEDS) group focuses on the intersection of industry and the public sector. Its
Automotive Communities Partnership helps state and local officials develop public policies that sustain
auto communities. We rely heavily on CAR’s “job multiplier” analysis; sales, production, and employment
forecasts; estimates of automaker spending on research and development and capital investment; and
analysis of the reach and nature of a typical plant’s supply chain. More information about CAR, SEDS, and
the Automotive Communities Partnership is available at www.cargroup.org.
For data on corporate research and development, we rely on the European Commission’s Joint Research
Centre’s 2016 EU Industrial R&D Investment Scoreboard, which contains economic and financial data
for the world’s top 2,500 companies, ranked by their investments in research and development. The
rankings also include data on employment, revenue, and capital investment. The data are drawn from each
company’s financial statements. The rankings and related materials are available at http://iri.jrc.ec.europa.
eu/scoreboard16.html.
3
INTRODUCTION
This report examines the current state of the U.S. automotive sector and its share of America’s manufacturing production, capital investment, innovation, and jobs.
We make five points:
1. Automakers contribute a great deal to America’s economy, but FCA US, Ford, and General Motors
contribute more than others.I
2. Automakers are doing their share to make America more competitive.
3. Every state is an “auto state.”
4. Their investments are contributing to the revival of manufacturing in America.
5. In an industry as capital intensive and competitive as autos, public policy matters.
In making these points, we explain how production, investment, and employment have rebounded since
the financial crisis and are likely to grow through 2017. As part of this, we examine how highly efficient
manufacturers, like those in the U.S., can benefit from the industry’s shift toward centralized production
and global model platforms.
We also compare the economic contributions of America’s automakers – FCA US, Ford, and General
Motors – with those of their competitors. While most car buyers appreciate just how many U.S. workers
FCA US, Ford, and General Motors employ, this report explains why so much of their global workforce is
based here.
Finally, we examine how the highly competitive nature of the industry – and the enormous fixed costs that
go into producing cars and trucks – combine to give public policy decisions an enormous impact on which
automakers grow and where auto jobs are created.
The long-term success of any American automotive facility, whether an assembly plant or research lab,
depends, in part, on how international public policies, including those relating to currency manipulation
and automotive safety standards, affect an automaker’s ability to compete internationally. AAPC and its
members are optimistic about the future of auto manufacturing in America and all of the research, design,
finance, marketing, and other related jobs that this industry generates.
4
Automakers drive the U.S. economy.Automakers and their suppliers are America’s largest manufacturing sector, responsible for 3% of
America’s GDP.II No other manufacturing sector generates as many American jobs.III
They are also America’s largest exporters. In fact, over the past five years, automakers have exported
more than $690 billion in vehicles and parts – approximately $76 billion more than the next largest
exporter (aerospace).IV
Not only are they America’s largest exporters, they also buy hundreds of billions of dollars worth of
American steel, glass, rubber, iron, and semiconductors each year. They are also among America’s largest
investors in R&D. The auto sector ranks third out of the forty largest industries, on a global basis, in R&D
spending.V
FCA US, Ford, and General Motors are in the driver’s seat.FCA US, Ford, and General Motors produce more of their vehicles, buy more of their parts, and conduct
more of their R&D in the U.S. than their competitors. As a result, they employ nearly two out of three of
America’s autoworkers and operate three out of five of America’s auto assembly plants.
Perhaps the best way to appreciate the scale of FCA US, Ford, and General Motors’s investment in the
U.S. is to consider what would happen if foreign automakers matched their U.S. production and parts
purchases rates. The answer? To match FCA US, Ford, and General Motors’s U.S. production rate last year,
their competitors would have had to assemble more than 2.2 million more cars and trucks here in the U.S.
Lined up bumper-to-bumper, those cars would stretch more than 6,700 miles.VI To match FCA US, Ford,
and General Motors’s domestic content rate, they would have had to buy another 1.5 million more cars’-
worth-of-parts here.VII
Automakers are investing to make America more competitive.Over the past five years alone, FCA US, Ford, and General Motors have announced investments of
more than $35 billion in their U.S. assembly, engine and transmission plants, R&D labs, headquarters,
administrative offices, and other infrastructure that connects and supports them.VIII
Globally, FCA, Ford, and General Motors, together, invest more than $18 billion in R&D every year.IX Each
alone spends more on R&D than some of the world’s most famous technology companies.X
5
EXECUTIVE SUMMARY
Every state is an “auto state.” Last year, FCA US, Ford, and General Motors produced 6.6 million vehicles in the U.S., with the help of
more than 245,000 employees, working at more than 220 assembly plants, manufacturing facilities,
research labs, distribution centers, and other facilities, located in 32 states across 115 Congressional
Districts. They work with more than 10,150 dealerships, which employ another 609,000 U.S. workers.
Nationwide, FCA US, Ford, and General Motors’s thousands of auto suppliers employ more than 871,000
U.S. workers.
Automakers’ investments are contributing to the revival of manufacturing in America.U.S. auto sales have increased by more than 67% since the 2009 financial crisis (from 10.4 million to 17.5
million last year). CAR projects sales will exceed 17 million vehicles per year through 2022. Meanwhile, U.S.
auto production has more than doubled during that same period (from 5.6 million vehicles in 2009 to 12.2
million vehicles in 2016). U.S. auto production is expected to exceed 12 million vehicles per year through
2019 – and reach 13 million by 2020.XI
Automaker and auto supplier employment in the U.S. increased by nearly one-half from 2011 through 2016,
adding nearly 130,000 U.S. jobs. FCA US, Ford, and General Motors account for the majority of that job
growth.XII
An industry-wide move toward global model platforms has helped automakers centralize production in
high functioning markets, like the U.S., which can now export the same body frame or major component to
assembly facilities around the world.XIII
In a globally competitive auto industry, public policy matters.Because the auto industry is so competitive, the profit margin on each vehicle is comparatively small.
Because producing cars and trucks is so capital-intensive, automakers must maintain scale to remain
cost-competitive. For these reasons, international public policies, including those relating to currency
manipulation and automotive safety standards and their effects on international trade, have an enormous
impact on each automaker’s competitive status.
6
Scale of the auto industryLast year, Americans bought more than 17.5 million cars and trucks. Over 12.2 million cars and trucks were
produced at one of America’s 46 automotive assembly plants. Lined up end-to-end, the cars and trucks
assembled in the U.S. would stretch 36,700 miles, enough to extend from the Statue of Liberty to the
Golden Gate Bridge twelve and a half times.XIV
A typical auto plant requires between $1 and $2 billion in start-up capital investment and employs
2,000 to 3,000 workers. Each assembly plant job supports nearly 7 other jobs at suppliers and in the
surrounding community.XV While plant output varies, a single plant producing 200,000 vehicles each year
can contribute nearly $6 billion to America’s gross domestic product.XVI
Each vehicle these plants assemble contains 8,000 to 12,000 different components (and as many as
15,000 individual parts).XVII More than 5,600 suppliers produce auto parts in the U.S.XVIII Together, they
employ more than 871,000 U.S. workers.XIX
The components in a typical car or truck contain more than 3,000 pounds of iron, steel, rubber, and glass.
Because of the size of each vehicle – and the number of vehicles made each year – automakers are also
among the largest buyers of those American raw materials.XX
Designing each of those 15,000 parts and integrating them into a single vehicle is an enormous
engineering challenge. Automakers and suppliers spent more than $20 billion on R&D in the U.S. last year
– about $1,150 per vehicle sold here.XXI
Distributing, marketing, selling, and servicing those vehicles employs hundreds of thousands of other U.S.
workers. FCA US, Ford, and General Motors alone rely on more than 10,150 dealerships, which employ
approximately 609,000 U.S. workers.
7
AUTOMAKERS CONTRIBUTE A GREAT DEAL TO AMERICA’S ECONOMY, BUT FCA US, FORD, AND GENERAL MOTORS CONTRIBUTE MORE THAN OTHERS.
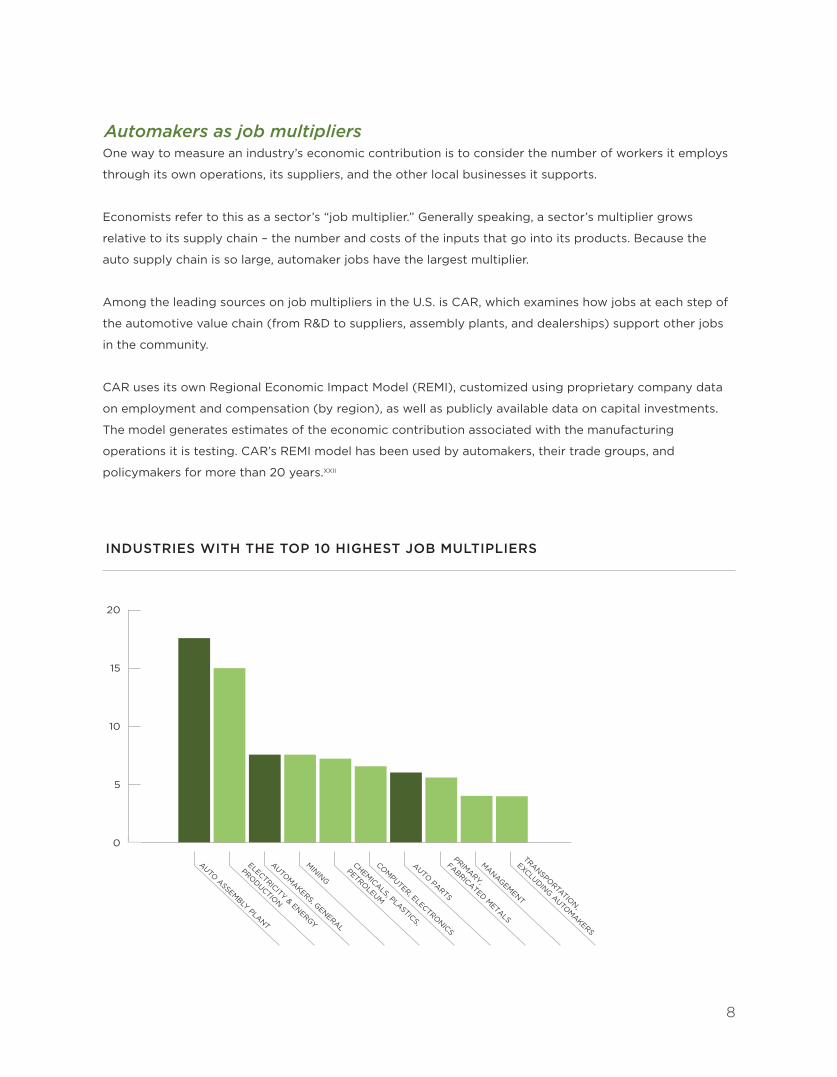
One way to measure an industry’s economic contribution is to consider the number of workers it employs
through its own operations, its suppliers, and the other local businesses it supports.
Economists refer to this as a sector’s “job multiplier.” Generally speaking, a sector’s multiplier grows
relative to its supply chain – the number and costs of the inputs that go into its products. Because the
auto supply chain is so large, automaker jobs have the largest multiplier.
Among the leading sources on job multipliers in the U.S. is CAR, which examines how jobs at each step of
the automotive value chain (from R&D to suppliers, assembly plants, and dealerships) support other jobs
in the community.
CAR uses its own Regional Economic Impact Model (REMI), customized using proprietary company data
on employment and compensation (by region), as well as publicly available data on capital investments.
The model generates estimates of the economic contribution associated with the manufacturing
operations it is testing. CAR’s REMI model has been used by automakers, their trade groups, and
policymakers for more than 20 years.XXII
Automakers as job multipliers
0
5
10
15
20
I N D U S T R I E S W I T H T H E T O P 1 0 H I G H E S T J O B M U L T I P L I E R S
AUTO ASSEMBLY PLANT
ELECTRICITY & ENERGY
PRODUCTION
AUTOMAKERS, GENERAL
MINING
CHEMICALS, PLASTICS,
PETROLEUM
COMPUTER, ELECTRONICS
AUTO PARTS
MANAGEMENT
TRANSPORTATION,
EXCLUDING AUTOMAKERS
PRIMARY,
FABRICATED METALS
INDUSTRIES WITH THE TOP 10 HIGHEST JOB MULTIPLIERS
8
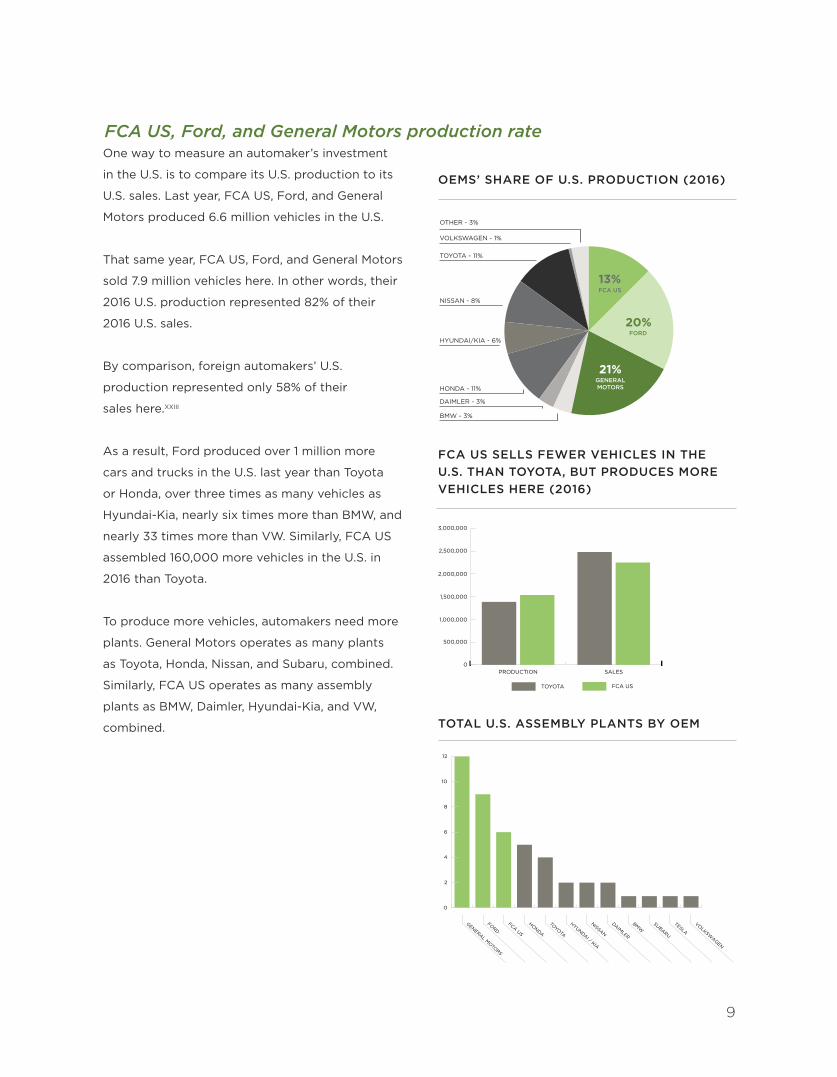
O E M S ’ S H A R E O F U . S . P R O D U C T I O N ( 2 0 1 5 )
BMW - 3%
DAIMLER - 3%
HONDA - 11%
VOLKSWAGEN - 1%
OTHER - 3%
HYUNDAI/KIA - 6%
NISSAN - 8%
TOYOTA - 11%
GENERALMOTORS
FORD
13%FCA US
20%
21%
One way to measure an automaker’s investment
in the U.S. is to compare its U.S. production to its
U.S. sales. Last year, FCA US, Ford, and General
Motors produced 6.6 million vehicles in the U.S.
That same year, FCA US, Ford, and General Motors
sold 7.9 million vehicles here. In other words, their
2016 U.S. production represented 82% of their
2016 U.S. sales.
By comparison, foreign automakers’ U.S.
production represented only 58% of their
sales here.XXIII
As a result, Ford produced over 1 million more
cars and trucks in the U.S. last year than Toyota
or Honda, over three times as many vehicles as
Hyundai-Kia, nearly six times more than BMW, and
nearly 33 times more than VW. Similarly, FCA US
assembled 160,000 more vehicles in the U.S. in
2016 than Toyota.
To produce more vehicles, automakers need more
plants. General Motors operates as many plants
as Toyota, Honda, Nissan, and Subaru, combined.
Similarly, FCA US operates as many assembly
plants as BMW, Daimler, Hyundai-Kia, and VW,
combined.
FCA US, Ford, and General Motors production rate
OEMS’ SHARE OF U.S. PRODUCTION (2016)
TOTAL U.S. ASSEMBLY PLANTS BY OEM
FCA US SELLS FEWER VEHICLES IN THE U.S. THAN TOYOTA, BUT PRODUCES MORE VEHICLES HERE (2016)
0
500,000
1,000,000
1,500,000
2,000,000
2,500,000
3,000,000
FCA USTOYOTA
SALESPRODUCTION
F C A U S S E L L S F E W E R V E H I C L E S I N T H E U . S . T H A N T OYO TA , B U T P R O D U C E S M O R E V E H I C L E S H E R E ( 2 0 1 5 )
9
T O TA L U . S . A S S E M B LY P L A N T S B Y O E M
0
2
4
6
8
10
12
GENERAL MOTO
RS
FORD
FCA US
HONDA
TOYOTA
HYUNDAI / KIA
NISSAN
DAIMLER
BMW
SUBARU
TESLA
VOLKSW
AGEN
10
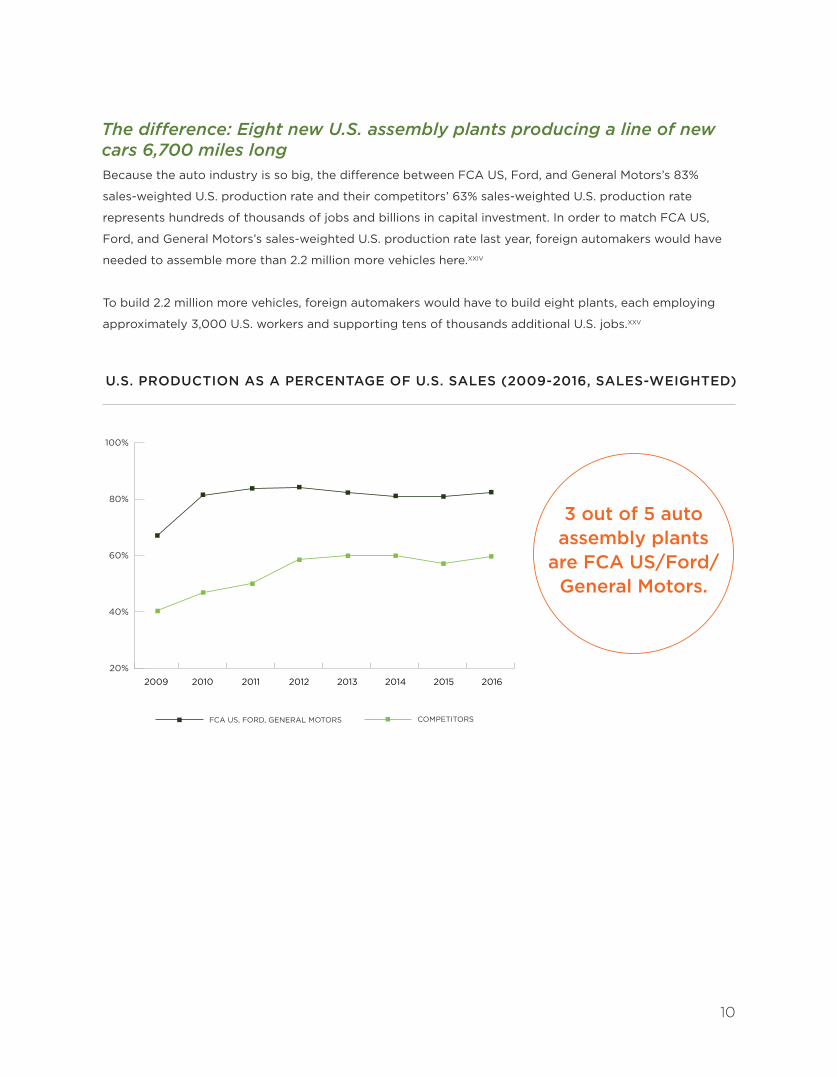
Because the auto industry is so big, the difference between FCA US, Ford, and General Motors’s 83%
sales-weighted U.S. production rate and their competitors’ 63% sales-weighted U.S. production rate
represents hundreds of thousands of jobs and billions in capital investment. In order to match FCA US,
Ford, and General Motors’s sales-weighted U.S. production rate last year, foreign automakers would have
needed to assemble more than 2.2 million more vehicles here.XXIV
To build 2.2 million more vehicles, foreign automakers would have to build eight plants, each employing
approximately 3,000 U.S. workers and supporting tens of thousands additional U.S. jobs.XXV
The difference: Eight new U.S. assembly plants producing a line of new cars 6,700 miles long
U.S. PRODUCTION AS A PERCENTAGE OF U.S. SALES (2009-2016, SALES-WEIGHTED)
U . S . P R O D U C T I O N A S A % O F U . S . S A L E S( 2 0 0 9 - 2 0 1 5 , S A L E S - W E I G H T E D )
20%
40%
60%
80%
100%
COMPETITORSFCA US, FORD, GENERAL MOTORS
2009 2010 2011 2012 2013 2014 2015 2016
3 out of 5 auto assembly plants
are FCA US/Ford/ General Motors.
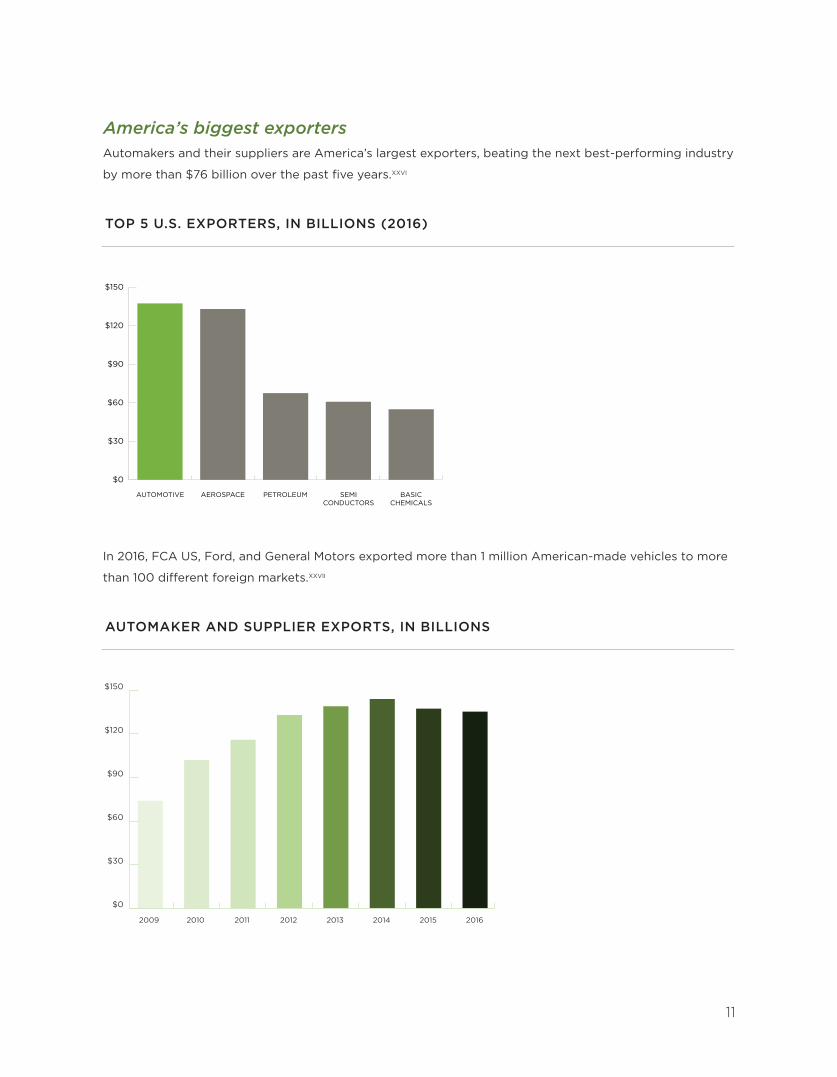
Automakers and their suppliers are America’s largest exporters, beating the next best-performing industry
by more than $76 billion over the past five years.XXVI
In 2016, FCA US, Ford, and General Motors exported more than 1 million American-made vehicles to more
than 100 different foreign markets.XXVII
America’s biggest exporters
TOP 5 U.S. EXPORTERS, IN BILLIONS (2016)
AUTOMAKER AND SUPPLIER EXPORTS, IN BILLIONS
T O P 5 U . S . E X P O R T E R S ( 2 0 1 5 , I N B I L L I O N S )
$0
$30
$60
$90
$120
$150
AUTOMOTIVE AEROSPACE PETROLEUM SEMICONDUCTORS
BASICCHEMICALS
A U T O M A K E R A N D S U P P L I E R E X P O R T S ( I N B I L L I O N S )
2009 2010 2011 2012 2013 2015 20162014
$0
$30
$60
$90
$120
$150
11
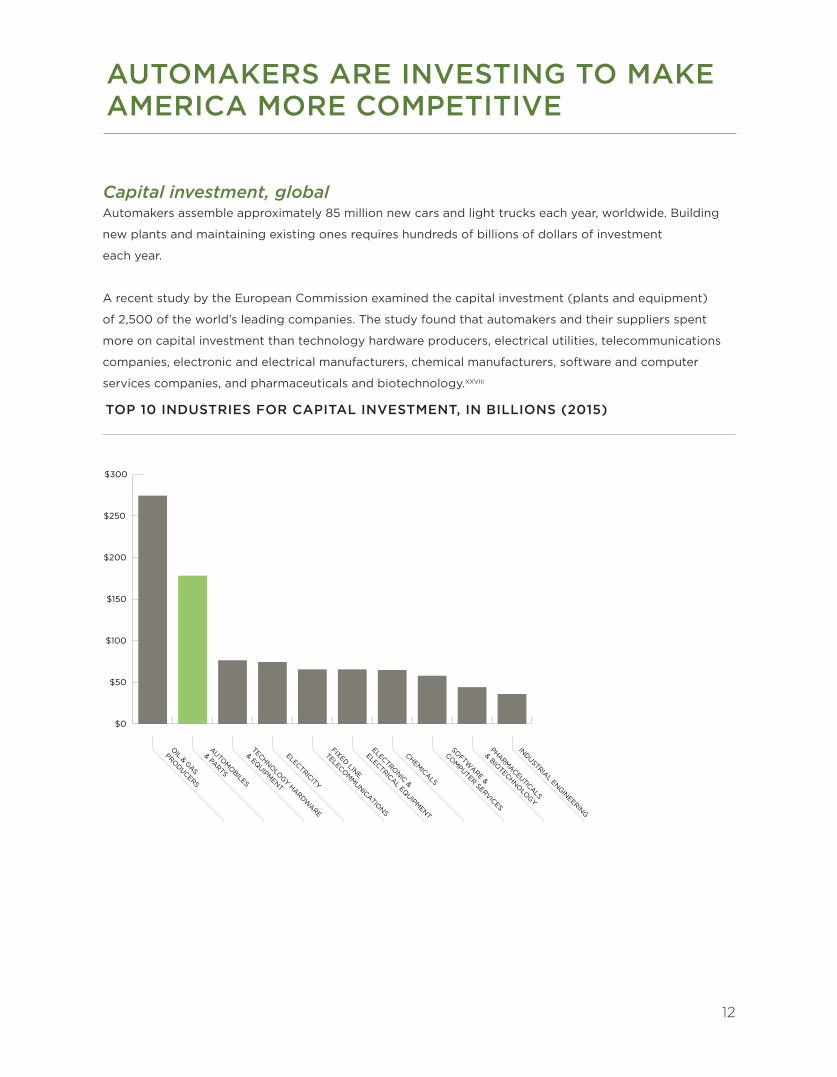
Automakers assemble approximately 85 million new cars and light trucks each year, worldwide. Building
new plants and maintaining existing ones requires hundreds of billions of dollars of investment
each year.
A recent study by the European Commission examined the capital investment (plants and equipment)
of 2,500 of the world’s leading companies. The study found that automakers and their suppliers spent
more on capital investment than technology hardware producers, electrical utilities, telecommunications
companies, electronic and electrical manufacturers, chemical manufacturers, software and computer
services companies, and pharmaceuticals and biotechnology.XXVIII
Capital investment, global
TOP 10 INDUSTRIES FOR CAPITAL INVESTMENT, IN BILLIONS (2015)T O P 1 0 I N D U S T R I E S F O R C A P I TA L I N V E S T M E N T,
I N B I L L I O N S ( 2 0 1 4 )
$0
$50
$100
$150
$200
$250
$300
OIL & GAS
PRODUCERS
AUTOM
OBILES
& PARTS
TECHNOLO
GY HARDWARE
& EQUIPM
ENT
CHEMICALS
ELECTRONIC &
ELECTRICAL EQUIPM
ENT
ELECTRICITY
FIXED LINE
TELECOM
MUNICATIO
NS
SOFTW
ARE &
COM
PUTER SERVICES
PHARMACEUTICALS
& BIOTECHNO
LOGY
INDUSTRIAL ENGINEERING
12
AUTOMAKERS ARE INVESTING TO MAKE AMERICA MORE COMPETITIVE
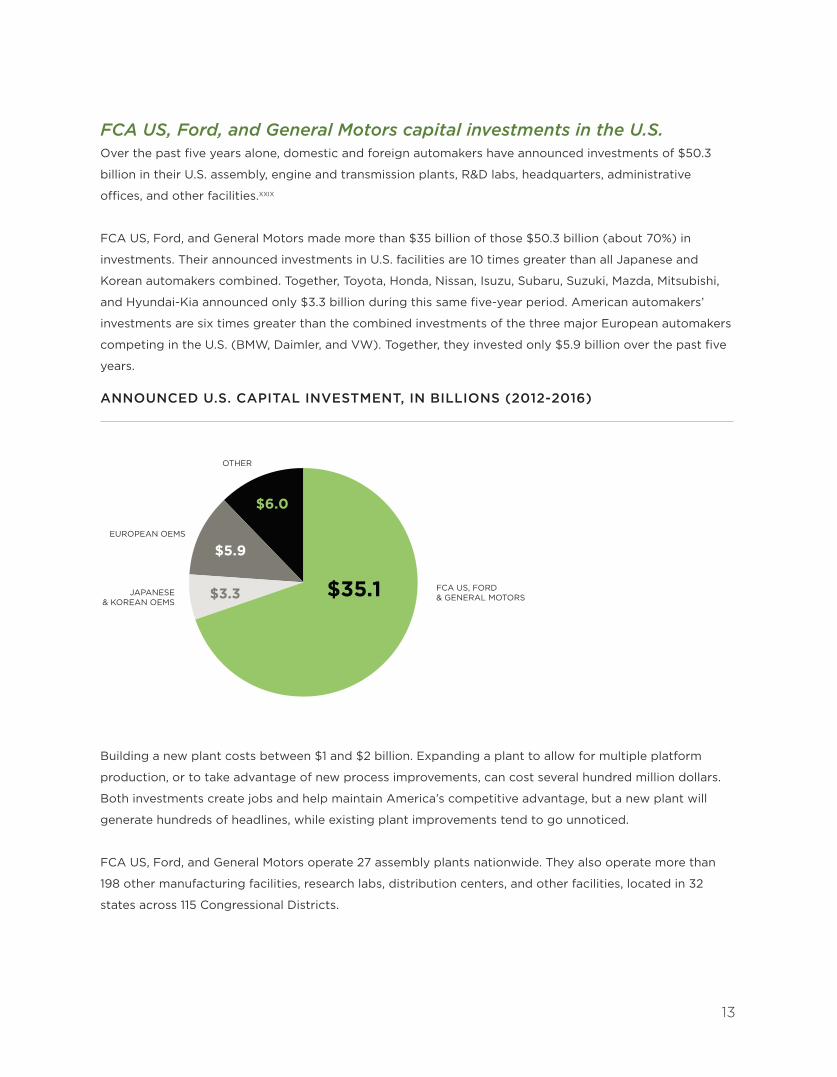
Over the past five years alone, domestic and foreign automakers have announced investments of $50.3
billion in their U.S. assembly, engine and transmission plants, R&D labs, headquarters, administrative
offices, and other facilities.XXIX
FCA US, Ford, and General Motors made more than $35 billion of those $50.3 billion (about 70%) in
investments. Their announced investments in U.S. facilities are 10 times greater than all Japanese and
Korean automakers combined. Together, Toyota, Honda, Nissan, Isuzu, Subaru, Suzuki, Mazda, Mitsubishi,
and Hyundai-Kia announced only $3.3 billion during this same five-year period. American automakers’
investments are six times greater than the combined investments of the three major European automakers
competing in the U.S. (BMW, Daimler, and VW). Together, they invested only $5.9 billion over the past five
years.
FCA US, Ford, and General Motors capital investments in the U.S.
ANNOUNCED U.S. CAPITAL INVESTMENT, IN BILLIONS (2012-2016)U . S . C A P I TA L I N V E S T M E N T, I N B I L L I O N S ( 2 0 0 9 - 2 0 1 4 )
FCA US, FORD& GENERAL MOTORS$35.1$3.3
$5.9
$6.0
JAPANESE& KOREAN OEMS
EUROPEAN OEMS
OTHER
FCA US, FORD& GENERAL MOTORS
JAPANESE& KOREAN OEMS
EUROPEAN OEMS
OTHER
13
Building a new plant costs between $1 and $2 billion. Expanding a plant to allow for multiple platform
production, or to take advantage of new process improvements, can cost several hundred million dollars.
Both investments create jobs and help maintain America’s competitive advantage, but a new plant will
generate hundreds of headlines, while existing plant improvements tend to go unnoticed.
FCA US, Ford, and General Motors operate 27 assembly plants nationwide. They also operate more than
198 other manufacturing facilities, research labs, distribution centers, and other facilities, located in 32
states across 115 Congressional Districts.
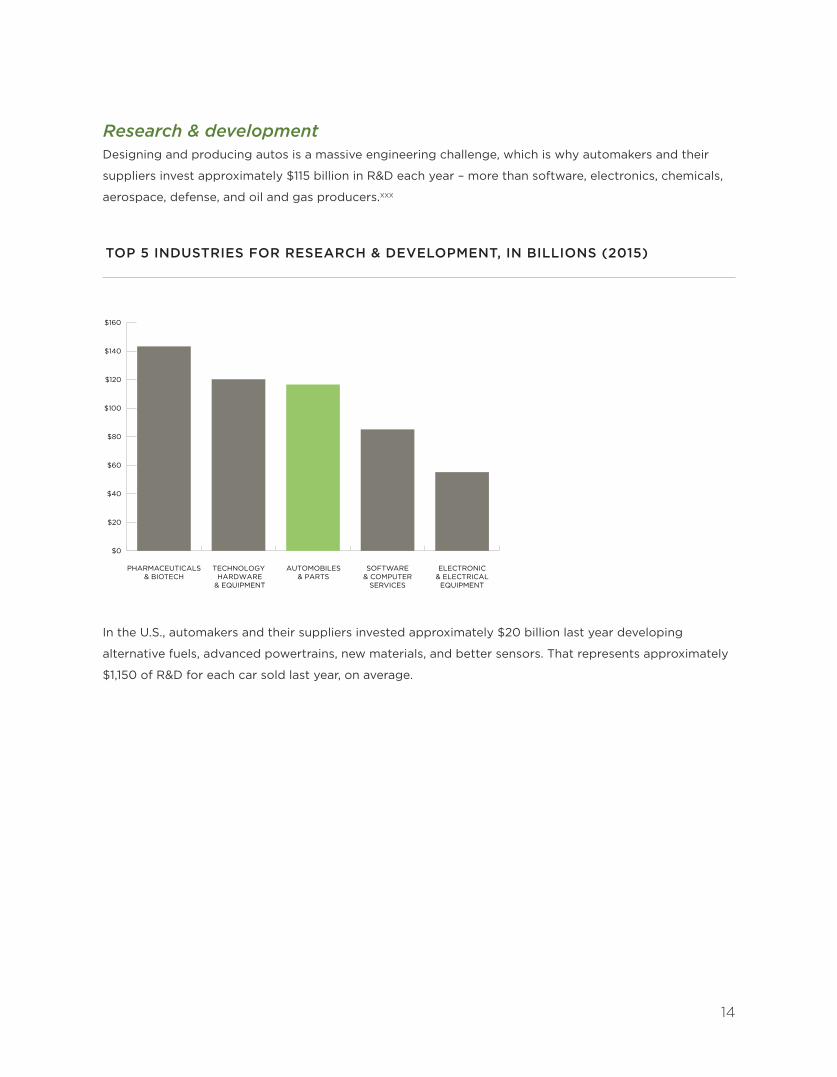
Designing and producing autos is a massive engineering challenge, which is why automakers and their
suppliers invest approximately $115 billion in R&D each year – more than software, electronics, chemicals,
aerospace, defense, and oil and gas producers.XXX
Research & development
TOP 5 INDUSTRIES FOR RESEARCH & DEVELOPMENT, IN BILLIONS (2015)T O P F I V E I N D U S T R I E S F O R R & D S P E N D I N G
( 2 0 1 4 , I N B I L L I O N S )
$0
$20
$60
$80
$40
$100
$120
$160
$140
PHARMACEUTICALS& BIOTECH
TECHNOLOGY HARDWARE
& EQUIPMENT
AUTOMOBILES& PARTS
SOFTWARE& COMPUTER
SERVICES
ELECTRONIC& ELECTRICAL
EQUIPMENT
14
In the U.S., automakers and their suppliers invested approximately $20 billion last year developing
alternative fuels, advanced powertrains, new materials, and better sensors. That represents approximately
$1,150 of R&D for each car sold last year, on average.
To appreciate the scale and significance of auto R&D, consider several findings from CAR’s recent
report, “Just How High-Tech is the Automotive Industry?” For example: a new smart phone contains one
microprocessor, while a new car or truck contains about 60. These microprocessors manage 100 or more
sensors located throughout the vehicle, connected by as much as a mile of wiring. Just as important, a
microprocessor in a smart phone is expected to last about three years, while autos are expected to last 12
years or more.XXXI
Over the past decade, automaker R&D has driven braking technology from anti-lock brakes (which help a
driver brake faster) to electronic stability control (which keeps a vehicle moving safely when the driver
has lost control), to experimental automated emergency steering systems (which control braking, steering,
and throttle functions).XXXII
Meanwhile, research into the use of new materials, better joining (welding, fasteners, adhesives), and
fabrication could reduce a vehicle’s body weight by 10% to 20% by 2020.XXXIII
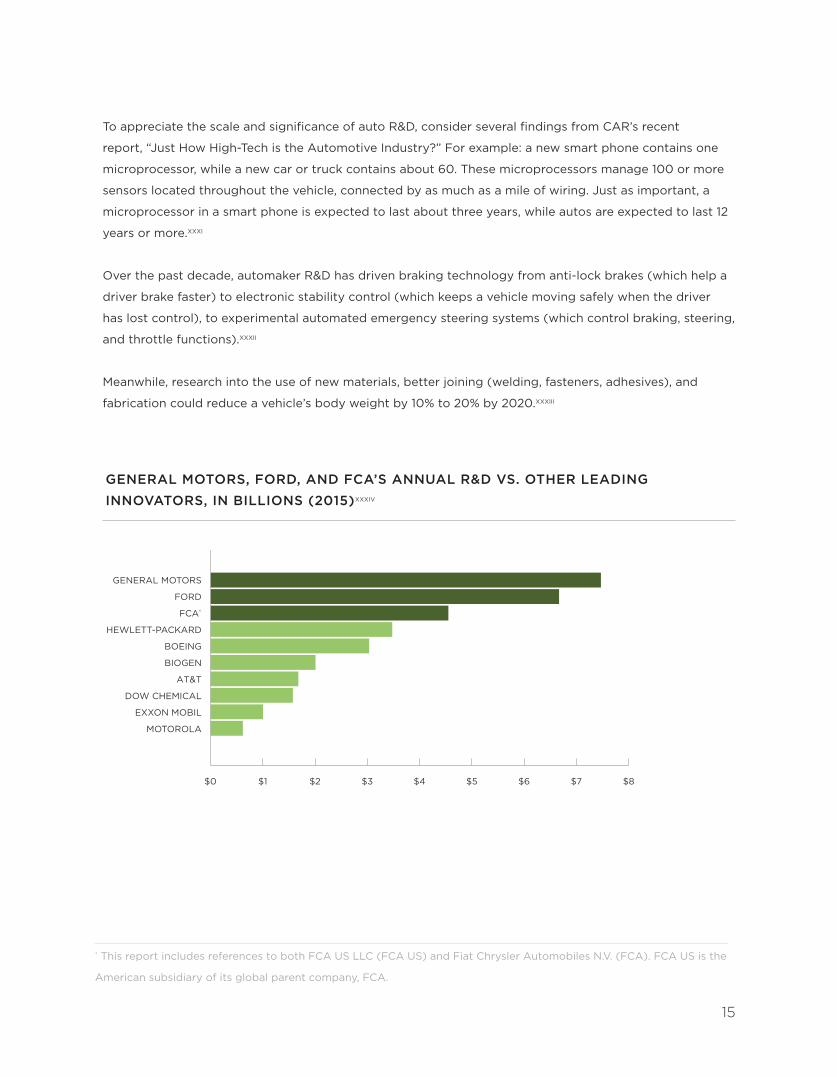
GENERAL MOTORS, FORD, AND FCA’S ANNUAL R&D VS. OTHER LEADING INNOVATORS, IN BILLIONS (2015)XXXIV
G E N E R A L M O T O R S , F O R D A N D F C A’ S A N N U A L R & DV S . O T H E R L E A D I N G I N N O VAT O R S
( 2 0 1 4 , I N B I L L I O N S )
GENERAL MOTORS
FORD
FCA†
HEWLETT-PACKARD
BOEING
DOW CHEMICAL
BIOGEN
AT&T
MOTOROLA
EXXON MOBIL
$0 $1 $2 $3 $4 $5 $6 $7 $8
15
† This report includes references to both FCA US LLC (FCA US) and Fiat Chrysler Automobiles N.V. (FCA). FCA US is the
American subsidiary of its global parent company, FCA.
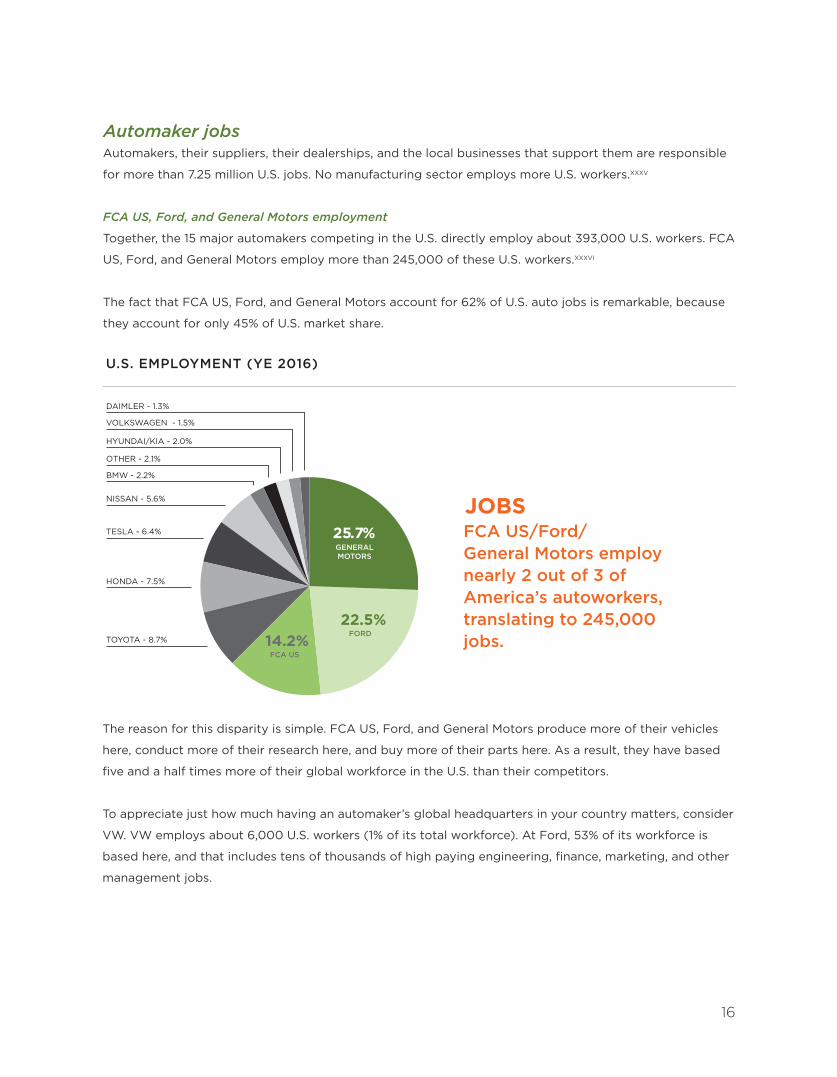
Automakers, their suppliers, their dealerships, and the local businesses that support them are responsible
for more than 7.25 million U.S. jobs. No manufacturing sector employs more U.S. workers.XXXV
FCA US, Ford, and General Motors employment
Together, the 15 major automakers competing in the U.S. directly employ about 393,000 U.S. workers. FCA
US, Ford, and General Motors employ more than 245,000 of these U.S. workers.XXXVI
The fact that FCA US, Ford, and General Motors account for 62% of U.S. auto jobs is remarkable, because
they account for only 45% of U.S. market share.
Automaker jobs
U.S. EMPLOYMENT (YE 2016)
DAIMLER - 1.3%
VOLKSWAGEN - 1.5%
HYUNDAI/KIA - 2.0%
BMW - 2.2%
NISSAN - 5.6%
TESLA - 6.4%
TOYOTA - 8.7%
OTHER - 2.1%
HONDA - 7.5%
FCA US
FORD
25.7%GENERALMOTORS
22.5%14.2%
U . S . E M P L O Y M E N T( Y E 2 0 1 5 )
FCA US/Ford/ General Motors employ nearly 2 out of 3 of America’s autoworkers, translating to 245,000 jobs.
JOBS
16
The reason for this disparity is simple. FCA US, Ford, and General Motors produce more of their vehicles
here, conduct more of their research here, and buy more of their parts here. As a result, they have based
five and a half times more of their global workforce in the U.S. than their competitors.
To appreciate just how much having an automaker’s global headquarters in your country matters, consider
VW. VW employs about 6,000 U.S. workers (1% of its total workforce). At Ford, 53% of its workforce is
based here, and that includes tens of thousands of high paying engineering, finance, marketing, and other
management jobs.
More than 5,600 auto parts suppliers operate in the U.S.XXXVII Together, they employ more than
871,000 U.S. workers.XXXVIII
Approximately two-thirds of every vehicle’s parts content is produced by suppliers. For every worker
employed by an automaker, two and a half other workers are employed by parts suppliers.
Many supplier jobs are in R&D. In fact, suppliers account for approximately 40% of the auto R&D
conducted in the U.S. each year.XXXIX
Auto suppliers are the biggest reason why every state is an “auto state.” For example, 220 U.S. auto
suppliers manufacture parts for hybrid, plug-in hybrid, and electric battery vehicle components. They
operate across 23 different states.XL
A state that hosts one or more assembly plants can support more than 100 different suppliers. For
example, Texas and California host 106 and 160, respectively.
FCA US, Ford, and General Motors’s national footprint
For their part, FCA US, Ford, and General Motors operate more than 200 assembly plants, manufacturing
facilities, research labs, distribution centers, and other facilities, directly employing more than 245,000
U.S. workers. These facilities are located in 32 states across 115 Congressional Districts. FCA US’s, Ford’s,
and General Motors’s 10,150 auto dealerships employ more than 609,000 additional U.S. workers.
17
EVERY STATE IS AN “AUTO STATE”
The auto supply chain
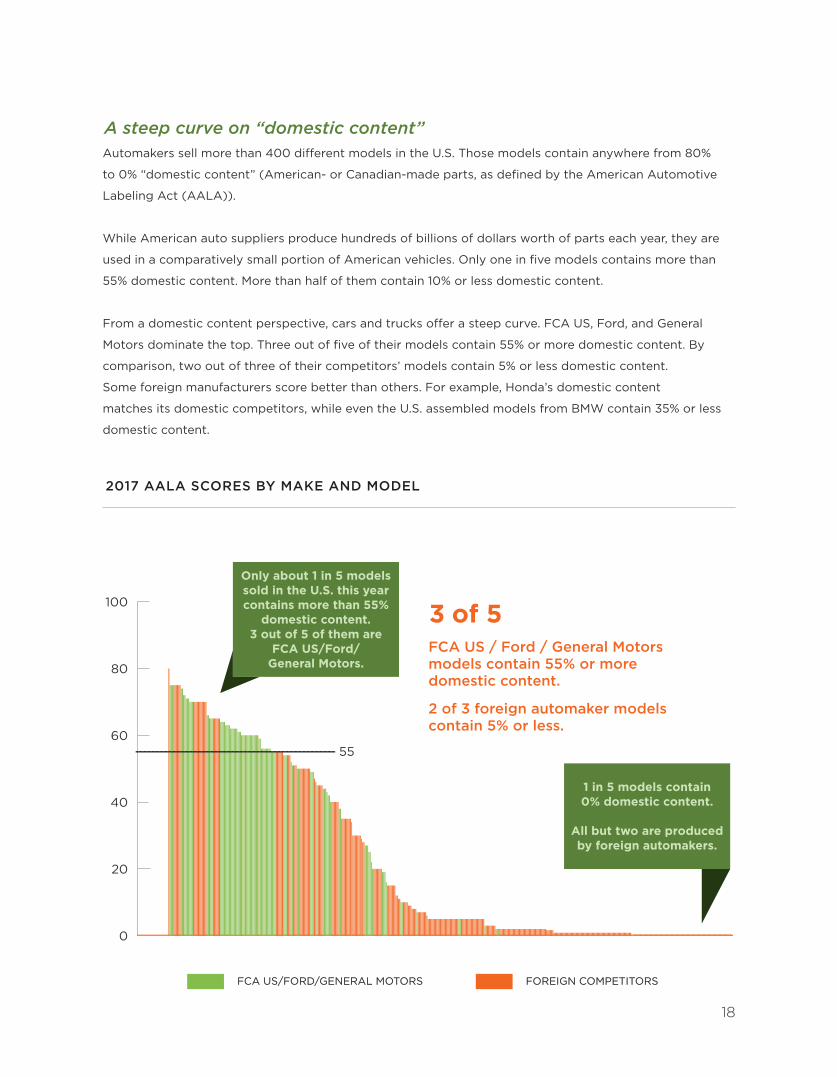
Automakers sell more than 400 different models in the U.S. Those models contain anywhere from 80%
to 0% “domestic content” (American- or Canadian-made parts, as defined by the American Automotive
Labeling Act (AALA)).
While American auto suppliers produce hundreds of billions of dollars worth of parts each year, they are
used in a comparatively small portion of American vehicles. Only one in five models contains more than
55% domestic content. More than half of them contain 10% or less domestic content.
From a domestic content perspective, cars and trucks offer a steep curve. FCA US, Ford, and General
Motors dominate the top. Three out of five of their models contain 55% or more domestic content. By
comparison, two out of three of their competitors’ models contain 5% or less domestic content.
Some foreign manufacturers score better than others. For example, Honda’s domestic content
matches its domestic competitors, while even the U.S. assembled models from BMW contain 35% or less
domestic content.
A steep curve on “domestic content”
FCA US/FORD/GENERAL MOTORS
0
20
40
80
100
FOREIGN COMPETITORSFCA US/FORD/GENERAL MOTORS FOREIGN COMPETITORS
6055
FCA US / Ford / General Motors models contain 55% or more domestic content. 2 of 3 foreign automaker models contain 5% or less.
3 of 5Only about 1 in 5 models sold in the U.S. this year contains more than 55%
domestic content. 3 out of 5 of them are
FCA US/Ford/ General Motors.
1 in 5 models contain 0% domestic content.
All but two are produced by foreign automakers.
2017 AALA SCORES BY MAKE AND MODEL
18
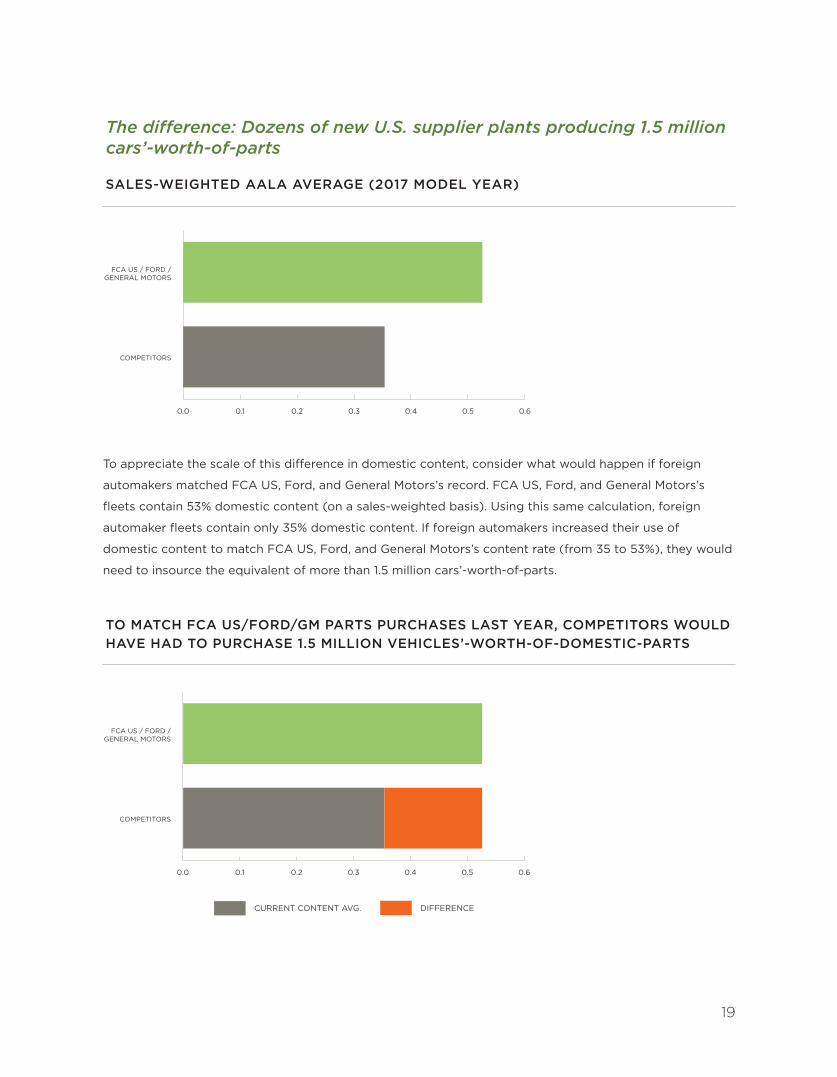
To appreciate the scale of this difference in domestic content, consider what would happen if foreign
automakers matched FCA US, Ford, and General Motors’s record. FCA US, Ford, and General Motors’s
fleets contain 53% domestic content (on a sales-weighted basis). Using this same calculation, foreign
automaker fleets contain only 35% domestic content. If foreign automakers increased their use of
domestic content to match FCA US, Ford, and General Motors’s content rate (from 35 to 53%), they would
need to insource the equivalent of more than 1.5 million cars’-worth-of-parts.
The difference: Dozens of new U.S. supplier plants producing 1.5 million cars’-worth-of-parts
SALES-WEIGHTED AALA AVERAGE (2017 MODEL YEAR)
TO MATCH FCA US/FORD/GM PARTS PURCHASES LAST YEAR, COMPETITORS WOULD HAVE HAD TO PURCHASE 1.5 MILLION VEHICLES’-WORTH-OF-DOMESTIC-PARTS
S A L E S - W E I G H T E D A A L A AV E R A G E( 2 0 1 6 M O D E L Y E A R )
FCA US / FORD /GENERAL MOTORS
COMPETITORS
0.0 0.1 0.2 0.3 0.4 0.5 0.6
T O M AT C H F C A U S / F O R D / G M PA R T S P U R C H A S E SL A S T Y E A R , C O M P E T I T O R S W O U L D H AV E H A D T O P U R C H A S E
2 . 4 M I L L I O N V E H I C L E S ’ W O R T H O F D O M E S T I C PA R T S
DIFFERENCECURRENT CONTENT AVG.
FCA US / FORD /GENERAL MOTORS
COMPETITORS
0.0 0.1 0.2 0.3 0.4 0.5 0.6
19
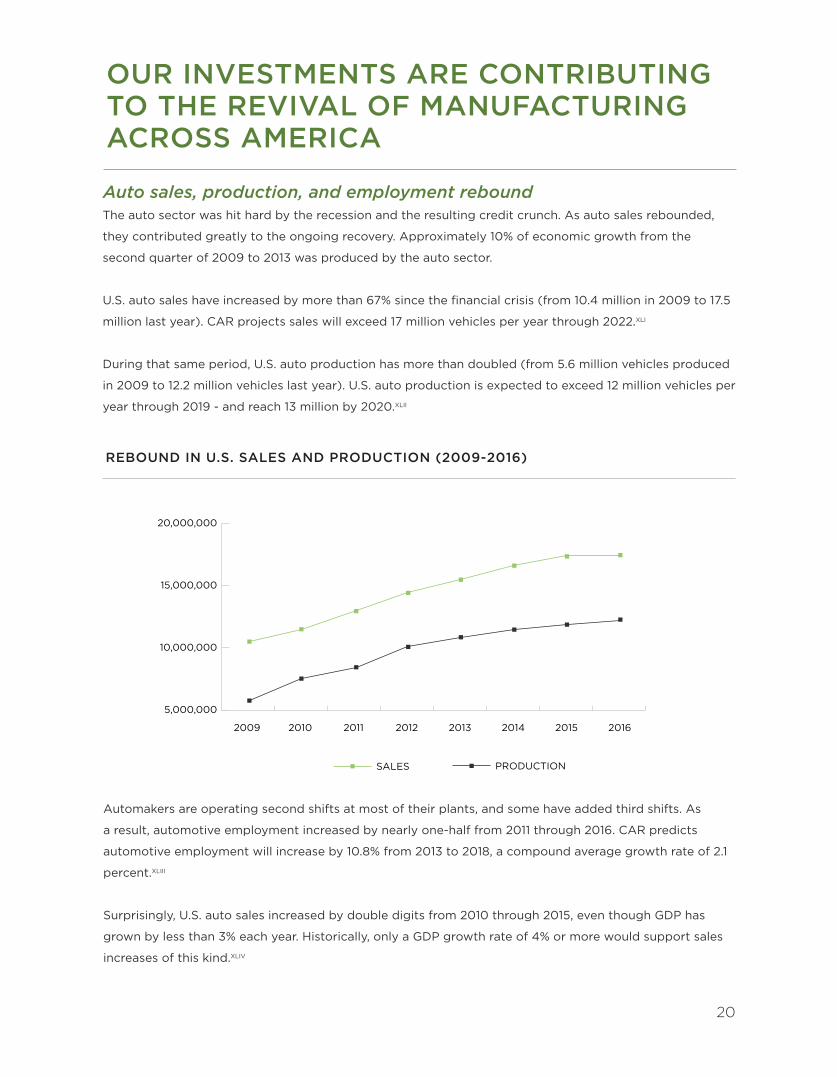
The auto sector was hit hard by the recession and the resulting credit crunch. As auto sales rebounded,
they contributed greatly to the ongoing recovery. Approximately 10% of economic growth from the
second quarter of 2009 to 2013 was produced by the auto sector.
U.S. auto sales have increased by more than 67% since the financial crisis (from 10.4 million in 2009 to 17.5
million last year). CAR projects sales will exceed 17 million vehicles per year through 2022.XLI
During that same period, U.S. auto production has more than doubled (from 5.6 million vehicles produced
in 2009 to 12.2 million vehicles last year). U.S. auto production is expected to exceed 12 million vehicles per
year through 2019 - and reach 13 million by 2020.XLII
REBOUND IN U.S. SALES AND PRODUCTION (2009-2016)
20
Automakers are operating second shifts at most of their plants, and some have added third shifts. As
a result, automotive employment increased by nearly one-half from 2011 through 2016. CAR predicts
automotive employment will increase by 10.8% from 2013 to 2018, a compound average growth rate of 2.1
percent.XLIII
Surprisingly, U.S. auto sales increased by double digits from 2010 through 2015, even though GDP has
grown by less than 3% each year. Historically, only a GDP growth rate of 4% or more would support sales
increases of this kind.XLIV
Auto sales, production, and employment rebound
OUR INVESTMENTS ARE CONTRIBUTING TO THE REVIVAL OF MANUFACTURING ACROSS AMERICA
R E B O U N D I N U . S . S A L E S A N D P R O D U C T I O N
5,000,000
10,000,000
15,000,000
20,000,000
SALES PRODUCTION
2009 2010 2011 2012 2013 2014 2015 2016
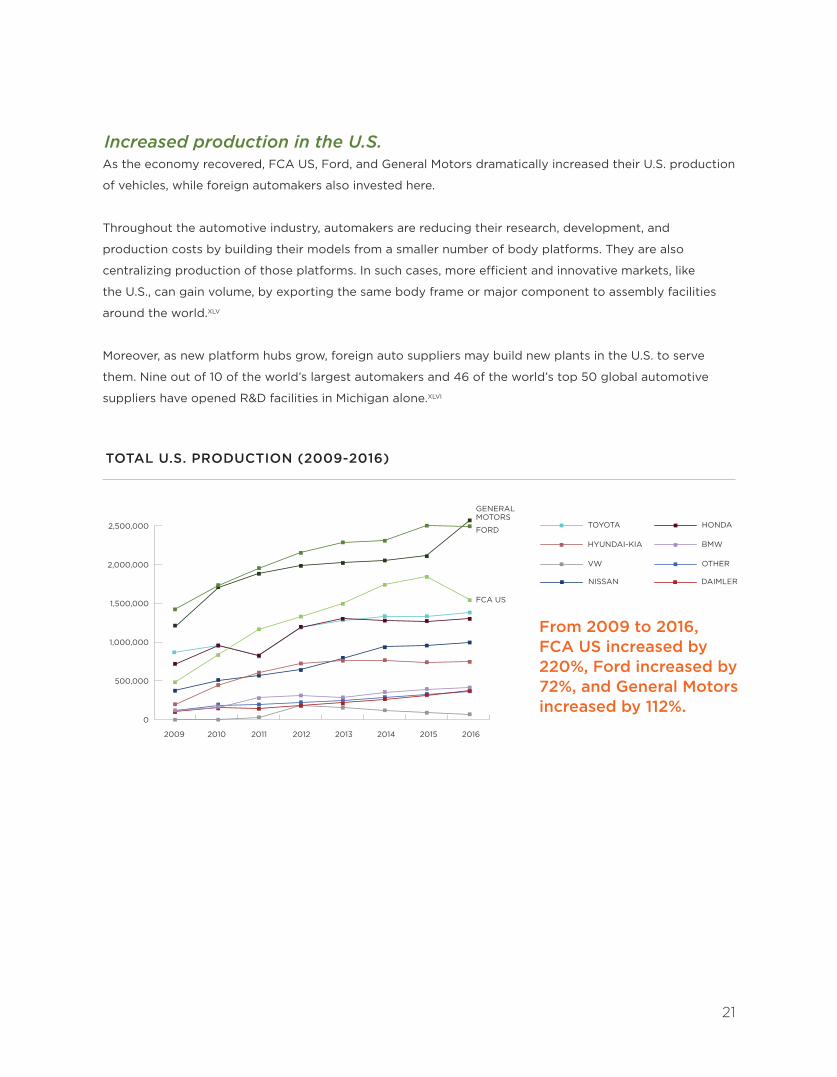
As the economy recovered, FCA US, Ford, and General Motors dramatically increased their U.S. production
of vehicles, while foreign automakers also invested here.
Throughout the automotive industry, automakers are reducing their research, development, and
production costs by building their models from a smaller number of body platforms. They are also
centralizing production of those platforms. In such cases, more efficient and innovative markets, like
the U.S., can gain volume, by exporting the same body frame or major component to assembly facilities
around the world.XLV
Moreover, as new platform hubs grow, foreign auto suppliers may build new plants in the U.S. to serve
them. Nine out of 10 of the world’s largest automakers and 46 of the world’s top 50 global automotive
suppliers have opened R&D facilities in Michigan alone.XLVI
Increased production in the U.S.
TOTAL U.S. PRODUCTION (2009-2016)
0
500,000
1,000,000
1,500,000
2,000,000
2,500,000
OTHERVW
TOYOTA
NISSAN
HYUNDAI-KIA
HONDA
DAIMLER
BMW
FCA US
GENERALMOTORS
FORD
T O T A L U . S . P R O D U C T I O N : 2 0 0 9 - 2 0 1 5
2009 2010 2011 2012 2013 2014 20162015
From 2009 to 2016, FCA US increased by 220%, Ford increased by 72%, and General Motors increased by 112%.
21
IN AN INDUSTRY AS COMPETITIVE AND CAPITAL-INTENSIVE AS AUTOS, PUBLIC POLICY MATTERS
The long-term success of any American automotive facility, whether
an assembly plant or research lab, depends, in part, on how international
public policies, including those relating to currency manipulation and automotive safety standards, affect an automaker’s
ability to compete internationally.
22
CA
SE
ST
UD
Y
Motor vehicles built to U.S. Federal Motor Vehicle Safety Standards (FMVSS) and the equivalent European
regulations, known as Economic Commission for Europe (ECE) standards, both lead to the highest levels
of safety performance and outcomes. If a manufacturer builds to applicable FMVSS or ECE standards it
should be able to sell that product worldwide.
When other countries accept both of these equally robust sets of standards, they encourage a more
efficient and competitive automotive industry by:
• Reducing numbers of prototypes needed for testing;
• Eliminating redundant testing and calibration that have no added safety benefit;
• Reducing record keeping, data process and oversight resources;
• Reducing administration/retrofitting costs for consumers relocating between countries; and
• Moving transportation of automobiles and auto parts across international borders more efficiently.
The European Commission is already actively promoting the use of ECE automotive safety standards
around the world, including through its free trade agreements. To help ensure that FMVSS are also
accepted internationally we have proposed that the U.S.:
• Proactively seek acceptance of FMVSS regulations worldwide;
• Explicitly include acceptance of U.S. automotive safety standards in all U.S. free trade agreements,
including the modernized NAFTA;
• Strongly and swiftly address regulations that emerge in individual countries/regions that act as technical
barriers to U.S. auto exports; and
• Continuing to pursue regulatory convergence between the U.S. and the European Union by building on
the momentum created by the Transatlantic Trade and Investment Partnership (TTIP) negotiations.
This is intended to match the vigor with which the EU has been pursuing its standards globally on
behalf of its vehicle industries, and is not in any way intended to supplant the acceptance of ECE safety
standards. In fact, as noted above, we recommend countries accept vehicles certified to both FMVSS and
ECE regulations.
By ensuring that vehicles certified to FMVSS are also accepted worldwide, our nation will reinforce the
globally competitive export platform, boosting the U.S. economy and the new jobs it can create through
growing exports.
INTERNATIONAL SAFETY STANDARDS
23
CA
SE
ST
UD
Y
Currency exchange rates can be as important a determinant of trade outcomes as the quality of a
particular good or service traded. Some governments manipulate their currency’s value in order to provide
an unfair competitive trade advantage to their industries. In fact, currency manipulation can and often
does have a much larger impact on trade than any of the tariff or non-tariff barriers that are the usual
focus of U.S. free trade agreement negotiations.
The U.S. and the international economic system have been ineffective at addressing the use of currency
manipulation by its trade partners. The International Monetary Fund (IMF) has clear rules against
competitive devaluations, but it has no enforcement mechanism. The World Trade Organization (WTO)
agreements include provisions on currency exchange rates; however, these rules are untested. Inaction
to address this distortion has led to the U.S. suffering much larger trade deficits and job losses than
it otherwise would have. Some have estimated that this inaction has led to the loss of up to 5 million
American jobs. According to a recent publication by leading international economists, currency
manipulation by several U.S. trade partners was the main cause of historically high trade imbalances in the
2000s.
In 2016, Congress passed the Trade Facilitation and Trade Enforcement Act of 2015 (the Customs Act)
that established broad requirements to identify and address the problem of currency manipulation,
which AAPC supported. In an effort to meet the requirements of the Customs Act, the U.S. Department
of Treasury modified the Semiannual Report on International Economic and Exchange Rate Policies.
Although the enhanced report is a helpful step in the right direction, we believe it is essential to include
even stronger and enforceable currency manipulation disciplines with countries that the United States
grants preferential access as a party to a free trade agreement (FTA) with the United States.
AAPC has worked with leading international economists, including Fred Bergsten and Joseph Gagnon
of the Peterson Institute, to develop strong and enforceable currency manipulation rules, based on IMF
principles, which could be used to identify and counter trade partners that use currency manipulation.
The result is an objective three-part test for inclusion in new or updated U.S. FTAs, which supplements the
above-referenced Customs Act:
• Did the foreign country have a current account surplus over the six-month period in question?
• Did it add to its foreign exchange reserves over that same six-month period?
• Are its foreign exchange reserves more than sufficient, (i.e., greater than three months’ normal imports)?
A country that the U.S. has partnered with in an FTA would be considered to be manipulating its currency
if it is found to meet all three criteria. The United States would then be eligible to take swift action, such
as revoking the duty-free trade, in an effort to compel the trade partner to stop using this unfair trade
practice.
CURRENCY MANIPULATION
24
I This report includes references to both FCA US LLC (FCA US) and Fiat Chrysler Automobiles N.V. (FCA). FCA US is
the American subsidiary of its global parent company, FCA.
II Center for Automotive Research (CAR), Economic Contribution of the Ford Motor Company Michigan Assembly
Plant to Michigan Economy (March 2013). Hill, Kim, Bernard Swiecki, Deb Menk, Joshua Cregger, and Michael Schultz.
Page 25.
III CAR, Economic Contribution of the Ford Motor Company Michigan Assembly Plant to Michigan Economy (March
2013). Hill, Kim, Bernard Swiecki, Deb Menk, Joshua Cregger, and Michael Schultz. Page 25.
IV United States Department of Commerce, International Trade Administration (2017).
V Motor & Equipment Manufacturers Association, Driving the Future (2017).
VI Result calculated by multiplying foreign automakers’ 2016 U.S. sales by American automakers’ 2016 U.S. production
as a percent of sales rate.
VII Result calculated by multiplying foreign automakers’ 2016 U.S. sales by American automakers’ sales-weighted
domestic content average for the 2017 model year.
VIII CAR analysis (2014).
IX This report includes references to both FCA US LLC (FCA US) and Fiat Chrysler Automobiles N.V. (FCA). FCA US is
the American subsidiary of its global parent company, FCA.
X European Commission Joint Research Centre, 2016 EU Industrial R&D Scoreboard.
XI CAR, U.S. Light Vehicle Sales and Production Forecast. Chen, Yen and Kristin Dziczek (June 2017).
XII CAR, U.S. Vehicle Sales, Production, & Employment Outlook. McAlinden, Sean, Dr., and Yen Chen (January 2014 – May
2015).
XIII For a more complete examination of this trend, see CAR’s Economic Contribution of the Ford Motor Company
Michigan Assembly Plant to Michigan Economy.
XIV Assumes autos are 190 inches each (approximate size of popular mid-sized sedans).
XV For a more complete analysis of “job multipliers” see reports from CAR’s Sustainability & Economic Development
Strategies group.
XVI CAR, Economic Contribution of the Ford Motor Company Michigan Assembly Plant to the Michigan Economy. Hill,
Kim, Bernard Swiecki, Deb Menk, Joshua Cregger, and Michael Schultz (March 2013).
XVII CAR, Economic Contribution of the Ford Motor Company Michigan Assembly Plant to the Michigan Economy. Hill,
Kim, Bernard Swiecki, Deb Menk, Joshua Cregger, and Michael Schultz (March 2013).
XVIII CAR, The Effect on the U.S. Economy of the Successful Restructuring of General Motors. McAlinden, Sean P., and
Debra M. Menk (2013). Page 4.
XIX Motor & Equipment Manufacturers Association, Driving the Future (2017).
XX National Science Board, 2016 Science and Engineering Indicators (February 2016).
XXI The National Science Foundation (NSF) estimates U.S. auto industry R&D totaled $13.2 billion in 2012. Since that
time, global auto R&D has increased by 9.9% each year. Assuming U.S. automotive research matched the global rate,
baseline auto research totaled $19.2 billion in 2016. New entrants into the automotive industry (including Apple,
Google, Lyft, Tesla, and hundreds of start-ups) represent billions more in auto R&D.
XXII CAR, The Potential Effects of the 2017-2025 EPA/NHTSA GHG/Fuel Economy Mandates on the U.S. Economy.
SOURCES
25
McAlinden, Sean P., Yen Chen, Michael Schultz, and David J. Andrea (September 2016).
XXIII In 2016, foreign automakers sold 9,599,301 cars and trucks in the U.S. and produced 5,605,520 cars and trucks
here, for a U.S. production rate of 58%.
XXIV To match FCA US, Ford, and General Motors’s 83% sales-weighted U.S. production rate, foreign automakers would
have had to produce 2,212,042 more cars and trucks here (moving from 5,605,520 out of 9,599,301 sold, to
7,899,102 out of 9,599,301 sold).
XXV Assuming each plant produced 300,000 vehicles, it would require 7.37 plants to produce 2,212,042 vehicles.
Plants capable of producing 300,000 vehicles per year employ 3,000 to 4,000 workers. New plants require $1 to
$2 billion in capital investment.
XXVI United States Department of Commerce, International Trade Administration (2017).
XXVII IHS Markit analysis (2017).
XXVIII European Commission Joint Research Centre, 2016 EU Industrial R&D Scoreboard.
XXVIX CAR analysis (2014).
XXX European Commission Joint Research Centre, 2016 EU Industrial R&D Scoreboard.
XXXI CAR, Just How High-Tech Is the Automotive Industry? Hill, Kim, Bernard Swiecki, Debra M. Menk, and Joshua
Cregger (January 2014).
XXXII CAR, Just How High-Tech Is the Automotive Industry? Hill, Kim, Bernard Swiecki, Debra M. Menk, and Joshua
Cregger (January 2014).
XXXIII CAR, Just How High-Tech Is the Automotive Industry? Hill, Kim, Bernard Swiecki, Debra M. Menk, and Joshua
Cregger (January 2014).
XXXIV This report includes references to both FCA US LLC (FCA US) and Fiat Chrysler Automobiles N.V. (FCA). FCA US
is the American subsidiary of its global parent company, FCA.
XXXV Motor & Equipment Manufacturers Association, Driving the Future (2017).
XXXVI Automaker employment (both in the U.S. and globally) is obtained from their respective annual reports and
corporate websites, as well as reports from the trade groups they support. FCA data is used for their global
employment, while FCA US data is used for their U.S. employment.
XXXVII CAR, The Effect on the U.S. Economy of the Successful Restructuring of General Motors. Sean McAlinden and Deb
Menk (2013). Page 4.
XXXVIII Motor & Equipment Manufacturers Association, Driving the Future (2017).
XXXIX Motor & Equipment Manufacturers Association, Moving America Forward (2013).
XL CAR, Economic Contribution of the Ford Motor Company Michigan Assembly Plant to the Michigan Economy. Hill,
Kim, Bernard Swiecki, Deb Menk, Joshua Cregger, and Michael Schultz (March 2013).
XLI CAR, U.S. Vehicle Sales, Production, & Employment Outlook. Sean McAlinden, Yen Chen (January 2014 – May
2015). Page 2.
XLII CAR, U.S. Vehicle Sales, Production, & Employment Outlook. Sean McAlinden, Yen Chen (January 2014 – May
2015). Page 4.
XLIII CAR, Contribution of the Automotive Industry to the Economies of All Fifty States and the United States. Hill, Kim,
Deb Menk, Joshua Cregger, and Michael Schultz (January 2015).
26
XLIV CAR, After the Bailout: Future Prospects for the U.S. Auto Industry. Sean McAlinden and Yen Chen (January 2013).
Page 14.
XLV CAR, Economic Contribution of the Ford Motor Company Michigan Assembly Plant to the Michigan Economy. Hill,
Kim, Bernard Swiecki, Deb Menk, Joshua Cregger, and Michael Schultz (March 2013).
XLVI CAR, Economic Contribution of the Ford Motor Company Michigan Assembly Plant to the Michigan Economy. Hill,
Kim, Bernard Swiecki, Deb Menk, Joshua Cregger, and Michael Schultz (March 2013).
27
AMERICANAUTOCOUNCIL.ORG
![~ a Y R p S x T T i [ g X g U n ¿ Y g Y c i s L · 2017-11-13 · c [ T r U U t ¿ c i U ] h U ¿ g ` T c i U ] Y S T j ` T Y S U r T Y t T ~ U U t L 14 e i U [ W i g U p T " François](https://img.pdfslide.net/doc/110x75/5f5489c62b6e9f01d05352ed/-a-y-r-p-s-x-t-t-i-g-x-g-u-n-y-g-y-c-i-s-l-2017-11-13-c-t-r-u-u-t-c.jpg)