Embed Size (px)
Citation preview
For Review O
nly
Locating Social Media's Predictive Power for Civil Unrest
During the Egyptian Arab Spring
Journal: IEEE Transactions on Computational Social Systems
Manuscript ID TCSS-2016-05-0023
Manuscript Type: Regular Paper
Date Submitted by the Author: 11-May-2016
Complete List of Authors: Wu, Congyu; University of Virginia, Systems and Information Engineering Gerber, Matthew; University of Virginia, Systems and Information Engineering
Keywords: civil unrest prediction, protest participation theory, Twitter, GDELT, Arab Spring
IEEE Transactions on Computational Social Systems
For Review O
nly
1
Locating Social Media’s Predictive Power forCivil Unrest During the Egyptian Arab Spring
Congyu Wu, Matthew S. Gerber
Abstract—Activists have used social media during modern civil uprisings such as the Arab Spring, and researchers have found thatthe generated content is predictive of offline protest activity. However, questions remain regarding the drivers of this predictive power.In this article we begin by deriving predictor variables for individuals’ protest decisions from the literature on protest participation theory.We then test these variables on the case of Twitter and the 2011 Egyptian revolution. We find significant positive correlations betweenthe volume of future-protest descriptions on Twitter and protest onsets. We do not find significant correlations between such onsetsand the volume of political expressions, individuals’ access to news, and connections with political activists. These results locate thepredictive power of social media in its function as a protest advertisement and organization mechanism. We then build predictive modelsusing future-protest descriptions and compare these models with baselines informed by daily event counts from the Global Databaseof Events, Location, and Tone (GDELT). Inspection of the significant variables in our GDELT models reveals that an increased militarypresence may be predictive of protest onsets in major cities. In sum, this work highlights the ways in which online activism shapesoffline behavior during civil uprisings.
Index Terms—civil unrest prediction, protest participation theory, Twitter, GDELT, Arab Spring
F
1 INTRODUCTION
F ROM national political upheavals such as the protestsin Thailand, Spain, Turkey, and Brazil, to revolution-
ary waves such as the Arab Spring and the Occupymovements that reverberated across national borders,the 2010s has seen many parts of the world engag-ing in contentious politics to oppose authoritarianismand demand social change. During these civil upris-ings, episodes of mass protests, riots, and even civilwars erupted erratically, compromising successful civiland military operations in the affected regions. Thechallenge lies in the difficulties for decision makers toanticipate the evolution of civil unrest and to initiateeffective preparation and mitigation efforts. These dif-ficulties motivate research into predicting spikes of civilunrest activity days in advance. Forecasts of whether aregion will transition to a significantly increased chaoticstate within near future could assist government andnon-government organizations to plan and implementresponse efforts that are more accurate, timely, and cost-effective [1][2].
These civil uprisings share a common trait: they weremediated by social media (e.g., Twitter). Evidence showsthat activists and participants used social media activelyduring civil unrest to express political opinions, con-verse with fellow citizens, and organize future events
• C. Wu is a PhD student at the Department of Systems and InformationEngineering, University of Virginia, Charlottesville, VA, 22904.E-mail: [email protected]
• M. S. Gerber is an assistant professor at the Department of Systemsand Information Engineering, University of Virginia, Charlottesville, VA22904.Email: [email protected]
Manuscript received XXXX; revised XXXX.
[3][4][5][6]. In fact, it is no news anymore that infor-mation extracted from social media during civil un-rest is predictive of offline crowd activity in the daysthat follow. Multiple works [7][8][9][10][11], usually con-ducted by computer scientists, have undertaken suchpredictive tasks and confirmed a predictive relationship.On the other hand, a range of political science studies[12][13][14] have investigated the correlations betweenan individual’s engagement in offline political partic-ipation and his or her online activist behavior. Fromthe extant literature in both fields, we identified a gap:focused on prediction performance, existing predictiveanalyses have not systematically identified the underly-ing mechanism that drives the predictive power of socialmedia content; focused on inferring static correlationbetween decision to protest and personal and behavioralattributes, existing studies in political science do notcapture the way in which online activism dynamicallyaffects collective offline activism. It remains a questionwhat it is about social media usage that predicts spikesin offline protest activity in the near future.
This article seeks to bridge this gap. We first identifysalient variables that proved to have an impact on anindividual’s decision to participate in protests from rel-evant political science literature on protest participationtheory [15][16][13]. Conventionally, these variables aremeasured using questionnaires. In the present researchwe automatically take measurements of the collectivelevels of these variables from a data set consisting oftweets composed by Cairo users during the early monthsof the Arab Spring; examine the correlations betweenthese variables and the occurrence of protest onset inCairo, Egypt; and use the validated variable(s) to predictthe latter. Our approach involves the manual curation
Page 1 of 16 IEEE Transactions on Computational Social Systems
For Review O
nly
2
of ground-truth data describing protest events, followedby hypotheses testing and predictive modeling, whoseperformance is compared against a baseline informedby the Global Database of Events, Location, and Tone(GDELT) [17]. The main contribution of this article isthe deeper and novel understanding of the role playedby online social networks in modern civil uprisings.
The remainder of this article is arranged as follows.Section 2 presents a literature survey of four relatedfields: political conflict prediction, protest participationtheory, event databases, and social media. Section 3 for-malizes our research questions and hypotheses. Section 4explains our data collection process. Section 5 discussesfeature design. Sections 6 and 7 describe experimentsconducted for hypothesis testing and predictive model-ing respectively. Section 8 discusses further details aboutour baseline models and presents a novel scheme toevaluate model performance. Conclusions and futurework are provided in Section 9.
2 RELATED WORK
2.1 POLITICAL CONFLICT PREDICTIONStudies on political conflict prediction have extensivelyexplored various predictor variables and predictivemethodologies directed at providing early warning forpotential political crisis. Predicted phenomena are typi-cally the binary state of political instability of a countryor a dyadic international relation in a future time period;example responses include the following: a region expe-riencing high or low levels of conflict in the coming week[18]; two powers existing in a state of cooperation orconflict [19]; or whether a intra-state political upheavalwill begin in the coming years [20]. Prediction lead timeranges from one month to five years. Explanatory (pre-dictor) variables fall into two broad categories: structuralfeatures and historical political events. Structural fea-tures, including regime type, GDP, demographics, statepolicy, and/or structural features of neighboring states[21], capture changes in the socio-economic landscapeof a region that might lead to political crisis. Historicalevent records, containing the occurrence of differenttypes of political events leading up to the present time,have been used to extract patterns of social interactionwithin one or between multiple countries. Methods usedinclude predominantly logistic regression, as well ashidden Markov models, time series analysis and agentbased simulation [22].
In the work described above, the predicted phenom-ena are of low temporal resolution and the predictionlead times are longer than one month. Such methods donot address questions such as “will there be a protestonset in a CITY X in the next three days?”. The highertemporal resolution and more granular unit of analysismotivate extracting predictors from online social media,where activist content is constantly produced and poten-tially predictive of offline crowd behavior. [8] predictedsignificant protests in the next three days using the
TABLE 1Significant variables in protest participation theory [16]
Category Variable
Biographical availabilityBeing youngWithout childrenEducated
Political engagementKnowledgeable in politicsInterested in politicsBeing liberal
Structural availabilityBeen asked to participateAffiliated with social organizationsHaving civic skills
volume of event mentions automatically extracted fromsocial and news media. [10] conducted a similar taskusing Twitter data and discovered that distributions overuser-centric meta information (e.g., number of followersand followees) is more predictive than content-basedfeatures such as topic proportions. [7] found that theamount of the inequality of hashtag distribution onTwitter on a given day is predictive of the next day’sintensity of protest activity. [9] focused on extractingdescriptions of future protest event from social and newsmedia content to generate alerts for potential eventswith specific time, location, and actor information. Thelimitation of existing work is that, apart from reports ofprediction performance and anecdotal accounts of salientvariables, a theoretical explanation of what makes socialmedia content predictive of real world events is lacking.This motivates our integration of protest participationtheory in hypothesis testing and predictive modeling.
2.2 PROTEST PARTICIPATION THEORYAccounting for the causal mechanisms of social move-ments and revolutions is a long-standing research topicfor social scientists. Marx [23] sees revolution as aninevitable outcome of the class conflict between theexploited proletarians and the exploiting bourgeois. Toc-queville [24] attributes revolutions to people’s boostedwill to rebel when experiencing relaxed pressure fromthe authority after an endured period of overwhelmingoppression. Into the 20th century, many theories wereproposed: (1) relative deprivation theory [25], or theso-called “J-curve” theory, arguing that it is the gapbetween people’s expected level of wellbeing and whatpeople end up experiencing, rather than the absolutelevel of life conditions, that causes revolution; (2) po-litical opportunity theory [26], arguing that revolutionsare a result of people’s will to make changes to thesociety combined with people’s perceived opportunity tosuccessfully make a difference; (3) resource mobilizationtheory [27], which emphasizes the necessity of socialorganizations that provide resources such as funds, sup-porters, and press coverage for a revolutionary move-ment to happen. The theories considered above explainthe long-term development of revolutions, but not the
Page 2 of 16IEEE Transactions on Computational Social Systems
For Review O
nly
3
rapid evolution of protest during a political upheaval.Consider the prediction of political stability within acountry. Such theories are suitable for answering ques-tions like “how likely is it that a revolution will takeplace in COUNTRY X within the next three years?”.However, these theories are ill-suited to questions like“how likely is it that a mass demonstration will takeplace in CITY X within the next three days?”.
Protest participation theory seeks to identify factorsthat influence an individual’s decision to participate inprotest events [15]. Variables described in protest partici-pation theory fall into three broad categories: biographicalavailability, political engagement, and structural availabil-ity [16]; or equivalently, personal characteristics, politicalattitude components, and group effects [15]. Biographicalavailability indicates the absence of constraints (e.g.,marriage, children, or employment) that would increasethe cost of protest participation. Political engagementhas several dimensions, including one’s interest andknowledge in politics as well as one’s political efficacy,the belief that one can make a difference politically.Structural availability refers to an individual’s “presencein an interpersonal network that facilitates recruitmentto activism” [16]. The most salient manifestation of suchpresence is being asked to or knowing to participate in aprotest event. The entire structure of protest participationtheory can be succinctly summarized as can participate,wants to participate, and has been asked to or knows toparticipate [28], corresponding to the three categories ofvariables respectively. Individuals’ propensity to partic-ipate collectively determines the occurrence and scale ofcivil unrest events.
A list of variables associated with each category inprotest participation theory is provided in Table 1. Notethat, although all of these variables can vary over time,some do so at a substantially faster rate than others, es-pecially when aggregated for a population. For example,the level of interest in politics within a population canchange over night if some potentially provocative eventhas occurred; yet a population’s age distribution is likelyto remain steady for years, leaving the variable “beingyoung” unaffected if we consider a relatively short timeframe. Given the real time nature of our prediction task,we require the predictors in our models to capture therapid ebb and flow of civil unrest. We identify fourvariables from protest participation theory: knowledge-able in politics, interested in politics, having been askedto participate, and affiliated with social organization,and we will be using these variables to drive predictordesign. “Affiliated with social organizations” is includedbecause although official membership in an organizationdoes not change over night, a more subtle affiliation,which is an individual’s political alignment or bond withcertain social actors, can.
2.3 EVENT DATABASESOne major difficulty facing political conflict predictionis the difficulty of defining and measuring the response
and predictor variables. For example, how should theconflict status (peaceful vs. chaotic) for a given regionduring a given month be determined? The answer lies inthe nature and quantity of social events that transpire inthe given region and time. Therefore, it becomes a crucialtask to document political events and convert theminto statistically analyzable data. This involves codingpolitical events and building event databases. A codedevent is essentially a tuple with structured elements who,did what, to whom, where and when (sometimes augmentedwith a Goldstein score, an index of the benignity ormaliciousness of an event). Coding an event entails theassignment of these labels to news articles according toa pre-designed set of coding rules, such as WEIS (WorldEvent/Interaction Survey) [29] and CAMEO (Conflictand Mediation Event Observations) [30]. Coding is con-ventionally done by manually reading news articles,which is the case of older or regional event databasessuch as WEIS [31], COPDAB (Conflict and Peace DataBank) [32], ACLED (Armed Conflict Location & EventData Project) [33] and SCAD (Social Conflict AnalysisDatabase) [34]. The coding process is automated in sys-tems such as TABARI (Textual Analysis By AugmentedReplacement Instructions) [35], which produced the pop-ular GDELT database. GDELT is a growing databaseof political events of the form ”COUNTRY A invadedCOUNTRY B”, which are extracted from news articlespublished by global news media. Publicly accessible,free-of-charge, and updated daily, GDELT serves as acandidate source for predictor variables and is used innumerous studies in political science (e.g. [9][36]).
2.4 THE ROLE OF SOCIAL MEDIA DURING CIVILUPRISINGSocial media played an important role during the ArabSpring [3]. The importance of social media lies in its corefunction: information dissemination [4]. For example, ac-tive flows of revolution-related information were clearlydetected between multiple types of Twitter users suchas activists, bloggers and journalists [5]. Social mediaprovides a space for collective dissent to be articulated[6], political debates to be shaped [3] and mass proteststo be organized [4]. From the perspective of resource mo-bilization theory, social media facilitated large-scale mo-bilization [37] so that the revolution happened “soonerrather than later” [4]. Moreover, evidence suggests thatreal world civil unrest events often succeed spikes of on-line revolutionary conversations [3] [11]. As the vehicleof revolutionary conversations, opinions and sentimentduring the Arab Spring, we find locally created socialmedia content a suitable source from which to measurefeatures of public behaviors.
3 RESEARCH QUESTIONS AND HYPOTHESES
This article addresses the following research questions:during a period of political upheaval, if we observein a population an increase in the collective level of
Page 3 of 16 IEEE Transactions on Computational Social Systems
For Review O
nly
4
(1) knowledge in politics, (2) interest in politics, (3)knowledge of a future protest, and (4) affiliation withpolitical activists, how likely will a new protest seriesbegin in the near future?
The associated hypotheses are as follows:1) H1: An increase over the recent collective level
of knowledge of politics is correlated with theoccurrence of a protest onset in the near future.
2) H2: An increase over the recent collective level ofinterest in politics is correlated with the occurrenceof a protest onset in the near future.
3) H3: An increase over the recent collective level ofknowledge of a future protest is correlated with theoccurrence of a protest onset in the near future.
4) H4: An increase over the recent collective level ofaffiliation with political activists is correlated withthe occurrence of a protest onset in the near future.
We define protest onset as the commencement of aseries of politically charged gatherings. For a particularday, evidence of protest onset comes as a journalisticreport (i.e., news article) of protest activity on the givenday, where no such report existed for the preceding day.The length of a series can be one or multiple days.
To formalize the concepts “increase over recent level”and “near future” introduced in the hypotheses, we de-fine two measures: base period and prediction horizon. Baseperiod (denoted as B) is a period of time immediatelypreceding the current time step; we compare the currentvalue of a predictor with the average value over thebase period to measure the increase. Prediction horizon(denoted as H) is a period of time immediately followingthe current time step (i.e., “near future”); a predictedprotest onset will be considered correct if a protest onsetactually occurs within the prediction horizon. By defini-tion, both parameters may take positive integer values.In this article, we will explore different combinations ofB ∈ {1, 2, 3} and H ∈ {1, 2, 3} in our modeling process.Choosing smaller values of H and B corresponds to theconcepts of “increase over recent level” and “near future”in the hypotheses, which reflect the real time nature ofa daily forecast task.
4 DATA COLLECTIONThis section describes data acquisition for our responsevariable, protest participation theory variables, andGDELT variables. The response variable is a binary vari-able indicating whether a protest onset occurred in Cairoon a particular day. Protest participation theory variableshave been introduced in section 2.2 and formalized insection 3 and are the main focus of this research. Weseek to measure protest participation theory variablesautomatically from Twitter data. GDELT variables willserve as predictor variables in our baseline modelsagainst which we compare the predictive performance ofthe protest participation theory variables. The temporalscope of our data is a 121-day period from December 1,2010 to March 31, 2011, covering the early months of theArab Spring.
4.1 RESPONSE VARIABLE: CAIRO PROTEST ON-SET DATA
There are two alternative strategies for establishing theground truth of our response variable: (1) utilizing au-tomatically curated event databases like GDELT, or (2)manually examining news articles. Both methods areaimed at producing a vector of ground truth labelsthat indicate whether a protest onset occurred in Cairoduring each day. Each alternative is grounded in newsarticles that are created by humans.
The advantage of GDELT is convenience: GDELTevents are automatically extracted from news articlesand the fluctuation of their amount indicates the volumeof general journalistic mentions. [10] adopted GDELT indetermining ground truth labels by aggregating dailycounts of GDELT protest events on a three-day basis andlabeling statistical outliers as positive instances. Beyondconcerns related to errors introduced by GDELT’s au-tomatic processing, we find GDELT problematic givenour definition of protest onset. For example, sustaineddaily GDELT records of protest events might result fromcontinued coverage of a single protest. This is a singleonset by our definition, but GDELT does not make suchdistinctions. Manual examination of news articles canhelp differentiate such patterns. This manual analysisrequires considerable human effort, but we believe theresulting ground truth will be better aligned with ourstated response variable. As such, we decided to obtainCairo protest onset data through manual examinationof online news articles reporting on the daily progressof the Egyptian revolution. We minimized subjectivitythrough the regulated process described below.
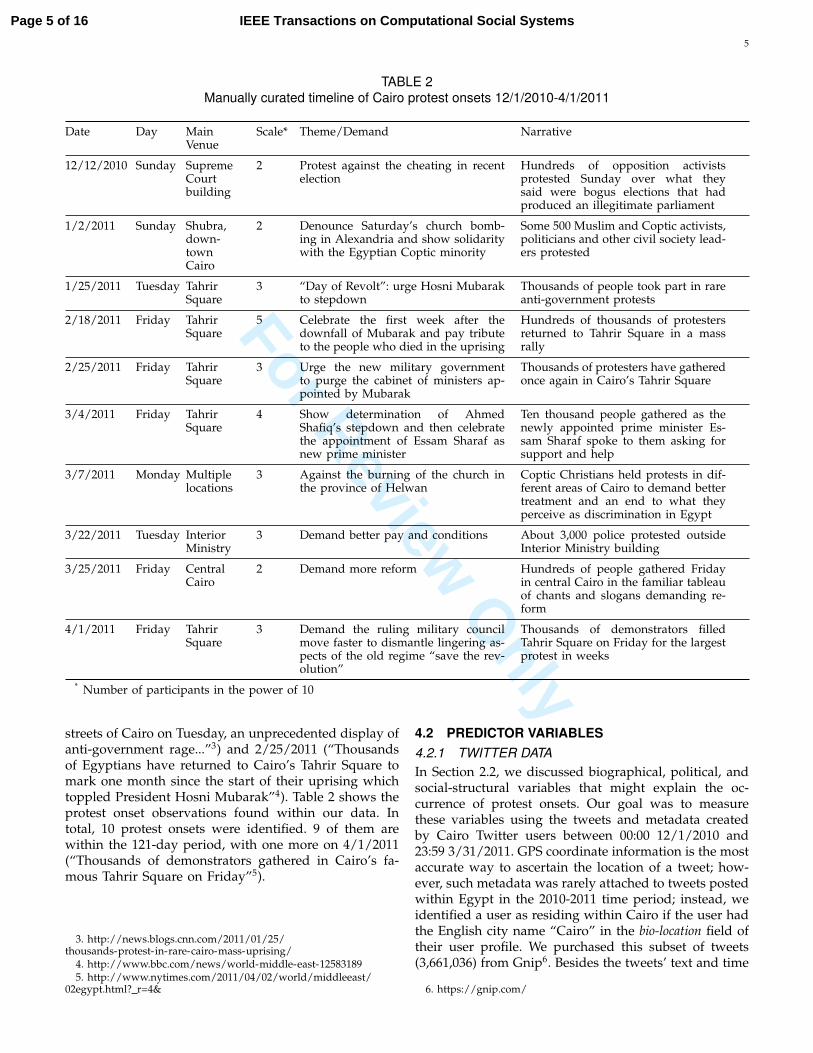
We considered a 121-day period from 12/1/2010 to3/31/2011. Associated with this time span is a vectorof 121 boolean indicators, 1 if a protest onset occurredduring the given day and 0 otherwise. To determine theboolean value of each day, we carefully examined newsarticles published online by global news media. For eachday within the period, we queried Google News1 withthe date in question and Cairo as the query term. Fromthe query results, we examined articles containing de-scriptions of protest activity in Cairo on that day. Whendescriptions of a politically charged gathering occurredin at least one news article, we documented2 the location,theme (motivation or demand of the gathering), scale(number of participants by magnitudes of 10), a shortnarrative of the gathering and the URL of the news arti-cle. Then for each day within the period, we determinedwhether the day is a protest onset day based on ourdefinition of protest onset: a day is given label 1 if protestactivity is reported on that day and the immediatelypreceding day has no evidence of protest activity, suchas 1/25/2011 (“Thousands of protesters spilled into the
1. http://news.google.com2. We have made this document publicly available
at https://drive.google.com/uc?export=download&id=0B9Y18eHrzbbuRTJZeDNycHVscFk
Page 4 of 16IEEE Transactions on Computational Social Systems
For Review O
nly
5
TABLE 2Manually curated timeline of Cairo protest onsets 12/1/2010-4/1/2011
Date Day MainVenue
Scale* Theme/Demand Narrative
12/12/2010 Sunday SupremeCourtbuilding
2 Protest against the cheating in recentelection
Hundreds of opposition activistsprotested Sunday over what theysaid were bogus elections that hadproduced an illegitimate parliament
1/2/2011 Sunday Shubra,down-townCairo
2 Denounce Saturday’s church bomb-ing in Alexandria and show solidaritywith the Egyptian Coptic minority
Some 500 Muslim and Coptic activists,politicians and other civil society lead-ers protested
1/25/2011 Tuesday TahrirSquare
3 “Day of Revolt”: urge Hosni Mubarakto stepdown
Thousands of people took part in rareanti-government protests
2/18/2011 Friday TahrirSquare
5 Celebrate the first week after thedownfall of Mubarak and pay tributeto the people who died in the uprising
Hundreds of thousands of protestersreturned to Tahrir Square in a massrally
2/25/2011 Friday TahrirSquare
3 Urge the new military governmentto purge the cabinet of ministers ap-pointed by Mubarak
Thousands of protesters have gatheredonce again in Cairo’s Tahrir Square
3/4/2011 Friday TahrirSquare
4 Show determination of AhmedShafiq’s stepdown and then celebratethe appointment of Essam Sharaf asnew prime minister
Ten thousand people gathered as thenewly appointed prime minister Es-sam Sharaf spoke to them asking forsupport and help
3/7/2011 Monday Multiplelocations
3 Against the burning of the church inthe province of Helwan
Coptic Christians held protests in dif-ferent areas of Cairo to demand bettertreatment and an end to what theyperceive as discrimination in Egypt
3/22/2011 Tuesday InteriorMinistry
3 Demand better pay and conditions About 3,000 police protested outsideInterior Ministry building
3/25/2011 Friday CentralCairo
2 Demand more reform Hundreds of people gathered Fridayin central Cairo in the familiar tableauof chants and slogans demanding re-form
4/1/2011 Friday TahrirSquare
3 Demand the ruling military councilmove faster to dismantle lingering as-pects of the old regime “save the rev-olution”
Thousands of demonstrators filledTahrir Square on Friday for the largestprotest in weeks
* Number of participants in the power of 10
streets of Cairo on Tuesday, an unprecedented display ofanti-government rage...”3) and 2/25/2011 (“Thousandsof Egyptians have returned to Cairo’s Tahrir Square tomark one month since the start of their uprising whichtoppled President Hosni Mubarak”4). Table 2 shows theprotest onset observations found within our data. Intotal, 10 protest onsets were identified. 9 of them arewithin the 121-day period, with one more on 4/1/2011(“Thousands of demonstrators gathered in Cairo’s fa-mous Tahrir Square on Friday”5).
3. http://news.blogs.cnn.com/2011/01/25/thousands-protest-in-rare-cairo-mass-uprising/
4. http://www.bbc.com/news/world-middle-east-125831895. http://www.nytimes.com/2011/04/02/world/middleeast/
02egypt.html? r=4&
4.2 PREDICTOR VARIABLES4.2.1 TWITTER DATAIn Section 2.2, we discussed biographical, political, andsocial-structural variables that might explain the oc-currence of protest onsets. Our goal was to measurethese variables using the tweets and metadata createdby Cairo Twitter users between 00:00 12/1/2010 and23:59 3/31/2011. GPS coordinate information is the mostaccurate way to ascertain the location of a tweet; how-ever, such metadata was rarely attached to tweets postedwithin Egypt in the 2010-2011 time period; instead, weidentified a user as residing within Cairo if the user hadthe English city name “Cairo” in the bio-location field oftheir user profile. We purchased this subset of tweets(3,661,036) from Gnip6. Besides the tweets’ text and time
6. https://gnip.com/
Page 5 of 16 IEEE Transactions on Computational Social Systems
For Review O
nly
6
TABLE 3Predictors of Protest Onsets
Theoretical Variable Implemented Predictor Notation
Knowledgeable in politics(reads daily newspaper)
1. Daily count of Cairo tweets @-mentioning popularnews media
NumTweetsNews
2. Daily count of Cairo Twitter users @-mentioning popularnews media
NumUsersNews
Interested in politics(enjoys political discussion)
3. Daily count of Cairo political tweets NumTweetsPolitics4. Daily count of Cairo Twitter users who authored at leastone political tweet
NumUsersPolitics
Having been asked/presentedinformation to participate
5. Daily count of Cairo tweets that present future protest information NumTweetsProtests6. Daily count of Cairo Twitter users @-mentioning the authors oftweets that present future protest information
NumUsersProtests
Presence of ties in anactivist network
7. Daily count of Cairo tweets @-mentioning salient Egyptianpolitical activists
NumTweetsActivists
8. Daily count of Cairo Twitter users @-mentioning salient Egyptianpolitical activists
NumUsersActivists
stamp, the data set also contains user profiles of allusers. Section 5 will discuss in detail how we extractedpredictors from this Twitter data.
4.2.2 GDELT DATAWe used GDELT data to build a number of baselinemodels for comparison with our Twitter-driven models.For every detected event within a news source, GDELTassigns an event type based on the CAMEO codingscheme. The CAMEO coding scheme categorizes anaction into one of the 20 root event types and assignsadditional labels if finer distinctions are detected. The20 root event types are: (1) make public statement; (2)appeal; (3) express intent to cooperate; (4) consult; (5)engage in diplomatic cooperation; (6) engage in materialcooperation; (7) provide aid; (8) yield; (9) investigate;(10) demand; (11) disapprove; (12) reject; (13) threaten;(14) protest; (15) exhibit military posture; (16) reducerelations; (17) coerce; (18) assault; (19) fight; (20) engagein unconventional mass violence. For example, code 03will be assigned to an “express intent to cooperate”event; code 033 will be assigned to an “express intentto provide not specified material aid” event; and code0333 will be assigned to an “express intent to providehumanitarian aid” event. The additional digits specifysubcategories under a root event type. We extractedfrom GDELT counts of events that occurred in Egyptaggregated by the day and by root event type within thetime period from 12/01/2010 to 3/31/2011. We did thisby querying the database for all events tagged with anActionGeoCode of ”EG”, which is the Federal InformationProcessing Standard (FIPS) code for Egypt. This processis automated by the R package GDELTtools. Note thatthe daily event counts are not directly used as predictorvalues for the baseline models; we will discuss baselinemodel feature design in Section 7.
5 FEATURE DESIGNIn this section, we present the design of features thatcapture the protest participation hypotheses laid out
in Section 3. We also explain how these features aremeasured using the Twitter data described in Section4.2.1. Table 3 lists the theoretical variables and associ-ated predictors derived from our Twitter data. In thefollowing paragraphs we will describe the four groupsof features in detail.
First, we used the volume of user mentions that targetpopular news media Twitter accounts to approximatethe collective level of political knowledge among Cairousers. On Twitter, user mentions are used to retweet orreply to another user’s tweets, or to engage another userin a conversation. We observed that the vast majority oftweets @-mentioning a news media account are retweetsof news posted by said news media account (e.g., ”RT@AJEnglish: Egypt’s protest dispersed by force: Armyuses batons to break up demonstrations in Cairo de-manding purging of Mu... http: ...” 7); while the rest aretweets discussing about the @-mentioned news media(e.g., ”@AJEnglish You really have the corrupt #Egyptiangovernment running scared. BRAVO! If only more newssources were as good as you. #Jan25” 8). Traditionally,political knowledge is measured by, for example, ask-ing individuals whether they read a daily news article[16]. We broaden this notion to encompass all access toinformation sources that frequently disseminate politicalstories. We reason that @-mentioning the Twitter accountof popular news agencies is an online analog of accessinga traditional newspaper, since the user’s @-mention waslikely precipitated by content distributed by the newagency.
Second, one’s interest in politics is reflected by theextent to which one engages in political discussions.Although an interest in politics does not necessarily gen-erate political discussion, the volume of political tweetsone creates might proxy for the user’s level of politicalinterest. Therefore, we approximated the collective level
7. http://twitter.com/HassanAbdelRaz/statuses/41367589640871936
8. http://twitter.com/lollybrubs/statuses/33213052178403329
Page 6 of 16IEEE Transactions on Computational Social Systems
For Review O
nly
7
of political interest on each day by measuring the volumeof political tweets created by Cairo users on that day. Wewill explain the selection of political tweets later in thissection.
Third, we observe that protest advertisements andexhortations to participate often contain basic informa-tion about an upcoming protest event and the mentionof a future day. The volume of such tweets indicatesawareness and social pressure to engage in an upcomingprotest.
Last, we choose to map the notion “ties in an activistnetwork” to the volume of @-mentions that target salientpolitical activists on Twitter. The @-mention is a primarymeans whereby users interact with each other; thereforethe frequency of @-mentioning a political activist repre-sents the degree of affiliation. Note that so far we haveused the word “volume” to describe quantity (e.g., thevolume of @-mentioning certain users); concretely, thisquantity could be represented by both the number oftweets and the number of users that satisfy a constraint(e.g., the number of tweets @-mentioning certain usersvs. the number of users that have created tweets @-mentioning certain users). We did not have reasons tochoose one over the other so we simply create bothas measurements of the same concept and leave theselection to up to the statistical models (described later).
To measure the predictors described above, there areseveral tasks that need to be accomplished. The firstone is selecting political tweets. The collection of Cairopolitical tweets and its associated user information is thebasis of all other features’ measurement. Our identifi-cation of popular news media, salient political activistsare based on the activity of the users who created po-litical tweets. We call these users political Twitter users.To select political tweets, we adopt a keyword matchmethod with query expansion. Since we do not knowexactly how to characterize Cairo users’ online politi-cal speech, we begin with a list of four terms, jan259,tahrir10, mubarak11, amndawla12, which are the four mostfrequently used hashtags of clear political nature for theEgyptian protests. We first fetch the tweets containingthese four hashtags. Then, we aggregate the fetchedtweets by the day, build a corpus of 121 daily con-catenated tweet documents, calculate the average termfrequency inverse document frequency (TF-IDF) scorefor every word seen in the corpus, and rank them indescending order. As expected, most of the top rankingwords, both in English and Arabic, are related to politics.From the top ranking 300 words in the list, we manuallyselect the words that represent (1) entities of politicalnature, such as revolution, government, and vote; (2)
9. January 25th, 2011, the official beginning date of Egyptian Revo-lution of 2011
10. Tahrir Square, a major public town square in Downtown Cairothat has been the location and focus for political demonstrations inCairo
11. Hosni Mubarak, the then-president of Egypt in 2011 Spring12. The Egyptian State Security Investigations Service, which used
to be the highest national internal security authority of Egypt
names of important political actors, such as suleimanand ghonim; (3) dates and locations of revolutionaryevents, such as tahrir, jan25, and feb17; and (4) politicalslogans, such as newegypt and freeegypt. Note thatamong these political words, there are some Englishwords and Arabic words that actually share the samemeaning; for those words that are only in one language(English or Arabic), we obtain the translation (whenapplicable) in the other language using Google Translateand add the translated words to the list. In this way, wecurated a list of 67 query terms (see Table 5). We used thislist of query terms to select political tweets from our fullcollection of tweets, producing 946,988 Cairo politicaltweets (roughly 26% of all Cairo tweets). We selectedCairo tweets that contain at least one of the query termswhen not used as a username being @-mentioned (e.g.,“@ghonim” is not considered as containing the queryterm “ghonim”). With these political tweets, we candirectly measure all predictors described above.
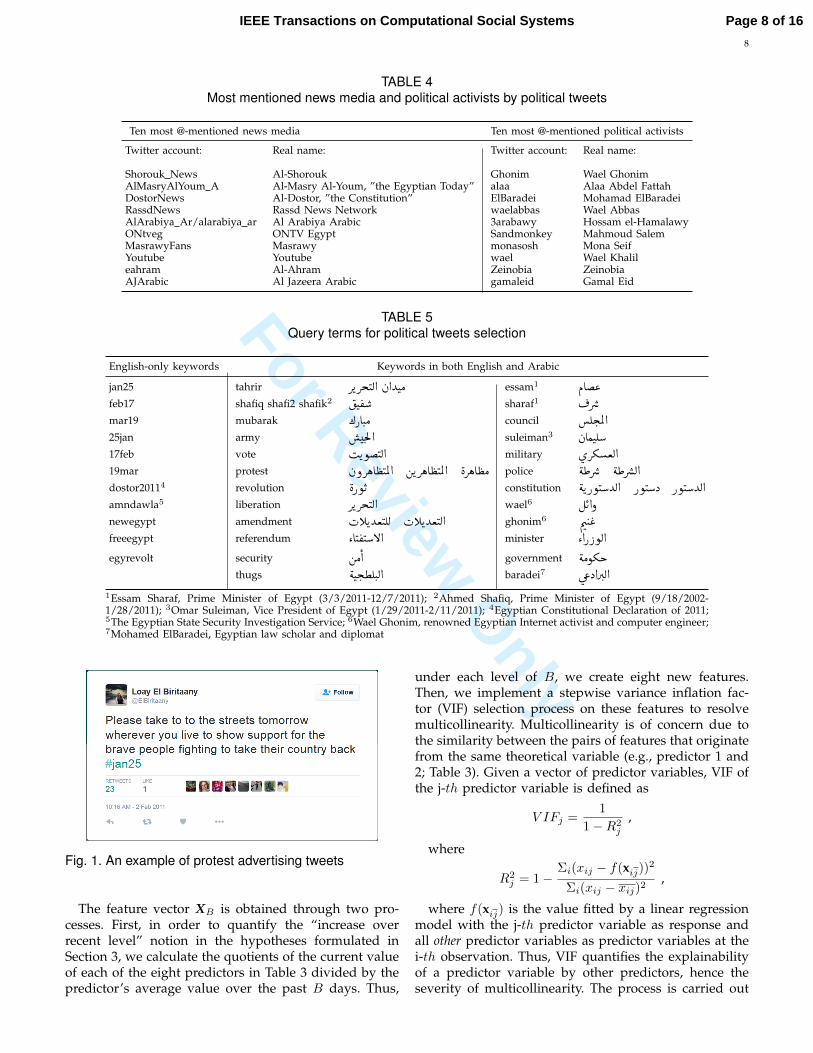
To measure the daily volume of @-mentioning popularnews media (predictors 1 and 2) and @-mentioningsalient political activists (predictors 6 and 7), we need todetermine the most important news media and politicalactivists during the revolution. To this end, we extracteda list of all @-mentioning instances from the collectionof Cairo political tweets. Then we aggregated the list bythe mentioned user and sorted it in descending order ofthe number of times (i.e., tweets) a user gets mentioned.From the highest ranking user down, we examined everyuser’s profile on Twitter and manually identified the 10most mentioned news media accounts and the 10 mostmentioned political activist accounts, shown in Table 4.Tweets that @-mentioned these news media and politicalactivists accounts will be used to measure predictors 1,2, 6, and 7.
To measure the number of tweets that present futureprotest information (predictor 5) we adopt a simple key-word matching method. From Cairo political tweets wefetch those that simultaneously contain protest relatedwords and future-oriented words and measure theirdaily volume. We used the following English wordsrelated to protests: tahrir, marching, demonstration, protestand their Arabic counterparts as well as the Englishphrase to the streets. Future-oriented words are Englishand Arabic words and phrases for (1) tomorrow, and (2)combination of this or next with any one of the days ofthe week (e.g., this Friday, next Tuesday, etc.). Figure 1shows an example of these protest advertising tweets.
6 HYPOTHESIS TESTING
To test hypotheses H1-H4, for a given day, we model theprobability of a protest onset happening in Cairo withinthe next H days (denoted as OH , H ∈ {1, 2, 3}) given thefeature vector XB (B ∈ {1, 2, 3}) as
Pr(OH |XB) = fH(XB) =
1
1 + exp[−(β0 + βT XB)].
Page 7 of 16 IEEE Transactions on Computational Social Systems
For Review O
nly
8
TABLE 4Most mentioned news media and political activists by political tweets
Ten most @-mentioned news media Ten most @-mentioned political activists
Twitter account: Real name: Twitter account: Real name:
Shorouk News Al-Shorouk Ghonim Wael GhonimAlMasryAlYoum A Al-Masry Al-Youm, ”the Egyptian Today” alaa Alaa Abdel FattahDostorNews Al-Dostor, ”the Constitution” ElBaradei Mohamad ElBaradeiRassdNews Rassd News Network waelabbas Wael AbbasAlArabiya Ar/alarabiya ar Al Arabiya Arabic 3arabawy Hossam el-HamalawyONtveg ONTV Egypt Sandmonkey Mahmoud SalemMasrawyFans Masrawy monasosh Mona SeifYoutube Youtube wael Wael Khalileahram Al-Ahram Zeinobia ZeinobiaAJArabic Al Jazeera Arabic gamaleid Gamal Eid
TABLE 5Query terms for political tweets selection
English-only keywords Keywords in both English and Arabic
jan25 tahrir QKQj�JË @
à@YJÓ essam1 ÐA�«
feb17 shafiq shafi2 shafik2 ��J
®
�� sharaf1
¬Qå
��
mar19 mubarak ¼PAJ.Ó council �Êj. ÖÏ @
25jan army ���m.
Ì'@ suleiman3 àAÒJÊ�
17feb vote �IKñ�
�JË @ military ø
Qº�ªË@
19mar protest àðQëA
¢
�JÖÏ @ ' áKQëA
¢
�JÖÏ @ '
�èQëA
¢Ó police �
é£Qå�� '
�é£Qå
��Ë @
dostor20114 revolution �èPñ
�K constitution �
éKPñ�J�YË@ ' Pñ
�J�X ' Pñ
�J�YË@
amndawla5 liberation QKQj�JË @ wael6 É
K@ð
newegypt amendment �HCKYª
�JÊË '
�HCKYª
�JË @ ghonim6 Õæ
J
«
freeegypt referendum ZA�J®�J�B@ minister Z @P PñË@
egyrevolt security áÓ @ government �
éÓñºk
thugs �éJj. ¢ÊJ. Ë @ baradei7 ú
«X@Q�. Ë @
1Essam Sharaf, Prime Minister of Egypt (3/3/2011-12/7/2011); 2Ahmed Shafiq, Prime Minister of Egypt (9/18/2002-1/28/2011); 3Omar Suleiman, Vice President of Egypt (1/29/2011-2/11/2011); 4Egyptian Constitutional Declaration of 2011;5The Egyptian State Security Investigation Service; 6Wael Ghonim, renowned Egyptian Internet activist and computer engineer;7Mohamed ElBaradei, Egyptian law scholar and diplomat
Fig. 1. An example of protest advertising tweets
The feature vector XB is obtained through two pro-cesses. First, in order to quantify the “increase overrecent level” notion in the hypotheses formulated inSection 3, we calculate the quotients of the current valueof each of the eight predictors in Table 3 divided by thepredictor’s average value over the past B days. Thus,
under each level of B, we create eight new features.Then, we implement a stepwise variance inflation fac-tor (VIF) selection process on these features to resolvemulticollinearity. Multicollinearity is of concern due tothe similarity between the pairs of features that originatefrom the same theoretical variable (e.g., predictor 1 and2; Table 3). Given a vector of predictor variables, VIF ofthe j-th predictor variable is defined as
V IFj =1
1−R2j
,
where
R2j = 1−
Σi(xij − f(xij))2
Σi(xij − xij)2,
where f(xij) is the value fitted by a linear regressionmodel with the j-th predictor variable as response andall other predictor variables as predictor variables at thei-th observation. Thus, VIF quantifies the explainabilityof a predictor variable by other predictors, hence theseverity of multicollinearity. The process is carried out
Page 8 of 16IEEE Transactions on Computational Social Systems
For Review O
nly
9
as follows: for each feature created in the first process,(1) we calculate VIF and discard the feature with thehighest VIF; (2) calculate VIF for the remaining featuresagain and discard the feature with the highest VIF; (3)repeat (1) and (2) until all existing features have a VIF 65, a conventional cutoff. As a result of the two processes,we obtain a feature vector under each B ∈ {1, 2, 3}. Wedenote these feature vectors as XB . Variables that remainafter the stepwise VIF selection process are shown inTable 6.
TABLE 6Feature vectors XB after stepwise VIF selection
Features XB
B = 1 B = 2 B = 3
NumTweetsNews XNumUsersNewsNumTweetsPolitics X X XNumUsersPoliticsNumTweetsProtests X X XNumUsersProtests X X XNumTweetsActivists X XNumUsersActivists
Now that we have fH(XB) trained for each configu-ration of B and H , we use backward stepwise selection[38] to select the best features based on the Akaikeinformation criterion (AIC). The formula of AIC is
AIC = 2k − 2log(L) ,
where k is the number of parameters in the modeland L is the likelihood of each model given the observeddata. AIC rewards model likelihood and penalizes modelcomplexity to alleviate overfitting. A smaller AIC indi-cates a model of better quality.
We denote the feature vector selected by stepwiseregression under base period B and prediction horizonH as X’B,H and the corresponding logistic regressionmodel which models Pr(OH |X’B,H) as fH(X’B,H). Thevariables, coefficients and p-values in each fH(X’B,H) isshown in Table 7. Significant variables are shown in bolditalic.
Evidently, the number of tweets presenting futureprotest information (NumTweetsProtests) is the most sig-nificant positive factor, with its p-value smaller than0.05 under all configurations of H and B except whenH = B = 3. This means that an increase in the volume ofinformation about future protest events on social mediaoften accompanies increased chances of protest onsetwithin a few days. To give a numeric example, when a10% increase in the amount of protest advertising tweetsover the past three days (i.e., B = 3) is observed on a day,the odds of a protest onset happening in the next day(i.e., H = 1) increases by exp(0.1 ∗ 1.046) − 1 = 11.0%.This finding supports hypothesis H3: an increase overthe recent collective level of knowledge of a futureprotest is correlated with the occurrence of a protestonset in the near future. None of the other featuresproves significant at a confidence level of 0.95 in any
of the predicting schemes. As such, we do not haveevidence to support hypothesis H1, H2, and H4. The lackof evidence to support H1 is concert with the finding in[13] that using social media for news seeking purposes isnot significantly correlated with an individual’s decisionto protest. [13] also confirms that an individual whoexpresses political opinions on social media is morelikely to protest; however, an increased level of non-protest-specific political discussion on Twitter failed tosignificantly translate into offline protest onset in thenear future, as H2 is not supported.
7 PREDICTIVE MODELING
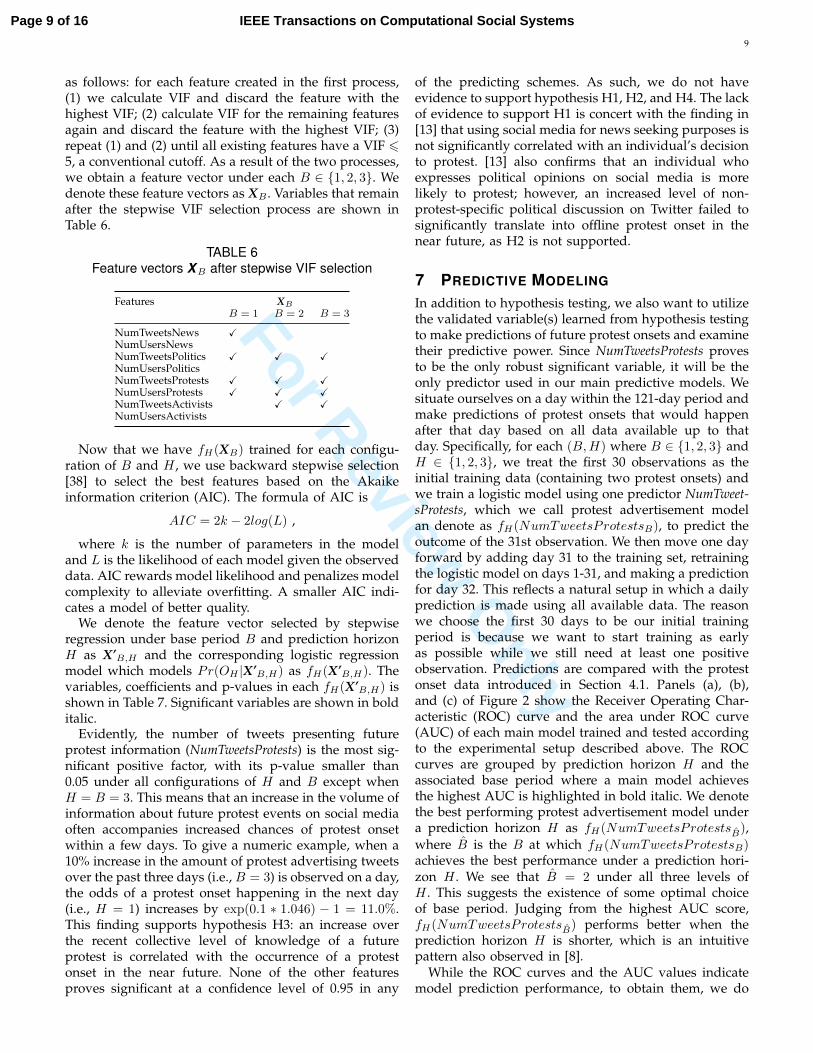
In addition to hypothesis testing, we also want to utilizethe validated variable(s) learned from hypothesis testingto make predictions of future protest onsets and examinetheir predictive power. Since NumTweetsProtests provesto be the only robust significant variable, it will be theonly predictor used in our main predictive models. Wesituate ourselves on a day within the 121-day period andmake predictions of protest onsets that would happenafter that day based on all data available up to thatday. Specifically, for each (B,H) where B ∈ {1, 2, 3} andH ∈ {1, 2, 3}, we treat the first 30 observations as theinitial training data (containing two protest onsets) andwe train a logistic model using one predictor NumTweet-sProtests, which we call protest advertisement modelan denote as fH(NumTweetsProtestsB), to predict theoutcome of the 31st observation. We then move one dayforward by adding day 31 to the training set, retrainingthe logistic model on days 1-31, and making a predictionfor day 32. This reflects a natural setup in which a dailyprediction is made using all available data. The reasonwe choose the first 30 days to be our initial trainingperiod is because we want to start training as earlyas possible while we still need at least one positiveobservation. Predictions are compared with the protestonset data introduced in Section 4.1. Panels (a), (b),and (c) of Figure 2 show the Receiver Operating Char-acteristic (ROC) curve and the area under ROC curve(AUC) of each main model trained and tested accordingto the experimental setup described above. The ROCcurves are grouped by prediction horizon H and theassociated base period where a main model achievesthe highest AUC is highlighted in bold italic. We denotethe best performing protest advertisement model undera prediction horizon H as fH(NumTweetsProtestsB̂),where B̂ is the B at which fH(NumTweetsProtestsB)achieves the best performance under a prediction hori-zon H . We see that B̂ = 2 under all three levels ofH . This suggests the existence of some optimal choiceof base period. Judging from the highest AUC score,fH(NumTweetsProtestsB̂) performs better when theprediction horizon H is shorter, which is an intuitivepattern also observed in [8].
While the ROC curves and the AUC values indicatemodel prediction performance, to obtain them, we do
Page 9 of 16 IEEE Transactions on Computational Social Systems
For Review O
nly
10
TABLE 7Variables in fH(X’B,H) under each configuration of base period and prediction horizon. Variables with a p-valuesmaller than 0.05 are shown in bold italic. Variable names are followed by their coefficient (β) and p-value (p)
Predicting horizon (days)H=1 H=2 H=3X’B,H β p X’B,H β p X’B,H β p
Baseperiod(days)
B=1 NumTweetsProtests 0.422 0.002* NumTweetsProtests 0.399 0.005* NumTweetsProtests 0.208 0.042*NumTweetsPolitics -4.76 0.107 NumTweetsPolitics -1.045 0.286NumTweetsNews 1.016 0.165
B=2 NumTweetsProtests 0.596 0.002* NumTweetsProtests 0.438 0.008* NumTweetsProtests 0.259 0.05*B=3 NumTweetsProtests 1.046 0.001* NumTweetsProtests 0.673 0.006* NumTweetsProtests 0.289 0.116
NumTweetsPolitics -3.415 0.099 NumTweetsPolitics -1.446 0.232NumUsersProtests -0.009 0.148 NumUsersProtests -0.008 0.294 NumUsersProtests -0.007 0.494
(a) Protest Advertisement models (b) Protest Advertisement models (c) Protest Advertisement models
(d) Best thresholds: 0.15-0.2 (e) Best threshold: 0.14 (f) Best threshold: 0.14
Fig. 2. ROC curves for the protest advertisement models (panels (a), (b), (c)) under each prediction horizon H ∈{1, 2, 3} and base period B ∈ {1, 2, 3}; the corresponding AUC values are shown in parentheses in the legend, withthe highest value shown in bold italic. Precision-recall trade-off plots for the best performing main models under eachH are shown in panels (d), (e), and (f).
not need to specify a decision threshold for the predictedprobabilities emitted by our main models; ROC curvesare plotted by traversing all decision thresholds rangingfrom 0 to 1 at a fine increment. However, deciding thedecision threshold is not a trivial problem when onewants to use a predicted probability to make a decision.To investigate this matter, we plotted in panels (d), (e),
and (f) of Figure 2 a precision-recall plot for our best per-forming main models under each prediction horizon H .These figures show the trade-off between the precisionand recall and find the best decision threshold for eachof our best performing main models. We define the bestthreshold as the decision threshold where the highestf1 score is achieved, where an f1 score is calculated
Page 10 of 16IEEE Transactions on Computational Social Systems
For Review O
nly
11
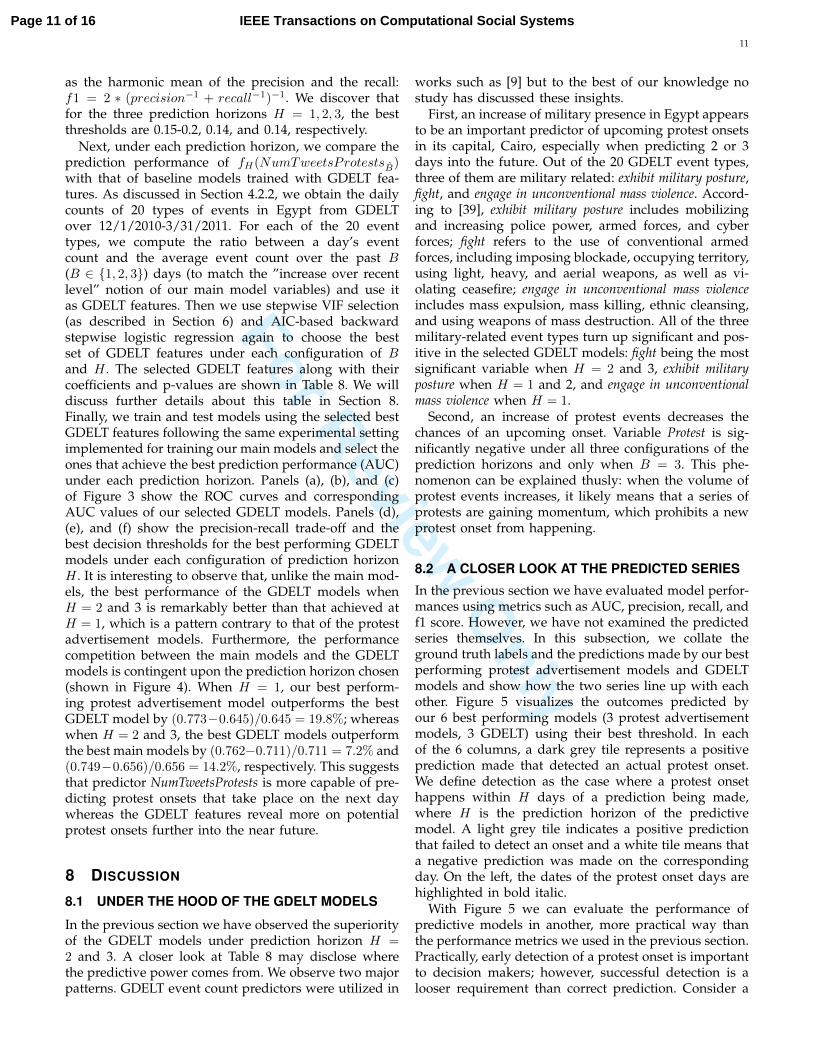
as the harmonic mean of the precision and the recall:f1 = 2 ∗ (precision−1 + recall−1)−1. We discover thatfor the three prediction horizons H = 1, 2, 3, the bestthresholds are 0.15-0.2, 0.14, and 0.14, respectively.
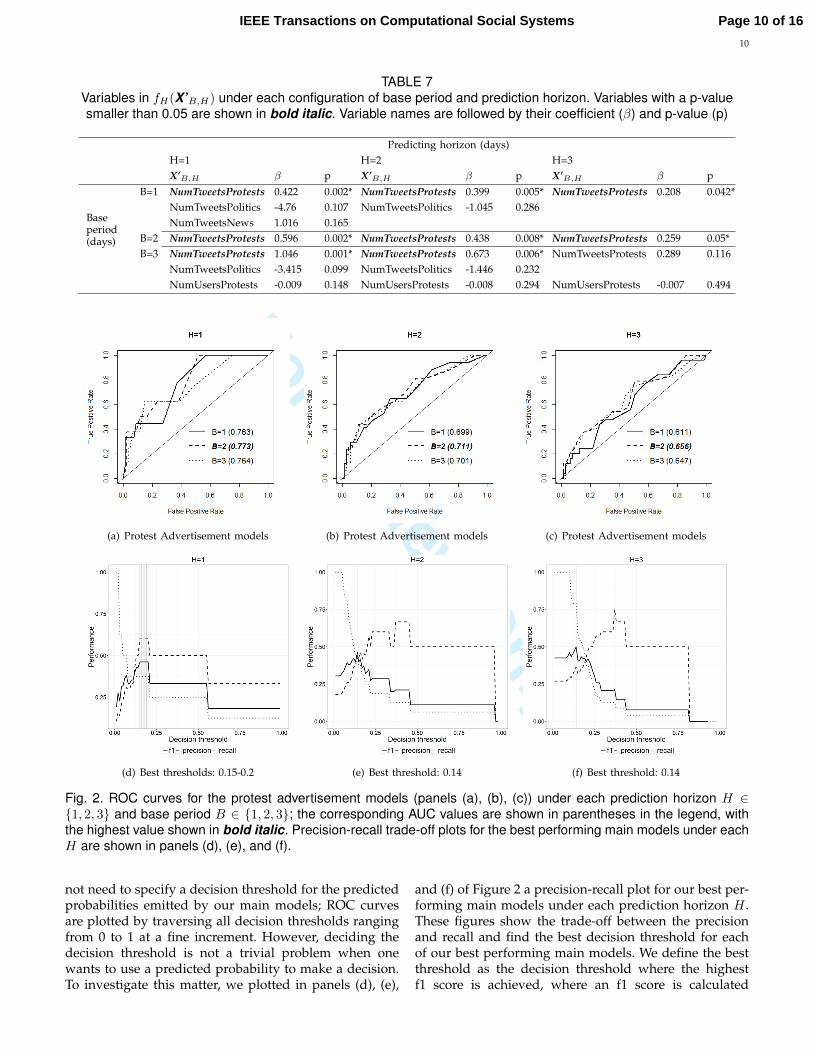
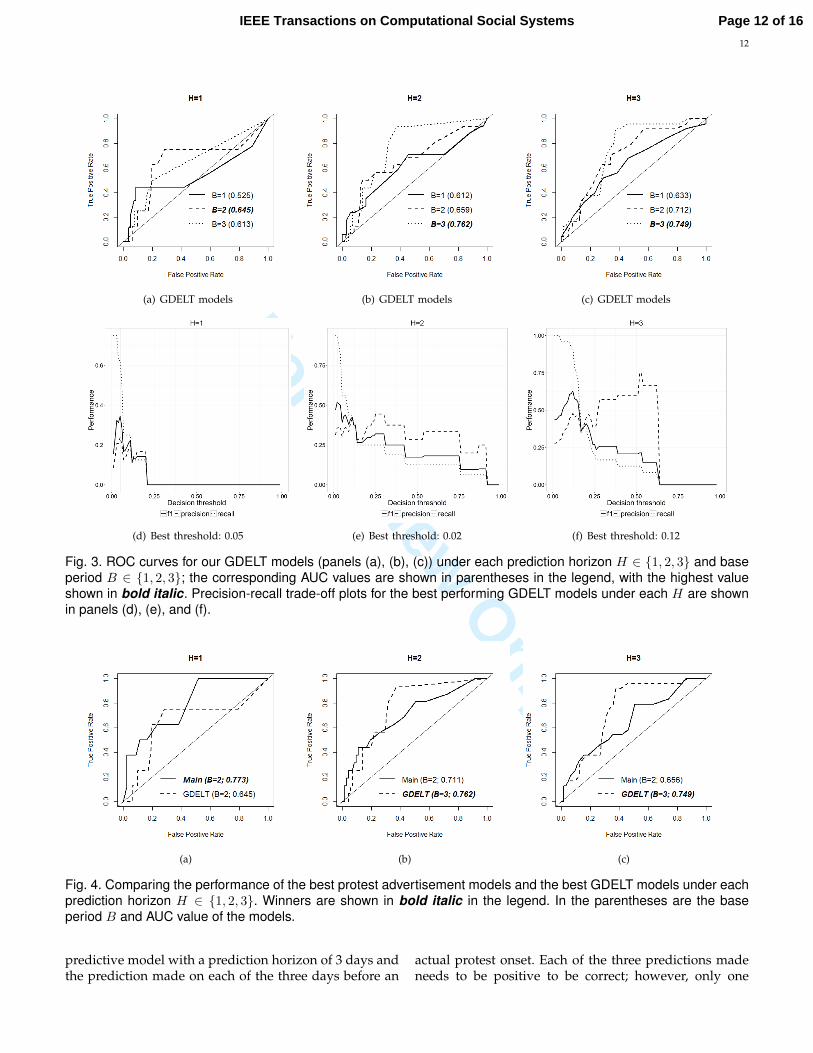
Next, under each prediction horizon, we compare theprediction performance of fH(NumTweetsProtestsB̂)with that of baseline models trained with GDELT fea-tures. As discussed in Section 4.2.2, we obtain the dailycounts of 20 types of events in Egypt from GDELTover 12/1/2010-3/31/2011. For each of the 20 eventtypes, we compute the ratio between a day’s eventcount and the average event count over the past B(B ∈ {1, 2, 3}) days (to match the ”increase over recentlevel” notion of our main model variables) and use itas GDELT features. Then we use stepwise VIF selection(as described in Section 6) and AIC-based backwardstepwise logistic regression again to choose the bestset of GDELT features under each configuration of Band H . The selected GDELT features along with theircoefficients and p-values are shown in Table 8. We willdiscuss further details about this table in Section 8.Finally, we train and test models using the selected bestGDELT features following the same experimental settingimplemented for training our main models and select theones that achieve the best prediction performance (AUC)under each prediction horizon. Panels (a), (b), and (c)of Figure 3 show the ROC curves and correspondingAUC values of our selected GDELT models. Panels (d),(e), and (f) show the precision-recall trade-off and thebest decision thresholds for the best performing GDELTmodels under each configuration of prediction horizonH . It is interesting to observe that, unlike the main mod-els, the best performance of the GDELT models whenH = 2 and 3 is remarkably better than that achieved atH = 1, which is a pattern contrary to that of the protestadvertisement models. Furthermore, the performancecompetition between the main models and the GDELTmodels is contingent upon the prediction horizon chosen(shown in Figure 4). When H = 1, our best perform-ing protest advertisement model outperforms the bestGDELT model by (0.773−0.645)/0.645 = 19.8%; whereaswhen H = 2 and 3, the best GDELT models outperformthe best main models by (0.762−0.711)/0.711 = 7.2% and(0.749−0.656)/0.656 = 14.2%, respectively. This suggeststhat predictor NumTweetsProtests is more capable of pre-dicting protest onsets that take place on the next daywhereas the GDELT features reveal more on potentialprotest onsets further into the near future.
8 DISCUSSION
8.1 UNDER THE HOOD OF THE GDELT MODELS
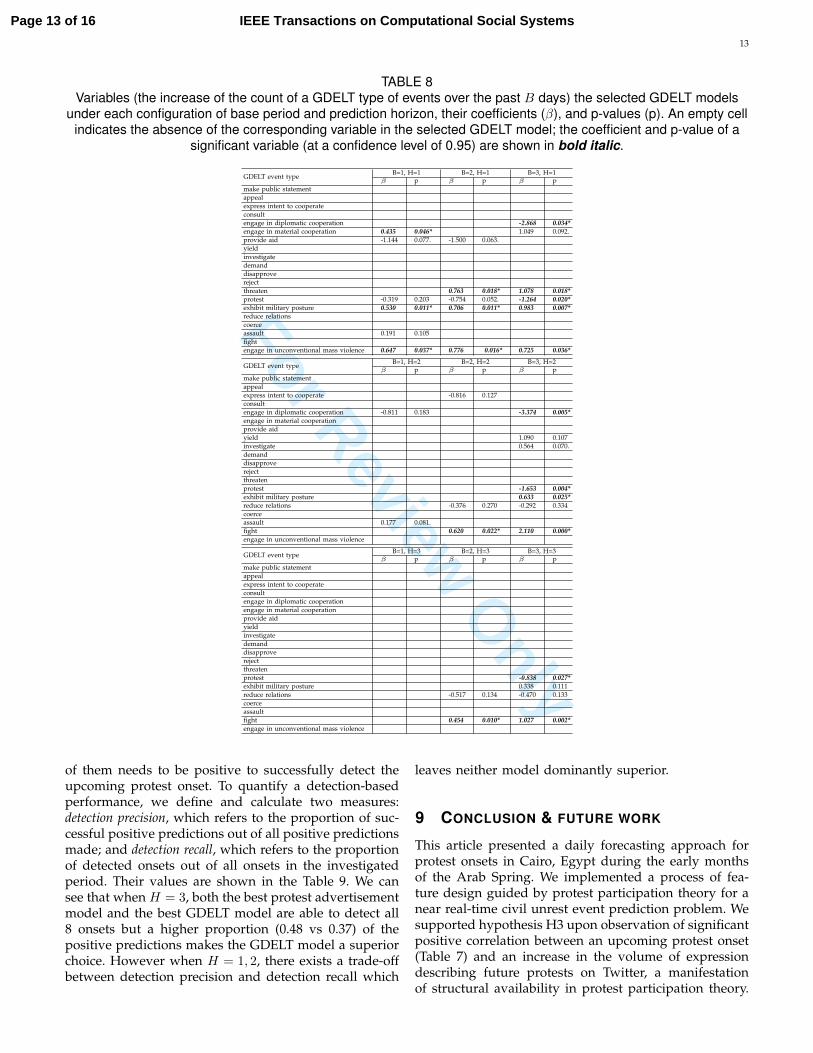
In the previous section we have observed the superiorityof the GDELT models under prediction horizon H =2 and 3. A closer look at Table 8 may disclose wherethe predictive power comes from. We observe two majorpatterns. GDELT event count predictors were utilized in
works such as [9] but to the best of our knowledge nostudy has discussed these insights.
First, an increase of military presence in Egypt appearsto be an important predictor of upcoming protest onsetsin its capital, Cairo, especially when predicting 2 or 3days into the future. Out of the 20 GDELT event types,three of them are military related: exhibit military posture,fight, and engage in unconventional mass violence. Accord-ing to [39], exhibit military posture includes mobilizingand increasing police power, armed forces, and cyberforces; fight refers to the use of conventional armedforces, including imposing blockade, occupying territory,using light, heavy, and aerial weapons, as well as vi-olating ceasefire; engage in unconventional mass violenceincludes mass expulsion, mass killing, ethnic cleansing,and using weapons of mass destruction. All of the threemilitary-related event types turn up significant and pos-itive in the selected GDELT models: fight being the mostsignificant variable when H = 2 and 3, exhibit militaryposture when H = 1 and 2, and engage in unconventionalmass violence when H = 1.
Second, an increase of protest events decreases thechances of an upcoming onset. Variable Protest is sig-nificantly negative under all three configurations of theprediction horizons and only when B = 3. This phe-nomenon can be explained thusly: when the volume ofprotest events increases, it likely means that a series ofprotests are gaining momentum, which prohibits a newprotest onset from happening.
8.2 A CLOSER LOOK AT THE PREDICTED SERIES
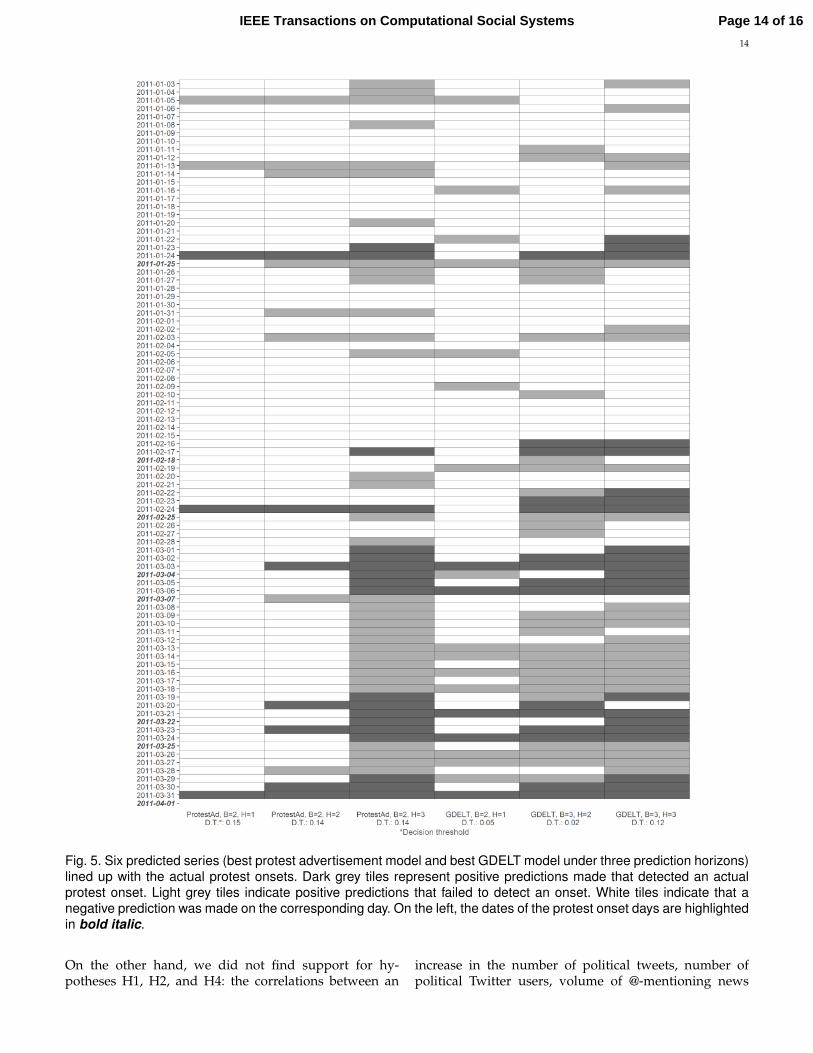
In the previous section we have evaluated model perfor-mances using metrics such as AUC, precision, recall, andf1 score. However, we have not examined the predictedseries themselves. In this subsection, we collate theground truth labels and the predictions made by our bestperforming protest advertisement models and GDELTmodels and show how the two series line up with eachother. Figure 5 visualizes the outcomes predicted byour 6 best performing models (3 protest advertisementmodels, 3 GDELT) using their best threshold. In eachof the 6 columns, a dark grey tile represents a positiveprediction made that detected an actual protest onset.We define detection as the case where a protest onsethappens within H days of a prediction being made,where H is the prediction horizon of the predictivemodel. A light grey tile indicates a positive predictionthat failed to detect an onset and a white tile means thata negative prediction was made on the correspondingday. On the left, the dates of the protest onset days arehighlighted in bold italic.
With Figure 5 we can evaluate the performance ofpredictive models in another, more practical way thanthe performance metrics we used in the previous section.Practically, early detection of a protest onset is importantto decision makers; however, successful detection is alooser requirement than correct prediction. Consider a
Page 11 of 16 IEEE Transactions on Computational Social Systems
For Review O
nly
12
(a) GDELT models (b) GDELT models (c) GDELT models
(d) Best threshold: 0.05 (e) Best threshold: 0.02 (f) Best threshold: 0.12
Fig. 3. ROC curves for our GDELT models (panels (a), (b), (c)) under each prediction horizon H ∈ {1, 2, 3} and baseperiod B ∈ {1, 2, 3}; the corresponding AUC values are shown in parentheses in the legend, with the highest valueshown in bold italic. Precision-recall trade-off plots for the best performing GDELT models under each H are shownin panels (d), (e), and (f).
(a) (b) (c)
Fig. 4. Comparing the performance of the best protest advertisement models and the best GDELT models under eachprediction horizon H ∈ {1, 2, 3}. Winners are shown in bold italic in the legend. In the parentheses are the baseperiod B and AUC value of the models.
predictive model with a prediction horizon of 3 days andthe prediction made on each of the three days before an
actual protest onset. Each of the three predictions madeneeds to be positive to be correct; however, only one
Page 12 of 16IEEE Transactions on Computational Social Systems
For Review O
nly
13
TABLE 8Variables (the increase of the count of a GDELT type of events over the past B days) the selected GDELT models
under each configuration of base period and prediction horizon, their coefficients (β), and p-values (p). An empty cellindicates the absence of the corresponding variable in the selected GDELT model; the coefficient and p-value of a
significant variable (at a confidence level of 0.95) are shown in bold italic.
GDELT event type B=1, H=1 B=2, H=1 B=3, H=1β p β p β p
make public statementappealexpress intent to cooperateconsultengage in diplomatic cooperation -2.868 0.034*engage in material cooperation 0.435 0.046* 1.049 0.092.provide aid -1.144 0.077. -1.500 0.063.yieldinvestigatedemanddisapproverejectthreaten 0.763 0.018* 1.078 0.018*protest -0.319 0.203 -0.754 0.052. -1.264 0.020*exhibit military posture 0.530 0.011* 0.706 0.011* 0.983 0.007*reduce relationscoerceassault 0.191 0.105fightengage in unconventional mass violence 0.647 0.037* 0.776 0.016* 0.725 0.036*
GDELT event type B=1, H=2 B=2, H=2 B=3, H=2β p β p β p
make public statementappealexpress intent to cooperate -0.816 0.127consultengage in diplomatic cooperation -0.811 0.183 -3.374 0.005*engage in material cooperationprovide aidyield 1.090 0.107investigate 0.564 0.070.demanddisapproverejectthreatenprotest -1.653 0.004*exhibit military posture 0.633 0.025*reduce relations -0.376 0.270 -0.292 0.334coerceassault 0.177 0.081.fight 0.620 0.022* 2.110 0.000*engage in unconventional mass violence
GDELT event type B=1, H=3 B=2, H=3 B=3, H=3β p β p β p
make public statementappealexpress intent to cooperateconsultengage in diplomatic cooperationengage in material cooperationprovide aidyieldinvestigatedemanddisapproverejectthreatenprotest -0.838 0.027*exhibit military posture 0.338 0.111reduce relations -0.517 0.134 -0.470 0.133coerceassaultfight 0.454 0.010* 1.027 0.002*engage in unconventional mass violence
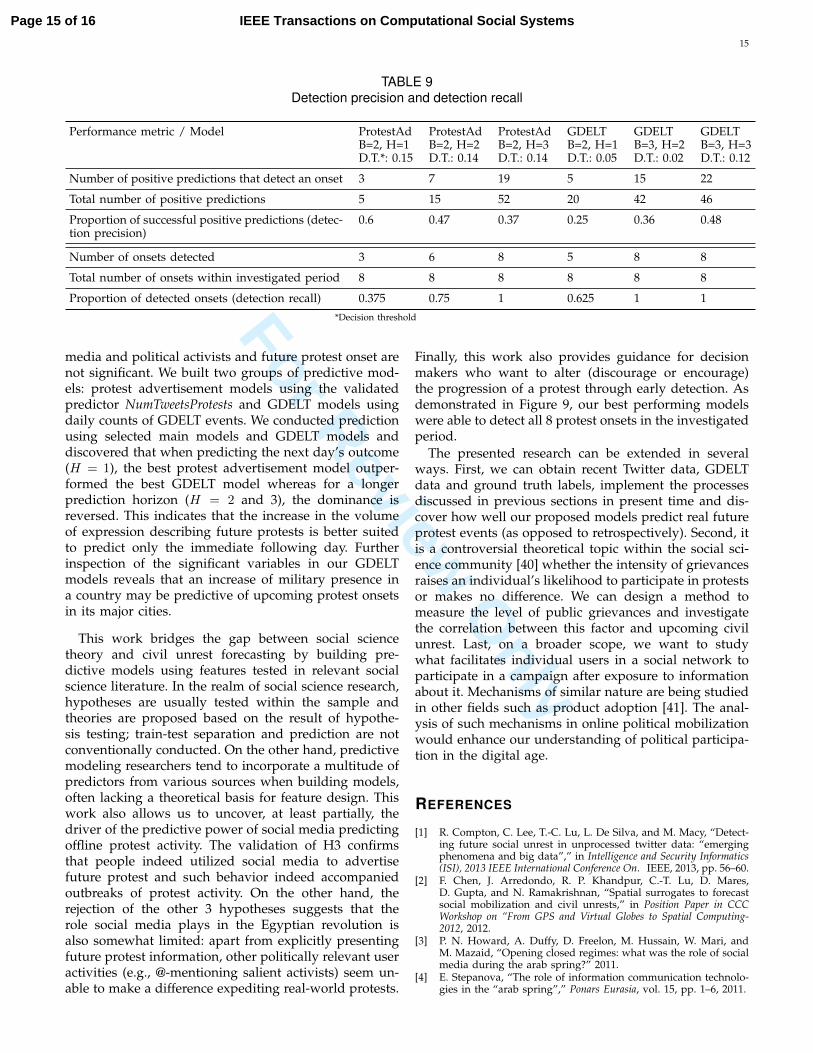
of them needs to be positive to successfully detect theupcoming protest onset. To quantify a detection-basedperformance, we define and calculate two measures:detection precision, which refers to the proportion of suc-cessful positive predictions out of all positive predictionsmade; and detection recall, which refers to the proportionof detected onsets out of all onsets in the investigatedperiod. Their values are shown in the Table 9. We cansee that when H = 3, both the best protest advertisementmodel and the best GDELT model are able to detect all8 onsets but a higher proportion (0.48 vs 0.37) of thepositive predictions makes the GDELT model a superiorchoice. However when H = 1, 2, there exists a trade-offbetween detection precision and detection recall which
leaves neither model dominantly superior.
9 CONCLUSION & FUTURE WORK
This article presented a daily forecasting approach forprotest onsets in Cairo, Egypt during the early monthsof the Arab Spring. We implemented a process of fea-ture design guided by protest participation theory for anear real-time civil unrest event prediction problem. Wesupported hypothesis H3 upon observation of significantpositive correlation between an upcoming protest onset(Table 7) and an increase in the volume of expressiondescribing future protests on Twitter, a manifestationof structural availability in protest participation theory.
Page 13 of 16 IEEE Transactions on Computational Social Systems
For Review O
nly
14
Fig. 5. Six predicted series (best protest advertisement model and best GDELT model under three prediction horizons)lined up with the actual protest onsets. Dark grey tiles represent positive predictions made that detected an actualprotest onset. Light grey tiles indicate positive predictions that failed to detect an onset. White tiles indicate that anegative prediction was made on the corresponding day. On the left, the dates of the protest onset days are highlightedin bold italic.
On the other hand, we did not find support for hy-potheses H1, H2, and H4: the correlations between an
increase in the number of political tweets, number ofpolitical Twitter users, volume of @-mentioning news
Page 14 of 16IEEE Transactions on Computational Social Systems
For Review O
nly
15
TABLE 9Detection precision and detection recall
Performance metric / Model ProtestAd ProtestAd ProtestAd GDELT GDELT GDELTB=2, H=1 B=2, H=2 B=2, H=3 B=2, H=1 B=3, H=2 B=3, H=3D.T.*: 0.15 D.T.: 0.14 D.T.: 0.14 D.T.: 0.05 D.T.: 0.02 D.T.: 0.12
Number of positive predictions that detect an onset 3 7 19 5 15 22
Total number of positive predictions 5 15 52 20 42 46
Proportion of successful positive predictions (detec-tion precision)
0.6 0.47 0.37 0.25 0.36 0.48
Number of onsets detected 3 6 8 5 8 8
Total number of onsets within investigated period 8 8 8 8 8 8
Proportion of detected onsets (detection recall) 0.375 0.75 1 0.625 1 1*Decision threshold
media and political activists and future protest onset arenot significant. We built two groups of predictive mod-els: protest advertisement models using the validatedpredictor NumTweetsProtests and GDELT models usingdaily counts of GDELT events. We conducted predictionusing selected main models and GDELT models anddiscovered that when predicting the next day’s outcome(H = 1), the best protest advertisement model outper-formed the best GDELT model whereas for a longerprediction horizon (H = 2 and 3), the dominance isreversed. This indicates that the increase in the volumeof expression describing future protests is better suitedto predict only the immediate following day. Furtherinspection of the significant variables in our GDELTmodels reveals that an increase of military presence ina country may be predictive of upcoming protest onsetsin its major cities.
This work bridges the gap between social sciencetheory and civil unrest forecasting by building pre-dictive models using features tested in relevant socialscience literature. In the realm of social science research,hypotheses are usually tested within the sample andtheories are proposed based on the result of hypothe-sis testing; train-test separation and prediction are notconventionally conducted. On the other hand, predictivemodeling researchers tend to incorporate a multitude ofpredictors from various sources when building models,often lacking a theoretical basis for feature design. Thiswork also allows us to uncover, at least partially, thedriver of the predictive power of social media predictingoffline protest activity. The validation of H3 confirmsthat people indeed utilized social media to advertisefuture protest and such behavior indeed accompaniedoutbreaks of protest activity. On the other hand, therejection of the other 3 hypotheses suggests that therole social media plays in the Egyptian revolution isalso somewhat limited: apart from explicitly presentingfuture protest information, other politically relevant useractivities (e.g., @-mentioning salient activists) seem un-able to make a difference expediting real-world protests.
Finally, this work also provides guidance for decisionmakers who want to alter (discourage or encourage)the progression of a protest through early detection. Asdemonstrated in Figure 9, our best performing modelswere able to detect all 8 protest onsets in the investigatedperiod.
The presented research can be extended in severalways. First, we can obtain recent Twitter data, GDELTdata and ground truth labels, implement the processesdiscussed in previous sections in present time and dis-cover how well our proposed models predict real futureprotest events (as opposed to retrospectively). Second, itis a controversial theoretical topic within the social sci-ence community [40] whether the intensity of grievancesraises an individual’s likelihood to participate in protestsor makes no difference. We can design a method tomeasure the level of public grievances and investigatethe correlation between this factor and upcoming civilunrest. Last, on a broader scope, we want to studywhat facilitates individual users in a social network toparticipate in a campaign after exposure to informationabout it. Mechanisms of similar nature are being studiedin other fields such as product adoption [41]. The anal-ysis of such mechanisms in online political mobilizationwould enhance our understanding of political participa-tion in the digital age.
REFERENCES
[1] R. Compton, C. Lee, T.-C. Lu, L. De Silva, and M. Macy, “Detect-ing future social unrest in unprocessed twitter data: “emergingphenomena and big data”,” in Intelligence and Security Informatics(ISI), 2013 IEEE International Conference On. IEEE, 2013, pp. 56–60.
[2] F. Chen, J. Arredondo, R. P. Khandpur, C.-T. Lu, D. Mares,D. Gupta, and N. Ramakrishnan, “Spatial surrogates to forecastsocial mobilization and civil unrests,” in Position Paper in CCCWorkshop on “From GPS and Virtual Globes to Spatial Computing-2012, 2012.
[3] P. N. Howard, A. Duffy, D. Freelon, M. Hussain, W. Mari, andM. Mazaid, “Opening closed regimes: what was the role of socialmedia during the arab spring?” 2011.
[4] E. Stepanova, “The role of information communication technolo-gies in the “arab spring”,” Ponars Eurasia, vol. 15, pp. 1–6, 2011.
Page 15 of 16 IEEE Transactions on Computational Social Systems
For Review O
nly
16
[5] G. Lotan, E. Graeff, M. Ananny, D. Gaffney, I. Pearce et al., “Thearab spring— the revolutions were tweeted: Information flowsduring the 2011 tunisian and egyptian revolutions,” Internationaljournal of communication, vol. 5, p. 31, 2011.
[6] M. Aouragh and A. Alexander, “The arab spring— the egyptianexperience: Sense and nonsense of the internet revolution,” Inter-national Journal of Communication, vol. 5, p. 15, 2011.
[7] Z. C. Steinert-Threlkeld, D. Mocanu, A. Vespignani, and J. Fowler,“Online social networks and offline protest,” EPJ Data Science,vol. 4, no. 1, pp. 1–9, 2015.
[8] N. Kallus, “Predicting crowd behavior with big public data,”in Proceedings of the companion publication of the 23rd internationalconference on World wide web companion. International World WideWeb Conferences Steering Committee, 2014, pp. 625–630.
[9] N. Ramakrishnan, P. Butler, S. Muthiah, N. Self, R. Khandpur,P. Saraf, W. Wang, J. Cadena, A. Vullikanti, G. Korkmaz et al.,“’beating the news’ with embers: forecasting civil unrest usingopen source indicators,” in Proceedings of the 20th ACM SIGKDDinternational conference on Knowledge discovery and data mining.ACM, 2014, pp. 1799–1808.
[10] B. Boecking, M. Hall, and J. Schneider, “Predicting events sur-rounding the egyptian revolution of 2011 using learning algo-rithms on micro blog data.”
[11] M. T. Bastos, D. Mercea, and A. Charpentier, “Tents, tweets,and events: The interplay between ongoing protests and socialmedia,” Journal of Communication, vol. 65, no. 2, pp. 320–350, 2015.
[12] H. S. Christensen, “Political activities on the internet: Slacktivismor political participation by other means?” First Monday, vol. 16,no. 2, 2011.
[13] S. Valenzuela, “Unpacking the use of social media for protest be-havior the roles of information, opinion expression, and activism,”American Behavioral Scientist, vol. 57, no. 7, pp. 920–942, 2013.
[14] M. Conroy, J. T. Feezell, and M. Guerrero, “Facebook and polit-ical engagement: A study of online political group membershipand offline political engagement,” Computers in Human Behavior,vol. 28, no. 5, pp. 1535–1546, 2012.
[15] S. Verba, K. L. Schlozman, H. E. Brady, and H. E. Brady, Voice andequality: Civic voluntarism in American politics. Cambridge UnivPress, 1995, vol. 4.
[16] A. Schussman and S. A. Soule, “Process and protest: Accountingfor individual protest participation,” Social forces, vol. 84, no. 2,pp. 1083–1108, 2005.
[17] K. Leetaru and P. A. Schrodt, “Gdelt: Global data on events,location, and tone, 1979–2012,” in ISA Annual Convention, vol. 2,2013, p. 4.
[18] P. A. Schrodt, “Forecasting conflict in the balkans using hiddenmarkov models,” in Programming for Peace. Springer, 2006, pp.161–184.
[19] P. T. Brandt, J. R. Freeman, and P. A. Schrodt, “Real time, timeseries forecasting of inter-and intra-state political conflict,” ConflictManagement and Peace Science, vol. 28, no. 1, pp. 41–64, 2011.
[20] J. A. Goldstone, R. H. Bates, D. L. Epstein, T. R. Gurr, M. B. Lustik,M. G. Marshall, J. Ulfelder, and M. Woodward, “A global modelfor forecasting political instability,” American Journal of PoliticalScience, vol. 54, no. 1, pp. 190–208, 2010.
[21] M. D. Ward, N. W. Metternich, C. L. Dorff, M. Gallop, F. M.Hollenbach, A. Schultz, and S. Weschle, “Learning from the pastand stepping into the future: Toward a new generation of conflictprediction,” International Studies Review, vol. 15, no. 4, pp. 473–490,2013.
[22] I. Lustick, “Ps-i: A user-friendly agent-based modeling platformfor testing theories of political identity and political stability,”Journal of Artificial Societies and Social Simulation, vol. 5, no. 3, 2002.
[23] K. Marx and F. Engels, The communist manifesto. Penguin, 2002.[24] A. De Tocqueville, The Old Regime and the Revolution, Volume II:
Notes on the French Revolution and Napoleon. University of ChicagoPress, 2001, vol. 2.
[25] J. C. Davies, “Toward a theory of revolution,” American sociologicalreview, pp. 5–19, 1962.
[26] D. McAdam, Political process and the development of black insurgency,1930-1970. University of Chicago Press, 2010.
[27] J. D. McCarthy and M. N. Zald, “Resource mobilization and socialmovements: A partial theory,” American journal of sociology, pp.1212–1241, 1977.
[28] J. Van Laer, “Why people protest,” PhD Universiteit Antwerpen,2011.
[29] C. McClelland, “World event/interaction survey, 1966-1978,” AnnArbor, MI: Inter-University Consortium for Political and Social Re-search, 1999.
[30] D. J. Gerner, P. A. Schrodt, O. Yilmaz, and R. Abu-Jabr, “Conflictand mediation event observations (cameo): A new event dataframework for the analysis of foreign policy interactions,” Inter-national Studies Association, New Orleans, 2002.
[31] C. McClelland, “World event/interaction survey,” DTIC Docu-ment, Tech. Rep., 1971.
[32] E. E. Azar, “The conflict and peace data bank (copdab) project,”Journal of Conflict Resolution, vol. 24, no. 1, pp. 143–152, 1980.
[33] C. Raleigh, A. Linke, H. Hegre, and J. Karlsen, “Introducing acled:An armed conflict location and event dataset special data feature,”Journal of peace Research, vol. 47, no. 5, pp. 651–660, 2010.
[34] I. Salehyan, C. S. Hendrix, J. Hamner, C. Case, C. Linebarger,E. Stull, and J. Williams, “Social conflict in africa: A newdatabase,” International Interactions, vol. 38, no. 4, pp. 503–511,2012.
[35] P. A. Schrodt, “Tabari: Textual analysis by augmented replacementinstructions,” Dept. of Political Science, University of Kansas, BlakeHall, Version 0.7. 3B3, pp. 1–137, 2009.
[36] J. E. Yonamine, “Predicting future levels of violence in afghanistandistricts using gdelt,” Unpublished Manuscript, 2013.
[37] N. Eltantawy and J. B. Wiest, “The arab spring— social mediain the egyptian revolution: Reconsidering resource mobilizationtheory,” International Journal of Communication, vol. 5, p. 18, 2011.
[38] T. Hastie, R. Tibshirani, J. Friedman, T. Hastie, J. Friedman, andR. Tibshirani, The elements of statistical learning. Springer, 2009,vol. 2, no. 1.
[39] P. A. Schrodt, “Cameo: Conflict and mediation event observationsevent and actor codebook,” Pennsylvania State University, 2012.
[40] K.-D. Opp, “Grievances and participation in social movements,”American sociological review, pp. 853–864, 1988.
[41] F. Zhou, J. R. Jiao, and B. Lei, “A linear threshold-hurdle modelfor product adoption prediction incorporating social networkeffects,” Information Sciences, vol. 307, pp. 95–109, 2015.
Congyu Wu Biography text here.
Matthew S. Gerber Biography text here.
Page 16 of 16IEEE Transactions on Computational Social Systems